planning team - arkansas
TRANSCRIPT

1

2
Planning Team
Arkansas Natural Resources Commission
WELCOME
Comprehensive Update of the Arkansas Water Plan

3
Wednesday June 5, 2013
AR Game & Fish Commission
Arkansas Natural Resources Commission
Public Information & Stakeholder Involvement Meeting #2
Comprehensive Update of the Arkansas Water Plan
4
Today’s Meeting
Arkansas Natural Resources Commission
Status of AR Water Plan Update
Answer questions
Discuss concerns
5
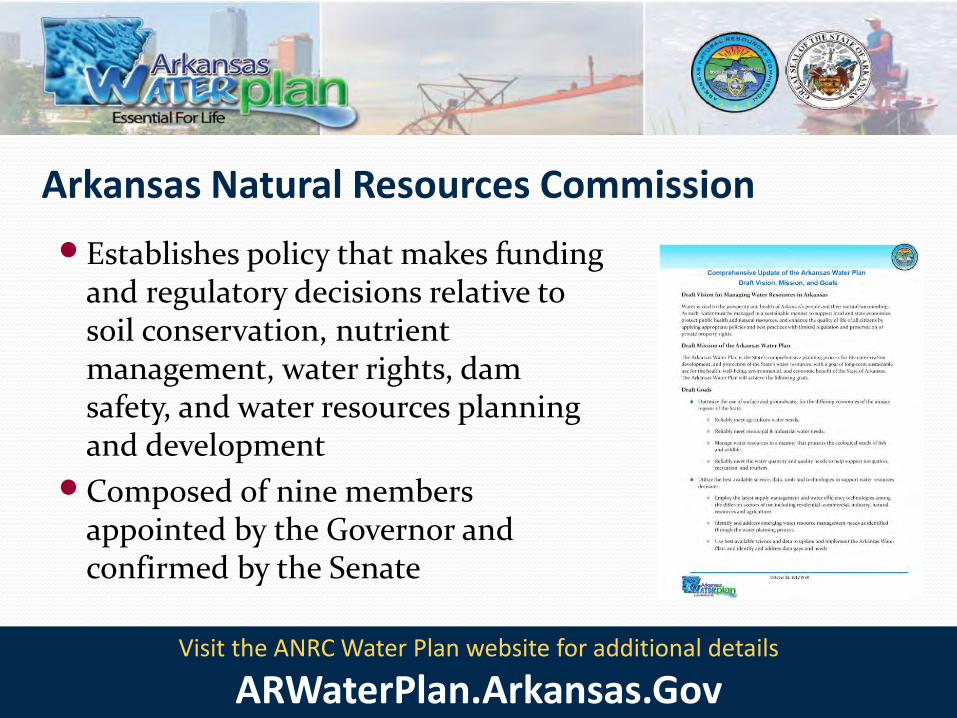
Establishes policy that makes funding and regulatory decisions relative to soil conservation, nutrient management, water rights, dam safety, and water resources planning and development
Composed of nine members appointed by the Governor and confirmed by the Senate
Arkansas Natural Resources Commission
Visit the ANRC Water Plan website for additional details
ARWaterPlan.Arkansas.Gov

Existing State Water Plan, State, Local, and Federal Statutes/Laws
Existing Policies and Programs
Existing- New Data & Forecasted Needs
Public & Stakeholder Input
Comprehensive Update to the Arkansas Water Plan
Updating the AR Water Plan
Building upon & improving existing programs
6 Arkansas Natural Resources Commission

Interactive Planning Process
Public Information and Stakeholder Involvement Meetings
Technical Work Groups
Provide input on planning approach & help ensure information is accurate
Advisory/Technical Committee
Helping shape the planning & stakeholder process
Involving our Citizens in the Water Plan Update
General Public Outreach
Regional Public Information and Stakeholder Involvement
Meetings
Technical Work Groups
Technical Advisory
Committee
ANRC 7 Arkansas Natural Resources Commission

Experts Volunteer and Contribute
8
Agriculture
Evan Teague
Randy Veach
Arkansas Farm
Bureau
Dennis Carman White River Irrigation
District
Andrew Grobmyer,
Executive Vice
President
Agricultural Council of
Arkansas
Charles Glover and
Andrew Wargo
Arkansas Association
of Conservation
Districts
Ben Noble Rice Federation
Adam McClung, Vice
President
Cattleman’s
Marvin Childers Poultry Federation
Agriculture
Dow Brantley Producer
Terry Dabbs Producer
David Gairhan Producer
Park Eldridge Lehman Elevator
Davis Bell Producer
Dr. Bert Greenwalt Arkansas State
University
Reed Cripps NRCS
Jamie Burr Tyson Poultry water
use
Cynthia Edwards,
Deputy Secretary of
Agriculture
Arkansas Department
of Agriculture
Chris Henry University of Arkansas
Rice Research Center
Becky Cross USDA – Ag Statistics
Arkansas Natural Resources Commission
9
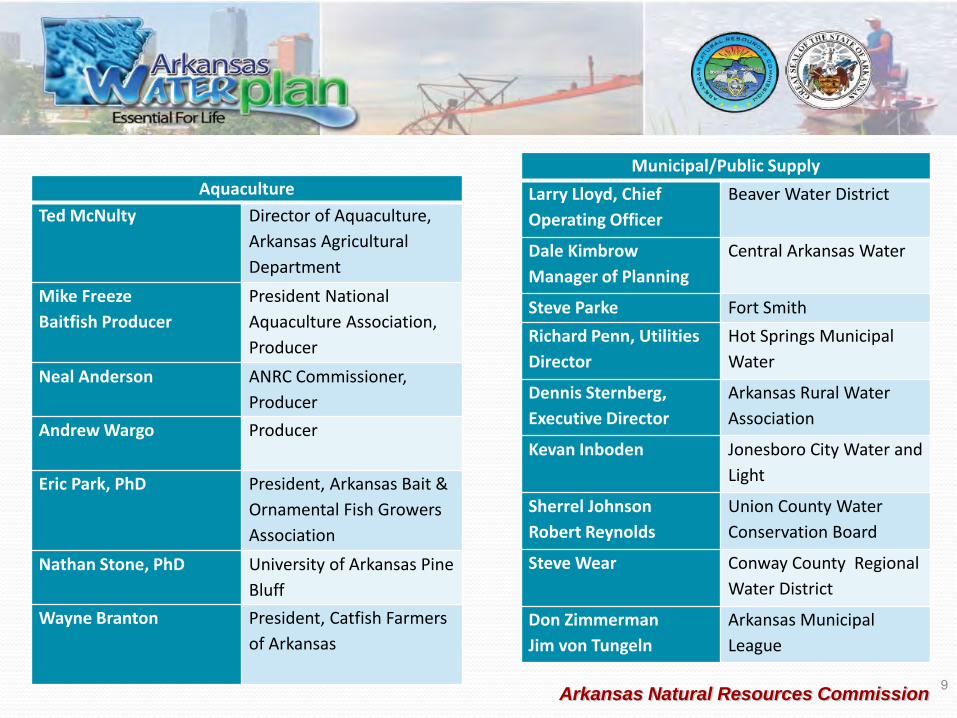
Aquaculture
Ted McNulty
Director of Aquaculture,
Arkansas Agricultural
Department
Mike Freeze
Baitfish Producer
President National
Aquaculture Association,
Producer
Neal Anderson
ANRC Commissioner,
Producer
Andrew Wargo Producer
Eric Park, PhD
President, Arkansas Bait &
Ornamental Fish Growers
Association
Nathan Stone, PhD
University of Arkansas Pine
Bluff
Wayne Branton
President, Catfish Farmers
of Arkansas
Municipal/Public Supply
Larry Lloyd, Chief
Operating Officer
Beaver Water District
Dale Kimbrow
Manager of Planning
Central Arkansas Water
Steve Parke Fort Smith
Richard Penn, Utilities
Director
Hot Springs Municipal
Water
Dennis Sternberg,
Executive Director
Arkansas Rural Water
Association
Kevan Inboden Jonesboro City Water and
Light
Sherrel Johnson
Robert Reynolds
Union County Water
Conservation Board
Steve Wear Conway County Regional
Water District
Don Zimmerman
Jim von Tungeln
Arkansas Municipal
League
Arkansas Natural Resources Commission
10
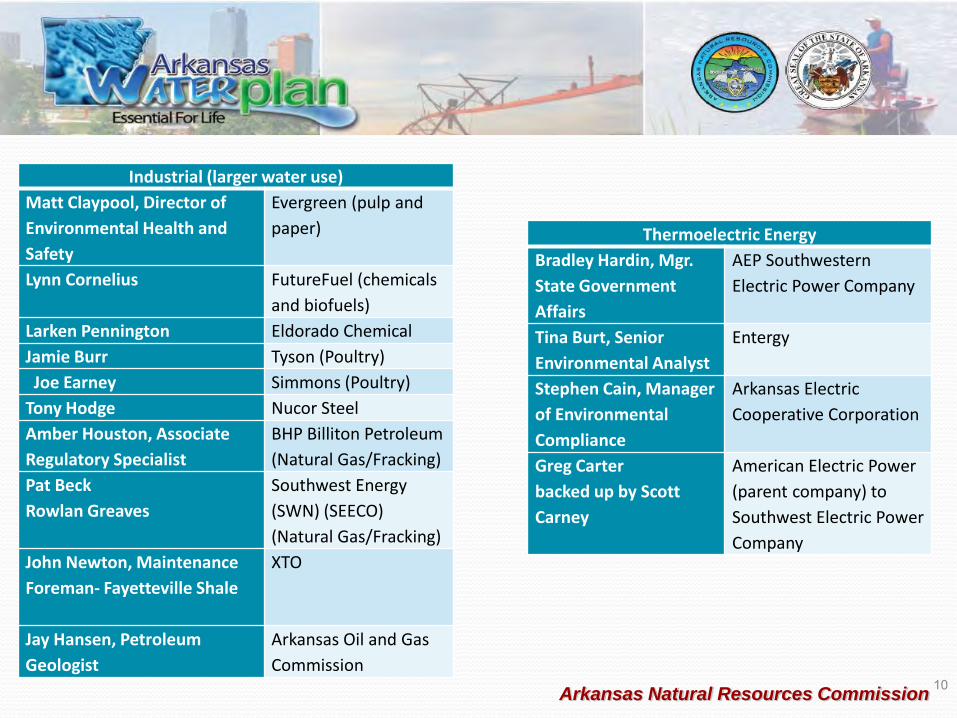
Industrial (larger water use)
Matt Claypool, Director of
Environmental Health and
Safety
Evergreen (pulp and
paper)
Lynn Cornelius FutureFuel (chemicals
and biofuels)
Larken Pennington Eldorado Chemical
Jamie Burr Tyson (Poultry)
Joe Earney Simmons (Poultry)
Tony Hodge Nucor Steel
Amber Houston, Associate
Regulatory Specialist
BHP Billiton Petroleum
(Natural Gas/Fracking)
Pat Beck
Rowlan Greaves
Southwest Energy
(SWN) (SEECO)
(Natural Gas/Fracking)
John Newton, Maintenance
Foreman- Fayetteville Shale
XTO
Jay Hansen, Petroleum
Geologist
Arkansas Oil and Gas
Commission
Thermoelectric Energy
Bradley Hardin, Mgr.
State Government
Affairs
AEP Southwestern
Electric Power Company
Tina Burt, Senior
Environmental Analyst
Entergy
Stephen Cain, Manager
of Environmental
Compliance
Arkansas Electric
Cooperative Corporation
Greg Carter
backed up by Scott
Carney
American Electric Power
(parent company) to
Southwest Electric Power
Company
Arkansas Natural Resources Commission
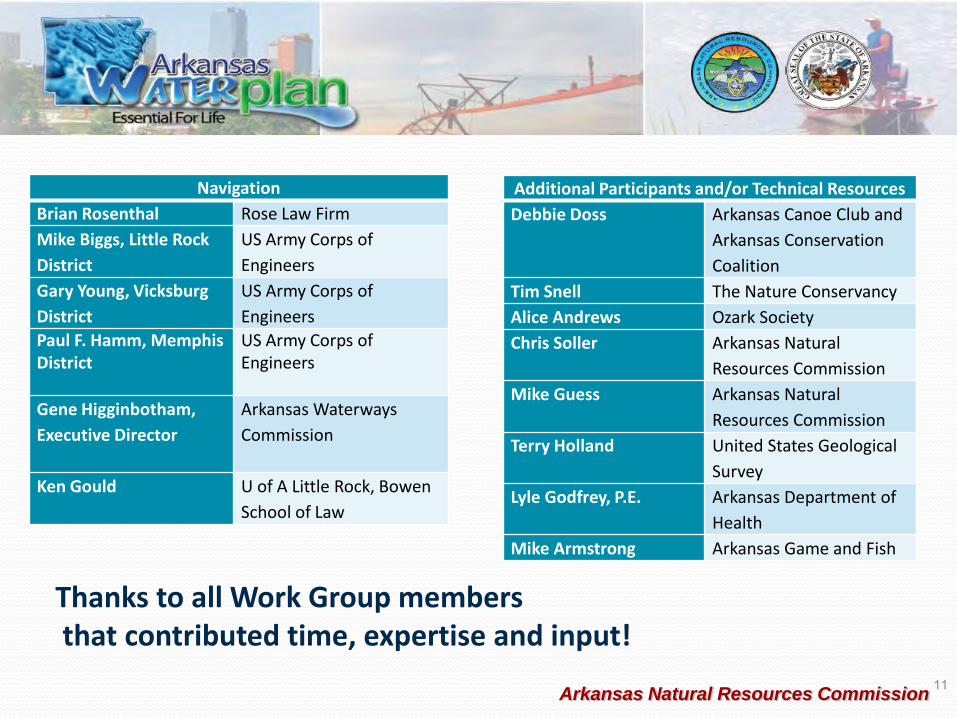
11
Navigation
Brian Rosenthal Rose Law Firm
Mike Biggs, Little Rock
District
US Army Corps of
Engineers
Gary Young, Vicksburg
District
US Army Corps of
Engineers
Paul F. Hamm, Memphis District
US Army Corps of Engineers
Gene Higginbotham,
Executive Director
Arkansas Waterways
Commission
Ken Gould U of A Little Rock, Bowen
School of Law
Additional Participants and/or Technical Resources
Debbie Doss Arkansas Canoe Club and
Arkansas Conservation
Coalition
Tim Snell The Nature Conservancy
Alice Andrews Ozark Society
Chris Soller Arkansas Natural
Resources Commission
Mike Guess Arkansas Natural
Resources Commission
Terry Holland United States Geological
Survey
Lyle Godfrey, P.E. Arkansas Department of
Health
Mike Armstrong Arkansas Game and Fish
Thanks to all Work Group members that contributed time, expertise and input!
Arkansas Natural Resources Commission
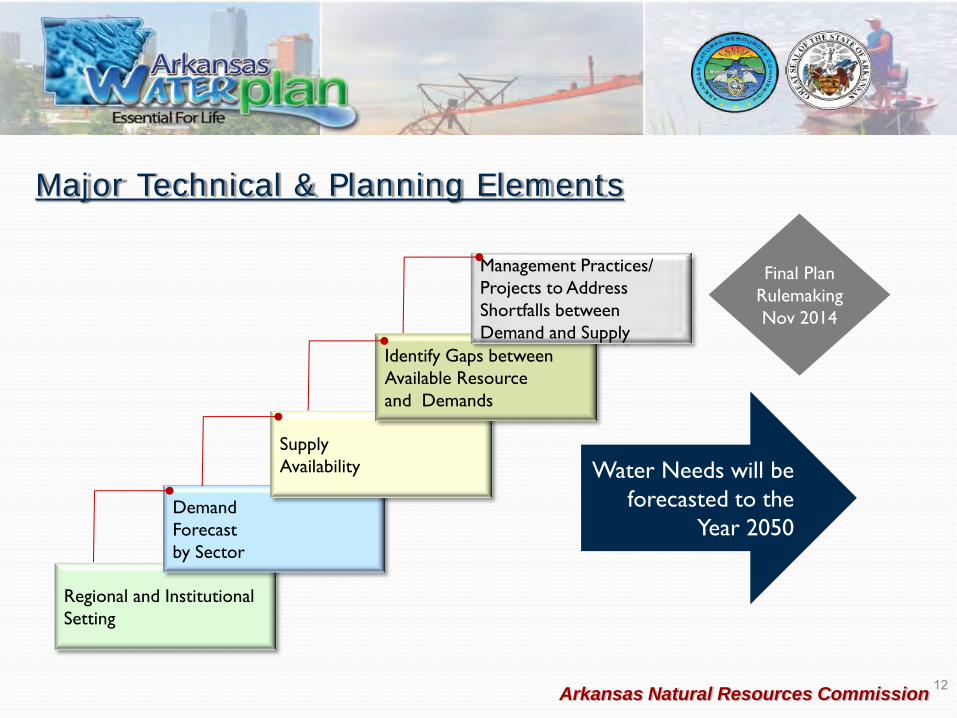
Major Technical & Planning Elements
12
Regional and Institutional
Setting
Demand
Forecast
by Sector
Supply
Availability
Identify Gaps between
Available Resource
and Demands
Management Practices/
Projects to Address
Shortfalls between
Demand and Supply
Water Needs will be
forecasted to the
Year 2050
Final Plan
Rulemaking
Nov 2014
Arkansas Natural Resources Commission

13 Arkansas Natural Resources Commission
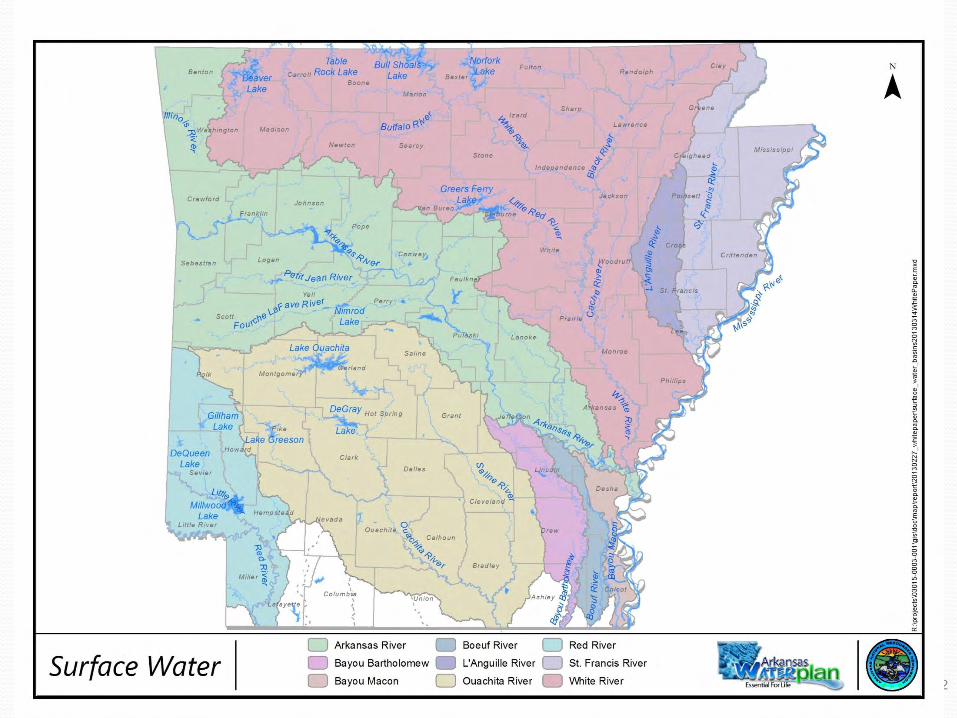
Overview of Planning Regions
Comprehensive Update of the Arkansas Water Plan
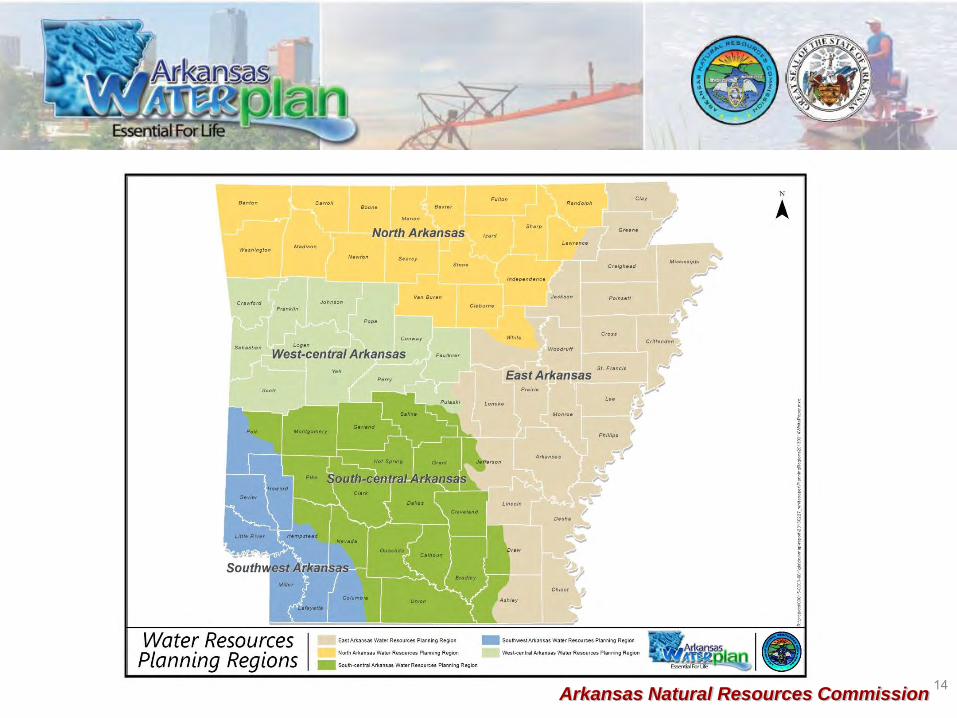
14 Arkansas Natural Resources Commission

Overview of Physical Setting & Demographics
Arkansas 24th largest state 53,162 square miles (260 miles long by 240 miles wide)
Elevation - high of 2,753 feet (Mt. Magazine) low 55 feet at Ouachita River Bed
The are 7 Ecoregions in the interior highlands and gulf coastal plain
Source: University of Arkansas, Division of Agriculture, A preliminary analysis of water resources in Arkansas, 2011 15
Arkansas Natural Resources Commission

Arkansas’s 2012 population of 2.9 million makes it the 32 most populated state (California #1 and Wyoming #50)
Average precipitation ranges from 43 to 69 inches per year
Rainfall is typically lower in July and August; especially in the Delta when crop water needs are high
16
PRISM Climate Group - Corvallis:
Oregon State University
Overview of Physical Setting & Demographics
Arkansas Natural Resources Commission
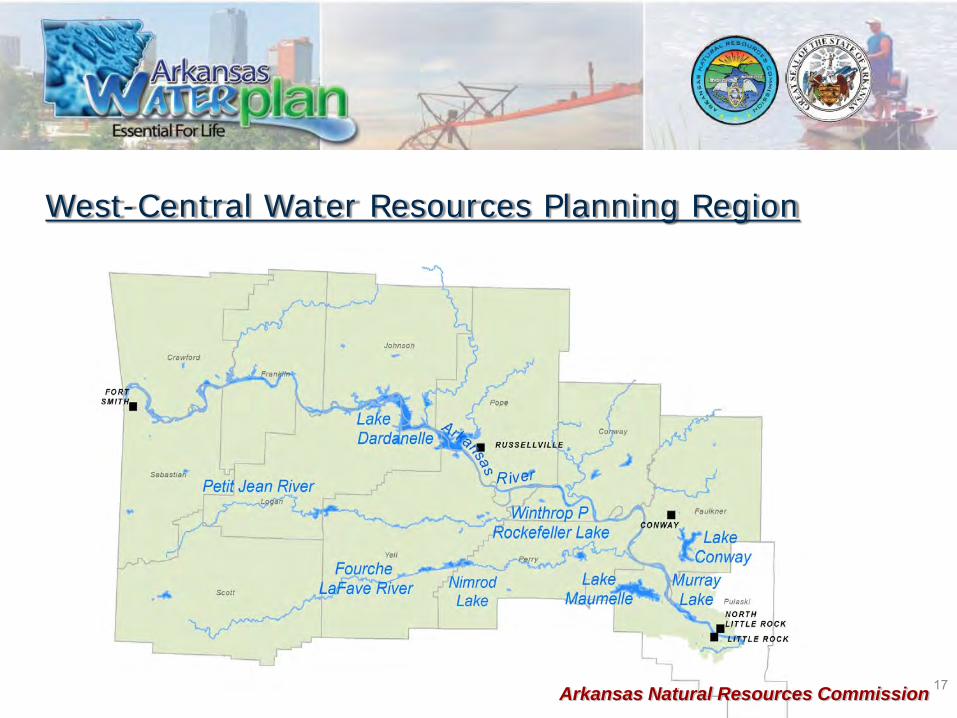
West-Central Water Resources Planning Region
17 Arkansas Natural Resources Commission

Characteristic Value
Area 7,977 sq-mi
Counties 12 (11 full, 1 partial)
Elevation 250 – 2753 ft
Precipitation 46 – 68 in
Major Rivers Arkansas River, Petit Jean River, Fourche la Fave River
Major Impoundments
Lake Dardanelle, Nimrod Lake, Lake Maumelle, Winthrop Rockefeller Lake, Murray Lake, Lake Conway
Economic Drivers Livestock agriculture (cattle), Manufacturing, Trade, Natural gas
Recreation Boating, Fishing, Tourism (wineries, state parks, Fort Smith)
Dominant Land Use Forest (deciduous + pine/evergreen)
18
West-Central Water Resources Planning Region
Arkansas Natural Resources Commission

0
50,000
100,000
150,000
200,000
Little Rock Fort Smith North LittleRock
Conway Russellville
Nu
mb
er
of
Pe
op
le
2010 Population
19
West-Central Water Resources Planning Region
Arkansas Natural Resources Commission

20 Arkansas Natural Resources Commission
Water Use & Forecasting Results
Comprehensive Update of the Arkansas Water Plan

Water Use and Demand Forecasting
Major Water Use Sectors
Municipal/Public and Self-Supplied
Agriculture – Crop, Livestock, Aquaculture, Duck Hunting and Habitat Maintenance
Industrial - including Mining and Shale Gas
Thermoelectric Energy
Navigation
How much do we use today & how much will we need by 2050?
21
Visit the ANRC Water Plan website for additional details
ARWaterPlan.Arkansas.Gov
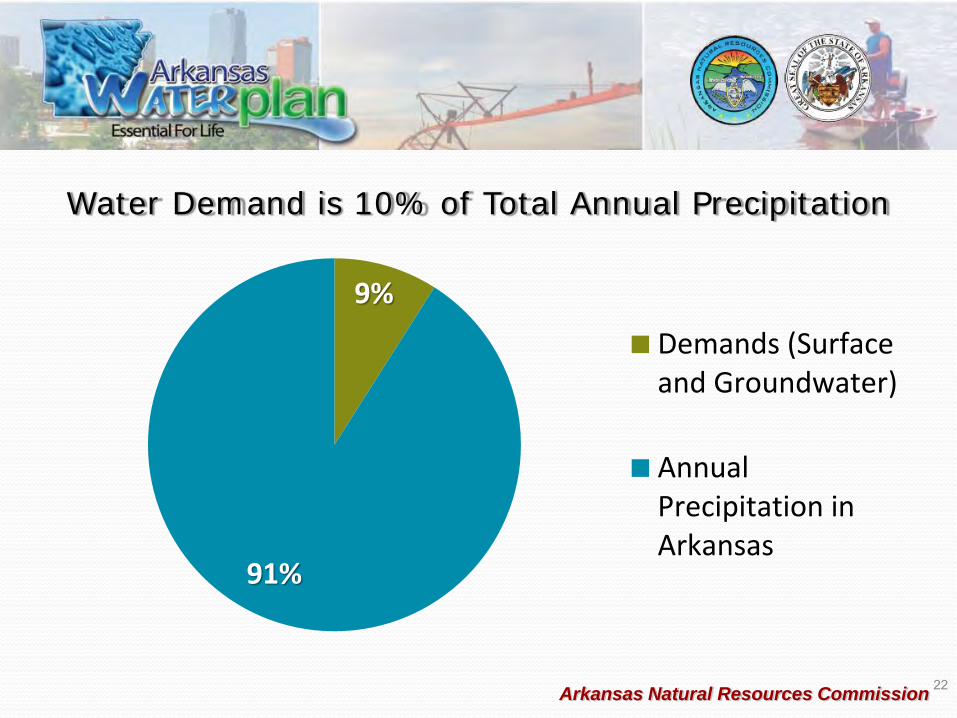
Water Demand is 10% of Total Annual Precipitation
9%
91%
Demands (Surfaceand Groundwater)
AnnualPrecipitation inArkansas
22 Arkansas Natural Resources Commission

Water Demand Forecasting
Each demand sector is complex- use best available data
Identify source of supply- Surface or groundwater
Data compilation & summarization- statewide, regional, & county level
Determine water use “drivers”
Current use is increased or decreased based on a rate of change of the water use “driver”
23 Arkansas Natural Resources Commission

Statewide Water Forecast – All Demand Sectors
Total statewide water use forecasted to increase 13%
24 -
2,000
4,000
6,000
8,000
10,000
12,000
14,000
Base Year 2020 2030 2040 2050
Mill
ion
Gal
lon
s p
er
Day
(M
GD
)
Arkansas Statewide Demands: Medium Scenario
Crop Irrigation
Livestock
Duck Hunting & Habitat Maintenance
Aquaculture
Shale Gas
Thermoelectric
Self-Supplied Commercial
Industrial
Self-Supplied Domestic
Municipal
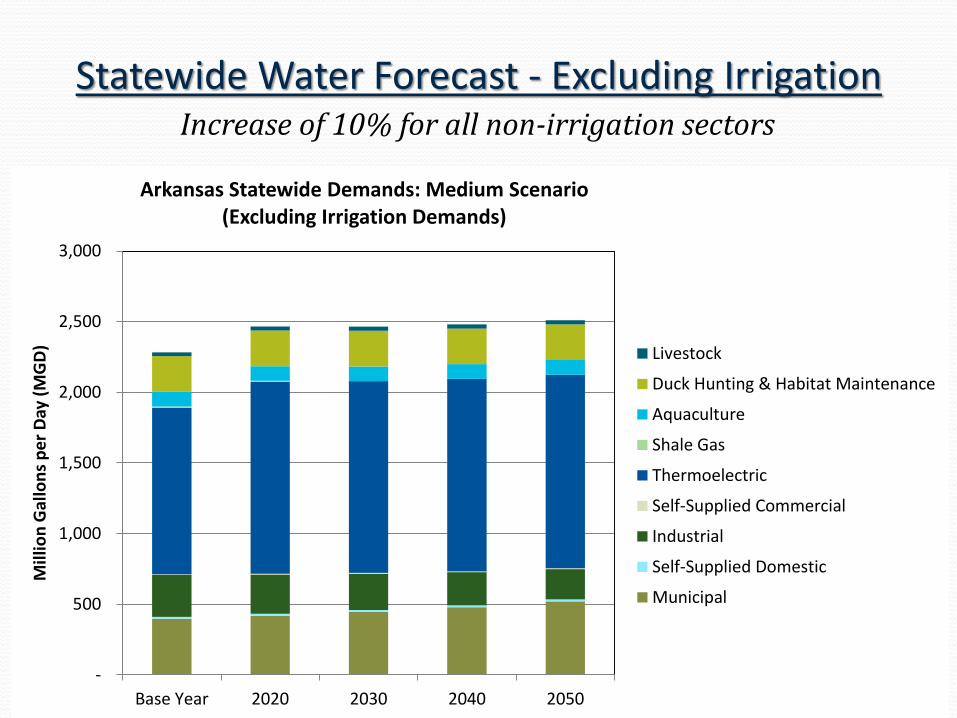
Statewide Water Forecast - Excluding Irrigation Increase of 10% for all non-irrigation sectors
25 -
500
1,000
1,500
2,000
2,500
3,000
Base Year 2020 2030 2040 2050
Mill
ion
Gal
lon
s p
er
Day
(M
GD
)
Arkansas Statewide Demands: Medium Scenario (Excluding Irrigation Demands)
Livestock
Duck Hunting & Habitat Maintenance
Aquaculture
Shale Gas
Thermoelectric
Self-Supplied Commercial
Industrial
Self-Supplied Domestic
Municipal

Statewide Water Forecast by Source of Supply
All Sectors 73% Groundwater
27% Surface Water
Agriculture 85% Groundwater
Municipal 71% Surface Water
-
2,000
4,000
6,000
8,000
10,000
12,000
14,000
Base Year 2020 2030 2040 2050
Mill
ion
Gal
lon
s p
er
Day
(M
GD
)
Statewide Water Demands (Medium Scenario)
Surface Water
Groundwater
26

Municipal/Public and Self-Supplied Forecast
Why is it important? Helping ensure reliable and quality drinking water supply for our citizens, business and industry.
27
2.0
2.5
3.0
3.5
4.0
4.5
20
10
20
11
20
12
20
13
20
14
20
15
20
16
20
17
20
18
20
19
20
20
20
21
20
22
20
23
20
24
20
25
20
26
20
27
20
28
20
29
20
30
20
31
20
32
20
33
20
34
20
35
20
36
20
37
20
38
20
39
20
40
20
41
20
42
20
43
20
44
20
45
20
46
20
47
20
48
20
49
20
50
Po
pu
lati
on
in M
illio
ns
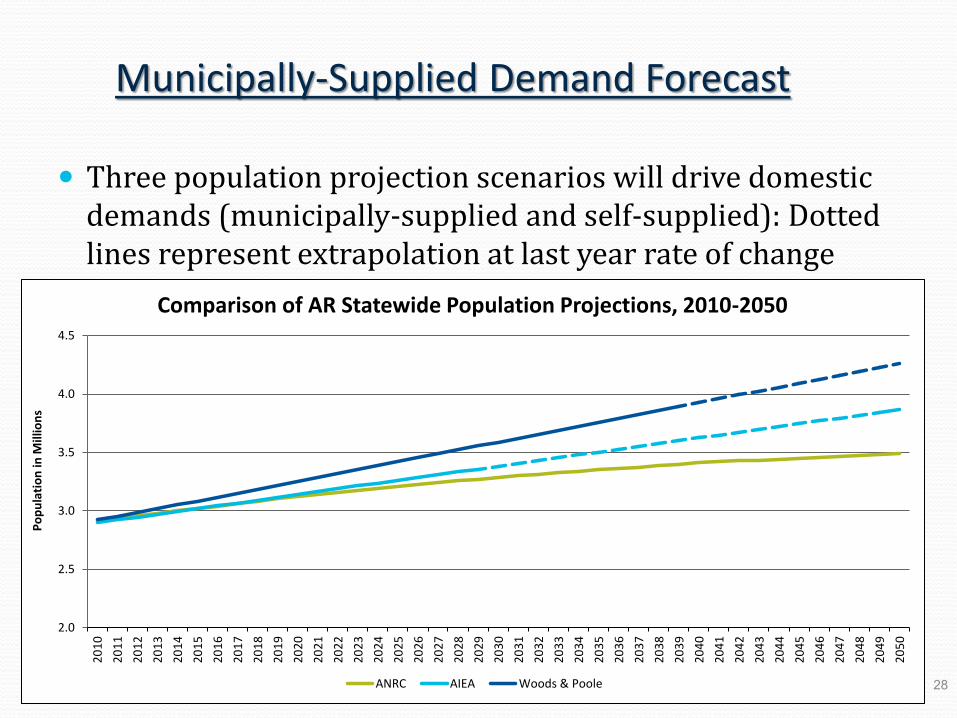
Comparison of AR Statewide Population Projections, 2010-2050
ANRC AIEA Woods & Poole
Municipally-Supplied Demand Forecast
Three population projection scenarios will drive domestic demands (municipally-supplied and self-supplied): Dotted lines represent extrapolation at last year rate of change
28

County Population Projections Arkansas Institute for Economic Advancement (AIEA )Scenario
29

Statewide Municipally-Supplied Demand Forecast
75 Counties in AR
56 Counties
Gallons per capita/day of 100-200
44 Counties
Gallons per capita/day of 100-150
30
Self-Supplied Domestic
Residential water users not connected to a municipal system (people on individual wells)
About 5% of the State’s population
Demand driven by population
USGS 2010 Report - self-supplied domestic gpcd values range from 80.0 to 98.2 and are different for each county
31

Trends in Self-Supplied Domestic Population
32
0.0
0.5
1.0
1.5
2.0
2.5
3.0
3.5
1985 1990 1995 2000 2005 2010
Po
pu
lati
on
in M
illio
ns
Arkansas Municipally-Supplied and Self-Supplied Population, 1985-2010
Publicly-Supplied Self-Supplied
29%
71%
24%
76%
21%
79%
13%
87%
7%
93%
5%
95%
Source: USGS 5-year Water Use Summaries

Agricultural Forecast – Crop, Livestock, Aquaculture and Duck Hunting
Why is it important?
Agriculture is a major driver of the state's economy. Providing food, fiber, and jobs for our citizens and the nation.
33
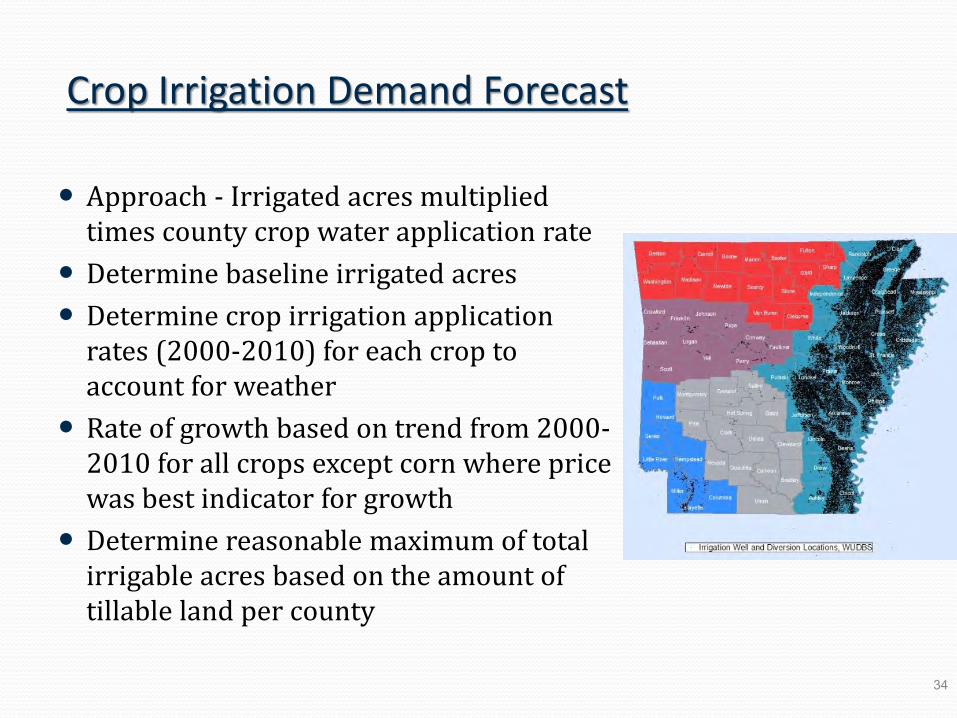
Crop Irrigation Demand Forecast
Approach - Irrigated acres multiplied times county crop water application rate
Determine baseline irrigated acres
Determine crop irrigation application rates (2000-2010) for each crop to account for weather
Rate of growth based on trend from 2000-2010 for all crops except corn where price was best indicator for growth
Determine reasonable maximum of total irrigable acres based on the amount of tillable land per county
34

Comparison of Agricultural Lands –Statewide 2010
5.00 6.16
10.99 11.52
0.0
2.0
4.0
6.0
8.0
10.0
12.0
14.0
Irrigated Tillable Cropland Land inAgricultureProduction
Land Availablefor Agricultural
Purposes
Mill
ion
s o
f A
cre
s
Note: Irrigated derived from CAP (soybean and rice) and WUDBS (all other) 35
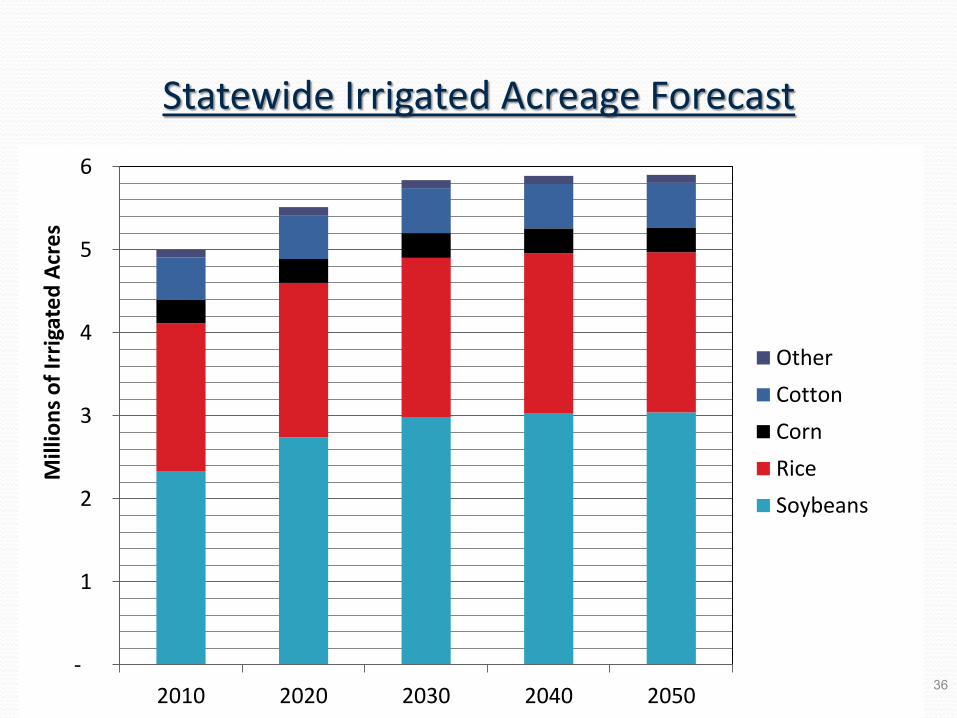
Statewide Irrigated Acreage Forecast
-
1
2
3
4
5
6
2010 2020 2030 2040 2050
Mill
ion
s o
f Ir
riga
ted
Acr
es
Other
Cotton
Corn for grain
Rice
Soybeans
36
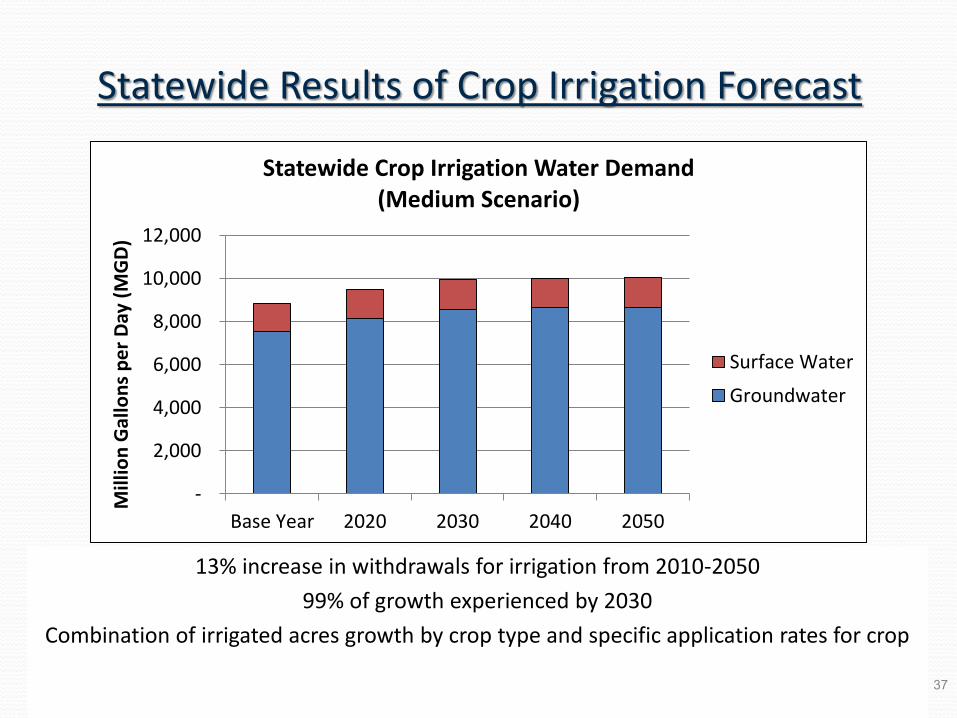
Statewide Results of Crop Irrigation Forecast
13% increase in withdrawals for irrigation from 2010-2050
99% of growth experienced by 2030
Combination of irrigated acres growth by crop type and specific application rates for crop
-
2,000
4,000
6,000
8,000
10,000
12,000
Base Year 2020 2030 2040 2050
Mill
ion
Gal
lon
s p
er
Day
(M
GD
)
Statewide Crop Irrigation Water Demand (Medium Scenario)
Surface Water
Groundwater
37

Livestock Component of Forecast
Forecast is water use to grow and sustain livestock Processing livestock is an industrial water use
38

Livestock Water Demand Forecast
Number of animals x daily water requirement
County level forecast with growth rate to 2022 derived from national USDA Agricultural Projections
Demand from 2022-2050 held constant (no additional growth)
Livestock Groups - Dairy Cows, Beef Cattle, Hogs and Pigs, Chickens , Turkeys, Sheep, including Lambs, Goats, Equine (Horses and Ponies)
39

Historical Statewide Animal Counts Source: COA (1997, 2002, 2007); CAP Survey (2012)
-
200,000
400,000
600,000
800,000
1,000,000
1997 2002 2007 2012Inve
nto
ry (
He
ad
)
Beef Cattle
-
20,000
40,000
60,000
1997 2002 2007 2012Inve
nto
ry (
He
ad
)
Dairy Cattle
-
200,000
400,000
600,000
800,000
1,000,000
1997 2002 2007 2012
Hogs and Pigs
-
50,000,000
100,000,000
150,000,000
200,000,000
250,000,000
1997 2002 2007
Total Chickens
40

Statewide Animal Counts
Livestock Group Base Year 2050 Percent Growth
Dairy Cows 11,000 11,000 0%
Beef Cattle 909,000 950,754 4.5%
Sheep and Goats 66,776 66,776 0%
Hogs and Pigs 110,000 110,000 0%
Chickens 215,082,244 244,447,393 13.7%
Turkeys 9,339,092 10,441,336 11.8%
Horses 78,968 78,968 0%
41

Livestock Water Requirements
Livestock Group Range of Water Requirements (Gallons per
head per day)(GHD)
Arkansas Water Plan Updated Water Requirements (GHD)
Dairy Cows1 18-50 35
Beef Cattle2 6.6-16 12
Sheep and Goats3 0.7-3.3 2
Hogs and Pigs4 1-24 4.5
Chickens5 0.02-0.12 0.1
Turkeys5 0.05-0.22 0.12
Horses6 8.5-15 12
1 Brugger and Dorsey 2006; Lardy et al 2008; Bickert et al 2000; Martin et al 2001; USGS 2009; NRCS 1980 2 Parker et al 2000; Gadberry ; Lardy et al 2008; Martin et al 2001; USGS 2009; NRCS 1980 3 Ministry 2007; USGS 2009; NRCS 1980 4 Froese 2003; Lardy et al 2008; Martin et al 2001; Prairie Swine Center Inc 2000; USGS 2009; NRCS 1980 5 AGRI-FACTS 2008; Bell et al 2002; Martin et al 2001; Williams et al 2013; USGS 2009; NRCS 1980 6 AGRI-FACTS 2008; American 2000; Lardy et al 2008; Ministry 2007; Martin et al 2001; USGS 2009; NRCS 1980
42

Livestock Annual Water Demand Forecast
10.9 10.9 11.3 11.4 11.4 11.4
12.9 13.2 14.3 14.7 14.7 14.7
-
5.0
10.0
15.0
20.0
25.0
30.0
35.0
BaseYear
2015 2020 2030 2040 2050
Mill
ion
Gal
lon
s p
er
Day
Horses
Sheep and Goats
Turkeys
Chickens
Hogs and Pigs
Beef Cattle
Dairy Cows
Percent Increase (Base Year - 2022) Chickens = 13.7% Beef Cattle = 4.5% Hogs and pigs = no
growth Dairy cows = no growth
43
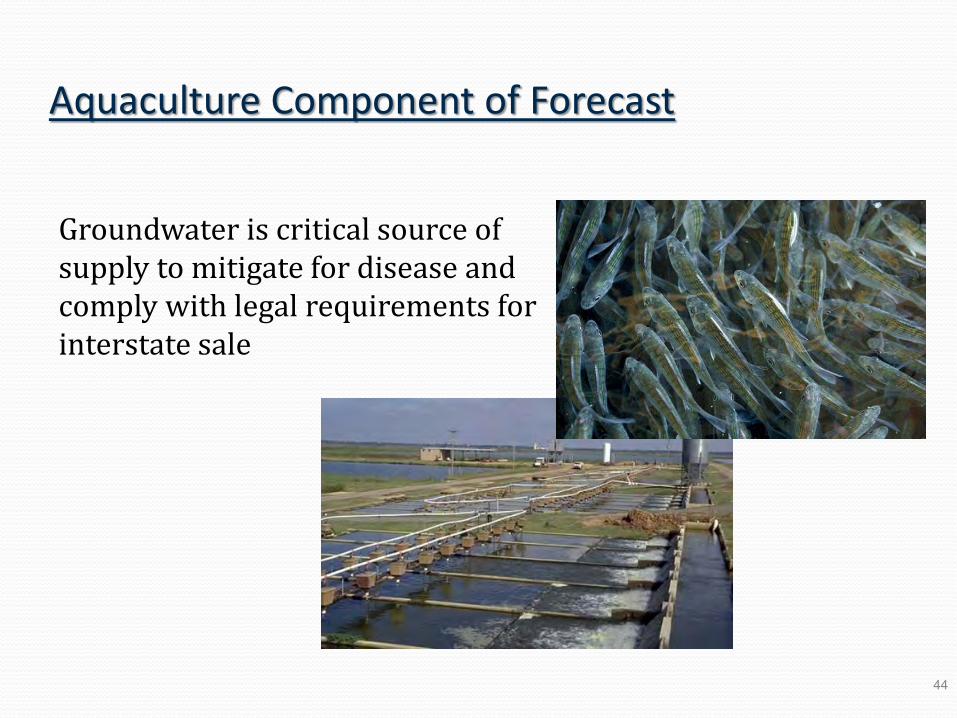
Aquaculture Component of Forecast
Groundwater is critical source of supply to mitigate for disease and comply with legal requirements for interstate sale
44

Aquaculture Water Demand Forecast Statewide Acres by Species Type
Species Type Base Year Acres Data Source Percent of
Total
Catfish 9,700 USDA 25%
Crawfish 267 WUDBS 1%
Goldfish 2,576 WUDBS 6%
Hatcheries 827 WUDBS 2%
Minnows 19,119 WUDBS 44%
Not Classified 10,880 WUDBS 22%
Total 43,369 100%
45

Aquaculture Water Demand Forecast
Total base year demands are 103.43 mgd
About half of statewide aquaculture demands are from minnow production
Demand occurs in 24 counties mainly in central and eastern Arkansas
46
Duck Hunting and Habitat Maintenance Component of Forecast
47

Duck Hunting & Habitat Maintenance
Incorporated “off-season” crop irrigation demands into the sector demands
Sector demands also include Arkansas Game & Fish Commission habitat maintenance demands derived from the WUDBS commercial database
Base year demands are held constant through 2050
48

Duck Hunting & Habitat Maintenance
Forecast Results
Duck Hunting Clubs use about 64% surface water and 36% groundwater.
Habitat maintenance uses about 98% surface water and 2% groundwater
Crop irrigation duck hunting water use is about 26% surface water and 74% groundwater
Overall, duck hunting & habitat maintenance uses about 40% groundwater and 60% surface water
49

Industrial Forecast Including Mining and Shale Gas Water Needs
Why is it important?
Industry provides the durable
and non-durable goods and
materials that enhance our
lives and is an key economic
driver of the economy.

Industrial Water Demand Forecast
Use average deliveries by industry type by county from 2008-2010 Water-use Registration Data Base (WUDBS) to derive baseline
Use of Arkansas Department of Workforce Services Workforce Investment Area projected employment by industry type to derive water demands from 2010 to 2020
Use Woods & Poole county-level manufacturing (NAICS 31-33) employment to drive both self-supplied and municipally supplied growth from 2020 to 2050
51

Industrial Water Demand Forecast
Demands include both municipally-supplied and self-supplied demands.
Industrial water demands decrease by 31% from Base Year to 2050
Decrease attributed to projected decline in the demand driver (employment)
Demand forecasted to decline in nearly all counties
52
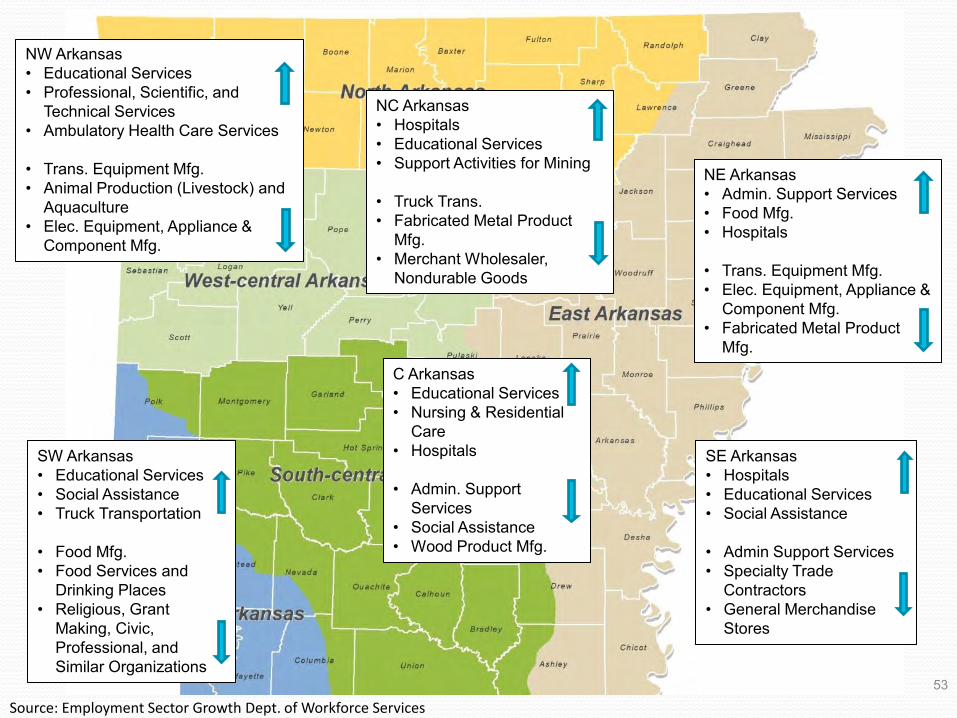
53
Source: Employment Sector Growth Dept. of Workforce Services
NC Arkansas • Hospitals • Educational Services • Support Activities for Mining
• Truck Trans. • Fabricated Metal Product
Mfg. • Merchant Wholesaler,
Nondurable Goods
NW Arkansas • Educational Services • Professional, Scientific, and
Technical Services • Ambulatory Health Care Services • Trans. Equipment Mfg. • Animal Production (Livestock) and
Aquaculture • Elec. Equipment, Appliance &
Component Mfg.
NE Arkansas • Admin. Support Services • Food Mfg. • Hospitals
• Trans. Equipment Mfg. • Elec. Equipment, Appliance &
Component Mfg. • Fabricated Metal Product
Mfg.
C Arkansas • Educational Services • Nursing & Residential
Care • Hospitals
• Admin. Support
Services • Social Assistance • Wood Product Mfg.
SW Arkansas • Educational Services • Social Assistance • Truck Transportation
• Food Mfg. • Food Services and
Drinking Places • Religious, Grant
Making, Civic, Professional, and Similar Organizations
SE Arkansas • Hospitals • Educational Services • Social Assistance
• Admin Support Services • Specialty Trade
Contractors • General Merchandise
Stores

Shale Gas Water Demand Forecast
Water use = 4.73 million gallons per well
Diverted water is 3.7 million gallons per well (100% from Surface Water) 1.03 million gallons (21.7% of water demand) is from diffuse water
Assume 100% of per well water demand occurs during the year the well is first permitted and active (no refracking assumed)
Assume a county’s maximum well density in its portion of the Fayetteville Shale Play extent is 7 wells per square mile
Distribute future wells using the current proportion of cumulative wells by county
If a county’s well density reaches its maximum, assign wells to other counties in the Play unless they are at maximum density
54

Shale Gas Water Demand Forecast
Current Well Distribution:
County Cumulative Wells Well Proportion
Cleburne 652 14.2%
Conway 924 20.1%
Faulkner 351 7.6%
Franklin 8 0.2%
Independence 67 1.5%
Jackson 23 0.5%
Pope 31 0.7%
Van Buren 1,385 30.1%
White 1,157 25.2%
Total 4,598 100%
55
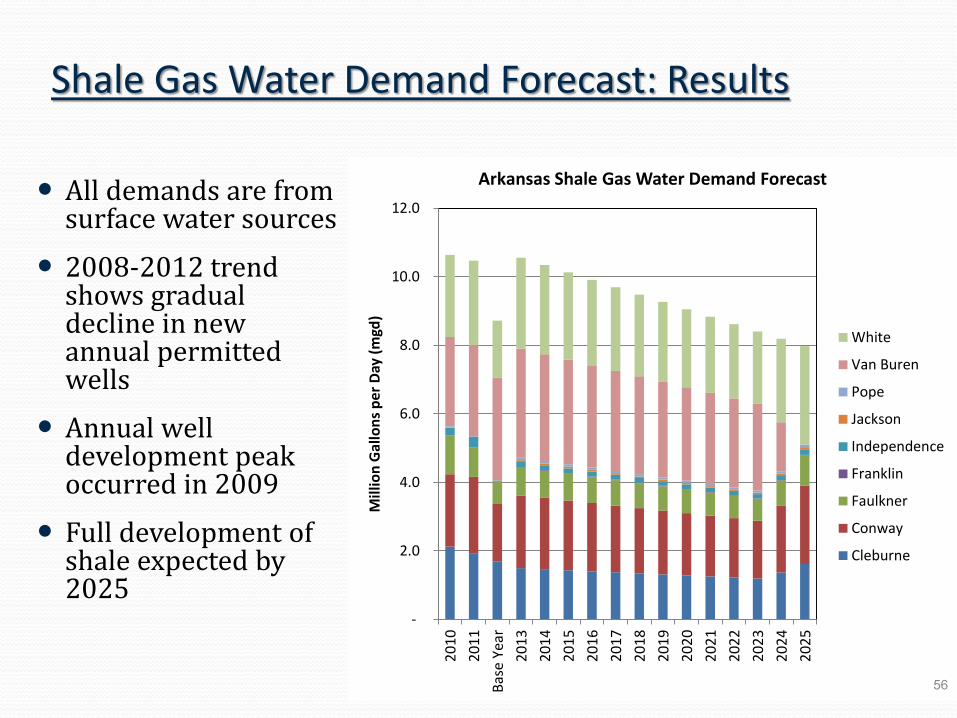
Shale Gas Water Demand Forecast: Results
All demands are from surface water sources
2008-2012 trend shows gradual decline in new annual permitted wells
Annual well development peak occurred in 2009
Full development of shale expected by 2025
-
2.0
4.0
6.0
8.0
10.0
12.0
20
10
20
11
Bas
e Ye
ar
20
13
20
14
20
15
20
16
20
17
20
18
20
19
20
20
20
21
20
22
20
23
20
24
20
25
Mill
ion
Gal
lon
s p
er D
ay (
mgd
)
Arkansas Shale Gas Water Demand Forecast
White
Van Buren
Pope
Jackson
Independence
Franklin
Faulkner
Conway
Cleburne
56

Mineral Resources of Arkansas & Future Demands
Non-energy related mining water demands are registered in 23 counties throughout Arkansas
Mineral resources can be found all over the state
County Base Year Mining Water Demands in MGD
Baxter 0.004 Benton 0.02 Boone 0.003
Craighead 0.03 Crawford 0.45
Crittenden 0.07 Drew 0.29
Faulkner 0.06 Greene 0.04
Hempstead 0.14 Hot Spring 0.86 Izard 3.02
Lafayette 0.005 Lawrence 0.28
Lonoke 0.03
Mississippi 0.02
Montgomery 0.004 Phillips 0.01 Pike 0.01
Poinsett 0.03 Polk 0.28
Washington 0.001 White 0.11
Total 5.77
57

Thermoelectric Energy Forecast
Why is it important? Providing energy to heat, cool and light our homes and businesses. Providing power for industry and manufacturing
58
Thermoelectric Water Demand Forecast
Energy Information Administration projection scenarios used for energy needs
Plant maximum sustainable capacity factors used for modeling future power generation in the state
No new thermoelectric power plants planned in the short-term future
Biomass is the most likely renewable source in the future
59
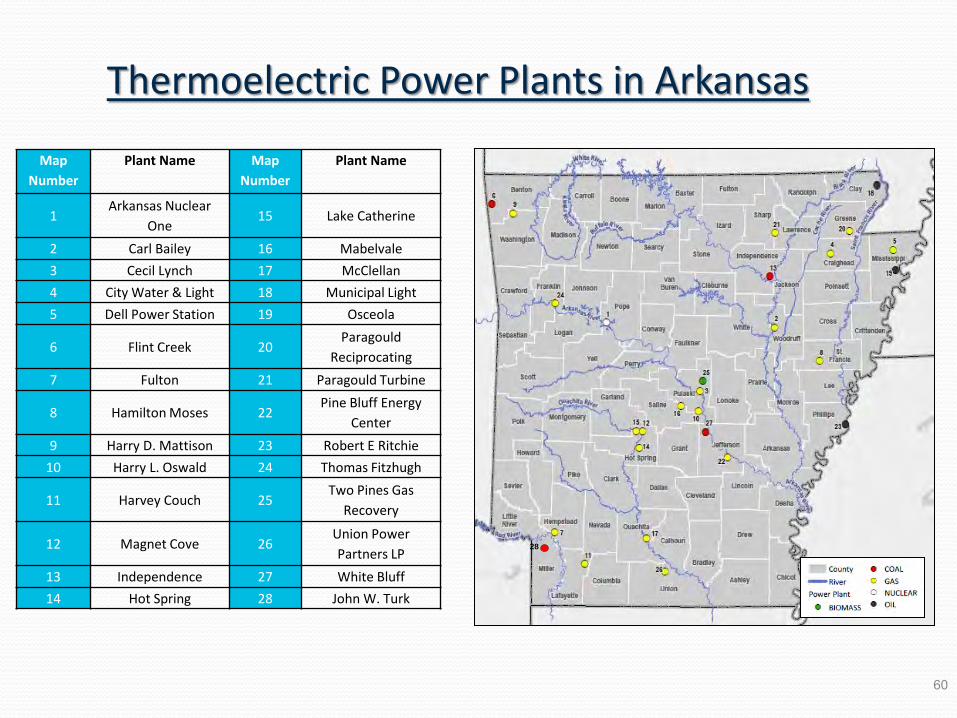
Thermoelectric Power Plants in Arkansas
Map
Number
Plant Name Map
Number
Plant Name
1 Arkansas Nuclear
One 15 Lake Catherine
2 Carl Bailey 16 Mabelvale
3 Cecil Lynch 17 McClellan
4 City Water & Light 18 Municipal Light
5 Dell Power Station 19 Osceola
6 Flint Creek 20 Paragould
Reciprocating
7 Fulton 21 Paragould Turbine
8 Hamilton Moses 22 Pine Bluff Energy
Center
9 Harry D. Mattison 23 Robert E Ritchie
10 Harry L. Oswald 24 Thomas Fitzhugh
11 Harvey Couch 25 Two Pines Gas
Recovery
12 Magnet Cove 26 Union Power
Partners LP
13 Independence 27 White Bluff
14 Hot Spring 28 John W. Turk
28
60

Thermoelectric Water Demand Forecast Results: Comparison of Withdrawals & Consumption
About 99.7% of withdrawals for thermoelectric power generation are from surface water sources
0.3% are small water using typically natural gas with combustion turbine
93% of water withdrawn for thermoelectric power production in the state is returned to surface water
-
200
400
600
800
1,000
1,200
1,400
1,600
BaseYear
2015 2020 2025 2030 2035 2040 2045 2050
Mill
ion
Gal
lon
s p
er D
ay (
mgd
)
Year
Arkansas Thermoelectric Water Demand Forecast: Comparison of Withdrawals and
Consumption, Reference Case Scenario
Withdrawals Consumption 61

Navigation Forecast
All Data and Results are Preliminary and Subject to Change
Why is it important? Providing transportation and delivery of goods and materials to our citizens, industry, and agriculture.
62

Identified Navigation Systems
Arkansas River
Ouachita River
Red River (feasibility study ongoing)
White River
USACE Districts in Arkansas
63
Navigation Water Demand Forecast
Identified existing federal and state authorized navigation projects
No significant change in navigation water needs from current through 2050
It was assumed that the existing flow and depth requirements will remain unchanged over the planning horizon and the minimum flows to for rivers and streams and depths of lakes and rivers will remain more or less as they are today
Existing commercial navigation will continue to be supported with adequate funding: Arkansas River, White River, Ouachita River – Maintenance is key challenge on White River
64

Future Navigation Potential or Initiatives
Additional studies are still being reviewed by the planning team to determine relevance to the Water Plan update i.e., Red River Feasibility Study, Arkansas 12 foot “proposed” channel, South West Arkansas Navigation Study potential implementation
65

66
11% water use increase in 2050
-
200
400
600
800
1,000
1,200
Base Year 2020 2030 2040 2050
Mill
ion
Gal
lon
s p
er
Day
(M
GD
)
West-central Arkansas Regional Demands: Medium Scenario
Crop Irrigation
Livestock
Duck Hunting & HabitatMaintenanceAquaculture
Shale Gas
Thermoelectric
Self-Supplied Commercial
Industrial
Self-Supplied Domestic
Municipal
West-Central Water Resources Planning Region
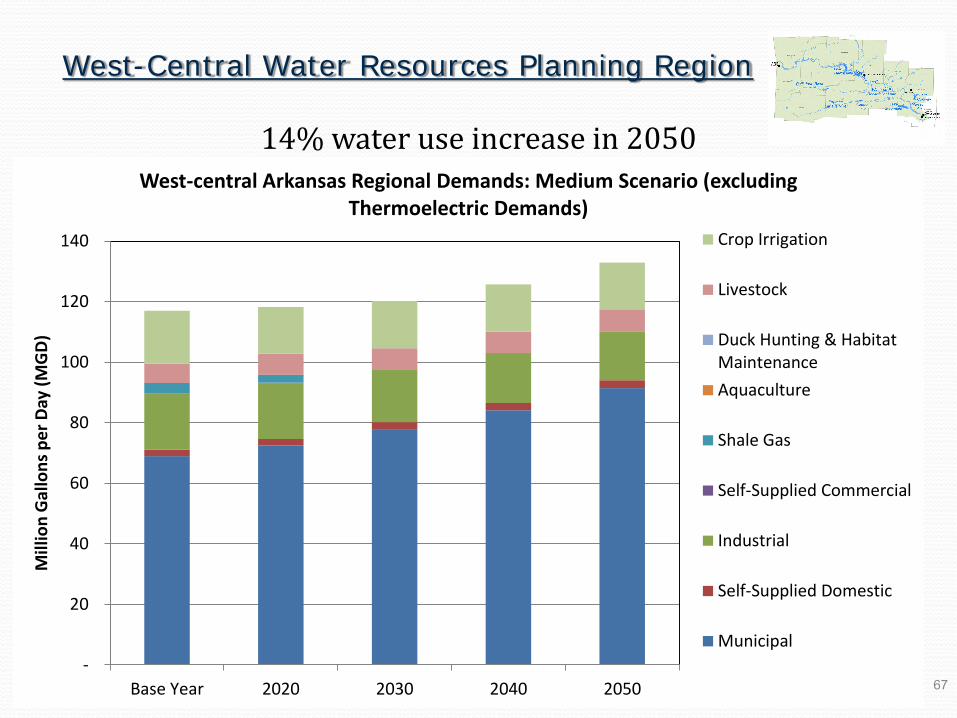
14% water use increase in 2050
-
20
40
60
80
100
120
140
Base Year 2020 2030 2040 2050
Mill
ion
Gal
lon
s p
er
Day
(M
GD
)
West-central Arkansas Regional Demands: Medium Scenario (excluding Thermoelectric Demands)
Crop Irrigation
Livestock
Duck Hunting & HabitatMaintenance
Aquaculture
Shale Gas
Self-Supplied Commercial
Industrial
Self-Supplied Domestic
Municipal
67
West-Central Water Resources Planning Region

0
2000
4000
6000
8000
10000
12000
14000
BASE YEAR 2020 2030 2040 2050
Mill
ion
Gal
lon
s p
er
Day
(M
GD
)
Arkansas Water Demands by Water Planning Region - Medium Scenario
West-central Arkansas
Southwest Arkansas
South-central Arkansas
North Arkansas
East Arkansas
68
Statewide Water Demands by Water Planning Region

69
What to Expect for Meetings #3 & #4 Water Supply Availability
Addressing Shortfalls between Supply and Demands
Arkansas Natural Resources Commission

The AR Water Plan Update
Requires Assessment of Current and Future Water Supply Availability
Groundwater Surface Water Water Quality Fish and Wildlife
Flows
70 Arkansas Natural Resources Commission
71
72

Development and Use of Models
Models are used to understand complex systems
Models allow for the testing of numerous variables
Conceptual and numerical models will be used in the Water Plan update
The 1990 Water Plan identified critical groundwater areas in east and south-central Arkansas where withdrawals rates are exceeding recharge rates
ANRC and USGS have developed a numeric model of the Mississippi alluvial and Sparta/Memphis aquifer systems
73
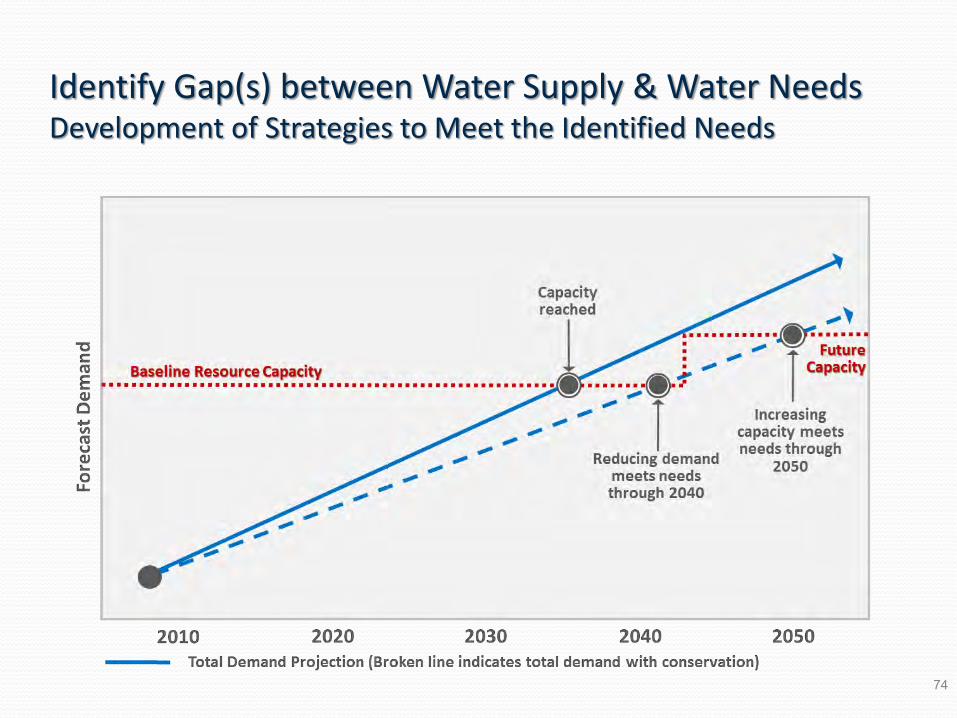
Identify Gap(s) between Water Supply & Water Needs Development of Strategies to Meet the Identified Needs
74

Identification/Selection of Water Resource Strategies/Management Actions
Portfolio
or Suite
of Strategies
Existing Plans
and/or Projects
Existing
Significant/
Relevant Studies
Alternatives for
Areas without Existing
Plans/Information
Review and
Assemble
Information
75
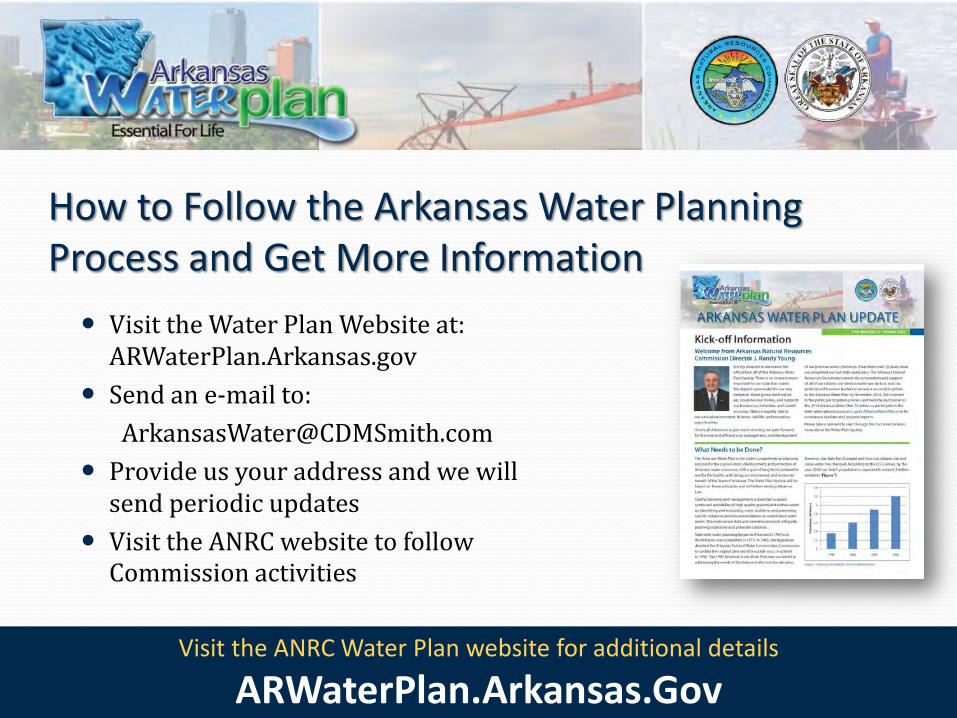
How to Follow the Arkansas Water Planning Process and Get More Information
Visit the Water Plan Website at: ARWaterPlan.Arkansas.gov
Send an e-mail to:
Provide us your address and we will send periodic updates
Visit the ANRC website to follow Commission activities
76
Visit the ANRC Water Plan website for additional details
ARWaterPlan.Arkansas.Gov