plan driving growth and value
TRANSCRIPT

StrategicPlan2021-2025
Stepping up the TransitionDriving growth and value
1

2
ALL RIGHTS ARE RESERVED
© REPSOL, S.A. 2020
Repsol, S.A. is the exclusive owner of this document. No part of this document may be reproduced (including photocopying), stored, duplicated, copied, distributed or introduced into a retrieval system of any nature or transmitted in any
form or by any means without the prior written permission of Repsol, S.A.
This document contains statements that Repsol believes constitute forward-looking statements such as, among others, the financial and operating figures for the 2020 fiscal year. These forward-looking statements may include
statements regarding the intent, belief, or current expectations of Repsol and its management, including statements with respect to trends affecting Repsol’s financial condition, financial ratios, results of operations, business, strategy,
geographic concentration, production volume and reserves, capital expenditures, costs savings, investments and dividend payout policies. These forward-looking statements may also include assumptions regarding future economic
and other conditions, such as future crude oil and other prices, refining and marketing margins and exchange rates and are generally identified by the words “expects”, “anticipates”, “forecasts”, “believes”, estimates”, “notices” and
similar expressions. These statements are not guarantees of future performance, prices, margins, exchange rates or other events and are subject to material risks, uncertainties, changes and other factors which may be beyond
Repsol’s control or may be difficult to predict. Within those risks are those factors and circumstances described in the filings made by Repsol and its affiliates with the Comisión Nacional del Mercado de Valores in Spain and with any
other supervisory authority of those markets where the securities issued by Repsol and/or its affiliates are listed.
Repsol does not undertake to publicly update or revise these forward-looking statements even if experience or future changes make it clear that the projected performance, conditions or events expressed or implied therein will not be
realized.
This document mentions resources which do not constitute proved reserves and will be recognized as such when they comply with the formal conditions required by the system “SPE/WPC/AAPG/SPEE Petroleum Resources
Management System” (SPE-PRMS) (SPE – Society of Pretroleum Engineers).
In October 2015, the European Securities Markets Authority (ESMA) published its Guidelines on Alternative Performance Measures (APMs). The guidelines apply to regulated information published on or after 3 July 2016. The
information and breakdowns relative to the APMs used in this presentation are updated quarterly on Repsol´s website.
This document does not constitute an offer or invitation to purchase or subscribe shares, pursuant to the provisions of the Royal Legislative Decree 4/2015 of the 23rd of October approving the recast text of the Spanish Securities
Market Law and its implementing regulations. In addition, this document does not constitute an offer to purchase, sell, or exchange, neither a request for an offer of purchase, sale or exchange of securities in any other jurisdiction.
The information contained in the document has not been verified or revised by the Auditors of Repsol.
Disclaimer
2

3A profitable company in the Energy Transition with strong cashflow growth & capital discipline
Strategic Plan 2021-2025: Delivering a compelling investment case into the Transition
Leading the
journey
to an ambitious
destination
‒ A legacy double-geared engine providing cash-flow and solid foundations for the Transition
‒ Profitable business platforms with leading advantaged positions: Iberia & Downstream
‒ New operating model, catalyzing value transparency & De-carbonization
‒ Leading shareholder distribution with a top quartile remuneration
‒ Preserving our financial strength
‒ A profitable ambition of net zero emissions and multienergy company growth (FCF growth)
‒ Distinctive potential for transformation to 2030 in terms of speed, intensity and feasibility
3

Agenda
01. A complex environment offering opportunities
02. Repsol: Outstanding platform to thrive in the energy transition
03. Path to Repsol 2030
04. Strategy 2021-25: Stepping up the Transition
05. Leading investment case
06. Conclusions

01.
A complex environment
offering opportunities

6
A complex environment offering significant opportunities
Economic
recovery
‒ Challenging economic environment
• Recovery to 2019 levels expected not
before 2023
‒ Global energy demand to follow
economic recovery
‒ Long term secular growth in energy
demand
• Global population and higher living
standards driving growth despite
efficiency gains
Energy transition
and decarbonization
‒ Regulatory and social alignment
towards decarbonization priority
‒ Growing share of electrification in the
energy mix, with increased contribution
from renewables
‒ Oil and gas to maintain a key role in
energy mix
‒ New technologies driving change in
energy landscape (i.e. H2, biofuels,
circularity, carbon sinks)
Volatile commodity
prices
‒ High market uncertainty and volatility
‒ COVID driving oil price to low 40s and
refining margins under pressure
‒ Steep reduction of investments and
increase of closures across O&G value
chain
• Potential upside for prices with
economic recovery
‒ Long term volatility for oil and gas prices
6

02.
Repsol: Outstanding platform to
thrive in the energy transition

8
Repsol: Pioneering commitment with decarbonization goals
First O&G to target Net Zero emissionsCommitted in December 2019, now increasing our ambition
2016 2025 2030 2040 2050
New Ambition to accelerate the path to Net zero
emissions in scopes 1, 2 and 32
Carbon Intensity Indicator1 reduction target [gCO2/MJ]
Leading the energy transition in line with the objective of the
Paris agreement to limit global temperature increase to well below 2ºC
-50%
-25% -12%
Leading ESG company
32%
-10%-20%
-40%
1. 2016 baseline. 2. Scope 3 emissions based on the use of the products from our upstream production Note: TPI: Level 4 “Strategic Assessment “; CDP: Within Oil & Gas: A- ; MSCI: In Integrated Oil and Gas: AASource: Leaders Arena research August 2020 & Repsol SID List Feb 2020.
Previous targets
Top grade 2020
Top grade 2019
1st quintile 2020
Repsol's institutional shares managed by
ESG investors…
15%…more than doubling the Global
oil and gas average
8

9
2016
11
2019
9
Value vs. Volume mindset
2016 2017 2018 2019 2020
1.50.8
1.1
Free cash flow (B€/y)
Strong FCF generation Focus on OPEX reduction
OPEX ($/boe) ‒ Portfolio with balanced exposure
and optionality
‒ Continuous capex/opex efficiency
programs
− Strong track record:• Asset turnaround
• Project delivery safe, faster and
leaner
• World class explorer
Growth Cash generation
Cash generation
@ low prices
-22%
Doubled-geared machine Upstream
‒ Selective capex allocation
→ intensity: <$10/boe1
1. 2019 9

10
WMK Refining Net Cash Margin
model2 by EU companies 2020 (42 companies, 84 refineries)
1. Includes Refining, Chemical, Trading and Peru R&M businesses. 2. Wood Mackenzie Refinery Evaluation Model (Post-Investment Preliminary 2020 Update) – Europe. Updated: May 2020 3. Best polymer producers Awards for Europe by the European Plastics Converters association (EuPC), 2020 4. Integrated margin calculated as CCS/LIFO-Adjusted operating profit from the R&M segment divided by the total volume of crude processed (excludes petrochemicals business). Based on annual reports and estimates. EU Peers: Eni, Cepsa, Galp, OMV, MOL, Hellenic, PKNOrlen, Neste Oil
$/bbl
‒ Leading energy brand in Iberia with top market shares
‒ Material and growing non-oil business
‒ Strong results growth 2015-19: +43% EBITDA
‒ World class digital products and capabilities
‒ Top resilience: Delivering €0.5 B FCF in a challenging 2020
Solid integrated chemical business
‒ 40% LPG feedstock flexibility vs
25% EU average
‒ Differentiation & vertical integration
with value-added products
‒ Customer centricity
• Best 2020 polymer
producer award3
Strong integration across Refining, Chemicals & Trading
Refining + Commercial Margin: Repsol +$2/bbl margin vs. EU peers in 2015-20194
1. World-Class Industrial business1, with Tier 1 assets 2. Iberian leading Customer business
Doubled-geared machine Downstream
10

11
Only company to be FCF positive
each and every year since prices dropdown
2015 2016 2017 2018 2019 2020e
1.6
FCF (B€)
FCF resilient
The ability to adapt and extract value of difficult environments underpins future success for Repsol
1. Spain Market share in volume; value for 2019 2. Operating capacity of Delta I (335 MW), Windfloat (5 MW), Cabo Leonés III phase I (78 MW – 50% WI) and hydro assets (699 MW)
CUSTOMER CENTRIC RENEWABLES INDUSTRIAL
24 M customers1 M G&P retail customers (+40% in 18 months)2 M users
Leader in multi-energy low carbon products1
66% Biofuels; 74% LPG
1,250 Charging pointsSpanish leader in fast charging and public charging points
1.1 GW Operational2 in Spain and Chile
0.7 GW Hydro
0.4 GW Wind
11.7 GW Strongpipeline0.4 GW Under construction3.5 GW High visibility pipeline7.8 GW Under development and negotiations
700 kt/y bios produced
250 kt/y advanced biosFID taken in Cartagena
First 7kt biojet fuel ever madein Spain
Circular polyolefins10 kt plastic waste removed since 2015
CCU demo plant Project2.5 kt/y e-fuels capacity
Repsol today: Starting the Transition from a strong positionRelevant low carbon portfolio & sustained and resilient Free Cash Flow
11

Path to Repsol 2030
03.

13
Ambitious transformation journey to thrive in Energy Transition
Path to
2030
De-carbonizethe portfolio
Towards Net Zero emissions Leading investor proposition
Profitable Four verticals
New operating model
FCF growth
Advantaged
transformationValue
crystallization
New partnerships
13

14
Low-carbon generationRenewablesConventional low-carbon generationEnergy Management
Customer-centricMobilityLPGE-Mobility
P&G RetailEnergy solutionsLAS2
IndustrialRefining1
TradingWholesale & Gas Trading
Upstream
Upstream
EBITDA €4.3 B
CAPEX €2.5 B
P1 Reserves: 2.1 Bboe
Production: 709 kboe/d
Group Global Services (Efficiency and Scale)
Group Corporate Center (Governance, Financial and Strategic Management and Integration synergies)
REPSOL Group
1. Refining Spain and Peru R&M 2. Lubricants, Asphalts and Specialties
Early movement: New Repsol corporate model for increased
accountability and value transparency
BiofuelsChemicals
EBITDA €2.0 B
CAPEX €0.9 B
Refining capacity 1.0 Mbbl/d
Chemical sales 2.8 Mt/y
EBITDA €1.0 B
CAPEX €0.4 B
# Clients 24 M
EBITDA €0.04 B
CAPEX €0.2 B
Capacity: 3.3 GW
Of which RES (inc.
hydro)
1.1 GW
EQUITY PARTNERs
or IPO
New corporate model enabling value crystallization
2019 2019 2019 2019
2020
14
Yield and New Platforms Yield and Transformation Business BuildYield and Focus

15
Clear logic for Repsol new corporate model
Clear differentiation of businesses profiles and equity stories within the Group
Alignment of cost of capital with business profile for each business
Ability to develop appropriate partnerships for each business
Value crystallization and transparency
Acceleration of new ways of working15

16
55%
34%
35%
8%
Repsol 2030: A more sustainable, balanced and profitable company
2%
CE 2019
CE Total: €31 B
CE 2030
2030 Ambition
Transforming the company's portfolio
FCF (B€)
Strong cash-flow growth
2030 Repsol's Low Carbon business: ~40% of CE
5 % Low Carbon Retail
10 % Low Carbon Industrial
CE 2025
2030 Repsol's Low Carbon business: ~40% of CE Growing 2030 FCF well above 2025
% Low Carbon Businesses40%12%
x 2.6
Customer Centric Business Low Carbon Generation Industrial Upstream
25%
30%
10%
35%
1. Increase in low carbon CE through investments in low carbon generation, new industrial low carbon platforms (circularity, H2 & e-fuels, etc.), decarbonization through efficiency initiatives, e-mobility, and value-added services, among others2. In homogeneous price basis @$50/bbl & $2.5 HH Note: CE of RES considering consolidation by the proportional method. Capital employed figures not including Corporation (€2 B in 2019)
1.3
3.4
20192 20302025
Industrial transformation(circularity, H2 & e-fuels)
Renewables
Customer centric business
Upstream flexibility
16
44%
37%
12%
7%
EBITDA (B€)6.22 8.2

17
Uniquely positioned to thrive in the energy transition: Distinctive approach and
differentiated starting point
- De-carbonization as a business opportunity creating profitable Transition growth
platforms
- Legacy business providing cash-flow to enable Transition
the right
ambition
a credible
size
- Large enough to build a leading player in energy transition
- Small enough in the O&G universe to feasibly transform the portfolio with attractive
opportunities
a well-suited
play
- Customer leadership in Iberia with differential brand over competitors
- Tier#1 industrial sites provide unmatched platforms for emerging de-carb business
- Iberian peninsula with local advantages on project economics (Power-to-X, circularity),
- provided by a large renewable resource base 17

Strategy 2021-25:
Stepping up the Transition
04.

19
Accelerating transformation and delivering
growth
Ensuring strong
performance and financial strengthIn an uncertain economic and commodities environment
‒ Efficiency & capital discipline
‒ Capex reduction
‒ Prudent financial policy and commitment with current credit rating
2021 - 2022 2023 - 2025
Self-financed plan @$50/bbl & $2.5 HH
Ensuring shareholder value maximization
‒ Portfolio optimization & new business platforms
‒ Metrics growth & high Capex intensity
‒ ROCE and gearing
Delivering financial targets while transforming the companyAmbition 21-25
19

20
2020: Repsol is successfully managing COVID situation to deliver resilience, setting up the path for 2021
Resilience savings as % of ‘19 CFFO1
Peer 1 Peer 2 Peer 3 Peer 4 Peer 5 Peer 6
50% €2.4 B Savingsin 2020
Opex Cuts Capex Cuts
22%Peers Average
Top Resilience Plan in the sector
2020e Gearing Increase2
Peer 1 Peer 2 Peer 3 Peer 4 Peer 5 Peer 6
4.0 p.p.Peergroup Average
1pp
1. Evaluate Energy for 2019 CFFO; 1.13 $/€ exchange rate used for savings plans in Euro; Public Domain measures including Opex (+WC) & Capex Savings. 2. Thomson Reuters as of November 17th. Gearing ratio calculated as Net Debt / (Net Debt + Shareholders’ Equity). 2020e calculated from SmartEstimate® data. EU peers: BP, Eni, Equinor, OMV, Shell and Total.
Top 2020e financial strengthLiquidity position to cover c.3x short term debt maturities
and total maturities until 2036
2020 de-leverage
20

21
Procurement efficiency programRenegotiation initiatives,
standardization and simplification and
new digital tools implementation
2019 Pre-COVID recovery position expected by 2022 on the same price basis
Extending and strengthening competitiveness
programs into 2021 to maximize resilience
+ €170 M
2021 Impact
Working capital optimization > €160 M
Leaner corporation & org. rightsizing + €90 M
By 2022, Repsol expects to successfully recover from the COVID crisis
EBITDA
6.23.8
6.6
Adjusted
2019
2020E 1 2022
Adjusted Net income
Billion €
1.5
0.3
1.5
Adjusted
2019
2020E 2022
Billion €
Note: homogenized figures @$50/bbl & $2.5 HH 1 EBITDA CCS
21

22
Legacy and new businesses driving portfolio performance along the Transition
Contribution to portfolio financial profile 21-25
Industrial1
Capital Employed 2025 21-25 Capital Investment
21-25 Net Cash Contribution
E&P
CCB
+€3.6 B FCF 21-25
- €2.3 B FCF 21-25
+€5.1 B FCF 21-25 +€4.5 B
FCF 21-25
Focus and
efficiencyEfficiency and
New platforms
Transform
2.0
Business
build
FCF
generating
business
Growth
business
1. Industrial includes Refining Spain and Peru R&M, Chemicals, Trading & Wholesale Gas businessesNote: Corporate values not considered
Contribution to carbon
intensity reductionLow carbon strategies
CIRCULAR
ECONOMY
LOW CARBON
PRODUCTS
PORTFOLIO
DECARBONIZE
CUSTOMER
CENTRIC
LOW CARBON
GENERATION
Low
Carbon
Generation
22
23
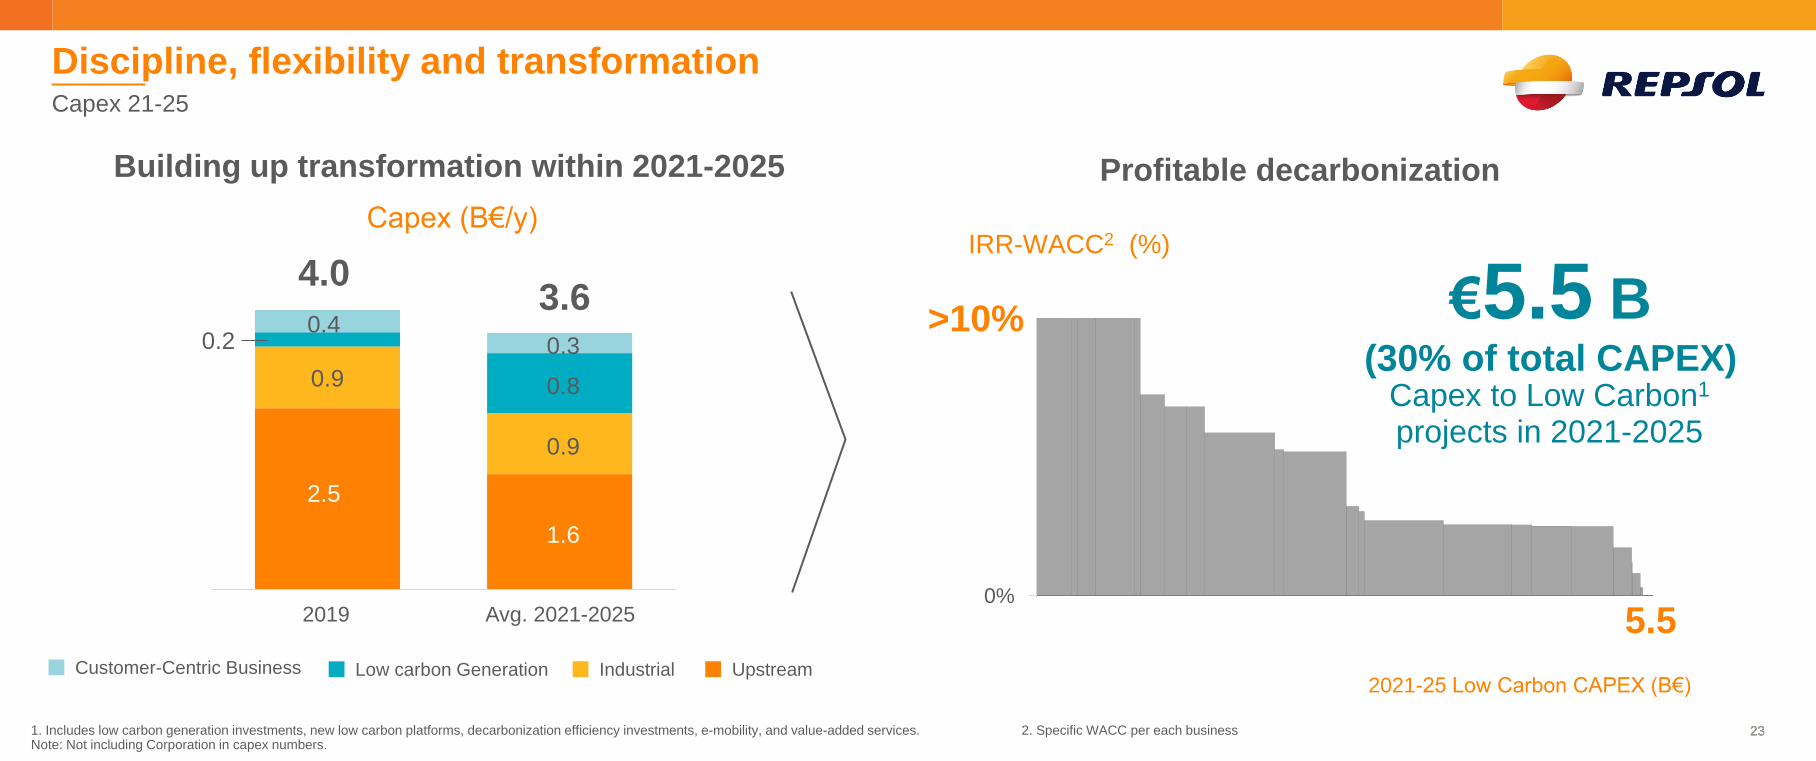
Building up transformation within 2021-2025
0.2 0.30.4
0.9
1.6
2.5
0.8
2019
0.9
4.0
Avg. 2021-2025
3.6
UpstreamIndustrialCustomer-Centric Business Low carbon Generation
1. Includes low carbon generation investments, new low carbon platforms, decarbonization efficiency investments, e-mobility, and value-added services. 2. Specific WACC per each businessNote: Not including Corporation in capex numbers.
Discipline, flexibility and transformationCapex 21-25
€5.5 B(30% of total CAPEX)
Capex to Low Carbon1
projects in 2021-2025
Profitable decarbonization
2021-25 Low Carbon CAPEX (B€)
0%
5.5
IRR-WACC2 (%)
>10%
Capex (B€/y)
23

24
4 Extra shareholder distribution
3 Additional Low carbon CAPEX
If Price deck
improves
2 Shareholder distribution
1 Value CAPEX
At base case
Resilient shareholder distribution
RESILIENT
DIVIDEND GROWING DIVIDEND
2021
SBBSBB
0.650.60
2022 2023
SBB
0.70
2024
SBB
0.75
2025
0.60
0.89>1.00
ADDITIONAL DISTRIBUTION (SBB)1
Capital allocation priorities
+25%
0 CAPEX flexibilityIf Price deck
worsensBuyback
Dividend
Leading distribution and clear capital allocation frameworkCapital allocation 21-25
24FINANCIAL DISCIPLINE
€0.6/sh
dividend
committed
@$40/bbl
€/share
1. 200 M shares in the SP period: 50 M sh/y in 2022-25. €1.4-2.0B cash sources allocated to SBB

Strategy 2021-25:
Stepping up the Transition
Business strategies
04.

26
Setting the new business priorities
26
Upstream
Yield and New Platforms Yield and TransformationYield and Focus
Customer-centricIndustrial
Business Build
Low-carbon generation

27
Setting the new business priorities
27
Upstream
Yield and New Platforms Yield and TransformationYield and Focus
Customer-centricIndustrial
Business Build
Low-carbon generation
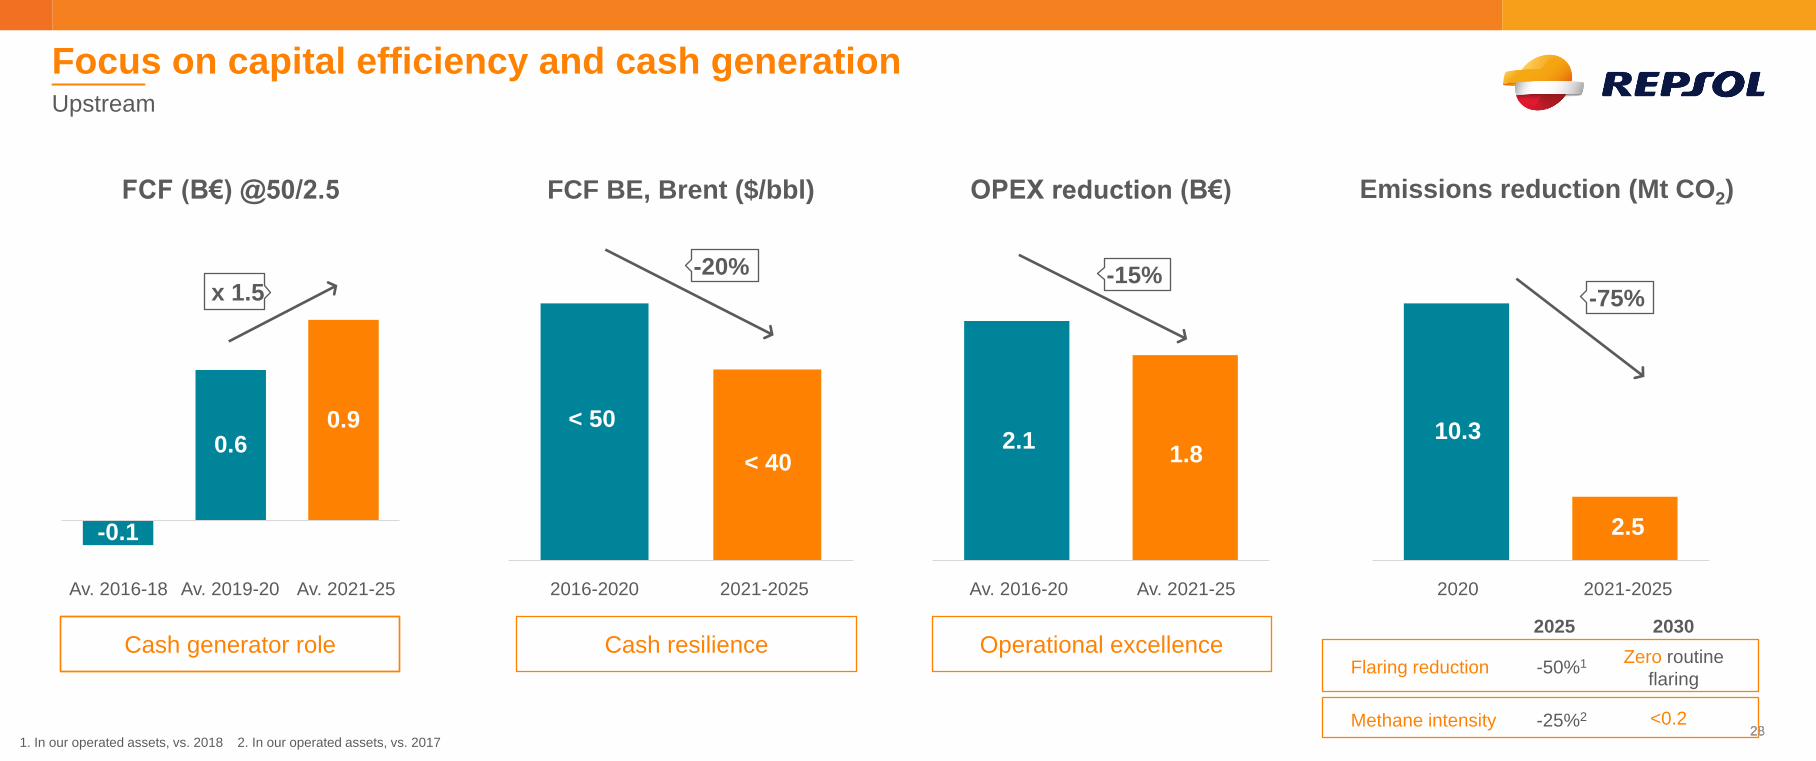
281. In our operated assets, vs. 2018 2. In our operated assets, vs. 2017
FCF (B€) @50/2.5
4.5
Cash generator role
FCF BE, Brent ($/bbl)
< 50
< 40
2016-2020 2021-2025
Cash resilience
-20%
OPEX reduction (B€)
2.11.8
Av. 2016-20 Av. 2021-25
Operational excellence
Emissions reduction (Mt CO2)
-15%
10.3
2.5
2020 2021-2025
-75%
Flaring reduction -50%1
Methane intensity -25%2
2025 2030
Zero routine
flaring
<0.2
Focus on capital efficiency and cash generationUpstream
28
0.9
-0.1
0.6
Av. 2016-18 Av. 2021-25Av. 2019-20
x 1.5

29
Repsol E&P priorities 2021-25
− FCF breakeven <$40/bbl
− Low capital intensity and
flexibility
− Generate €4.5 B FCF
@$50/bbl & $2.5 HH
− -15% OPEX reduction
Resilient
Value delivery
− Top leading project
profitability
− Short pay-back
− Digital program
− Reduction of -30% G&A
Focused
portfolio
− Value over volume
• Flexible production level
(~650kboed 2021-25)
• <14 countries
− Leaner and focused
exploration
Tier 1 CO2
emissions
− Emissions intensity
reduction of 75%
− Streamlining to a leaner
upstream portfolio
− Decline/exit of carbon
intensive and non-core
assets
FCF as a priority
(Leading FCF B-even)
Building optionality and strategic flexibility
1 2 3 4
29

30
Strong portfolio of short-cycle projects with attractive economics
Source: Wood Mackenzie GEM 4.32, Weighted by remaining Capex not including NA yet-to-drill wells. Peergroup: Apache, BP, Chevron, ConocoPhillips, Eni, Equinor, ExxonMobil, Occidental, OMV, Shell and Total. Figures in Projects mean Brent Breakeven (HH Breakeven for Marcellus)
22%
Peer1 Peer2 Peer3 Peer4 Peer5 Peer6 Peer7 Peer8 Peer9 Peer10 Peer11
Tier 1 New projects profitability
New Projects IRRweighted by Capex
PikkaOil
Leon MoccasinOil
BM-C-33Condensate/Gas
MexicoOil
SakakemangFixed price gas
Eagle Ford
Marcellus
Akacias
Lapa SW
BPTT
Shenzi N
UK
Yme
Highly profitable brownfields
Payback in ~3 yearsLow Capex/boe – using existing infrastructure
Decommissioning delays
Buckskin FFD
30
<40
~40
< 30
< 30< 2
~35
~40
< 40
< 40
< 40
~40
~40
Except Marcellus
HH BE
Brent
BE ($/bbl)
Brownfields
New projects

31
Legacy / Others
Exploration
1. Internal valueNote: Peers included: Apache, ConocoPhillips, OMV, Total, Shell, ENI, Occidental, Equinor, Exxonmobil, Chevron, BP, DevonSource: Wood Mackenzie Lens Upstream (15 Nov 2020)
CAPEX 21-25NPV Growth %, 2025 vs 2020
Maximizing value extracted from Capex
‒ Large CAPEX investment optionality,
allowing value maximization or easy
entry into Upstream harvest mode by
2025
1. No further exploration investment
2. Contingent resources with
post-2025 FID
3. Stop unconventional investment
2025+ Flexibility
Portfolio squeeze choices
Value maximization maintaining one of the lowest CAPEX intensity < $8/boe
20%
9%
71%
€8 B
Projects
(new projectsand brown-near fields developments)
31
Peer
5
Peer
1
Peer
2
Peer
3
Peer
4
Peer
7
Peer
6
Peer
8
Peer
9
Peer
10
Peer
11
Peer
12
Tier 1 (≥20%) Tier 2 (≥10%) Tier 3 (<10%)
Repsol: >20% NPV Growth1
Business as usual: maintaining
production level in 2025-2030 with
2 B$/year

32
0,0
1,0
2,0
3,0
4,0
5,0
6,0
7,0
8,0
CurrentPortfolio
Akacias Av. GOMprojects
YME Sakakemang Mexico Pikka BM C 33
11
High growth new barrels with lower
emission intensity
CCS
Note: The peers considered on the above chart are Eni, Gazprom, BHP, Conoco, Petronas, Hess, Anadarko, Exxon, Woodside, Equinor, CNPC, Total, Occidental, Kosmos, Marathon, CNOOC, Shell, OMV, Chevron, Petrobras, BP, Rosneft, Noble, Apache. 2019 DataSource: Wood Mackenzie Emissions Benchmarking Tool
Repsol to become tier 1 lowest carbon intensity
with a 75% reduction
Sakakemang:CCS project in FFD
phase with 1.5-2 Mt
CO2 per year
captured and a total
investment of €247 M
Emissions reduction
projects in most
intensive assets
Em
issio
ns In
ten
sit
y e
sti
ma
tio
n
High grading portfolio supporting carbon intensity reduction
New production pushes down emissions intensityEmissions intensity per barrel produced (kgCO2/boe)
Peer
1
Peer
3
Repsol N
ow
Peer
2
Peer
4
Peer
6
Peer
16
Peer
5
Peer
7
Peer
8
Peer
20
Peer
9
Peer
10
Peer
11
Peer
12
Peer
13
Peer
14
Peer
15
Peer
17
Peer
18
Peer
19
Peer
21
Peer
22
Peer
23
Peer
24
Repsol 20
25
Tier 3 (>40) Tier 2 (>20) Tier 1 (<20)
Energy efficiency and best technologies
Decline/exit of carbon intenisve and non-core assets
32
43

33
Upstream
Yield and New Platforms Yield and TransformationYield and Focus
Customer-centricIndustrial
Business Build
Low-carbon generation
Setting the new business priorities
33

34
CAPEX (B€)
0.6
2019
1.3
Av. 2021-22 Av. 2023-25
0.9
FCF (B€)
0.2
2019
0.7
Av. 2021-25
0.9
0.9
Low carbon
2025 BE1 reduction
>$1.5/bbl
+ 50%
1. For Refining business 2. Scope 1+2+3 emissions
Solid cashflow generation and new businesses build upIndustrial
34
CO2 reduction2 by 2025
> 2 Mt CO2

35
Maximizing yield and developing the next wave of profitable growth
Resilient and cash generator also in a
complex environment
0
2
1
Avg ’15-’19
CFFO (B€)
Avg ’23-’25Avg ’21-’22
IMC
$/bbl
Recovery precovidlevels by 2023
Maximizing margin across businesses
through a highly integrated position
1. Includes Spain and Peru R&M
YieldCash generation in a
complex environment
DigitalizationIndustry 4.0 driving integration
& improved decision making
Refining1 Chemicals Trading
‒ Net Cash Margin 1Q Solomon
and Wood Mackenzie
‒ Advantaged position
‒ Enhancing competitiveness and
operational performance
‒ Maximize the integration
and value from assets
‒ Incremental growth in key
products and markets
‒ Differentiation with high value
products
‒ Growth in incoming
opportunities
‒ Feedstock flexibility: 60%
LPGs to crackers vs 25% EU
average
‒ Automated and self-learning plant optimization based on real-time data
‒ Enhance asset availability to maximize output and optimize maintenance costs (-5% by 2025)
‒ Integrating value chain management through planning models based on AI and machine learning
‒ Smart energy optimizers to reduce consumption and GHG emissions (-0.1 Mt CO2)
‒ Leadership in new low-
carbon businesses
(hydrogen, waste to x, etc.)
‒ Circular platforms
(recycling and chemicals
from waste)
‒ Grow in low carbon
businesses (biogas/biofuels,
CO2, etc.)
1
2
3New platforms
6.6 3.8 5.2
35

36
2021 2025
1.4
Refining Margin Indicator
projections progressively recovering1
1. Repsol consistently above market reference (+$1.6/bbl '15-'19) 2. IHS NWE Sweet Cracking Refining Margin adjusted on homogeneous crude price basis @$50/bbl; projections from November 2020.
Maximizing margins
− Supply chain: Greater integration with
Trading / Petrochemicals
− Further digitalization of planning and
operation
− Operational excellence: Energy Intensity
Index (25-25 Plan), up to 97% operational
availability, yields optimization
/ Maximizing margins
EBITDA refining margin breakeven
@Repsol contribution margin indicator ($/bbl)Repsol contribution margin indicator ($/bbl)
Strong focus on competitiveness increase Reducing breakeven to
support cashflow generation
2022
5.0
4.0
'15-’19 Avg
4.2
2021
1.9 2.3
2025
6.6
3.5
5.8
Reference2
Repsol contribution margin indicator differential vs. reference
Maximizing margins
Opex Optimization
New decarbonization platforms returns
Maintaining competitiveness in a complex environmentRefining
1.6 1.7
1.61.6
<$0/bbl
36

37
25/25 decarbonization program with strong contribution to margin improvement and CO2 reduction
>20% estimated IRR
€0.4 B Total
Capex
>200Initiatives identified
Industrial energy efficiency
2021-2025
• Adopting best-in-class
technologies
• Exploration of energy
use opportunities and
utilities optimization
• Digitalization of
operations and
integration with AI
Maximizing energy efficiency with attractive returns New low carbon business selected projects
-0.8 Mt CO2 reduction1
C43: Waste & UCOs treatment plant
Advanced HVO plant - Reducing 900 kt/y CO2 emissions
Biogas generation plant from urban waste
Biogas to substitute traditional fuel consumption
Investment Capacity
Investment Capacity
€188 M250 kta
300 kta
Sustainable biofuels
From waste per year
10 kta€20 M Urban waste
Cartagena
Chemicals circularity‒ Zero project: chemical recycling of
used plastics
‒ Reciclex project: mechanical
recycling of polyolefins
Investment Capacity
74 kta€70 M Circular polyolefins2
Petronor
Net zero emissions fuel plant
E-fuel production from renewable hydrogen (electrolysis) and CO2
Investment Capacity
€60 M 10 MW Electrolyzer
Petronor
Puertollano
1. Scope 1+2 emissions 2. Recycle 20% equivalent of our polyolefins production by 2030, target to which other technologies will also contribute (e.g. gasification)37

38
Upstream
Yield and New Platforms Yield and TransformationYield and Focus
Customer-centricIndustrial
Business Build
Low-carbon generation
Setting the new business priorities
38

39
2020 2025
2,000
8,000
Digital customers ('000)
P&G +
E-Mobility
customers
2019 2020 2025
1.00.9
1.4
Mobility contribution margin (M€)
Non-oil contribution margin (M€)
EBITDA (B€)
202520202019
0.60.5
0.8
FCF (B€)
X 4.0
x 1.151,100 k 2,000 k
Growth ambition with strong FCF generationCustomer Centric Business
X 1.4
X 1.3
x 1.2539

40
#1 Most
acknowledged
energy brand
in Spain2
0.7
CCB EBITDA evolution (M€)
>4,300
Service
Stations
>1,000
Operated sites
>24 M
customers
~10 M registered
customers
Leading market shares1
Fuels 34% (#1)
LPG 74% (#1)
Lubes 26% (#1)
P&G 3% (#5)
23% (#2)
20% (#3)
19% (#3)
2015
0.04
1.0
0.1
0.2
2019
0.7 0.7
Launch of TwP3
Program
Mobility6
LAS5
P&G4
LPG
Spain Portugal
Building on a position of leadership with a successful transformation track-recordCustomer Centric Business
x 1.4
40
1. Market shares in volume except for P&G Spain, in customers. Values provided correspond to 2019; 2. Repsol Brand Image and Positioning Study based on the question (January 2019): On a scale 0 – 10: How good do you believe is the image of the following companies?3. Transforming while Performing 4. Includes Retail P&G and P&G Central Costs 5. Lubricants, Asphalts and Specialties 6. Includes service stations Spain, wholesale Spain & International aviation, Mobility Portugal, Mobility Mexico, Mobility Italy and Central Mobility costNote: Operating and financial leases are included as expenses within Financials. Growth presented as net growth from 2015 to 2019.

41
Ambition to become the leading multi-energy retailer in Iberia
Accompanying our >24 M customers through the energy transition with the ambition and the competitive edge to become their end-to-end multi-energy supplier
Multi-energy customer-centric approach
Unique value proposition and a set of competitive advantages that cannot be
replicated by competitors and brings superior growth and better economics
Traditional commercial
business (Mobility, LPG,..)
6 M loyalty cards +
2 M users
New energy transition businesses
(eMobility, Energy Services…)
200 k
carsharing users
P&G retail
>250 k clients leveraging
joint offers (with mobility)
>24 M current
clients
>1 M current
clients
41

42
Strategic drivers
in Energy
Transition
Key
foundations
More autonomous management, strengthening entrepreneurship cultureWays of
working
Longstanding Iberian
Energy Leader
Mobility leader in
continuous
transformation
High-growth power
customer business
World-class digital
Expand digit platforms for customer engagement (Waylet & Vivit apps), with AI based personalization and advanced pricing
Customer centricity
Roll out the new transversal loyalty program, developing engagement with end customers
Multi-energy
Cross-sell to current customers and channels, adding new services (E-Mobility, Energy Services & Advanced mobility services)
Strong and growing profits and cash generationCustomer-Centric Businesses Strategy 2021-25
42

43New transversal loyalty program to reach 8 M customers (100% digital) and generate incremental margin by 2025
Launching Repsol's Transversal Loyalty Program to orchestrate customer-centric multienergy approach across customer base
Transversal
loyalty Program
repsol.es
Other digital assets
‒ Integrated customer data
‒ Seamless customer experience
‒ Data driven personalization
‒ Promotions and benefits
‒ Partner ecosystem
Mobilityapp
Home app
43
>10 MRepsol registered
customers
2 MRepsol digital
customers
>24 MRepsol customers
>35 MEnergy customers
Engage customers
Cross-sell multi-energy
>8 M customers
by 2025

44
Home
products
More than double growth in enhancing contribution margin per customer
Unique position to serve the multi-energy needs of our customers
Mobility Services
E-mobility
Biofuels & synthetic fuels
Traditional fuels
Autogas& NGV
CO2 offset
Power & Gas
New Energy Services –
Distributed generation
LPG servicesConvenience
stores
Mobility
products
Home
Services
+ Customers
+ Customers
Cross
Customers
Mobility Home
Mobility
Services
Margin (€/customer)
P&G value-added services
44

45
Upstream
Yield and New Platforms Yield and TransformationYield and Focus
Customer-centricIndustrial
Business Build
Low-carbon generation
Setting the new business priorities
45

46
2019
331
2025
40
Equity IRR with PPA
0.2
20202019 2025
0.6
1.4
2020
1.6
2019
1.6
3.0
0.61.1
0.6
5.2
1.6
2025
0.6
12.7
1.6
2030
3.3
7.5
15.0
0.7
Capex (B€) Gross EBITDA2 (M€)Low carbon consolidated1 capacity (GW)
Cogenerations
RES (incl. hydro)
CCGT
>10%
Building a new business with ambitious targetsLow carbon generation
X 8
X 2.5
x 8
0.6
46Note: Spanish average power price 42,5 €/MW 1. Consolidated capacity refers to capacity available at year end 2. Excludes structure costs. 2025 EBITDA estimated assuming 2025 consolidated capacity is operating during the whole year for comparative reasons. Figure considering only estimated operating capacity of 7.4 GW is €321 M Note: Gross Capex, capacity, and gross EBITDA considers 50% WI in Chile and 100% WI in Spain and rest of the world. EBITDA and Capex figures do not include cogenerations
Spanish average power price
42,5 €/MWh

471. RES: Considering 100% in Spain and International (excl. Chile) and 50% JV stake in Chile 2. Not including other conventional generation as Cogeneration (622 MW) and CCGTs (1,648 MW)
Phase I2019
− Launch organic growth – development of
Ready to Build and earlier stage assets
− Develop RES capabilities and project
pipeline
Estimated low carbon operating capacity (GW)1
− Build and put in operation pipeline, with more
than 500 MW per year in early-stage assets
− Create international platforms
Phase II2020-2025
− Accelerate organic development to
more than 1 GW per year
− Optimize portfolio with an opportunistic
approach
Phase III2026-2030
Developing a competitive RES player with international platforms
Spain2
1.0 GW
2.0 GW
0.7 GW
1.7 GW
1.4 GW
2.3 GW
2025
2030
International
0.7 GW
3.1 GW
1.3 GW
3.6 GW
2025
2030
InternationalDeveloping pipeline and
exploring opportunities in
several other markets in
Europe and Americas
Spain
RES technologically balanced: demand
coupling and capture price & growth
• Pursing Aguayo pumped storage
optionality (1GW)
3.0 Gw
7.5 Gw
15 Gw
47
ChileHighly sophisticated market
with stable and mature
regulatory framework
• 50% JV with Ibereólica

481. Greenfield projects with interconnection rights, including solar hybridization projects in wind portfolio2. COD: Commercial Operation Date 3. Estimated figures average for wind and solar projects without selling down equity stakes Note: Considering 50% JV stake in Chile
Strong portfolio of advanced stage projects with short term material growth and robust profitability
Boosting project returns through management excellence and scale
+3-4%IRR3
Aguayo project (Cantabria),
pumped storage of 1,000 MW,
to start construction in 2022/23
Spain
175 MW
2021/2022
PI
Castilla y León
335 MW
2020
DELTA
Aragón
860 MW
2021/2023
DELTA II
Aragón
126 MW
2021
Kappa
Castilla la
Mancha
204 MW
2022
SIGMA
Andalucía
Operating capacity
@ End 2020Capacity
COD2
‒ Reduced development costs
‒ Best-in-class construction and operations
‒ Energy management
‒ Optimized financing structure
Under
constructionHigh visibility
pipeline
264 MW
2021
Valdesolar
Extremadura
5 MW
2020Windfloat
385 MW
2023
Antofagasta
PE
275 MW
2021 (137.5 MW)
2022 (137.5 MW)
Elena
Chile
39 MW
2020
Cabo
Leonés
III
90 MW
2022Atacama
55 MW
2021
Cabo
Leonés
III
Add. pipeline
482MW1
48

Strategy 2021-25:
Stepping up the
Transition
2025+ advantaged
zero-carbon business
platforms
04.

50
Decarbonization is an opportunity to build business platforms
as technology evolves
Industrial transformation
1. Forestry JV
Customer-centric businesses
Carbon sinks
Renewable generation
Advanced biofuels,
biogas and recycling
Renewable hydrogen Synthetic fuels (e-fuels)
Dual-platform advanced mobility
Low carbon power retail
+ Energy Solutions
Hybrid plants
Stationary energy storage
Natural Climate Solutions1
Carbon Capture Utilization & Storage
50
2020-20252025-2030 +2030

51
Ambition to become a leader in the Iberian PeninsulaRenewable Hydrogen
51
Multi-technology
approachproviding flexibility,
and optimizing production Electrolysis Biomethanein existing SMRs1
Photoelectrocatalysisproprietary technology
Largest H2 consumer(72%) and producer in SpainPrivileged integrated position allowing
arbitrage between self-consumption
and other final uses
Transportation
and e-fuelleveraging SSs
Gas network injectionblended with gas for
residential and industrial use
Industrial
feedstockto other players
Electricity storagefor flexible power
generation
0.4
1.2
2025 2030
Renewable H2 capacityunder development
[GWeq]
Clear ambition2 to become Iberian leader
Repsol to become an active H2 playeracross uses, and a strategic partner to develop the
Government ambition
1. Steam reformer 2. Repsol's hydrogen ambition conditioned to access to regulatory changes and availability of EU recovery funds Plan 3. Considering a ratio of 0.02 t/h per MW and 8,000 hours of operation per year based on Repsol's past projects
64 kt/yH2
production3 192 kt/y

52
Repsol's with an advantageous position resulting in tier#1 LCOH1 ~30%
lower vs. a local renewable H2 producer
− Renewable H2 production from biomethane to become competitive in the short term
− Integration in current sites and with own renewable power generation
Repsol best positioned to lead H2 development and cost competitiveness as the main consumer in Spain
(vs. non-consuming players interested in high prices to drive production)
+35% production cost
-30%
-20-40% production cost
Renewable H2 production cost for an av. player in Spain (€/kg) Production cost via electrolysis in 20302 (€/kg)
-30%
Av. player Av. player
2019 2030Spain Germany
Competitiveness of electrolytic vs.
fossil fuel H2, expected by 2030,
could be brought forward by
‒ Technology cost reduction
(massive adoption)
‒ Higher carbon price
‒ Regulatory mechanisms, as/if
needed
Spain, the best EU location to produce hydrogen with
electrolyzers
‒ Lower production costs due to better renewable resource
‒ Spain reaching renewable H2 (with electrolyzers)
competitiveness five years before Germany
Repsol with clear advantages in renewable hydrogen productionRenewable Hydrogen
52
1. Levelized Cost of Hydrogen assuming 50% of the renewable H2 production made with biomethane and the remaining 50% with electrolyzers. 2. Spain with an average LCOE of €33.2/MWh and Germany with an av. LCOE of €48.3/MWh in 2030

53
Leveraging our tier one industrial sites to
produce biofuels in own facilities through
modifications of current units
− Lower Capex: <€500/t in existing plants
(vs. >€1000/t of peer's new plants)
Positioning, scale and relevance of our
industrial hubs key to secure feedstock
Already a leading biofuels producer, and
first biofuels marketer in Spain
(66% share)
1.3
Current Capacity
0.7
2030 planTotal 2025 capacity2
> 2.0
Sustainable biofuels gross production (Mta)
Updated ambition: from 600kt of HVO
to >2 Mt of sustainable biofuels
‒ > 65% of biofuels produced from waste by 2030 (up to
100% potentially to satisfy market or regulation demands)
‒ Large availability of required feedstock with flexibility
between alternatives
‒ ~4 Mt of waste3 to be used as raw materials by 2030Repsol with a leading sustainable biofuels ambition
Average projects IRR >15%
Use of wastes as feedstock
Biomass
Refused Derived Fuel
Lipid wastes
Organic wastes
Repsol best positioned for sustainable
biofuels production
Reaching > 2 Mta of sustainable
biofuels in 20301
With a multi-technology and raw
material approach
1. Gross volumes 2. Expected capacity of sustainable biofuels by 2025 includes: 700 kt/y from current existing capacity, 250 kt/y capacity from the advanced biofuels plant in Cartagena, 130 kt/y capacity from a gasification plant to produce methanol and ~300 kt/y capacity through modifications in existing units. 3. Gross volume. It includes Repsol’s whole circular strategy: biofuels, circular chemical products and plastics and biogas production
Repsol becoming an advantaged producerSustainable biofuels
X 3
53

54
Medium-term technologies:‒ Additional Waste-to-Energy‒ High/Medium concentration CCS
projects‒ First renewable hydrogen projects‒ CCU projects‒ Renewables + Storage‒ Remaining efficiency initiatives
25
-50
110
0 13 15
100
17
-100
50
9
25 Mt (Scope 1&2)
Portfolio mgmt.
Wave 1
Early-stage technologies, with uncertain costs:
‒ CCS (depends on access to storage projects)
‒ CCU technologies (e.g. efuels)
‒ Renewable hydrogen at scale
‒ Further electrification (Power-to-Heat, etc.)
Repsol CO2 reference price €35/t
Wave 2
Mton CO2
Repsol abatement cost curve in 2030 (€/t CO2e). Scope 1+2
Long term
Efficiency
Flaring
CCUS
Renewables
Waste
Hydrogen
Early stage tech.
Wave 1 (2020-2025)
Profitable initiatives:‒ Energy Efficiency‒ Methane & flaring initiatives‒ Renewable power for Scope 2 emissions‒ Waste-to-Energy with cheaper waste
Wave 2 (2025-2030)
H2 abatement cost potentially lowered, driven by
technology development and regulatory support
Note: High level estimation based on Repsol identified initiatives + benchmarks; Source: Repsol
Pipeline of initiatives prioritized through the abatement curve
Portfolio management / Reduction of high-emitting barrels
54

55
-100
-80
-60
-40
-20
0
CII reduction breakdown by decarbonization lever
2019 Low Carbon
Fuels &
Circularity
Low
Carbon
Power Gen
Technology
Breakthroughs
& Carbon Sinks
2030Efficiency
25%
2.9%
Portfolio
Transfor-
mation
CII evolution: Repsol speeds up the transformation by increasing its carbon reduction targets from 20% to 25% by 2030
204520252015 2020 20502030 2035 2040
% CII reduction (baseline 2016)
De-carbonization commitments High-Tech Scenario
Further Technology
evolution and
offsetting initiatives
supporting Net zero
-25%
-12%
-50%
-80%
A clear decarbonization pathway towards net zero in 2050
% CII reduction (baseline 2016)
55
Strategy 2021-25:
Stepping up the Transition
New operating model
04.

57
Strategic talent management
Organizational agility
Enhance workforce planning,
reskilling and upskilling to
face digitalization, new
businesses and decarb.
Boost
Data driven
culture
New and adapted
professional
development
framework
Diversity
and inclusion
Agile & Lean
New Ways of Working
all across the value
chain
Simplify the Corporate
Center and accelerate
the Global Services
model
Promote flexibility,
productivity and
work-life balance
More inspiring and
entrepreneurial
leadership
-20%directors
-20%corporate costs
-20%management layer1
>35%female leadership
1stquartile
Repsol leadership index2
>70%score in Repsol Culture
Index2
2025 targets
A new operating model driven by a lean and vanguard mindsetMore efficient and agile
571. Only in Corporate and Businesses Central Areas 2. Repsol historically conducts Leadership and Culture indexes based on a methodology supported by external consultancy

58
E&P
Commercial Businesses
Industrial & Trading
Corporation
2,000+ Mobile app users in our
refineries
0.5% Gross production
increase in our assets +$0.4/bbl Refining margin increase
due to digital initiatives
2,500+ Servers running
in cloud infrastructure
2 MDigital customers
registered in Waylet app 100 k+ Executed operations through
intelligent software robots
150 kDaily clients managed
with new Salesforce
platform
-7% Reduction of drilling
operation time 90 136
Incremental economic impact
(CFFO + Capex savings, M€)
Digital program investments
(CapEx+OpEx, M€)
2018 2020e
120+# Digital initiatives 250+
External recognition
Repsol, a leader in the energy transition … a
great example of digital performance, real
business transformation and value contribution
Repsol … launched an ambitious digital
transformation effort … (that is generating)
essential contributions to its business
model
World-Class DigitalAlready transforming how we operate our businesses
82
308
58

59
Artificial
Intelligence
Automated
operations
Customer
Centricity
Cloud Technology
Improve operational efficiency of our
industrial assets including digital twin,
operations centers, robotics and IoT
“Artificial intelligence first” approach as a
key lever to build a data driven company,
embedded at every business process
Enable best-in-class digital customer-
centric multi-energy company with a
global customer 360º view
Complete journey to a hybrid multicloud
extracting all the benefits in terms of cost
savings, agility and flexibility
Repsol Data Platform
Enhance our data & analytics platform, speed
up AI – based cases through our accelerator
program and re / up - skill our employees in
our data school
ARiA€160 M/year
Average Digital CapEx + Opex
in 21–22 period
€800 MIncremental CFFO + CapEx
savings in 2022 vs 2018
Taking digitalization to the next level, delivering €800 M impact to 2022World-Class Digital
59

60
Focused on advanced mobility
and renewables, low carbon
and circular economy, and
digital technology for assets
optimization, with a current
portfolio of 18 start-ups and
taking part in OGCI CI Fund
80% of its investment in
energy transition initiatives
Relevant technological achievements (Examples)Our goal to transform the energy sector through technology innovation
Industrial processes disruptionCharacterization of crudes combining spectrometry and deep learning
‒ 90% reduction in response time, 50% reduction in testing costs,
and €10 M/y captured
Testing more than 40 wastes and technologies for advanced biofuels
and circular plastics
Tech contribution to NetZero
Renewable H2 production from solar energy (photoelectrocatalysis)
‒ Existing pilot plant, currently escalating in industrial
demonstration project with a partner
Bilbao hub to produce e-fuels and gas from waste
Product design with computational chemistry and machine learning
‒ Predictive model, reducing response time 70% and costs 50%
Product design processes shortened
26patents in
2018-19
+190 alliances to transform
energy sector
Repsol Technology Lab
Repsol Ventures Fund
Great Repsol tech platform to support business de-carbonization and transformationTechnology Driven
60

Leading Investment Case
05.

62
FINANCIAL DISCIPLINE
Resilient shareholder distribution…
2021
2022-2025
€0.6/sh dividend paid in cash
(except Jan 2021)
– Committed @$40/bbl Brent
Increase dividend in cash:
– Yearly from 2023, to €0.75/sh by 2025
Additional share-buyback (50 M sh/y)1,
achieving > €1/sh in 2025
– €1.4-2.0B allocated to SBB in 2022-25
… growing with organic excess cash at SP price deck
2021
SBBSBB
0.650.60
2022 2023
SBB
0.70
2024
SBB
0.75
2025
0.60
0.89> 1.00
RESILIENT DIVIDEND GROWING DIVIDEND
Buyback
Dividend
+25%
Leading shareholder distribution2021-2025 Highlights
62
€/share
Av. 2021-25 distribution reduction < 15% vs. previous proposition
1. 200 M shares in the SP period

63
Dividend Yield1 2020 (%)
Source: Company announcements; Capital IQ1. Post-cuts dividends considered for all peers and assuming a constant value across the year (average share price between July 1st and November 11th 2020). 2. Considering 2021 announced dividend per share of €0.6.Note: Peer companies considered are BP, Eni, Equinor, Shell and Total
Peer 4Peer 1 2025 21-25
Avg.
Peer 3Peer 2 Peer 5
Dividend/
CFFO '19
New announced distribution schemes @$50/bbl Brent,
compared to pre-cuts proposition (%)
Conditioned
to debt reduction
At SP price deck, Repsol offers the largest resilient dividend and
a fast-growing shareholder distribution capacity compared with peers
Cash dividend Avg Dividend Growth '21-'25 Buybacks
Pre-cuts Dividend
9.1%2
4.5%
6.2%
8.5%
4.8%
2.9%
16% 33% 16% 11% 11%12%
6.1% Avg.
Repsol with a leading dividend yield and dividend coverage among peers
Peer 1 Peer 2 Peer 3 Peer 4 Peer 5
63
< 15% distributions cut

64
Cumulative sources and uses of cash, 2021-2025 (B€) 2021-2025 B-even post-dividends ($/bbl)
CFFO
Corporate Low carbon gen. UpstreamCCB Industrial
Self-financed plan Cash generation
1. Includes RES portfolio divestments. Other potential inorganic transactions driven by new corporate model, are not included in this Sources and Uses of cash. 2. Includes interests and others as dividend to minority shareholders and hybrid bond interests
$50/bblFCF BE(inc. SBB)
Financials2
Capex
Divestments1
1.4
12.6
0.3
Sources
0.75.0
9.4
2.0
4.7
29.4
4.4
18.3
Uses
29.4Shares buyback
& Optionalities
Dividends
1.4
64
< $45/bbl
FCF BE
pre-SBB

65
3.4
5.7
Proforma 2020
3.9
9.1
2021-22 2023-25
2.9
1. Gearing ratio defined as reported net debt / (net debt + equity)
Debt Maturities
Strong Liquidity Position
Proforma 2020 (Billion €)
‒ Gearing1 threshold clearly below 30%‒ Current liquidity covering > 1.3 times total maturities in the whole period
‒ Affordable and well-distributed maturities through the SP horizon
‒ Diversified financing sources including hybrids
2021-2025 gearing1 25% average
Committed Credit lines Cash & Eq. Maturities
Specific gearing target range, preserving a strong financial structure
Same Debt with strong EBITDA growth
65
€8.2 B

66
CAPEX flexibility
0
Upstream project deferrals
Unconventionals
Exploration
Value CAPEX
1
Profitable growth in
our existing portfolio
Shareholder
distribution
2
Cash dividend
increase and SBB
capacity
Additional
Low carbon CAPEX
3
Customer-centric
RES
Green industrial
Extra
shareholder distribution
4
Dividend growth
Additional SBB
If Price deck worsens
At base case
If Price deck improves
Clear cash allocation framework, preserving our prudent financial policy
Gearing discipline and commitment with our current credit rating
6666

67
2.1
0.6€/sh €/sh
Adjusted1 2019
0.8
2025
2.6
1.0
2025Adjusted1 2019
1.8
+20%CAGR
FCF per share
€/sh
Adjusted1 2019 2025
3.3
5.0
+20%
CAGR
+7%
CAGR+10%
CAGR
3.22.25.7
Strong growth in per share metrics driving valuation upsides
+7%CAGR
CFFO per share
+10%CAGR
Adjusted Net Income per share
671. 2019 @$50/bbl & $2.5 HH
Note: Base scenario @$50/bbl & $2.5 HH; Nº of shares in 2019 (1,527) vs 2025 (1,327, subject to Base Case price deck)
High scenario @$60/bbl Brent & $3/Mbtu HHAcid scenario @$40/bbl Brent & $2.5/Mbtu HH
2.11.5
4.6

Conclusions
06.

69
Leading the
journey
to an ambitious
destination
Delivering a compelling investment case into the TransitionStrategic Plan 2021-2025. Driving growth and value with capital discipline
Profitable and achievable Net Zero12% CII reduction by 2025
ROACE 25 +2 p.p.
Profitable business platforms
‒ 2021-22: Resilience and Strength
‒ 2023-25: Accelerate transformation
FCF 21-25: €2.2 B/y
EPS 25: €1.8/share
CFFO/share +7% CAGR 19-25
RES partner or IPO
DPS: €0.6/sh 2021 ; €0.75/sh 2025
• SBB: 50 M share/y from 2022
New Operating model
Distinctive ambition for transformation
69
30% low carbon CAPEX 21-25
FCF generation
Top quartile distribution
Note: Targets at Strategic Plan price deck ($50/bbl and $2.5/Mbtu)
Prudent financial policy Gearing 21-25: ~25%

StrategicPlan2021-2025
Stepping up the TransitionDriving growth and value
70

Appendix

72
Projections (2021-2025)
Scenario assumptions
CFFO1 Sensitivities
2021 2022 2023 2024 2025
Brent price ($/bbl) 50 50 50 50 50
Henry Hub Price ($/Mbtu) 2.5 2.5 2.5 2.5 2.5
Repsol Refining Margin indicator ($/bbl) 3.5 4.0 4.5 5.2 5.8
Spanish average power price (€/MWh) 42.5 42.5 42.5 42.5 42.5
1. Average value for the 2021-2025 period. Note: Average exchange rate assumed for the period 2021-2025: 1.13$/€
± $10/bbl BRENT ± $0.5/Mbtu HH ± $0.5/bbl Refining margin
± €540 M/y ± €164 M/y ± €92 M/y
72

731. 2016 baseline 2. Corporate Human Rights benchmark. 3. WHT&G included 4. Lubricants, Asphalts and Specialties Note: 2019 @$50/bbl & $2.5 HH
2021-2025
0.9
2016-2020
4.5
FCF (B€) 2021-25 @50/2.5
5.1
FCF (B€)
2019
1.4
2025
1.0
EBITDA (B€)
Digital
customers
in 2025
Low-carbon capacity (GW)
+4.5 GW of RES
capacity increase in
2019-2025
20252019
3.0
7.5
1st quartile in CHRB2
At least 40% of LTI for
CEO and senior
management linked to
sustainability goals
12% IIC reduction1
2025
Low-carbongeneration
Customer-centricIndustrialUpstream ESG
8 M
Main business value growth and ESG KPIs and commitments
X 5+ 0.34
x2.5
2021-2025
5.1
2016-2020
4.3
Refining
Digital
Yield
▪ Efficiencies /
BE reduction
Trading 3
New Platforms
Chemicals
Peru R&M
73
Mobility
P&G Retail
LPG
LAS4

74
Refining1 Low Carbon Gen
1.0
Upstream
1.0
Chemicals Trading &
Wholesale Gas
Customer-
Centric
Businesses
2.0
4.3
Repsol Total
1.3
4.3
0.30.4
0.04 7.3
Note: Excludes Central, Corporation & Adjustments1. Includes Refining Spain and Peru 2. Lubricants; Asphalts and Specialties
1.0
0.10.04
0.2
0.7
2019
P&G
LAS2
LPG
Mobility
Customer-
Centric
Businesses
EBITDA 2019 breakdown by business
Repsol Group EBITDA 2019 (B€) CCB EBITDA 2019 (B€)
Upstream Industrial Customer Centric Low Carbon gen