pittcon external seminar template x-ray analysis in...
TRANSCRIPT
1 The world leader in serving science
Al Martin, Christopher Shaffer, Thermo Fisher Scientific, West Palm Beach, USA
Pittcon External Seminar Template X-ray Analysis in Petrochemical Industry: Challenges and Solutions
2
XRF and Petroleum Applications
• Petroleum and polymer industry products continually evolving • Chemical makeup of polymers, lubricants, and fuels altered
constantly to meet new functional demands • Today's XRF system must be able to satisfy not only today’s
requirements but also tomorrows needs:
More complex formulations
Stricter emissions regulations and norms
Increased FCC cracking and hydrocracking (catalyst processes)
Growth of biofuels
Never-ending drive for lower costs and improved quality
3
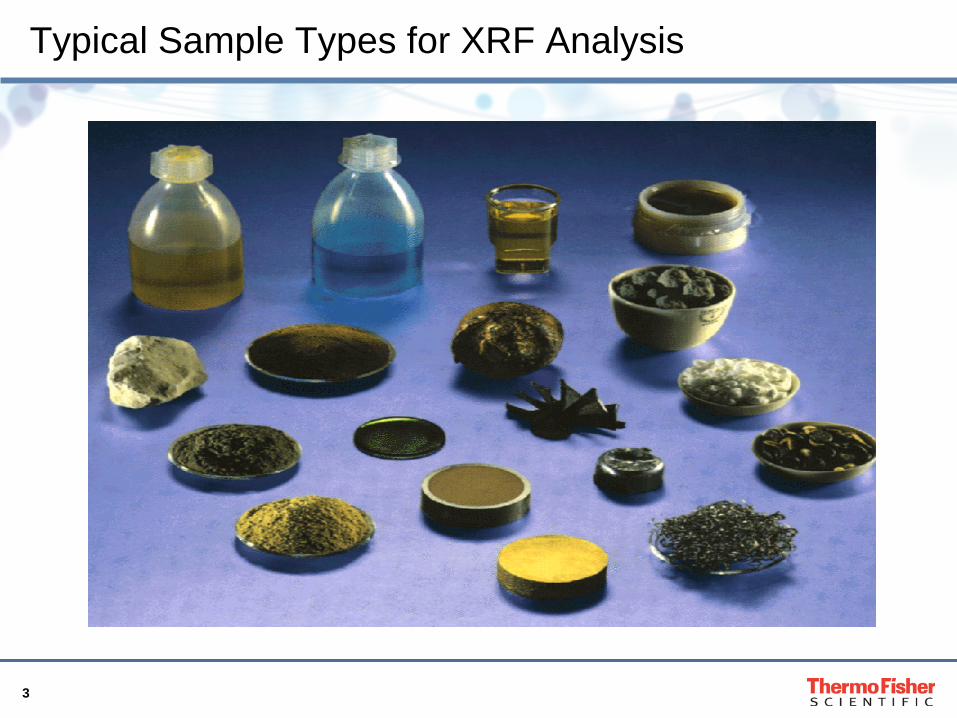
Typical Sample Types for XRF Analysis

4
XRF in the Laboratory: Typical Analytical Ranges
ICP-MS
ICP-AES
GFAAS
AAS
1 ppq 1 ppt 1 ppb 1 ppm 1,000 ppm 100%
X-ray Fluorescence
Arc-Spark OES
TRACE BULK
Liquids
Solids
Combustion : TOC; TN; TS, TOX

5
Sample Preparation
• Compared with other analytical methods, XRF is the simplest • No hot digest or potential dangers through acid use • Sample cups simple to assemble, liquid handling minimal • Assortment of sample cups and support films make any
analysis safe and easy • Components within instrument offers further protection to
optical path • For liquids – assemble sample cup and pour liquid to specific
volume or weight • For solids – same as liquids, or pelletize to form pressed
pellet • Disposal of sample in bulk liquid container or for powder and
pellets – simply discard

6
Petroleum Product Applications
• Gasoline • Naphtha • Diesel fuels • Kerosene • Jet fuel • Gas oils • Residual fuels • Crude oil • Biofuels • Lubricant additives • Lubricant blending • FCC catalysts • Coke • Additives

7
Polymers and Additives
• Accelerants • Anti-degradants • Anti-foams • Anti-oxidants • Anti-ozonates • Blowing agents • Coupling agents • Cross linking agents • Fillers
• Flame retardants • Plasticizers • Processing aids • Retarders • Stearates • UV stabilizers • Vegetable oils • Others
Performance of today’s polymers is synonymous with additives:

8
X-ray Product Portfolio
Thermo Scientific™ ARL™ QUANT’X
EDXRF Spectrometer: Top performance EDXRF
Thermo Scientific™ ARL™ PERFORM’X
WDXRF Spectrometer: High Performance Sequential
XRF 1500W-4200W
Thermo Scientific™ ARL™ OPTIM’X
WDXRF Spectrometer: Unique Configuration WDXRF 50W-200W

9
Strengths of the ARL QUANT’X EDXRF Spectrometer
• Electrically (Peltier) cooled Si(Li) detector • No liquid nitrogen required • Si(Li) detector • Long Life
• 8 primary beam filters
• Optimized peak to background ratios for all elements (Na – U)
• Choice of excitation voltages: 4kV to 50kV • Can be changed by steps of 1kV • 4kV = lowest excitation voltage in the market → Cement analysis • 50kV allows for K line excitation of heavy elements (Cd, Sn, Sb, Ba)
• Software
• Thermo Scientific WinTrace software is intuitive and powerful • Thermo Scientific™ UniQuant™ standard-less analytical software makes
using an EDXRF easy
10
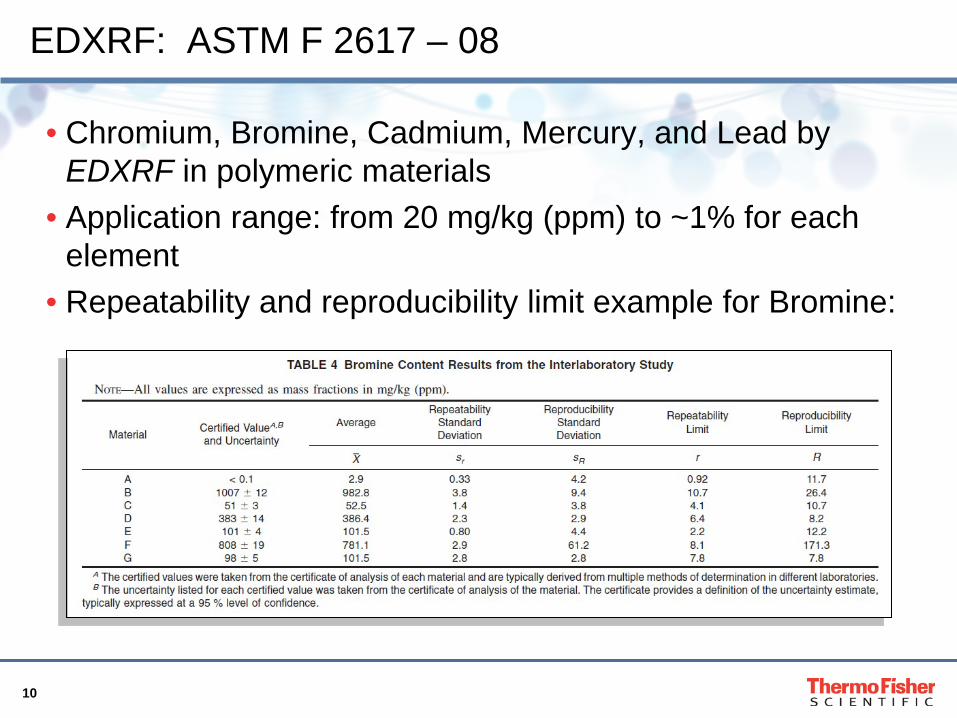
EDXRF: ASTM F 2617 – 08
• Chromium, Bromine, Cadmium, Mercury, and Lead by EDXRF in polymeric materials
• Application range: from 20 mg/kg (ppm) to ~1% for each element
• Repeatability and reproducibility limit example for Bromine:

11
EDXRF Result: Si(Li) Detector, Low Power (50W)
• ARL QUANT’X EDXRF spectrometer with Peltier-cooled Si(Li) detector
• Total 500s counting time
• LOD achieved Restriction • Cr 2.0 ppm <1000 ppm • Br 1.0 ppm <1000 ppm • Cd 1.5 ppm <100 ppm • Hg 1.3 ppm <1000 ppm • Pb 1.3 ppm <1000 ppm

12
EDXRF Result: PVC Containing Cd and Pb
• ARL QUANT’X spectrometer with Peltier-cooled Si(Li) detector
• Total 200s counting time • Difference between 85
ppm and 35 ppm is easy to quantify

13
Other ARL QUANT’X Examples
Analysis of Liquid Hazardous Waste Fuels (LHWF) per ASTM D5839 Cr, Ag, Cd, Sb, Pb

14
X-ray Product Portfolio
Thermo Scientific™ ARL™ QUANT’X
EDXRF Spectrometer: Top performance EDXRF
Thermo Scientific™ ARL™ PERFORM’X
WDXRF Spectrometer: High Performance Sequential
XRF 1500W-4200W
Thermo Scientific™ ARL™ OPTIM’X
WDXRF Spectrometer: Unique Configuration WDXRF 50W-200W
15
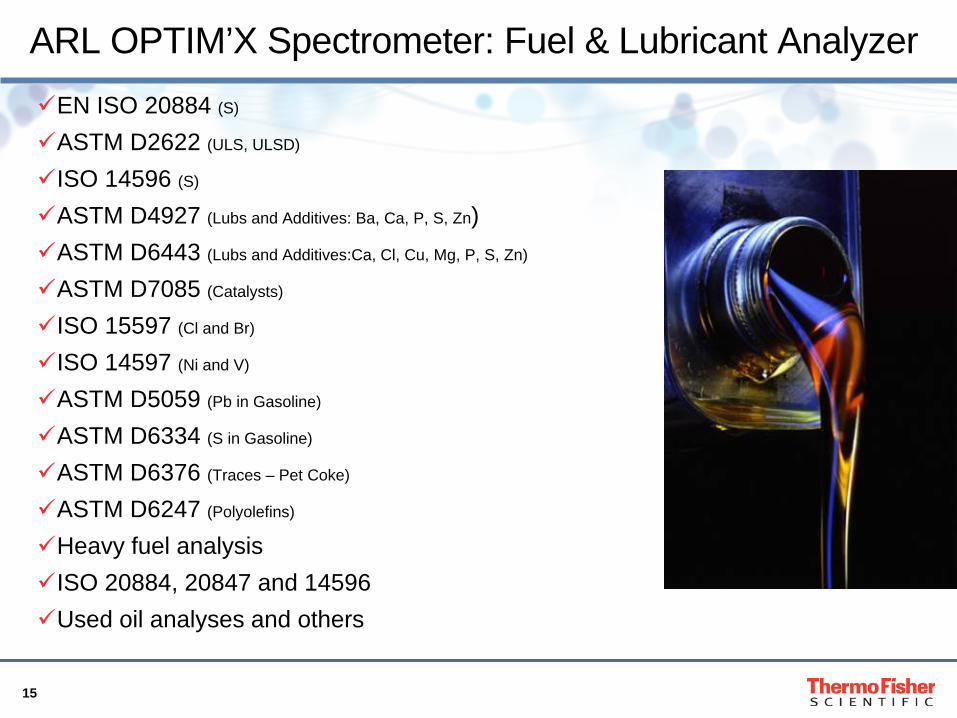
ARL OPTIM’X Spectrometer: Fuel & Lubricant Analyzer EN ISO 20884 (S)
ASTM D2622 (ULS, ULSD)
ISO 14596 (S)
ASTM D4927 (Lubs and Additives: Ba, Ca, P, S, Zn) ASTM D6443 (Lubs and Additives:Ca, Cl, Cu, Mg, P, S, Zn)
ASTM D7085 (Catalysts)
ISO 15597 (Cl and Br)
ISO 14597 (Ni and V)
ASTM D5059 (Pb in Gasoline)
ASTM D6334 (S in Gasoline)
ASTM D6376 (Traces – Pet Coke)
ASTM D6247 (Polyolefins)
Heavy fuel analysis ISO 20884, 20847 and 14596 Used oil analyses and others
16
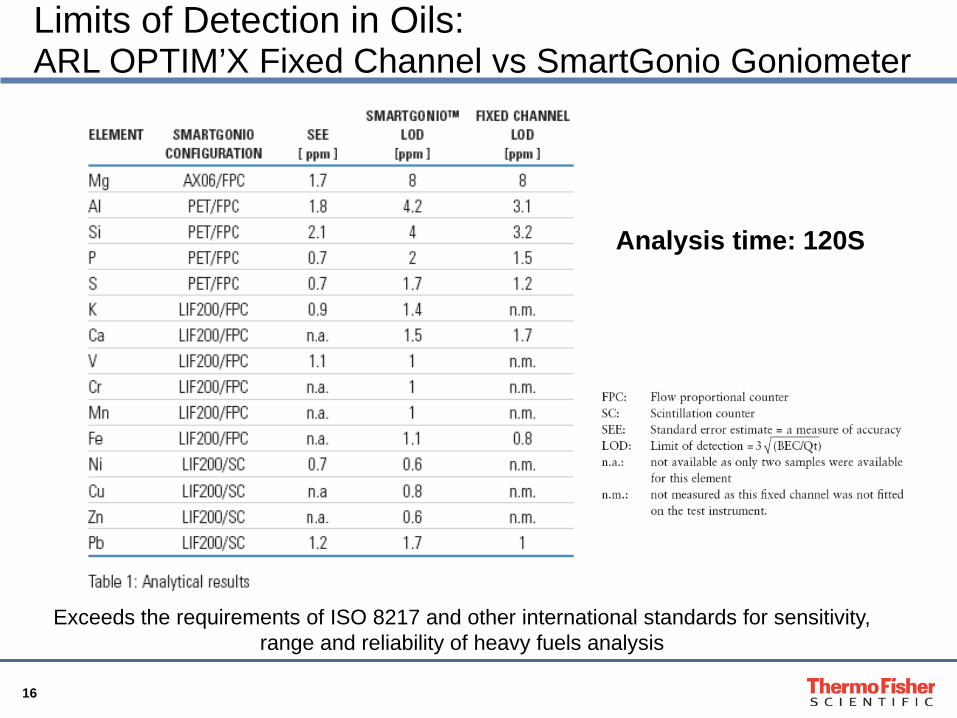
Limits of Detection in Oils: ARL OPTIM’X Fixed Channel vs SmartGonio Goniometer
Analysis time: 120S
Exceeds the requirements of ISO 8217 and other international standards for sensitivity, range and reliability of heavy fuels analysis

17
ARL OPTIM’X Spectrometer: Limits of Detection
Oil matrix SmartGonio device 60 s counting time Comparison at 50W and 200W FPC : Flow proportional counter SC : Scintillation counter
50W 200W Element SmartGonio
configuration Typical
LoD in 60s [ppm]
Typical LoD in 60s
[ppm] Al AX06/FPC 5.9 3.7 Si InSb/FPC 5.0 3.0 P InSb/FPC 2.8 1.8 S InSb/FPC 2.6 1.7 K LiF200/FPC 2.0 1.2 Ca LiF200/FPC 2.1 1.3 V LiF200/FPC 1.4 0.9 Cr LiF200/FPC 1.4 0.9 Mn LiF200/FPC 1.4 0.9 Fe LiF200/FPC 1.5 1.0 Ni LiF200/SC 0.8 0.5 Cu LiF200/SC 1.1 0.7 Zn LiF200/SC 0.8 0.5 Pb LiF200/SC 2.4 1.5

18
PetroilQuant Software – 22 elements 200W 200W
Element SmartGonio configuration
Typical LoD in [ppm]
in a counting time of (s)
Typical LoD in 60s [ppm]
Na AX06/FPC 104 40 84.9 Mg AX06/FPC 12.7 40 10.4 Al AX06/FPC 8.4 36 6.5 Si InSb/FPC 2.7 36 2.1 P InSb/FPC 3.2 36 2.5 S InSb/FPC 3.9 36 3.0 Cl InSb/FPC 6.9 36 5.3 K LiF200/FPC 1.6 16 0.8 Ca LiF200/FPC 2.5 16 1.3 Ti LiF200/FPC 2.6 16 1.3 V LiF200/FPC 1.6 16 0.8 Cr LiF200/FPC 1.5 16 0.8 Mn LiF200/FPC 1.4 16 0.7 Fe LiF200/FPC 1.5 16 0.8 Ni LiF200/SC 1.6 16 0.8 Cu LiF200/SC 1.3 16 0.7 Zn LiF200/SC 1.1 16 0.6 Mo LiF200/SC 1.4 16 0.7 Sn LiF200/SC 9.3 24 5.9 Sb LiF200/SC 4.7 24 3.0 Ba LiF200/SC 7.1 16 3.7 Pb LiF200/SC 4.9 16 2.5
• SmartGonio device: Practical limits of detection obtained by repeated analysis on a blank oil
• LoD = 3 x Standard Deviation • Counting time shown FPC : Flow proportional counter SC : Scintillation counter
19
Polymer Applications
Polymers

20
Limits of detection for heavy elements in polymers at 200W
Heavy Elements in Polymers

21
Polymer Calibrations
Factory Calibrations: • Calibration for Heavy metals in
Polymers (RoHS + As) • 6 Elements: Br, Cr, Cd, Hg, Pb,
and As • Element Range [ppm] • Br LoD – 1050 ppm • Cd LoD – 300 ppm • Cr LoD – 1000 ppm • Hg LoD – 1100 ppm • Pb LoD – 1200 ppm • As LoD – 31 ppm
• Calibration for Polymer Analysis
• 5 Elements: Mg, Al, Cl, Ca, Ti
• Element Range [ppm] • Al LoD – 30 ppm • Ca LoD – 25 ppm • Cl LoD – 50 ppm • Mg LoD – 50 ppm • Ti LoD – 15 ppm

22
Special ARL OPTIM’X Feature: OptiQuant Software
Optimization of UniQuant Software for the
ARL OPTIM’X Series

23
OptiQuant: When None or Few Standards are Available
• OptiQuant is an adaptation of UniQuant software for the ARL OPTIM’X spectrometer
• Thermo Scientific™ SmartGonio™ goniometer covering F to U (3 crystals – 2 detectors)
• Total counting time: 5 to 20 Minutes at 200W • 70 Elements
• All other standard features of UniQuant software remain unchanged • Counting time can be adjusted depending on requirements • Spinning of sample during analysis • Layer analysis, etc…

24
OptiQuant: When None or Few Standards are Available
• OptiQuant software is peak based so offers greater accuracy and precision compared to scan based standardless routines
• Scan based routines typically hit peak locations for a fraction of a second while scanning – OptiQuant sits on locations from 4 – 12 seconds
• All peak and background locations are pre-programmed and maintained by the software
• Drift corrections achieved through supplied control disks
• Able to modify count times or optimize new subroutines to specific matrices
25
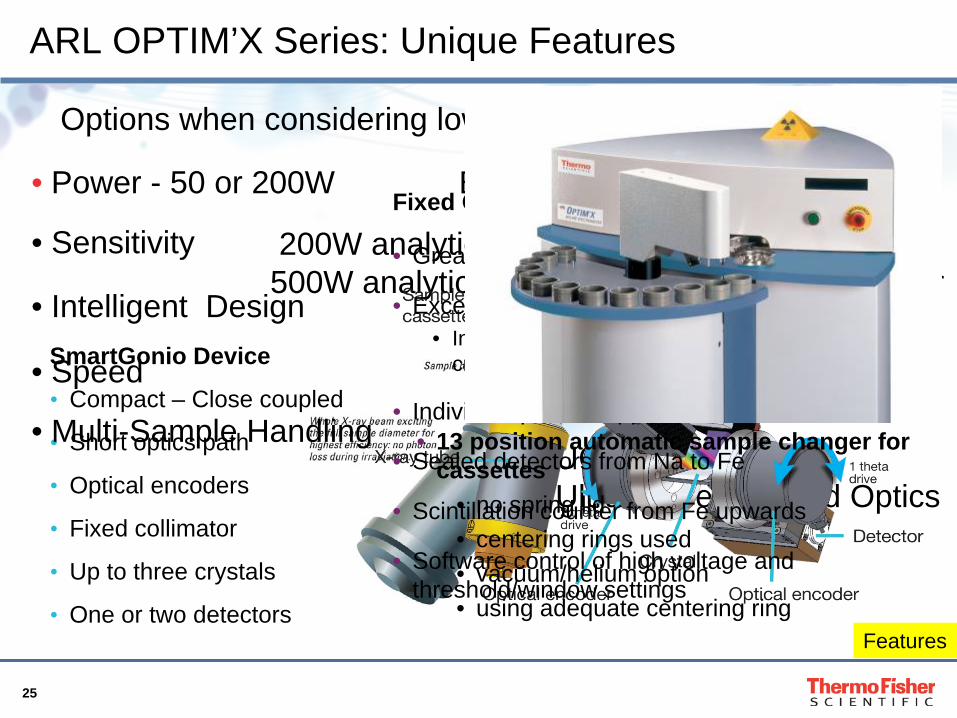
ARL OPTIM’X Series: Unique Features
• Power - 50 or 200W
Features
Options when considering low power XRF
Based on requirements
Limits of detection Precision Speed of analysis Budget
• Sensitivity 200W analytical performance from 50W power 500W analytical performance from 200W power
UCCO: Ultra Close Coupled Optics
• Intelligent Design SmartGonio Device
• Compact – Close coupled
• Short optics path
• Optical encoders
• Fixed collimator
• Up to three crystals
• One or two detectors
Access to all elements from F to U (3 crystals - 2 detectors fitted)
• Speed
Fixed Channel Multichromators
• Greater sensitivities
• Excellent stability • Individual temperature control on each
crystal
• Individual power supply board
• Sealed detectors from Na to Fe
• Scintillation counter from Fe upwards
• Software control of high voltage and threshold/window settings
• Multi-Sample Handling • 13 position automatic sample changer for cassettes
• no spring lid • centering rings used • vacuum/helium option • using adequate centering ring
26
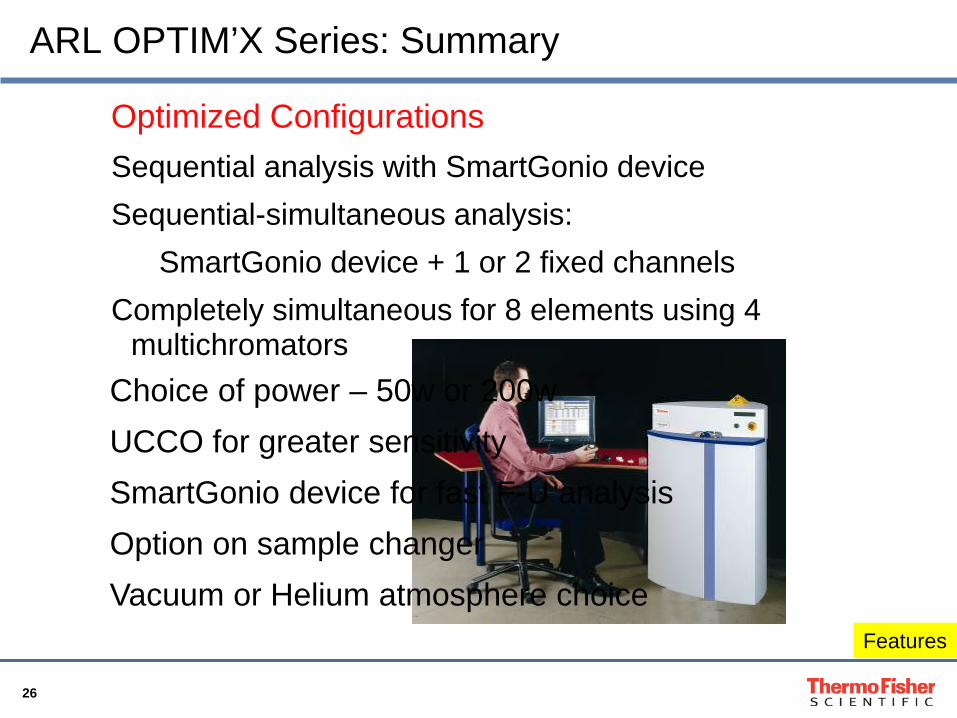
Optimized Configurations Sequential analysis with SmartGonio device
Sequential-simultaneous analysis: SmartGonio device + 1 or 2 fixed channels
Completely simultaneous for 8 elements using 4 multichromators
Features
Choice of power – 50w or 200w
UCCO for greater sensitivity
SmartGonio device for fast F-U analysis
Option on sample changer
Vacuum or Helium atmosphere choice
ARL OPTIM’X Series: Summary
27
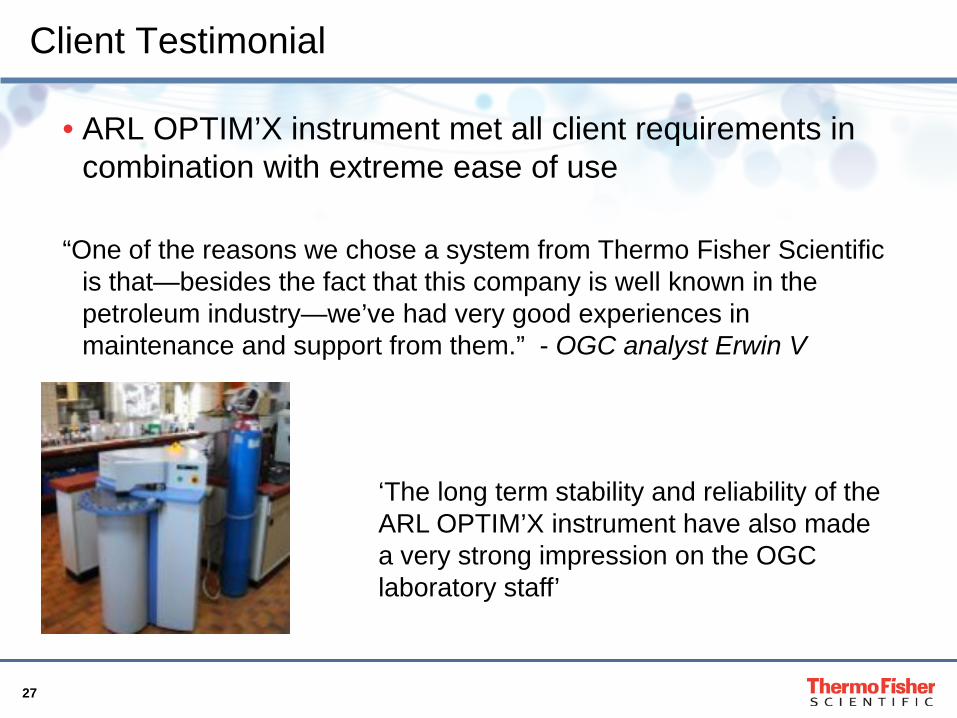
Client Testimonial
• ARL OPTIM’X instrument met all client requirements in combination with extreme ease of use
“One of the reasons we chose a system from Thermo Fisher Scientific
is that—besides the fact that this company is well known in the petroleum industry—we’ve had very good experiences in maintenance and support from them.” - OGC analyst Erwin V
‘The long term stability and reliability of the ARL OPTIM’X instrument have also made a very strong impression on the OGC laboratory staff’

28
X-ray Product Portfolio
Thermo Scientific™ ARL™ QUANT’X
EDXRF Spectrometer: Top performance EDXRF
Thermo Scientific™ ARL™ OPTIM’X
WDXRF Spectrometer: Unique Configuration WDXRF 50W-200W
Thermo Scientific™ ARL™ PERFORM’X
WDXRF Spectrometer: High Performance Sequential
XRF 1500W-4200W

29
Thermo Solutions in Refineries
• Environmental regulation compliance • Online sulfur detection • Refining gas detection • Corrosion prevention of refinery piping
systems • Complex in-process liquid and gas analysis • Continuous process monitoring (densities,
levels, flow rates, heating values) • Process optimization • Quality assurance and control • Full range of laboratory instruments
30
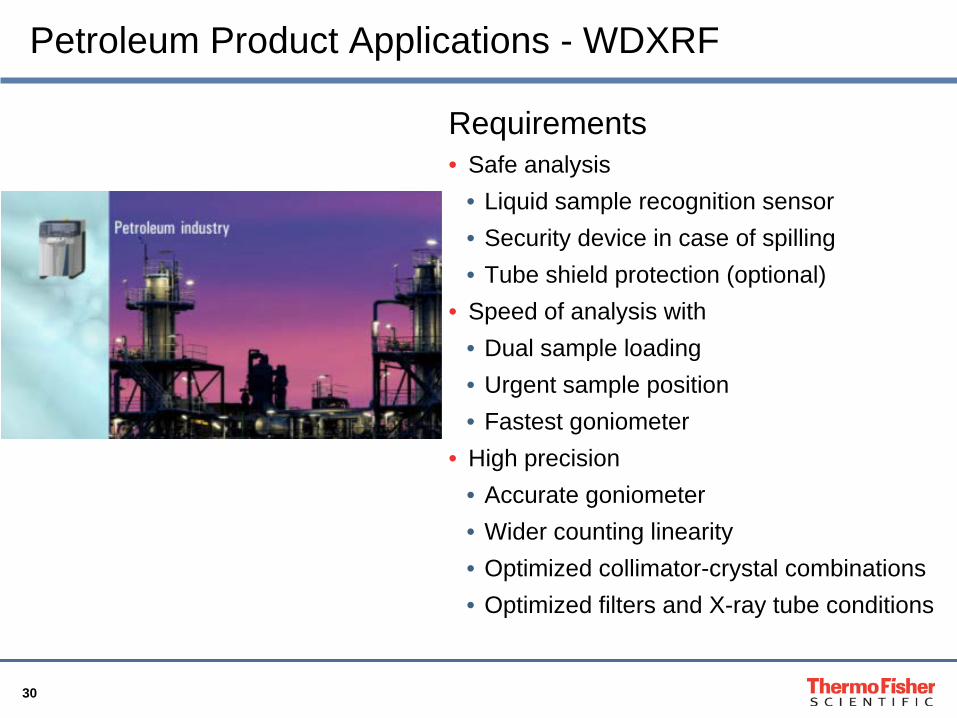
Petroleum Product Applications - WDXRF
Requirements • Safe analysis
• Liquid sample recognition sensor • Security device in case of spilling • Tube shield protection (optional)
• Speed of analysis with • Dual sample loading • Urgent sample position • Fastest goniometer
• High precision • Accurate goniometer • Wider counting linearity • Optimized collimator-crystal combinations • Optimized filters and X-ray tube conditions

31
Petroleum Product Applications - WDXRF
• Gasoline • Naphtha • Diesel fuels • Kerosene • Jet fuel • Gas oils • Residual fuels • Crude oil • Biofuels • Lubricant additives • Lubricant blending • FCC catalysts • Coke • Additives

32
ARL PERFORM’X Spectrometer in Petrochemicals
Ideal for Central Laboratory
• Versatility for many applications
• Thin window X-ray tube (30 micron) for high sensitivity in light elements
• Flexible software options
• Analysis of any material
• Standard, Standardless analysis
• High throughput to research
• Vacuum/Helium atmosphere
• ARL OPTIM’X instrument as backup system
• IQ/OQ & Remote Diagnostics for easy installation and serviceability

33
Oil Analysis
• Typical LoD in Oil Analysis
34
Thermo Scientific PetroilQuant Software
• Factory calibrated package for oils analysis • Up to 30 elements • Calibration maintained using solid drift standards • Good for fuels, lubricants, and oils

35
Analysis of Traces in Polymers

36
UniQuant Software: Unique Standard-less Analysis
Peak to peak analysis permits
• Lower limits of detection
• Selective counting time
• Use of sample spinning • In case of small samples • In case of inhomogeneous samples • Evens out effects of polishing grooves
on metals
37
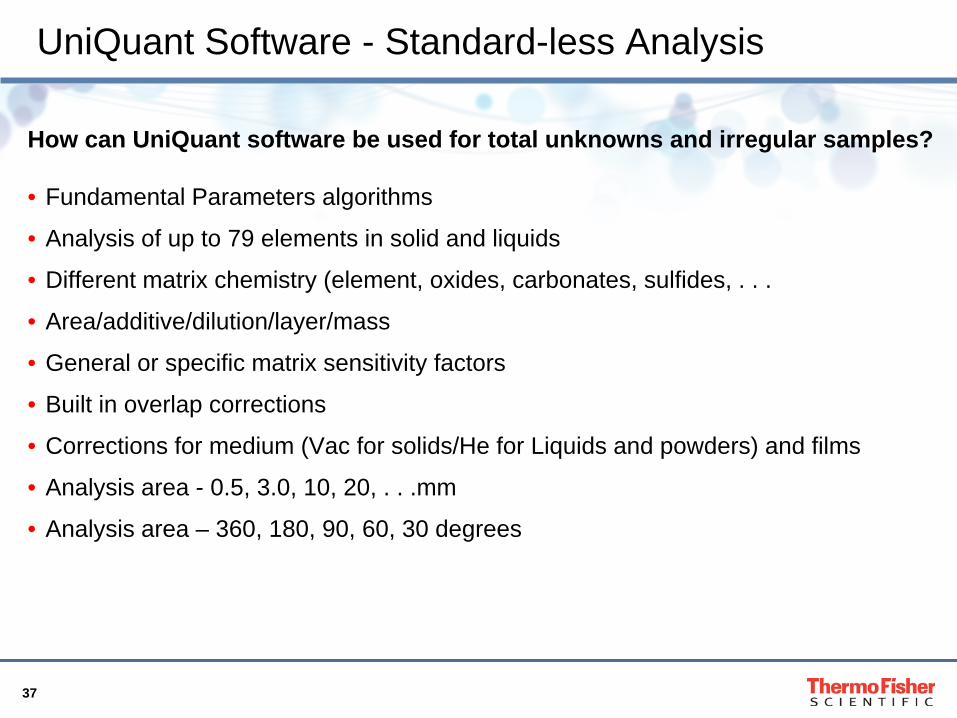
UniQuant Software - Standard-less Analysis
How can UniQuant software be used for total unknowns and irregular samples?
• Fundamental Parameters algorithms
• Analysis of up to 79 elements in solid and liquids
• Different matrix chemistry (element, oxides, carbonates, sulfides, . . .
• Area/additive/dilution/layer/mass
• General or specific matrix sensitivity factors
• Built in overlap corrections
• Corrections for medium (Vac for solids/He for Liquids and powders) and films
• Analysis area - 0.5, 3.0, 10, 20, . . .mm
• Analysis area – 360, 180, 90, 60, 30 degrees
38
Situation
• Special sample types with no commercial reference materials available
• Biological (DBS – Dried Blood Spots); Cosmetics (Nail Polish); Specially formulated catalysts as examples
• Difficult and costly to manufacture reference materials in-house
• A number of sample components in non-measureable form

39
Solution
• UniQuant software allows for optimization for various components and compounds unique to each sample type
• Analyzed results confirmed by the more labor intensive ICP-MS and ICP-OES methods
• Results produced in a fraction of the time compared to other methods with minimal sample preparation

40
Client Testimonial
• ARL PERFORM’X instrument with UniQuant software enabled me to quantify diverse sample types that would normally not be considered possible using standard XRF methods
• Nitrocellulose and other volatile organic compounds were accepted into the calculations to provide more accurate results
‘Working with thin film samples the reliability and precision of primary and duplicate results at trace concentration levels were near identical’ Andrea McWilliams, Research Triangle Institute
41
Thank You