pimco mortgage-backed securities fund
TRANSCRIPT

Quarterly Investment Report | 1Q21
PIMCO Mortgage-Backed Securities Fund
IMPORTANT NOTICE Please note that this material contains the opinions of the manager as of the date noted, and may not have been updated to reflect real time market developments. All opinions are subject to change without notice.

1
Portfolio Performance
Portfolio strategy
Executive summary
Performance periods ended 31 Mar '21 3 mos. 6 mos. 1 yr. 3 yrs. 5 yrs. 10 yrs. SI
Fund before fees -0.11 1.01 4.88 5.08 4.10 4.14 6.00
Fund after fees -0.24 0.76 4.36 4.56 3.58 3.62 5.47
Benchmark* -1.10 -0.86 -0.09 3.75 2.43 2.85 4.70
Class: INSTInception date: 31 Jul '97Fund assets (in millions): $212.32Gross expense ratio: 0.750%Adjusted expense ratio: 0.500%
The Adjusted Expense Ratio excludes certain investment expenses, such as interest expense from borrowings and repurchase agreements and dividend expense from investments on short sales, incurred directly by the Fund or indirectly through the Fund’s investments in underlying PIMCO Funds (if applicable), none of which are paid to PIMCO.
Summary information 31 Mar '21 30-day SEC yield 1.57%Distribution yield 1.96%Effective duration (yrs) 3.78Effective maturity (yrs) 4.13Average coupon 2.22%Tracking error (10 yrs) 0.97Information ratio (10 yrs) 0.77
Sector allocation Dur. (yrs) MVGNMA MBS 1.19 24.87% FNMA, FHLMC and Other Agency MBS 3.39 62.32%
Non-Agency MBS 0.15 7.69% Home Equity ABS 0.13 5.29% CMBS 0.01 0.53% Other MBS 0.01 0.40% U.S. Government Related -1.14 -28.72% Other 0.06 1.21% Net other short duration instruments -0.02 26.42%
Total 3.78 100% *Bloomberg Barclays U.S. MBS Fixed-Rate Index;
Performance quoted represents past performance. Past performance is not a guarantee or a reliable indicator of future results. Investment return and the principal value of an investment will fluctuate. Shares may be worth more or less than original cost when redeemed. Current performance may be lower or higher than performance shown. For performance current to the most recent month end, visit pimco.com or call 888.87.PIMCO.
The Mortgage Backed Securities strategy returned -0.11% (gross of fees). Performance was driven by senior Non-Agency RMBS, an overweight exposure to GNMA versus FNMA pass-through securities, and U.S. duration positioning.
CONTRIBUTORS• Exposure to senior non-Agency RMBS• Overweight to GNMA versus FNMA• U.S. duration positioning
DETRACTORS• No notable detractors during the quarter
Interest rate strategies: We tactically adjust our exposure to duration as a way to diversify the spread risk within the portfolio.Agency MBS relative value strategies: We look to adjust our Agency MBS spread exposure as a function of valuations. During the quarter, we decreased our Agency MBS exposure as valuations improved.
Mortgage credit strategies: We remain constructive on mortgage credit, with a preference for senior non-Agency RMBS. In CMBS, we favor securities at the top of the capital structure, while senior CLOs present select opportunities within the high quality securitized space.
As of 31 March 2021
2
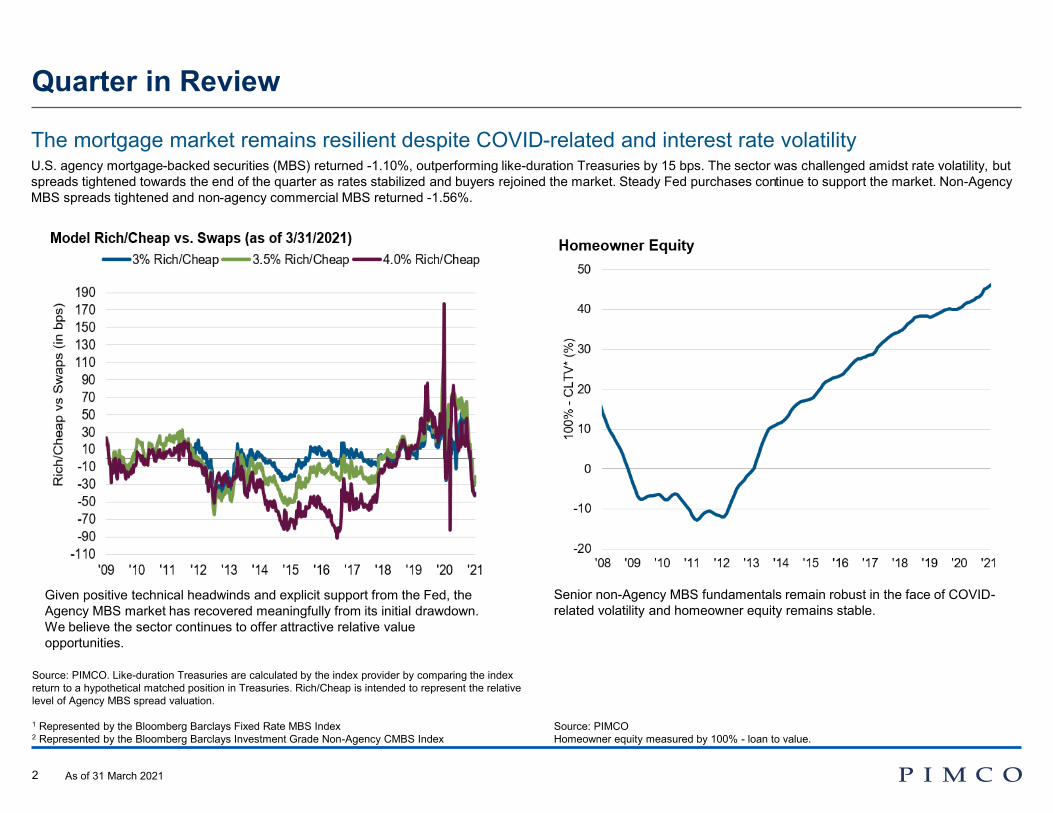
Quarter in Review
Given positive technical headwinds and explicit support from the Fed, the Agency MBS market has recovered meaningfully from its initial drawdown. We believe the sector continues to offer attractive relative value opportunities.
Senior non-Agency MBS fundamentals remain robust in the face of COVID- related volatility and homeowner equity remains stable.
Source: PIMCO Homeowner equity measured by 100% - loan to value.
Source: PIMCO. Like-duration Treasuries are calculated by the index provider by comparing the index return to a hypothetical matched position in Treasuries. Rich/Cheap is intended to represent the relative level of Agency MBS spread valuation.
1 Represented by the Bloomberg Barclays Fixed Rate MBS Index 2 Represented by the Bloomberg Barclays Investment Grade Non-Agency CMBS Index
The mortgage market remains resilient despite COVID-related and interest rate volatility U.S. agency mortgage-backed securities (MBS) returned -1.10%, outperforming like-duration Treasuries by 15 bps. The sector was challenged amidst rate volatility, but spreads tightened towards the end of the quarter as rates stabilized and buyers rejoined the market. Steady Fed purchases continue to support the market. Non-Agency MBS spreads tightened and non-agency commercial MBS returned -1.56%.
As of 31 March 2021

3
Market Summary
Interest ratesInterest rates increased during the quarter and we increased duration in the portfolio. We continue to utilize interest rate options to help hedge extension risk in the case of rising rates.
Agency MBS Agency MBS outperformed like-duration Treasuries during the quarter, with higher coupons generally outperforming lower coupons. Ginnie Mae MBS outperformed Conventional MBS but underperformed like duration treasuries during the quarter.
Mortgage credit We continue to maintain exposure to senior non- Agency RMBS and CMBS. Senior non-Agency MBS stands out as attractive and stands to benefit from the strong recovery in US housing, which is being driven by limited supply and continued low mortgage rates. We view senior CMBS as a good diversifier to corporate credit.
Source: Bloomberg Barclays
Mortgages outperformed during the quarter despite rate volatility Fed policy continued to provide liquidity to the markets, providing support to securitized assets.
As of 31 March 2021

4
0.0
0.5
1.0
1.5
2.0
2.5
3.0
3.5
4.0
Dec '16 Dec '17 Dec '18 Dec '19 Dec '20 Dec '21 Dec '22
Core Headline
70
80
90
100
110
120
Dec '17 Dec '18 Dec '19 Dec '20 Dec '21 Dec '22
Inde
x (4
Q20
19 =
100
)
US Euro area Japan UK China
Cyclical Outlook: Dealing with an Inflation Head Fake
Strong global recovery forecast in 2021 amid significant fiscal support, accommodative monetary policy, diminishing lockdowns, and accelerating vaccinations
As of March 2021. Source; BLS, PIMCO
Inflation likely to rise temporarily, but expected to remain below target over the next one to two years
A bumpy near-term path for U.S. CPI inflationReal GDP growth (4Q 2019 = 100)
Forecast

5
Portfolio Outlook
Interest rate strategies
We are overweight U.S. duration and will continue to scale exposure based on interest rate levels and compensation for risk. We believe duration is a useful diversifier to the fund’s mortgage credit exposure.
Agency MBS relative value
The Fed’s continued support has created additional relative value and active management opportunities in Agency MBS. We expect Agency MBS supply side technicals to improve as refinancing declines. Continued Fed support will also support TBA valuations by eliminating the worst bonds in the TBA float.
Mortgage credit
Senior non-Agency MBS remain an area of high conviction given compelling base case yields and seniority in the capital structure. Senior CLOs and CMBS also present select opportunities within the high quality securitized space.
Strategic PositioningIn March, the Fed purchased $40bn (net) of Agency MBS, bringing total purchases to over $1.8 trillion. At the September 2020 meeting, the Fed committed to purchasing $40 billion net per month for the foreseeable future. Prepayment speeds increased by 3% in February (most recent data available), in-line with broad market expectations. Despite Agency MBS having recovered meaningfully, we continue to find strong relative value opportunities within the sector. PIMCO remains constructive on senior U.S. securitized credit. Senior non-Agency MBS stands out as attractive, and is expected to be relatively well insulated from the key risks facing global markets.
Key strategies Position
As of 31 March 2021
Source: PIMCO

6
Portfolio Benchmark% of Market value Duration in years % of Market value Duration in years
31 Dec '20 31 Mar '21 31 Dec '20 31 Mar '21 31 Mar '21 31 Mar '21 GNMA MBS 23.91 24.87 0.65 1.19 23.47 0.80FNMA, FHLMC and Other Agency MBS 66.32 62.32 2.18 3.39 76.53 3.29Non-Agency MBS 7.96 7.69 0.17 0.15 0.00 0.00Home Equity MBS 5.45 5.29 0.13 0.13 0.00 0.00CMBS 0.54 0.53 0.01 0.01 0.00 0.00Other MBS 0.45 0.40 0.01 0.01 0.00 0.00U.S. Government Related -25.64 -28.72 -1.80 -1.14 0.00 0.00Other 1.63 1.21 0.09 0.06 0.00 0.00Net other short duration instruments* 19.38 26.42 0.28 -0.02 0.00 0.00
Commingled cash vehicles 6.23 13.84 0.01 0.03 0.00 0.00Certificate of deposit/Commerical paper/STIF 0.18 0.21 0.00 0.00 0.00 0.00Government related 0.02 0.92 0.00 0.00 0.00 0.00MBS/ABS 34.18 26.27 0.23 0.16 0.00 0.00Credit 0.00 0.00 0.00 0.00 0.00 0.00Bankers Acceptance 0.00 0.00 0.00 0.00 0.00 0.00Other*** -5.58 10.58 0.00 0.00 0.00 0.00Short duration derivatives and derivative offsets 25.67 28.98 0.04 -0.21 0.00 0.00Net unsettled trades -41.32 -54.37 0.00 0.00 0.00 0.00
Total 100 100 1.73 3.78 100 4.09
Sector exposure
Benchmark: Bloomberg Barclays U.S. MBS Fixed-Rate Index
*Net Other Short Duration Instruments includes securities and other instruments (except instruments tied to emerging markets by country of risk) with an effective duration less than one year and rated investment grade or higher or, if unrated, determined by PIMCO to be of comparable quality, commingled liquidity funds, uninvested cash, interest receivables, net unsettled trades, broker money and derivatives offset. With respect to certain categories of short duration securities, the Adviser reserves the discretion to require a minimum credit rating higher than investment grade for inclusion in this category.
As of 31 March 2021

7
#NUM! #NUM!
Equity futures* 0.00 0.00
Commodity exposure* 0.00 0.00
Government futures 0.00 0.00
Interest rate swaps 0.00 0.00
Credit default swaps* 0.00 0.00
Purchased swaps 0.00 0.00
Written swaps 0.00 0.00
Options 0.00 0.00
Purchased options 0.00 0.00
Written options 0.00 0.00
Mortgage derivatives 0.00 0.00
Money Market derivatives 0.00 0.00
Futures 0.00 0.00
Interest rate swaps 0.00 0.00
Other derivatives 0.00 0.00
Derivative exposure (% of duration)
* Shown as a percentage of market value
Portfolio characteristics
Portfolio (yrs) Benchmark (yrs)**
31 Dec '20 31 Mar '21 31 Mar '21
0-5 yrs 0.76 -0.15 0.62
5-15 yrs 0.99 3.84 2.92
15+ yrs -0.02 0.09 0.00
Total 1.73 3.78 3.54
-1.000.001.002.003.004.005.00
0-5 yrs 5-15 yrs 15+ yrs
Key rate duration exposure
n 31 Dec '20 n 31 Mar '21 n Benchmark (yrs)**
**Benchmark duration is calculated by PIMCO Benchmark: Bloomberg Barclays U.S. MBS Fixed-Rate Index
Interest rate exposurePortfolio (yrs) Benchmark (yrs)**
31 Dec '20 31 Mar '21 31 Mar '21 Effective duration 1.73 3.78 3.54Bull market duration 1.17 1.35 2.06Bear market duration 3.10 5.34 4.05Spread durationMortgage spread duration 4.72 5.66 4.04Corporate spread duration 0.03 0.02 0.00Emerging markets spread duration 0.08 0.08 0.00Swap spread duration -1.48 -1.36 0.00Covered bond spread duration 0.00 0.00 0.00Sovereign related spread duration 0.00 0.01 0.00
Derivative exposure (% of duration)31 Dec '20 31 Mar '21
Government futures -18.51 0.21 Interest rate swaps -78.96 -21.32 Credit default swaps* 0.00 0.00
Purchased swaps 0.00 0.00 Written swaps 0.00 0.00
Options -1.01 15.56 Purchased Options -6.56 -21.64 Written Options 5.56 37.19
Mortgage Derivatives -3.11 4.51 Money Market Derivatives 2.42 -1.04
Futures 0.00 0.00 Interest rate swaps 2.42 -1.04
Other Derivatives 0.91 0.33
* Shown as a percentage of market value
As of 31 March 2021

8
Additional share class performance
PIMCO Mortgage-Backed Securities Fund (net of fees performance)
Performance periods ended: 31 Mar '21
Gross expense
ratio
Net expense
ratio
Adjusted expense
ratioNAV
currency
Class Inception
date 3 mos. 6 mos. 1 yr. 3 yrs. 5 yrs. 10 yrs. SIClass A (at NAV) 1.150 - 0.900 USD 31 Jul '00 -0.33 0.56 3.95 4.14 3.17 3.21 5.05 Class A (at MOP) 1.150 - 0.900 USD 31 Jul '00 -4.07 -3.21 0.05 2.83 2.39 2.82 4.88 Class C (at NAV) 1.900 - 1.650 USD 31 Jul '00 -0.51 0.18 3.17 3.37 2.40 2.44 4.27 Class C (at MOP) 1.900 - 1.650 USD 31 Jul '00 -1.50 -0.81 2.17 3.37 2.40 2.44 4.27 Class I-2 0.850 - 0.600 USD 30 Apr '08 -0.26 0.71 4.26 4.45 3.48 3.52 5.37 Class I-3 0.950 0.900 0.650 USD 27 Apr '18 -0.27 0.68 4.21 4.40 3.43 3.46 5.32 Class INST 0.750 - 0.500 USD 31 Jul '97 -0.24 0.76 4.36 4.56 3.58 3.62 5.47 Bloomberg Barclays U.S. MBS Fixed-Rate Index -1.10 -0.86 -0.09 3.75 2.43 2.85 4.70
The Net Expense Ratio for the I-3 Class reflects a contractual supervisory and administrative fee waiver and/or expense reduction in place through 31 July 2021 and renews automatically for a full year unless terminated by PIMCO in accordance with the terms of the agreement. See the Fund's prospectus for more information.
The Adjusted Expense Ratio excludes certain investment expenses, such as interest expense from borrowings and repurchase agreements and dividend expense from investments on short sales, incurred directly by the Fund or indirectly through the Fund’s investments in underlying PIMCO Funds (if applicable), none of which are paid to PIMCO.
Performance quoted represents past performance. Past performance is not a guarantee or a reliable indicator of future results. Investment return and the principal value of an investment will fluctuate. Shares may be worth more or less than original cost when redeemed. Current performance may be lower or higher than performance shown. For performance current to the most recent month end, visit pimco.com or call 888.87.PIMCO. The maximum offering price (MOP) returns take into account the Class A maximum initial sales charge of 3.75%.The maximum offering price (MOP) returns take into account the contingent deferred sales charge (CDSC) for Class C shares, which for this fund is 1.00%.
For the periods prior to the inception date of a share class, performance information is based on the performance of the Fund's oldest class shares, adjusted to reflect the fees and expenses paid by that class of shares.
As of 31 March 2021
9
701_QIR-1Q21
As of 31 March 2021
Appendix This material is authorized for use only when preceded or accompanied by the current PIMCO funds prospectus or summary prospectus, if available.
Past performance is not a guarantee or a reliable indicator of future results. The performance figures presented reflect the total return performance, unless otherwise noted, after fees and reflect
changes in share price and reinvestment of dividend and capital gain distributions. All periods longer than one year are annualized. Periods less than one year are cumulative. The minimum initial
investment for Institutional, I-2, I-3 and Administrative class shares is $1 million; however, it may be modified for certain financial intermediaries who submit trades on behalf of eligible investors.
There is no assurance that any fund, including any fund that has experienced high or unusual performance for one or more periods, will experience similar levels of performance in the future. High
performance is defined as a significant increase in either 1) a fund’s total return in excess of that of the fund’s benchmark between reporting periods or 2) a fund’s total return in excess of the fund’s
historical returns between reporting periods. Unusual performance is defined as a significant change in a fund’s performance as compared to one or more previous reporting periods.
Investments made by a Fund and the results achieved by a Fund are not expected to be the same as those made by any other PIMCO-advised Fund, including those with a similar name, investment
objective or policies. A new or smaller Fund’s performance may not represent how the Fund is expected to or may perform in the long-term. New Funds have limited operating histories for investors to
evaluate and new and smaller Funds may not attract sufficient assets to achieve investment and trading efficiencies. A Fund may be forced to sell a comparatively large portion of its portfolio to meet
significant shareholder redemptions for cash, or hold a comparatively large portion of its portfolio in cash due to significant share purchases for cash, in each case when the Fund otherwise would not
seek to do so, which may adversely affect performance.
Differences in the Fund’s performance versus the index and related attribution information with respect to particular categories of securities or individual positions may be attributable, in part, to
differences in the pricing methodologies used by the Fund and the index.
Forecasts, estimates and certain information contained herein are based upon proprietary research and should not be interpreted as investment advice, as an offer or solicitation, nor as the purchase or
sale of any financial instrument. Forecasts and estimates have certain inherent limitations, and unlike an actual performance record, do not reflect actual trading, liquidity constraints, fees, and/or other
costs. In addition, references to future results should not be construed as an estimate or promise of results that a client portfolio may achieve.
Portfolio allocations and other information in the charts in this Quarterly Investment Report are based on the fund's net assets. These percentages may differ from those used for the fund's compliance
calculations, including the fund's prospectus, regulatory, and other investment limitations and policies, which may be based on total assets of the fund or other measurements, may include or exclude
various categories of investments from those covered in the portfolio allocation categories shown in this report, and may be based on different classifications and measurements of the fund's investments
and other criteria. All funds are separately monitored for compliance with prospectus and regulatory requirements.
A word about risk: Investing in the bond market is subject to risks, including market, interest rate, issuer, credit, inflation risk, and liquidity risk. The value of most bonds and bond strategies are
impacted by changes in interest rates. Bonds and bond strategies with longer durations tend to be more sensitive and volatile than those with shorter durations; bond prices generally fall as interest rates
rise, and low interest rate environments increase this risk. Reductions in bond counterparty capacity may contribute to decreased market liquidity and increased price volatility. Bond investments may be
worth more or less than the original cost when redeemed. Investing in foreign denominated and/or domiciled securities may involve heightened risk due to currency fluctuations, and economic and
political risks, which may be enhanced in emerging markets. Mortgage and asset-backed securities may be sensitive to changes in interest rates, subject to early repayment risk, and their value may
fluctuate in response to the market’s perception of issuer creditworthiness; while generally supported by some form of government or private guarantee there is no assurance that private guarantors will
meet their obligations. Equities may decline in value due to both real and perceived general market, economic, and industry conditions. Derivatives may involve certain costs and risks such as liquidity,
interest rate, market, credit, management and the risk that a position could not be closed when most advantageous. Investing in derivatives could lose more than the amount invested. Diversification does
not ensure against loss.
Bloomberg Barclays U.S. MBS Fixed-Rate Index covers the mortgage-backed pass-through securities and hybrid ARM pools of Ginnie Mae (GNMA), Fannie Mae (FNMA), and Freddie Mac (FHLMC). The
MBS Index is formed by grouping individual fixed rate MBS pools into generic aggregates. It is not possible to invest directly in an unmanaged index.

10
701_QIR-1Q21
As of 31 March 2021
Appendix The following defined terms are used throughout the report. Emerging market short duration instruments includes an emerging market security or other instrument economically tied to an emerging
market country by country of risk with an effective duration less than one year and rated investment grade or higher or if unrated, determined to be similar quality by PIMCO. Net other short duration
instruments includes securities and other instruments (except instruments tied to emerging markets by country of risk) with an effective duration less than one year and rated investment grade or higher
or, if unrated, determined by PIMCO to be of comparable quality, commingled liquidity funds, uninvested cash, interest receivables, net unsettled trades, broker money and derivatives offset. With respect
to certain categories of short duration securities, the Adviser reserves the discretion to require a minimum credit rating higher than investment grade for inclusion in this category. Short duration
derivatives and derivatives offsets include: 1) derivatives with an effective duration less than one year and where the country of risk is not an emerging market country (for example, Eurodollar futures) and
2) offsets associated with investments in futures, swaps and other derivatives. Such offsets may be taken at the notional value of the derivative position which in certain instances may exceed the actual
amount owed on such positions. Municipals/Other may include convertibles, preferred and yankee bonds.
Statements concerning financial market trends or portfolio strategies are based on current market conditions, which will fluctuate. There is no guarantee that these investment strategies will work under
all market conditions or are appropriate for all investors and each investor should evaluate their ability to invest for the long term, especially during periods of downturn in the market. Outlook and
strategies are subject to change without notice.
The performance figures presented reflect the performance for the institutional class unless otherwise noted.
A note about Sector exposure: Other indicates swaps and securities issued in euros.
A note about Emerging markets exposure by country of risk: country of risk reflects the country of incorporation of the ultimate parent company.
PIMCO uses an internal model for calculating effective duration, which may result in a different value for the duration of an index compared to the duration calculated by the index provider or another
third party.

11
701_QIR-1Q21
As of 31 March 2021
Acronyms and definitions of investment terms used throughout the report:
Alpha is a measure of performance on a risk-adjusted basis calculated by comparing the volatility (price risk) of a portfolio vs. its risk-adjusted performance to a benchmark index; the excess return relative to
the benchmark is alpha.
Average coupon is the average of the coupon payments of the underlying bonds within the portfolio.
Average effective maturity is a weighted average of all the maturities of the bonds in a portfolio, computed by weighting each bond's effective maturity by the market value of the security.
“Bend-but-not-break” refers to credits that PIMCO would not expect to default in a credit-stressed environment.
Beta is a measure of price sensitivity to market movements. Market beta is 1.
Breakeven inflation rate (or expectation) is a market-based measure of expected inflation or the difference between the yield of a nominal and an inflation-linked bond of the same maturity.
Carry is the rate of interest earned by holding the respective securities.
The terms “cheap” and “rich” as used herein generally refer to a security or asset class that is deemed to be substantially under- or overpriced compared to both its historical average as well as to the
investment manager’s future expectations. There is no guarantee of future results or that a security’s valuation will ensure a profit or protect against a loss.
CPI is the Consumer Price Index.
The credit quality of a particular security or group of securities does not ensure the stability or safety of an overall portfolio. The quality ratings of individual issues/issuers are provided to indicate the credit-
worthiness of such issues/issuer and generally range from AAA, Aaa, or AAA (highest) to D, C, or D (lowest) for S&P, Moody’s, and Fitch respectively.
Distribution yield is the measurement of cash flow paid by an exchange-traded fund (ETF), real estate investment trust, or another type of income-paying vehicle.
Dividend yield is represented by the weighted average coupon divided by the weighted average price.
Duration is the measure of a bond's price sensitivity to interest rates and is expressed in years.
Effective duration is the duration for a bond with an embedded option when the value is calculated to include the expected change in cash flow caused by the option as interest rates change.
Forward curve is a function graph that defines the prices at which a contract for future delivery or payment can be concluded today.
Information ratio is a ratio of portfolio returns above the returns of a benchmark to the volatility of those returns.
Like-duration Securities are calculated by the index provider by comparing the index return to a hypothetical matched position in the security.
The Option Adjusted Spread (OAS) measures the spread over a variety of possible interest rate paths. A security's OAS is the average return an investor will earn over Treasury returns, taking all possible future
interest rate scenarios into account. The OAS is the net spread over the swap curve that will on average be earned if the security is held to maturity.
“Risk assets” are any financial security or instrument that are likely to fluctuate in price.
Risk premia is the return in excess of the risk-free rate of return an investment is expected to yield.
Roll yield is the yield that a futures investor captures as their long position in a futures contract converges to the spot price.
“Safe haven” is an investment that is expected to retain or increase in value during times of market turbulence.
The SEC yield is an annualized yield based on the most recent 30 day period.
Tracking error measures the dispersion or volatility of excess returns relative to a benchmark.
To relate the price sensitivity of ILBs to changes in nominal yields, yield beta is applied to nominal changes to arrive at a price sensitivity of ILBs to changes in nominal rates. A yield beta of 0.90 implies that if
nominal yields move 100 basis points, real yields will move 90 basis points. ILBs with long maturity may respond differently to changes in nominal rates than shorter maturity ILBs.
Asset-Backed Security (ABS); Bank of England (BOE); Bank of Japan (BOJ); Breakeven Inflation (BEI); Collateralized Debt Obligation (CDO); Collateralized Loan Obligation (CLO); Commercial Mortgage-Backed
Security (CMBS); Developed Markets (DM); Emerging Markets (EM); Federal Reserve Board (The Fed); Europe Central Bank (ECB); Federal Open Market Committee (FOMC); Foreign Exchange (FX); Gross Domestic
Product (GDP); Gulf Cooperation Council (GCC); High Yield (HY); Inflation-Linked Bond (ILS); Investment Grade (IG); Leveraged-buyout (LBO); Loan-to-Value (LTV); Master Limited Partnership (MLP); Mortgage-
Backed Security (MBS); Market Weighted Spread (MWS); Real Estate Investment Trust (REIT); Residential Mortgage-Backed Security (RMBS); Treasury Inflation-Protected Security (TIPS); Year-over-Year (YoY)
PIMCO as a general matter provides services to qualified institutions, financial intermediaries and institutional investors. Individual investors should contact their own financial professional to determine the most
appropriate investment options for their financial situation. This material contains the current opinions of the manager and such opinions are subject to change without notice. This material has been distributed
for informational purposes only and should not be considered as investment advice or a recommendation of any particular security, strategy or investment product. Information contained herein has been
obtained from sources believed to be reliable, but not guaranteed. No part of this material may be reproduced in any form, or referred to in any other publication, without express written permission. PIMCO is a
trademark of Allianz Asset Management of America L.P. in the United States and throughout the world. PIMCO Investments LLC, distributor, 1633 Broadway, New York, NY, 10019 is a company of PIMCO
©2021 PIMCO.
Appendix