pillar iii risk report - kbc bank · 2020-05-21 · risk report 2013 • kbc group • 7 kbc is an...
TRANSCRIPT

Risk report 2013 • KBC Group • 1
Pillar IIIRisk Report

Risk report 2013 • KBC Group • 2
Contact details: Investor Relations Office
www.kbc.com
KBC Group NV, Investor Relations Office, Havenlaan 2, 1080 Brussels, Belgium.
Contact details: Press Office
Viviane Huybrecht (General Manager Group Communication)
+ 32 2 429 85 45
KBC Group NV, Group Communication, Havenlaan 2, 1080 Brussels, Belgium.

Risk report 2013 • KBC Group • 3
Table of contents

Risk report 2013 • KBC Group • 4
Introduction: Highlights in 2013 and Disclosure Policy ..............................6Highlights ........................................................................................................................................................................ 7
Disclosure policy ............................................................................................................................................................... 8
Risk Management Governance ..............................................................10
Capital Adequacy ..................................................................................13Strategy and processes ................................................................................................................................................... 14
Regulatory solvency disclosures ...................................................................................................................................... 15
Basel III and Solvency II .................................................................................................................................................. 22
Liquidity Risk Management ....................................................................27Strategy and processes ................................................................................................................................................... 28
Scope of liquidity risk management ................................................................................................................................ 29
Structural liquidity risk .................................................................................................................................................... 30
Liquid asset buffer .......................................................................................................................................................... 31
Funding information ....................................................................................................................................................... 31
LCR and NSFR ................................................................................................................................................................. 32
Credit Risk Management ........................................................................33Strategy and processes ................................................................................................................................................... 34
Scope of credit risk disclosures ....................................................................................................................................... 38
Exposure to credit risk ................................................................................................................................................... 39
Total exposure to credit risk ........................................................................................................................................... 42
Credit risk in the lending portfolio ................................................................................................................................. 43
Concentrations to credit risk in the lending portfolio ..................................................................................................... 48
Impaired credit exposure in the lending portfolio ........................................................................................................... 63
Counterparty credit risk .................................................................................................................................................. 64
Credit risk mitigation ...................................................................................................................................................... 67
Internal modelling .......................................................................................................................................................... 71
Credit risk related to KBC Insurance ................................................................................................................................ 78
Credit risk related to sovereign bond exposures ............................................................................................................. 81
Structured Credit Products .......................................................................83Strategy and processes ................................................................................................................................................... 85
Scope of structured credit activities ................................................................................................................................ 85
Structured credit programmes for which KBC acts as originator ..................................................................................... 85
KBC’s structured credit position (where KBC acts as investor) ......................................................................................... 89
Structured credit exposure – capital charges under the CRD III (re)securitisation framework ........................................... 99
Market Risk Management (non-trading) ............................................... 102Strategy and processes ................................................................................................................................................. 103
Scope of non-trading market risk disclosures ................................................................................................................ 104
Interest rate risk ............................................................................................................................................................ 104
Credit spread risk .......................................................................................................................................................... 108
Equity risk .................................................................................................................................................................... 109
Real estate risk ..............................................................................................................................................................110
Inflation risk...................................................................................................................................................................110
Foreign exchange risk ....................................................................................................................................................111

Risk report 2013 • KBC Group • 5
Market Risk Management (trading) ...................................................... 112Strategy and processes ..................................................................................................................................................113
Scope of market risk management ................................................................................................................................114
The VaR model .............................................................................................................................................................114
Regulatory capital ..........................................................................................................................................................116
Stress testing .................................................................................................................................................................117
Back-testing ...................................................................................................................................................................118
Validation and reconciliation ......................................................................................................................................... 120
Valuation .................................................................................................................................................................... 120
Operational Risk Management ........................................................... 122Strategy and processes ................................................................................................................................................. 123
Scope of operational risk management......................................................................................................................... 123
Operational risk governance ........................................................................................................................................ 123
Toolbox for the management of operational risks ..........................................................................................................124
Operational risk capital charge .................................................................................................................................... 125
Other non-financial risks ............................................................................................................................................... 125
Insurance Risk Management ................................................................ 127Strategy and processes ................................................................................................................................................. 128
Scope of insurance risk management ........................................................................................................................... 128
Insurance risk classification ........................................................................................................................................... 129
Insurance risk measurement ......................................................................................................................................... 130
Best estimate valuations of insurance liabilities ............................................................................................................. 130
Technical provisions and loss triangles, non-life business ...............................................................................................131
Stress testing and scenario analysis ............................................................................................................................... 132
Insurance risk mitigation by reinsurance ....................................................................................................................... 132
Glossary ................................................................................................ 133

Risk report 2013 • KBC Group • 6
Introduction: Highlights in 2013
and Disclosure Policy

Risk report 2013 • KBC Group • 7
KBC is an integrated bank-insurance group, whose main focus is on retail clients and
small and medium-sized enterprises. We occupy leading positions on our home markets
of Belgium and Central and Eastern Europe, where we specialise in retail bank-
insurance and asset management activities. Elsewhere around the globe, the group
has established a presence in selected countries and regions.
Highlights
Unwinding the past…
• In 2013 we reduced the net legacy CDO and ABS exposure by 7.3 billion euros. In the first quarter
of 2014, another reduction of some 2 billion euros of the net legacy CDO exposure was achieved
thanks to the continued collapsing of CDO exposures.
• We repaid 1.17 billion euros (and paid a 50% penalty) in 2013 and 0.33 billion euros (and a 50%
penalty) at the beginning of 2014 to the Flemish Regional Government. This repayment effectively
reduced the outstanding state aid to 2 billion euros.
• The shareholder loans (to CERA and KBC Ancora) were substantially reduced (by 1 billion euros).
• KBC made considerable progress in the divestment plan agreed with the European Commission in
2009 when another three entities were successfully divested in 2013 (Absolut Bank, KBC Banka
and the minority shareholding in Nova Ljubljanska banka).
• Agreements to divest KBC Bank Deutschland and Antwerp Diamond Bank were also signed in
2013 and are expected to be closed in 2014.
• Sovereign bond exposure to GIIPS countries were confined to low levels.
… to strengthen ourselves for the challenges ahead
• In 2013, important steps were taken to prepare ourselves for the regulatory challenges lying
ahead (Basel III, Asset Quality Review, Banking Act).
• We reassessed our loan book which led to one-off impairment charges for KBC Ireland and K&H.
The impact of this thorough screening was immaterial for all other entities.
• The new and more stringent capital requirements under Basel III and Solvency II were amply
exceeded at the end of 2013.
• Our liquidity position was strengthened due to continuous solid growth in customer deposits at
different entities. KBC Ireland, where concerted efforts to build a retail deposit base have helped
to signifcantly reduce KBC Bank Ireland’s funding dependence, merits particular mention.
• In the wake of roadshows throughout Europe and Asia from 10 to 12 March 2014, KBC Group
issued 1.4 billion euros in non-dilutive, CRD IV-compliant Additional Tier-1 (AT1) securities. More
information can be found in the press release of 13 March 2014, available on www.kbc.com.
Subject to market conditions, KBC may call some of its outstanding stock of classic tier-1 securities
on their next possible call date.

Risk report 2013 • KBC Group • 8
Disclosure policy
In line with its general communication policy, KBC aims to be as open as possible when
communicating to the market about its exposure to risk. Risk management information is therefore
provided in a separate section of the 2013 annual report and – more extensively – in this
publication.
The most important regulations governing risk and capital management are the Basel II capital
requirements applying to banking entities, and the Solvency I capital framework applying to insurance
entities. In 2014, the Basel II capital requirements will be gradually replaced by the Basel III framework,
which will gradually enter into effect. Solvency I will be replaced by the fundamentally reformed
Solvency II framework, whose official entry into force has now been confirmed as January 2016.
This Risk Report for 2013 is based on Basel II’s third pillar and the resulting disclosure requirements
of the Capital Requirements Directive (as transposed into Belgian law). Although the disclosures are
set up according to the first Basel II pillar and focus on banking entities, KBC – as a bank-insurance
company preparing for the disclosure requirements of Solvency II – decided to extend the scope for
the insurance activities in order to provide an overall view of the KBC group’s risk exposure and risk
management activities.
Since the end of 2011, CRD III has also required the disclosure of information on the remuneration
policy of financial institutions. More information in this regard can be found in the ‘Corporate
governance’ section of the 2013 annual report of KBC Group NV and in a separate disclosure ’KBC
Group Compensation Report’ which will be published in the second quarter of 2014 at www.kbc.com.
To ensure that a comprehensive view is provided, the credit risk inherent in KBC Insurance has also
been included in the section on credit risk management. Furthermore, as they are managed in an
overarching group-wide fashion, the disclosures on structured credit products, market risks (non-
trading-related, i.e. Asset and Liability Management) and non-financial risks have been drawn up to
include detailed information at KBC group level (banking and insurance combined). Liquidity risk is
managed at bank level. Detailed information on the technical insurance risk borne by KBC Insurance
has also been included.
Disclosures required under Pillar 3 are only incorporated if they are deemed relevant for KBC.
Information is disclosed at the highest consolidated level. Additional information, specifically on the
material entities, is confined to the capital information in the section on ‘Capital adequacy’. For
more detailed information, please refer to the local capital disclosures of the entity concerned (for
instance, those provided on their websites).

Risk report 2013 • KBC Group • 9
Remark:
Please note that, unless otherwise stated, KBC Bank Deutschland (in 2012 and 2013), Antwerp
Diamond Bank (in 2012 and 2013), Absolut Bank (in 2012; sold in 2013), KBC Banka (in 2012; sold
in 2013), and the minority shareholding in Nova Ljubljanska banka (in 2012; sold in 2013), which
have all been recognised as ‘disposal groups’ under IFRS 5, have been excluded from the various
tables in order to maintain consistency with their treatment in the balance sheet. Where relevant,
we have provided summary information for these entities separately in the footnotes under these
tables.
KBC ensures that a representative picture is given at all times in its disclosures. The scope of the
reported information – which can differ according to the matter being dealt with – is clearly
indicated.
A comparison with the previous year is provided unless this is not possible due to differences in
scope and/or methodology.
The information provided in this document has not been subject to an external audit. However, the
disclosures have been checked for consistency with other existing risk reports and were subjected to
a final screening by authorised risk management representatives to ensure quality.
Information disclosed under IFRS 7, which has been audited, is presented in KBC’s annual report.
Broadly speaking, the information in the annual report coincides with the information in this risk
report, but a one-to-one comparison cannot always be made due to the different risk concepts used
under IFRS and Basel II. In order not to compromise on the readability of this document, relevant
parts of the annual report have been reproduced here.
This risk report is available in English on the KBC website and is updated on a yearly basis. KBC’s
next update is scheduled for the beginning of April 2015. Depending on market requirements, KBC
may however decide to provide more frequent updates.

Risk report 2013 • KBC Group • 10
Risk Management Governance

Risk report 2013 • KBC Group • 11
At the start of 2013, a new risk governance model was put in place to take account of changes in
the organisational structure of KBC.
This model is characterised primarily by:
• the Board of Directors, assisted by the Audit, Risk and Compliance (ARC) Committee, which sets
the risk appetite each year, monitors risks and proposes action, where necessary.
• integrated architecture centred on the Executive Committee that links risk appetite, strategy and
performance goal setting.
• the CRO Services Management Committee and activity-based risk committees mandated by the
Group Executive Committee.
• risk-aware business people, who act as the first line of defence for conducting sound risk
management in the group.
• a single, independent risk function that comprises the Group Chief Risk Officer (CRO), local CROs,
local risk functions and the group risk function. The risk function (together with the compliance
function) acts as the second line of defence, while Internal Audit is the third line.
Relevant risk management bodies and control functions:
• Group Executive Committee:
- makes proposals to the Board of Directors about risk and capital strategy, risk appetite, and the
general concept of the KBC Risk Management Framework;
- decides on the non-strategy-related building blocks of the KBC Risk Management Framework
and monitors its implementation throughout the group;
- allocates capital to activities in order to maximise the risk-adjusted return;
- acts as the leading risk committee, covering material issues that are channelled via the specific
risk committees or the Group Asset/Liability Management Committee (Group ALCO);
- monitors the group’s major risk exposures to ensure conformity with the risk appetite.
Board of Directors
Group LendingCommittee
Group MarketsCommittee
Group InsuranceCommittee
Group InternalControl Committee
Group Audit, Risk and Compliance Committee
Local Value andRisk Management
Group ALCO
Group ExecutiveCommittee (Group CRO)
CRO ServicesManagement Committee
Group Credit RiskGroup Risk Integration & Support

Risk report 2013 • KBC Group • 12
• Group ALCO:
- is a business committee that assists the Group Executive Committee in the domain of
(integrated) balance sheet management at group level. It handles matters related to ALM and
liquidity risk.
• Risk committees:
- The CRO Services Management Committee supports the Group Executive Committee in
assessing the adequacy of, and compliance with, the KBC Risk Management Framework and
defines and implements the vision, mission and strategy for the CRO Services of the KBC group.
- The Group Lending Committee (GLC) supports the Group Executive Committee in setting,
monitoring and following up limits for lending activities (funding, liquidity and ALM issues
related to lending activities remain the responsibility of the Group Executive Commitee/Group
ALCO).
- The Group Markets Committee (GMC) supports the Group Executive Committee in setting,
monitoring and following up limits for markets activities (trading activity, where there is not only
market risk, but also operational and counterparty credit risks).
- The Group Insurance Committee (GIC) supports the Group Executive Committee in setting,
monitoring and following up limits for insurance activities at group level.
- The Group Internal Control Committee (GICC) supports the Group Executive Committee in
monitoring and strengthening the quality and effectiveness of KBC’s internal control system.
• Local Chief Risk Officers (LCROs) are situated throughout the group according to a logical
segmentation based on entity and/or business unit. Close collaboration with the business is
assured since they take part in the local decision-making process. Independence of the LCROs is
achieved through a direct reporting line to the Group CRO.
• Group Risk Integration & Support and Group Credit Risk (known collectively as ‘the Group risk
function’) have a number of responsibilities, including monitoring risks at an overarching group-
wide level, developing risk and capital models (while business models are developed by business),
performing independent validations of all risk and capital models, developing risk frameworks and
advising/reporting on issues handled by the Group Executive Committee and the risk committees.
Performance is assessed on a yearly basis as part of the Internal Control Statement.

Risk report 2013 • KBC Group • 13
Capital Adequacy

Risk report 2013 • KBC Group • 14
Capital adequacy measures the financial strength of an institution. It relates to the level of capital a
financial institution needs to implement its business plans, taking into consideration the risks that
threaten the realisation of such plans.
Strategy and processes
In order to assess capital adequacy within the group, we use a multi-dimensional approach where
the capital situation is assessed and set off against minimum targets at group and local entity level:
• from a regulatory (i.e. pillar 1 of Basel II) and an economic (i.e. pillar 2 of Basel II) point of view;
• in the current situation and over a 3-year time horizon;
• under different macroeconomic and business conditions: likely scenarios (including base case
scenario), a recession scenario (which can be one of the likely scenarios) and internally defined
stress scenarios.
The purpose of this assessment is to make sure that KBC holds enough capital to cover the risks that
it takes. It also gives KBC the opportunity to manage capital in a pro-active way. Taking into account
the multi-dimensional approach, this broad capital picture allows top management to assess
whether business plans are in line with the capital that is available in the group and – when
necessary – to take action in a timely manner. In order to maximise the impact of the capital
adequacy assessment on decision processes, it is embedded in the planning process. As a result, the
planning process also qualifies as an Internal Capital Adequacy Assessment Process (ICAAP), as
required under pillar 2 of the Basel II accord. In the future, this process will be further expanded with
the Own Risk and Solvency Assessment (ORSA), as required under pillar 2 of the Solvency II regime
for the insurance activities of the KBC group.
The outcome of the ICAAP is discussed by KBC’s Group Executive Committee, its Audit Risk and
Compliance Committee and its Board of Directors. ICAAP as such is also subject to regulatory
examination by the National Bank of Belgium, which has resulted in a Supervisory Review and
Evaluation Process (SREP).
KBC focuses on the group situation when assessing its capital adequacy, since the sound capital
situation at group level provides adequate assurance that the group will be able to support local
entities if necessary. Nevertheless, KBC has also established ICAAPs at material banking subsidiaries.
Within the limits of regulatory constraints, KBC has no current or foreseen material or legal
obstacles to the transfer of capital or the repayment of debts among parent companies and their
subsidiaries.
Further on in this section, a distinction is made between regulatory solvency disclosures – linked to
pillar 1 of Basel II – and economic capital disclosures – linked to pillar 2 of Basel II. A brief reference
is also made to the expected impact of regulatory adjustments.

Risk report 2013 • KBC Group • 15
Regulatory solvency disclosures
Scope of solvency disclosures
The capital profile is disclosed for the KBC group as a whole, i.e. fully consolidated, as well as for
the major activities of the group, i.e. banking (KBC Bank consolidated) and insurance (KBC
Insurance consolidated). In addition, the solvency information is disclosed for a number of material
banking subsidiaries (see below).
KBC calculates its solvency position on the basis of IFRS figures and the relevant guidelines issued by
the Belgian regulator.
Overview of group solvency in 2013
Under Basel II, we use the so-called ‘building block’ method for group solvency. This entails
comparing group regulatory capital (i.e. parent shareholders’ equity adjusted for a number of items
(see table)), with the sum of the separate minimum regulatory solvency requirements for KBC Bank
and the holding company (after deduction of intercompany transactions between these entities) and
KBC Insurance. The total risk-weighted volume of insurance companies is calculated as the required
solvency margin under Solvency I divided by 8%. Regulatory minimum solvency targets were amply
exceeded in 2013, not only at year-end, but also throughout the entire year. At 31 December 2013,
the tier-1 ratio amounted to 15.8%.
The scope of consolidation used in the solvency calculation is identical to the scope used in the
financial statements, as determined by IFRS rules.

Risk report 2013 • KBC Group • 16
Solvency at group level (consolidated; under Basel II) (in millions of EUR) 31-12-2012 31-12-2013
Total regulatory capital, after profit appropriation 16 113 17 169Tier-1 capital1 14 062 14 286
Parent shareholders’ equity 12 099 11 826
Non-voting core-capital securities 3 500 2 333
Intangible fixed assets (-) -356 -341
Goodwill on consolidation (-) -987 -950
Innovative hybrid tier-1 instruments 419 409
Non-innovative hybrid tier-1 instruments 1 692 1 693
Direct and indirect funding of investments in own shares -250 0
Minority interests -5 -3
Equity guarantee (Belgian State) 276 22
Revaluation reserve, available-for-sale assets (-)6 -1 263 -1 094
Hedging reserve, cashflow hedges (-)6 834 497
Valuation differences in financial liabilities at fair value – own credit risk (-)6 -22 25
Minority interests in available-for-sale reserve and hedging reserve, cashflow hedges (-)6 0 0
Equalisation reserves (-)6 -111 -131
Dividend payout (-)2 -960 0
IRB provision shortfall (50%) (-)3 0 0
Limitation of deferred tax assets -227 0
Items to be deducted (-)4 -577 0
Tier-2 and tier-3 capital 2 051 2 883 Perpetuals (including hybrid tier-1 instruments not used in tier-1 capital) 0 0
Revaluation reserve, available-for-sale shares (at 90%) 185 290
Minority interests in revaluation reserve, available-for-sale shares (at 90%) 0 0
IRB provision shortfall (50%) (-)3 0 0
IRB provision excess (+)3 130 342
Subordinated liabilities 2 268 2 237
Tier-3 capital 44 15
Items to be deducted (-)4 -577 0
Total weighted risks 102 148 90 541Banking7 89 532 78 486
Insurance5 12 386 12 096
Holding-company activities 304 72
Elimination of intercompany transactions between banking and holding-company activities -74 -113
Solvency ratiosTier-1 ratio 13.8% 15.8%
Core tier-1 ratio 11.7% 13.5%
CAD ratio 15.8% 19.0%1 Audited figures (except for ‘IRB provision shortfall/excess’).
2 Includes the dividend on ordinary shares and the coupon on non-voting core-capital securities sold to the Belgian State and Flemish Region.
3 Excess/shortfall is defined as the (positive/negative) difference between the actual loan loss impairment recognised and the ‘expected loss’ calculation.
4 Items to be deducted, which are split 50/50 over tier-1 and tier-2 capital, include mainly participations in and subordinated claims against financial institutions in which KBC
has between a 10% and 50% share (at year-end 2012, mainly the minority shareholding in Bank Zachodni in Poland).
5 Weighted risks for insurance are calculated by multiplying capital under Solvency I by a factor of 12.5 (8% rule similar to the relationship between RWA and capital for
banking).
6 Relates to the filtering of these items from shareholders’ equity. For example, a negative amount for ‘Revaluation reserve, available-for-sale assets’ means that a positive
revaluation reserve (part of consolidated equity) is filtered out in the solvency calculation table.
7 Until year-end 2014, weighted risks include an amount that decreases annually for residual operational risks related to KBL EPB (sold in 2012).

Risk report 2013 • KBC Group • 17
During 2013:
• We reimbursed 1.17 billion euros (and paid a 50% penalty) to the Flemish Regional Government.
As a result, the remaining core-capital securities fell to 2.33 billion euros at the end of 2013 (the
additional repayment of 0.33 billion euros at the beginning of 2014 has not been included in this
calculation).
• We issued 1 billion US dollars’ worth of contingent capital notes in January 2013 (included in
tier-2 capital).
• We further divested a number of entities, including Absolut Bank, the remaining stake in the
merged Bank Zachodni-Kredyt Bank entity, Nova Ljubljanska banka and KBC Banka, all of which
had a positive impact on the solvency ratios.
• The shareholder loans (to Cera and KBC Ancora) were substantially reduced (by 1 billion euros).
• We further reduced our CDO exposure (see section on ’Structured credit products’).
Taking into account the effects of the repayment of 0.5 billion euros (including a 50% penalty) in
state aid to the Flemish Regional Government in early 2014 and of the remaining divestments for
which sale agreements have been signed but not yet completed, the pro forma tier-1 ratio would
have been 15.6% at year-end 2013.
At the beginning of March 2014, KBC Group NV announced its intention to issue a euro-
denominated, non-dilutive, Additional Tier-1 (AT1) instrument (compliant with CRD IV regulations).
This AT1 security represents a 5-year, non-call perpetual instrument with a temporary write-down
trigger at 5.125% CET1. KBC’s target capital structure includes 1.5% of RWA in the form of AT1
instruments, to be issued throughout the CRD IV implementation period. In the wake of roadshows
throughout Europe and Asia from 10 to 12 March 2014, KBC Group issued 1.4 billion euros in
non-dilutive, CRD IV-compliant Additional Tier-1 (AT1) securities. More information can be found in
the press release of 13 March 2014, available on www.kbc.com. Subject to market conditions, KBC
may call some of its outstanding stock of classic tier-1 securities on their next possible call date.
In the following table, we have shown the tier-1 and CAD ratios calculated under Basel II for KBC
Bank, as well as the solvency ratio of KBC Insurance. More detailed information on the solvency of
KBC Bank and KBC Insurance can be found in their consolidated financial statements.
Solvency, KBC Bank (consolidated)
The table shows the tier-1 and CAD ratios calculated under Basel II. It should be noted that Basel II
rules have been implemented throughout the group since 2008. In June 2012, KBC Bank, CBC
Banque, KBC Lease, KBC Finance Ireland, KBC Credit Investments and KBC Real Estate received
regulatory approval to implement the IRB Advanced approach. CSOB (Czech Republic) received its
approval in September 2012. A number of small entities followed in 2013. As a consequence, the
IRB Advanced approach (under Basel II) has become the primary method for calculating risk
weighted assets within KBC.

Risk report 2013 • KBC Group • 18
Solvency, KBC Bank (consolidated)(in millions of EUR)
31-12-2012Basel II
31-12-2013Basel II
Total regulatory capital, after profit appropriation 14 390 15 537
Tier-1 capital 12 235 12 631
Parent shareholders’ equity 11 255 11 662
Intangible fixed assets (-) -89 -105
Goodwill on consolidation (-) -969 -944
Innovative hybrid tier-1 instruments 419 409
Non-innovative hybrid tier-1 instruments 1 692 1 693
Direct and indirect funding of investments in own shares -250 0
Minority interests 351 294
Equity guarantee (Belgian State) 240 19
Revaluation reserve available-for-sale assets (-) -335 -264
Hedging reserve, cashflow hedges (-) 863 522
Valuation differences in financial liabilities at fair value own credit risk (-) -22 25
Minority interest in AFS reserve & hedging reserve, cashflow hedges (-) -1 0
Dividend payout (-) 0 -677
IRB provision shortfall (50%) (-) 0 0
Limitation of deferred tax assets -342 0
Items to be deducted (-) -577 0
Tier-2 and tier-3 capital 2 154 2 906
Perpetuals (including hybrid tier-1 instruments not used in tier-1 capital) 250 250
Revaluation reserve, available-for-sale shares (at 90%) 39 63
Minority interests in revaluation reserve, available-for-sale shares (at 90%) 0 0
IRB provision excess (+) 130 342
Subordinated liabilities 2 268 2 237
Tier-3 capital 44 15
Items to be deducted (-) -577 0
Total weighted risks 88 927 78 120
Credit risk 69 149 63 073
Market risk 8 733 4 308
Operational risk 11 045 10 738
Solvency ratios
Tier-1 ratio 13.8% 16.2%
Core tier-1 ratio 11.4% 13.5%
CAD ratio 16.2% 19.9%
The regulatory minimum under Basel II for the CAD ratio amounts to 8%. However, the regulatory
floor of 80% is still applicable, which means that the capital required under Basel II should not be
less than 80% of the capital required under Basel I. If the floor is not respected, the regulator may
increase the minimum capital ratio of 8% to cover the capital requirements below 80%. At present,
the Basel II capital requirements for KBC Bank at consolidated level are slightly above 80% of Basel I.
In Belgium, banks may issue both innovative and non-innovative hybrid capital instruments that may
account for a maximum 35% of tier-1 capital (with additional limits for the innovative hybrid
component). To be classified as non-innovative, the instrument must have a number of features, viz.
it needs to be subordinated, should not provide for any step-up in dividends, should be perpetual

Risk report 2013 • KBC Group • 19
(no general redemption right for investors) and may be converted to ordinary shares subject to
certain limits and approvals.
In order to strengthen the solvency ratios of KBC Bank and with a view to optimising the use of
hybrid instruments allowed by the regulator, KBC Bank issued so-called non-innovative hybrid tier-1
capital instruments in 2008.
On 31 December 2010, new rules entered into effect with respect to the characteristics and
proportion of hybrid instruments that may be included in pillar I tier-1 capital (‘CRD II’). The
instruments issued by KBC are not yet fully compliant with these new requirements. The European
Directive and Belgian regulations allow for a transition period, during which instruments that are no
longer compliant may still be included in tier-1 capital. During the first ten years, there would be no
additional cap on these grandfathered instruments. However, implementation of the Basel III regime
will affect this grandfathering regime. Non-compliant government-subscribed instruments will be
fully grandfathered in an initial phase. As from 2018, they will no longer qualify. The amount of
other non-compliant hybrid instruments that can be taken into account will decrease from 90% of
the outstanding amount in 2013 to 0% of the outstanding amount in 2022.
As announced in December 2012, KBC Bank NV placed 1 billion US dollars’ (approximately 750
million euros) worth of tier-2 contingent capital notes in January 2013 to create an extra capital
buffer. The notes were placed with a wide range of institutional and high-net-worth investors in
Asia and Europe. They carry a coupon of 8% per annum and have a maturity of 10 years, with an
optional call in year 5. Furthermore, the notes are subordinated and qualify as tier-2 capital under
Basel III standards (based on the draft CRD IV of 20 July 2011). A Write-Down trigger event has
been added to the terms and conditions of the instruments, which means that if the Common
Equity tier-1 capital ratio falls below 7%, the principal amount of each security will be written down
to zero and the notes cancelled. The Holders will no longer have any rights against the KBC group
with respect to interest and repayment of the aggregate principal amount written down.

Risk report 2013 • KBC Group • 20
The table below gives an overview of the main hybrid tier-1 instruments.
Overview of main hybrid tier-1 instruments
Issuer Description Original nominal amount
Nominal amount at 31-
12-2013
Start date First call date
KBC Bank directly issued perpetual debt securities
525 million GBP (200+175+150)
45 million GBP December 2003
December 2019
KBC Bank directly issued perpetual debt securities
1 250 million EUR 1 250 million EUR
May 2008 May 2013
KBC Bank directly issued perpetual debt securities
700 million EUR 700 million EUR
June 2008 June 2013
KBC Bank Funding Trust II
perpetual non-callable 10-year preferred securities
280 million EUR 118 million EUR
June 1999 June 2009
KBC Bank Funding Trust III
non-cumulative guaranteed trust preferred securities
600 million USD 169 million USD
November 1999
November 2009
KBC Bank Funding Trust IV
non-cumulative guaranteed trust preferred securities
300 million EUR 117 million EUR
November 1999
November 2009
Solvency, material banking subsidiaries
Solvency information is also disclosed for material banking subsidiaries. Materiality in this respect is
defined by KBC in the way set out in the EBA guidelines on co-operation between consolidating
supervisors and home supervisors. It therefore takes into account:
• from a KBC group perspective, the contribution to earnings and overall risk of the group, and
• from a local perspective, the importance of the KBC entity to the local banking system as
expressed in terms of market share, for instance.
CBC Banque, CSOB (Czech Republic), CSOB (Slovak Republic), KBC Bank (Ireland) and K&H Bank
have been identified as material banking subsidiaries.
A summary of the solvency information for these entities is provided in the table below. For details
on the capital profile of material banking subsidiaries, please refer to the capital disclosures in the
annual reports of the relevant entities.
Solvency, material banking subsidiaries (in millions of EUR)
31-12-2012 31-12-2013
Total regulatory
capital
Total weighted
risk
CAD ratio Total regulatory
capital
Total weighted
risk
CAD ratio
CBC Banque Belgian GAAP
485 2 303 21.0% 433 2 434 17.8%
CSOB (Czech Republic) IFRS 2 074 13 612 15.2% 2 030 13 289 15.3%
CSOB (Slovak Republic) IFRS 576 3 973 14.5% 555 3 839 14.5%
KBC Bank Ireland IFRS 912 8 181 11.1% 938 7 333 12.8%
K&H Bank IFRS 650 4 985 13.0% 601 4 506 13.3%

Risk report 2013 • KBC Group • 21
Solvency, KBC Insurance (consolidated)
At present, KBC Insurance applies Solvency I rules to calculate the solvency ratio, in accordance with
the regulator’s guidelines.
Some specific elements in the available capital calculation are:
• The equalisation reserve – calculated under Belgian GAAP – which is deducted from available
capital.
• The available capital, which includes until the third quarter of 2013:
- 90% of the net positive revaluation reserve for available-for-sale shares and 100% of the net
positive revaluation reserve for available-for-sale bonds.
- Unrealised gains on property and equipment, investment property and held-to-maturity
instruments.
The combined amount of the above two items cannot exceed a formula-based maximum, equalling
the total net amount of unrealised gains/losses in respect of all investments (i.e. the revaluation
reserves for AFS investments – including the negative figures – and the unrealised gains/losses on
property and equipment, investment property and held-to-maturity instruments).
At year-end 2013, the available capital included:
• 80% of latent gains on bonds held by KBC Insurance NV (previously 100% and also including
latent gains of subsidiaries of KBC Insurance NV) (net latent losses are not deducted);
• 100% of net latent gains on AFS shares held by KBC Insurance NV (previously also including latent
gains of subsidiaries of KBC Insurance NV; net latent losses are not deducted) and excluding latent
gains on real estate.
The Solvency I capital ratio amounted to 281% at the end of 2013, comfortably above the
minimum regulatory solvency requirement of 100%. The drop in available capital of KBC Insurance
was caused primarily by the application of more stringent rules imposed by the regulator regarding
partial inclusion of latent gains in the available capital.
Under Solvency I, the solvency capital requirements are purely volume-based (maximum of a
percentage of the premium and a percentage of the claims cost) and do not take into account the
asset mix and asset quality. In order to improve the capital regulations, a new EU solvency regime
(Solvency II) is being drafted (see separate section on Solvency II).

Risk report 2013 • KBC Group • 22
Solvency, KBC Insurance (consolidated)(in millions of EUR)
31-12-2012 31-12-2013
Available capital 3 190 2 721
Parent shareholders’ equity 3 292 3 295
Dividend payout (-) -286 -252
Minority interests 0 0
Subordinated liabilities 10 0
Intangible fixed assets (-) -9 -10
Goodwill on consolidation (-) -162 -150
Revaluation reserve available-for-sale investments (-) -920 -830
Equalisation reserve (-) -111 -131
Equity guarantee (Belgian State) 36 3
Cashflow hedge reserve -28 -25
90% of positive revaluation reserve, available-for-sale shares 142 188
Latent gains on bonds 1 173 633
Latent gains on real estate 52 0
Limitation of latent gains on shares and real estate 0 0
Required solvency margin 991 968
Subtotal, non-life insurance 208 214
Non-life and industrial accident (legal lines) 201 207
Annuities 7 7
Subtotal, life insurance 767 752
Class-21 life insurance 752 735
Class-23 life insurance 15 17
Other 15 2
Solvency ratio and surplus
Solvency ratio (%) 322% 281%
Solvency surplus (in millions of EUR) 2 199 1 753
Basel III and Solvency II
The Basel III proposals and corresponding European Directive and Regulation (CRD IV/CRR) introduce
new, more stringent capital requirements for financial institutions. The new Regulation will enter
gradually into force, starting on 1 January 2014, and be fully implemented by 1 January 2022.
The legal minimum tier-1 ratio will be increased from 4% under Basel II to 6% under CRD IV/CRR.
At least 4.5 percentage points of this tier-1 ratio has to consist of core capital (common equity tier-1
capital, or ‘common equity’). On top of this minimum common equity, a number of additional
buffers have been put in place, including a capital conservation buffer of 2.5%, a countercyclical
buffer in times of excessive credit growth (between 0% and 2.5%, to be determined by the
regulator) and a systemic buffer (likewise to be determined by the regulator). Moreover, the quality
of the items of the available capital increases, as higher eligibility criteria are defined for instruments
to be included in the calculation of regulatory capital.

Risk report 2013 • KBC Group • 23
For KBC, the main impact of the shift from Basel II to CRD IV/CRR is the treatment of deferred tax
assets and the removal of the filter for unrealised gains and losses on available-for-sale instruments.
Additionally, the building block method will be replaced by the so-called Danish compromise
method (the general rule in CRD IV/CRR with regard to insurance participations for (mixed) financial
holdings and financial conglomerates is that own funds in that entity are deducted from the
common equity tier-1 capital. However, national regulators can grant a waiver, permitting
institutions to apply a 370% weighting instead (the Danish compromise)). KBC received a waiver
from the National Bank of Belgium, but it is still not clear whether this waiver will be granted once
the ECB becomes the competent supervisory authority.
KBC’s internal minimum target for the common equity ratio is 10% on a fully loaded basis
(presuming full implementation of all CRD IV/CRR rules, and including the remaining financial
support provided by the Flemish Regional Government until 2018). On 31 December 2013, the fully
loaded common equity ratio (Danish compromise method) stood at 12.8% (13.2% on a phased-in
basis), well above the in-house target. Taking into account the effects of the repayment of 0.5
billion euros in state aid to the Flemish Regional Government in early 2014 and of the remaining
divestments for which sale agreements have been signed but not yet completed, the pro forma fully
loaded common equity ratio would have been 12.5% at year-end 2013.
Moreover, the supervisory authorities (with the National Bank of Belgium as the consolidating
supervisor) have taken their Joint Home-Host Capital Decision for KBC Group NV: KBC has been
informed of the request to maintain a permanent minimum fully loaded common equity ratio of
9.25%, excluding latent gains. According to this calculation, this ratio stood at 12.5% at year-end
2013, well above the regulatory minimum.

Risk report 2013 • KBC Group • 24
Solvency at group level (consolidated; under CRD IV/CRR (Basel III), Danish compromise method)(in millions of EUR)
31-12-2013Fully loaded
Total regulatory capital, after profit appropriation 16 258Tier-1 capital 11 711
Common equity 11 711
Parent shareholders’ equity (excluding non-voting core-capital securities and minority interests) 11 361
Non-voting core-capital securities 2 333
Intangible fixed assets (-) -341
Goodwill on consolidation (-) -950
Minority interests -3
Hedging reserve, cashflow hedges (-) 497
Valuation differences in financial liabilities at fair value – own credit risk (-) -6
Equalisation reserve (-) -131
Dividend payout (-) 0
Remuneration of government securities (-) 0
Deduction with regard to financing provided to shareholders (-) -176
IRB provision shortfall (-) -225
Deferred tax assets on losses carried forward (-) -648
Limit on deferred tax assets from temporary differences relying on future profitability and significant partici-pations in financial sector entities (-)
0
Additional going concern capital 0
Grandfathered innovative hybrid tier-1 instruments 0
Grandfathered non-innovative hybrid tier-1 instruments 0
CRR-compliant AT1 instruments 0
Minority interests to be included in additional going concern capital 0
Tier-2 capital 4 547IRB provision excess (+) 342
Subordinated liabilities 4 206
Subordinated loans non-consolidated financial sector entities (-) 0
Minority interests to be included in tier-2 capital 0
Total weighted risk volume 91 426Banking 80 399
Insurance 11 068
Holding-company activities 72
Elimination of intercompany transactions -113
Solvency ratiosCommon equity ratio 12.8%
Tier-1 ratio 12.8%
CAD ratio 17.8%
Solvency at group level (consolidated; under CRD IV/CRR (Basel III), ‘building block’ method) 31-12-2013Fully loaded
Common equity ratio 13.2%
Tier-1 ratio 13.2%
CAD ratio 18.1%

Risk report 2013 • KBC Group • 25
Solvency at KBC Bank (consolidated; under CRD IV/CRR (Basel III)) (in millions of EUR)
31-12-2013Fully loaded
Total regulatory capital, after profit appropriation 14 400
Tier-1 capital 9 602
Common equity 9 602
Parent shareholders’ equity (excluding non-voting core-capital securities and minorities) 11 662
Intangible fixed assets (-) -105
Goodwill on consolidation (-) -944
Minority interests 147
Hedging reserve, cashflow hedges (-) 522
Valuation differences in financial liabilities at fair value – own credit risk (-) -6
Dividend payout (-) -677
Deduction with regard to financing provided to shareholders (-) -176
IRB provision shortfall (-) -225
Deferred tax assets on losses carried forward (-) -595
Limit on deferred tax assets from timing differences relying on future profitability and significant participations in financial sector entities (-)
0
Additional going concern capital 0
Grandfathered innovative hybrid tier-1 instruments 0
Grandfathered non-innovative hybrid tier-1 instruments 0
CRR-compliant AT1 instruments 0
Minority interests to be included in additional going concern capital 0
Tier-2 capital 4 797
IRB provision excess (+) 342
Subordinated liabilities 4 456
Subordinated loans non-consolidated financial sector entities (-) 0
Minority interests to be included in tier-2 capital 0
Total weighted risk volume 80 003
Solvency ratios
Common equity ratio 12.0%
Tier-1 ratio 12.0%
CAD ratio 18.0%
Solvency II is the new regulatory solvency regime for all EU insurance and reinsurance companies.
Whereas the current insurance solvency requirements (Solvency I) are volume-based, Solvency II
pursues a risk-based approach. It aims to implement solvency requirements that better reflect the
risks that companies face and deliver a supervisory system that is consistent across all EU Member
States. The official entry into force of Solvency II – previously scheduled for January 2013 – is now
confirmed to be January 2016. Based on the most recent draft version of the Solvency II regulations,
the Solvency II ratio of the KBC Insurance Group in 2013 amply exceeded the minimum
requirements. In 2011, KBC invested in a Solvency II solution, which allows us to follow up our key
metrics on a regular basis, with a central Solvency II solution performing the calculations for all
insurance entities.

Risk report 2013 • KBC Group • 26
Economic capital
We use an economic capital model to measure the overall risk KBC is exposed to through its various
activities, taking the different risk factors into consideration. We report the estimates generated by
this model on a quarterly basis to the Group Executive Committee, the ARC Committee and the
Board of Directors.
We define economic capital as the amount of capital required to absorb very severe losses,
expressed in terms of the potential reduction in the economic value of the group (i.e. the difference
between the current economic value and the worst-case economic value over a one-year time
horizon and at a certain confidence level), in line with the risk appetite set by the Board of Directors.
We calculate economic capital per risk category using a common denominator (the same time
horizon of one year and the same confidence interval) and then aggregate them. Since it is
extremely unlikely that all risks will materialise at the same time, an allowance is made for
diversification benefits when aggregating the individual risks.
As mentioned previously, economic capital is used as a major building block for ICAAP (Basel II,
pillar 2). In addition, it provides essential input for risk-adjusted performance measurement.
The breakdown of KBC’s economic capital per risk type is provided in the following table.
Economic capital distribution, KBC group* 2012 2013Credit risk 56% 55%
Non-trading market risk 25% 28%
Trading market risk 1% 1%
Business risk 8% 8%
Operational risk 6% 5%
Technical insurance risk 3% 3%
Funding cost and bid/offer spread risk 0% 0%
Total 100% 100%* All percentages relate to figures at the end of December. Excluding entities classified as ‘disposal groups’ under IFRS 5 (see ‘Remark’ at the start of this section) and whose
contribution to KBC’s economic capital was around 3% in 2013 and 6% in 2012.The figures for the end of December 2012 are significantly different than those for the
end of September 2012 in the 2012 report (i.e. non-trading market risk has increased significantly whereas credit risk has decreased owing to the improvements made to
the model).
Risk-Adjusted Performance Measurement
In 2011, KBC developed a Risk-Adjusted Performance Measurement (RAPM) policy, whereby
risk-adjusted performance metrics were used for allocating capital and setting variable
remuneration. The capital allocation track of this policy is embedded in the strategic planning
process. The remuneration policy also includes risk-adjusted features based on RAPM metrics.
Risk-adjusted measures calculate profitability using expected losses, i.e. losses that are expected
given the risk profile of the portfolio. Using expected losses and hence a longer term view of the
profitability of the portfolio not only guarantees that management is aware of risks when times are
good, but also avoids disproportionate decisions and actions being taken during adverse economic
periods.
The basic idea behind the risk adjustment of the capital base in RAPM is that regulatory capital has
limited coverage in terms of risk types and only partly reflects the specific characteristics of KBC.
Economic capital covers a broader scope of risk and reflects KBC’s own estimates of the risk profile.

Risk report 2013 • KBC Group • 27
Liquidity Risk Management

Risk report 2013 • KBC Group • 28
Liquidity risk is the risk that an organisation will be unable to meet its payment obligations as they
come due, without incurring unacceptable losses.
The principal objective of our liquidity management is to be able to fund the group and to enable
the core business activities of the group to continue to generate revenue, even under adverse
circumstances. Since the financial crisis, there has been an increased focus on liquidity risk
management throughout the industry, and this has been intensified by the minimum liquidity
standards defined by the Basel Committee.
We continue to incorporate these Basel III concepts into our liquidity and funding framework, as
well as into our financial planning.
Strategy and processes
A group-wide ‘liquidity risk management framework’ is in place to define the risk playing field.
Liquidity management itself is organised within the Group Treasury function, which acts as a first
line of defence and is responsible for the overall liquidity and funding management of the KBC
group. The Group Treasury function monitors and steers the liquidity profile on a daily basis and sets
the policies and steering mechanisms for funding management (intra-group funding, funds transfer
pricing). These policies ensure that local management has an incentive to work towards a sound
funding profile. It also actively monitors its collateral on a group-wide basis and is responsible for
drafting the liquidity contingency plan that sets out the strategies for addressing liquidity shortfalls
in emergency situations.
Representing the second line of defence, the risk department consists of the Group Chief Risk
Officer (Group CRO), local CROs and group and local risk functions. Some of the tasks that fall
within the remit of the risk functions are monitoring risks at portfolio/entity level, creating risk
measurements, developing frameworks and advising/reporting on issues handled by the group and
local Executive Committee/Risk Committees.
Lastly, the third line of defence comprises the audit function, responsible for auditing the efficiency
and effectiveness of the risk management system and its compliance with the risk management
framework, as well as the way in which line management handles risks outside this formal
framework.
The liquidity management framework and group liquidity limits are set by the Group Executive
Committee and Board of Directors. By approving the framework, a risk appetite is chosen as the
framework describes which measures are subject to limits. Decisions on setting maximum or
minimum values for the different measures are taken in the financial planning process.

Risk report 2013 • KBC Group • 29
Our liquidity risk management framework is based on the following pillars:
• Contingency liquidity risk. This risk is assessed on the basis of liquidity stress tests, which measure
how the liquidity buffer of the group’s bank entities changes under extreme stressed scenarios.
This buffer is based on assumptions regarding liquidity outflows (retail customer behaviour,
professional client behaviour, drawing of committed credit lines, etc.) and liquidity inflows
resulting from actions to increase liquidity (‘repoing’ the bond portfolio, reducing unsecured
interbank lending, etc.). The liquidity buffer has to be sufficient to cover liquidity needs (net cash
and collateral outflows) over (i) a period that is required to restore market confidence in the group
following a KBC-specific event, (ii) a period that is required for markets to stabilise after a general
market event and (iii) a combined scenario, which takes a KBC-specific event and a general
market event into account. The overall aim of the liquidity framework is to remain sufficiently
liquid in stress situations, without resorting to liquidity-enhancing actions which would entail
significant costs or which would interfere with the core banking business of the group.
• Structural liquidity risk. We manage our funding structure so as to maintain substantial
diversification, to minimise funding concentrations in time buckets, and to limit the level of
reliance on short-term wholesale funding. We manage the structural funding position as part of
the integrated strategic planning process, where funding – in addition to capital, profits and risks
– is one of the key elements. At present, our strategic aim for the next few years is to build up a
sufficient buffer in terms of the Basel III LCR and NSFR requirements via a funding management
framework, which sets clear funding targets for the subsidiaries (own funding, reliance on
intra-group funding) and provides further incentives via a system of intra-group pricing to the
extent subsidiaries run a funding mismatch.
In the table below, we have illustrated the structural liquidity risk by grouping the assets and
liabilities according to the remaining term to maturity (contractual maturity date). The difference
between the cash inflows and outflows is referred to as the ‘net funding gap’. At year-end 2013,
KBC had attracted 25 billion euros’ worth of funding on a gross basis from the professional
interbank and repo markets.
• Operational liquidity risk. Operational liquidity management is conducted in the treasury
departments, based on estimated funding requirements. Group-wide trends in funding liquidity
and funding needs are monitored on a daily basis by the Group Treasury function, ensuring that a
sufficient buffer is available at all times to deal with extreme liquidity events in which no wholesale
funding can be rolled over.
Scope of liquidity risk management
This liquidity risk report covers most material entities of the KBC group that carry out banking
activities, i.e. KBC Bank NV, CBC Banque SA, KBC Lease, KBC Financial Products, CSOB Czech
Republic, CSOB Slovak Republic, KBC Bank Ireland, CIBank, KBC Credit Investments, KBC Finance
Ireland, Commercial Finance, IFIMA and K&H. KBC Insurance entities are not included, since they are
generally liquidity providers and not liquidity users.

Risk report 2013 • KBC Group • 30
Structural liquidity risk
The table below illustrates structural liquidity risk by grouping the assets and liabilities according to
the remaining term to maturity (contractual maturity date). The difference between the cash inflows
and outflows is referred to as the ‘net funding gap’.
Liquidity risk at year-end (excluding intercompany deals)* (in billions of EUR)
<= 1 month
1–3 months
3–12 months
1–5 years
5–10 years
> 10 years
On demand
Not defined Total
31-12-2012Total inflows 29 12 17 50 44 34 0 39 225
Total outflows 31 20 14 36 5 1 79 39 225
Professional funding 13 12 2 1 0 0 0 0 29
Customer funding 13 5 7 15 4 1 79 0 124
Debt certificates 1 4 4 20 1 1 0 1 32
Other 3 0 0 0 0 0 0 38 40
Liquidity gap (excl. undrawn commitments) -2 -8 2 15 39 33 -79 1 0
Undrawn commitments – – – – – – – -28 –Financial guarantees – – – – – – – -11 –Net funding gap (incl. undrawn commitments) -2 -8 2 15 39 33 -79 -38 -39
31-12-2013Total inflows 17 10 18 53 42 34 0 32 205
Total outflows 27 11 20 29 7 2 84 25 205
Professional funding 17 2 2 1 0 0 1 1 25
Customer funding 7 6 12 13 3 1 83 0 126
Debt certificates 0 4 6 15 3 1 0 0 29
Other 2 0 0 0 0 0 0 23 25
Liquidity gap (excl. undrawn commitments) -10 -2 -2 24 35 32 -84 7 0
Undrawn commitments – – – – – – – -25 –Financial guarantees – – – – – – – -10 –Net funding gap (incl. undrawn commitments) -10 -2 -2 24 35 32 -84 -28 -35* Cashflows exclude interest rate flows consistent with internal and regulatory liquidity reporting. Inflows/outflows that arise from margin calls posted/received for MtM positi-
ons in derivatives are reported in the ‘not defined’ bucket. Entities classified as ‘disposal groups’ under IFRS 5 (see ‘Remark’ at the start of this section) have also been excluded
(balance sheet total of 3.9 billion euros for 2013). ‘Professional funding’ includes all deposits from credit institutions and investment firms, as well as all repos. Instruments are
classified on the basis of their first callable date. Some instruments are reported at fair value (on a discounted basis), whereas others are reported on an undiscounted basis (in
order to reconcile them with Note 18 of the ‘Consolidated financial statements’ section). Due to the uncertain nature of the maturity profile of undrawn commitments and
financial guarantees, these instruments are reported in the ‘Not defined’ bucket. The ‘Other’ category under ‘Total outflows’ contains own equity, short positions, provisions
for risks and charges, tax liabilities and other liabilities.
In line with the activities of a banking group, funding sources generally have a shorter maturity than
the assets that are funded, leading to a net liquidity gap in the shorter time buckets and a liquidity
excess in the longer term buckets. This creates liquidity risk if KBC would be unable to renew
maturing short-term funding. Our liquidity framework imposes a funding strategy to ensure that the
liquidity risk remains within the group’s risk appetite.

Risk report 2013 • KBC Group • 31
Liquid asset buffer
KBC Bank has a solid liquidity position. Historically, we have always had a substantial amount of
liquid assets. At year-end 2013, KBC Bank (at the consolidated level) had 57.1 billion euros’ worth
of unencumbered central bank eligible assets, 33.5 billion euros of which in the form of liquid
government bonds (59%). The remaining available liquid assets were other ECB/FED eligible bonds
(29%) and pledgeable credit claims (12%). Most of the liquid assets are expressed in euros, Czech
koruna and Hungarian forint (all home market currencies).
Unencumbered liquid assets were more than four times the net recourse to short-term wholesale
funding, while funding from non-wholesale markets was accounted for by stable funding from core
customer segments in our core markets. The liquid asset buffer at year-end is presented in the graph
(below).
Funding information
KBC continues to have a strong retail/mid-cap deposit base in its core markets, resulting in a stable
funding mix. A significant portion of the funding is attracted from core customer segments and
markets.
KBC Group’s funding mix can be broken down as follows (figures relate to 31 December 2013):
• Funding from customers (132.9 billion euros, 75% of the total figure), consisting of demand
deposits, time deposits, savings deposits, other deposits, savings certificates and debt issues
placed in the network. Some 63% of the funding from customers relates to private individuals
and SMEs.
Short-term unsecured fundingcompared to liquid assets
(KBC Bank, in billions of EUR)*
57.1
Available liquid assets
Net short term funding
31-12-201331-12-2012
22.8
13.1
53.9
* Excluding divestments that have not yet been completed. Available liquid assets have been derived from the treasury management report.
Funding mix
75%73%
2%3%8%10%2%3%
9%8%0%6%
31-12-201331-12-2012
Funding from customers
Certificates of deposit
Total equity
Debt issues placed with institutional entities
Net secured funding
Net unsecured interbank funding
100%
Risk report 2013 • KBC Group • 32
• Senior unsecured debt placed with institutional investors (17.1 billion euros, 10% of the total
figure), mainly comprising IFIMA debt issues (12.4 billion euros), covered bonds (3.9 billion euros)
and the contingent capital notes issued in January 2013 (0.75 billion euros).
• Net unsecured interbank funding (4.8 billion euros, 3% of the total figure).
• Net secured funding (3.2 billion euros in repo funding, 2% of the total figure) and certificates of
deposit (3.5 billion euros, 2% of the total figure).
• Total equity (14.5 billion euros, 8% of the total figure).
Please note that:
• We recorded continuous solid growth in customer deposits at different entities, especially in
Ireland, where concerted efforts to build a retail deposit base have helped increase KBC Bank
Ireland’s funding independence. Deposits from customers in KBC Ireland increased from 2.7 billion
euros as at end 2012 to 3.5 billion euros at year-end 2013.
• During 2013, KBC Bank used its EMTN programme to raise 1.1 billion euros in long-term funding,
0.75 billion euros of which was raised through wholesale benchmark issues.
• In November 2012, we announced our Belgian residential mortgage covered bonds programme.
This 10-billion-euro programme was set up following the entry into force of the Act of 3 August
2012 that established a legal framework for Belgian covered bonds. This new bond programme
gives KBC access to the covered bond market, allowing it to diversify its funding structure and
reduce the cost of long-term funding. At the start of December 2012, we launched a first covered
bond issue in the amount of 1.25 billion euros. More issues followed in 2013 for a total of 2.67
billion euros.
• In 2013, we also repaid 8.3 billion euros borrowed from the ECB under the long-term refinancing
operations (LTROs), thanks to the vastly improved state of the wholesale funding market and
KBC’s solid liquidity position. At year-end 2013, only 470 million euros in LTRO loans remained
outstanding at KBC Deutschland, an entity for which a divestment agreement has already been
signed.
LCR and NSFR
Both the Liquidity Coverage Ratio (LCR) and Net Stable Funding Ratio (NSFR) are defined in the
‘Glossary’. At year-end 2013, our NSFR stood at 111% and our LCR at 131%, both calculated based
on KBC’s interpretation of current Basel Committee guidance and CRD IV/CRR. This is well above
the minimum regulatory requirements and KBC’s own targets of 105% and 100% for 2015,
respectively.

Risk report 2013 • KBC Group • 33
Credit Risk Management

Risk report 2013 • KBC Group • 34
Credit risk is the potential negative deviation from the expected value of a financial instrument
arising from the non-payment or non-performance by a contracting party (for instance, a borrower,
guarantor, insurer or re-insurer, counterparty in a professional transaction or issuer of a debt
instrument), due to that party’s insolvency, inability or lack of willingness to pay or perform, or to
events or measures taken by the political or monetary authorities of a particular country (country
risk). Credit risk thus encompasses default risk and country risk, but also includes migration risk,
which is the risk for adverse changes in credit ratings.
Credit risk can occur both in the banking entities and in the insurance entities of the group. As
regards banking activities, credit risk occurs mainly in lending activities (including leasing and
factoring). However, it can also arise through trading activities and in treasury activities.
Credit risk arising from insurance activities stems mostly from the investment portfolios, which, for
instance, include investments in debt securities.
Strategy and processes
We manage credit risk at both transactional and portfolio level. Managing credit risk at the
transactional level means that we have sound practices, processes and tools in place to identify and
measure the risks before and after accepting individual credit exposures. Limits and delegations
(based on parameters such as internal risk class, type of counterparty) are set to determine the
maximum credit exposure allowed and the level at which acceptance decisions are taken. Managing
the risk at portfolio level encompasses inter alia periodic measuring and analysing of risk embedded
in the consolidated loan and investment portfolios and reporting on it, monitoring limit discipline,
conducting stress tests under different scenarios, taking risk mitigating measures and optimising the
overall credit risk profile.
Credit risk management at transactional level
We have sound acceptance policies and procedures in place for all kinds of credit risk exposure. We
are limiting our description below to exposures related to traditional loans to businesses and to
lending to individuals, as these account for the largest part of the group’s credit risk exposure.
Lending to individuals (e.g., mortgages) is subject to a standardised process, during which the
output of scoring models plays an important role in the acceptance procedure. Lending to
businesses is subject to a more integrated acceptance process in which relationship management,
credit acceptance committees and model-generated output are taken into account.
For most types of credit risk exposure, monitoring is determined primarily by the risk class, with a
distinction being made based on the Probability of Default (PD) and the Loss Given Default (LGD).
The latter reflects the estimated loss that would be incurred if an obligor defaults.

Risk report 2013 • KBC Group • 35
In order to determine the risk class, we have developed various rating models for measuring how
creditworthy borrowers are and for estimating the expected loss of various types of transactions. We
use a number of uniform models throughout the group (models for governments, banks, large
companies, etc.), while others have been designed for specific geographic markets (SMEs, private
individuals, etc.) or types of transaction. We use the same internal rating scale throughout the
group.
We use the output generated by these models to split the normal loan portfolio into internal rating
classes ranging from 1 (lowest risk) to 9 (highest risk) for the PD. We assign an internal rating
ranging from PD 10 to PD 12 to a defaulted obligor. PD class 12 is assigned when either one of the
obligor’s credit facilities is terminated by the bank, or when a court order is passed instructing
repossession of the collateral. PD class 11 groups obligors that are more than 90 days past due (in
arrears or overdrawn), but that do not meet PD 12 criteria. PD class 10 is assigned to obligors for
which there is reason to believe that they are unlikely to pay (on time), but that do not meet the
criteria for classification as PD 11 or PD 12.
We review loans to large corporations at least once a year, with the internal rating being updated as
a minimum. If ratings are not updated in time, a capital add-on is imposed. Loans to small and
medium-sized enterprises as well as to private individual, are reviewed periodically, with account
being taken of any new information that is available (such as arrears, financial data, a significant
change in the risk class). This monthly exercise can trigger a more in-depth review or may result in
action also being taken towards the client.
For credit linked to defaulted borrowers in PD classes 10, 11 and 12 (impaired loans), we record
impairment losses based on an estimate of the net present value of the recoverable amount. This is
done on a case-by-case basis, and on a statistical basis for smaller credit facilities. In addition, for
non-defaulted credit in PD classes 1 to 9, we record impairment losses on a ‘portfolio basis’, using a
formula based on the IRB Advanced models used internally, or an alternative method if a suitable
IRB Advanced model is not yet available.
In order to avoid a situation where an obligor facing financial difficulties ends up defaulting, we can
decide to renegotiate its loans in accordance with internal policy guidelines. Distressed renegotiated
loans are loans whose original payment terms have been altered, due to a deterioration in the
borrower’s financial condition.
Renegotiation may involve:
• declaring a moratorium (temporary principal and/or interest payment holidays);
• lowering or postponing interest or fee payments;
• extending the term of the loan to ease the repayment schedule;
• capitalising arrears;
• writing off part of the debt and providing debt forgiveness.

Risk report 2013 • KBC Group • 36
The negotiated changes must be reflected in a new, or an amended, and duly signed loan
agreement. A renegotiation tag is attached to the file in the credit systems for identification,
monitoring and reporting purposes.
A client with a distressed renegotiated loan will in principle be assigned PD class 9 or higher.
If – based on the bank’s assessment of the borrower’s revised financial projections/restructuring
plans – there is a reasonable chance that the borrower will be able to meet the renegotiated terms
of the loan, and the expected loss (in the broad sense) for the bank after renegotiation will be lower
than it would have been without renegotiation, the credit committee will assign/confirm PD 9. Some
exceptions to the PD 9 principle exist for certain retail portfolios. In such cases, the PD class to be
assigned is determined on the basis of the behavioural score and may end up being lower than 9.
However, a higher PD than the one assigned to borrowers without restructured loans is the usual
outcome, as the behavioural score takes into account any irregularity in payments.
If a distressed renegotiated loan is approved and the credit committee is of the opinion that it is
unlikely that the borrower will be able to meet the renegotiated terms – or if a loan to a
counterparty was (partially) charged off – PD class 10 (or higher) will be assigned. In this case, an
obligor needs to be classified as ‘defaulted’ according to KBC’s rules and the need for provisioning
has to be assessed. It is highly likely that an impairment charge will be recorded.
If, one year after the loan has been renegotiated, the credit committee is of the opinion that the
borrower is showing signs of improvement and that the loan’s renegotiated terms are likely to be
met, then – in the case of PD 9 – a better classification may be assigned to the borrower and the
renegotiation tag can be removed. If a borrower is classified as PD 10 (or higher), PD 9 (only) may in
principle be assigned for one year and the renegotiation tag kept in place. If the credit committee
decides that the existing PD class 9 (or higher) should remain unchanged or that a worse rating
should be assigned, the renegotiation tag may not be removed for the time being (i.e. at least until
the next review takes place).
At the end of 2013, distressed renegotiated loans accounted for some 5.5% of the total loan
portfolio (amount outstanding, excluding entities classified as ‘disposal groups’ under IFRS 5). A
breakdown is provided below.

Risk report 2013 • KBC Group • 37
Distressed renego-tiated loans, 31-12-2013 (in millions of EUR)
Total out- standing
portfolio1
Distressed renegotiated loans
Total(% of out-
standing portfolio)
Breakdown by PD classSpecific impair-
mentPD 1-8 PD 9 PD 10 PD 11-12
(impaired, less than
90 days past due)
(impaired, 90 days
and more past due)
Total 136 525 7 448 5% 581 830 4 309 1 727 1 751By business unitBelgium Business Unit 86 913 2 207 3% 377 446 1 074 311 381
Czech Republic Business Unit 20 234 378 2% 129 25 128 96 83
International Markets Business Unit 25 894 4 845 19% 75 360 3 108 1 303 1 280
Ireland 15 280 3 999 26% 28 281 2 903 787 1 000
Slovakia 4 635 105 2% 23 9 23 49 30
Hungary 5 080 507 10% 9 57 161 281 164
Bulgaria 747 234 31% 15 13 21 185 86
Group Centre 3 483 18 1% 0 0 0 18 8
By client segmentPrivate individuals2 59 014 3 635 6% 278 320 2 314 722 792
SMEs 32 045 474 1% 107 166 102 100 78
Corporations3 45 466 3 339 7% 196 344 1 893 905 881
1 Gross amounts, before impairment (these amounts therefore differ from the accounting figures used in other sections).
2 99% of the renegotiated loans total relates to mortgage loans.
3 49% of the renegotiated loans total relates to commercial real estate loans.
In line with the new (draft) guidelines on non-performing exposures and forbearance measures laid
down by the European Banking Authority, KBC has made preparations to adopt the policies on
restructured loans and on the definition of default, which are to be implemented in 2014. When a
final decision is reached, new/changed criteria will be put in place to define forborne loans and to
reclassify PD 10 as ‘non-performing’ (instead of ‘performing’ at present).
Credit risk management at portfolio level
We also monitor credit risk on a portfolio basis, inter alia by means of monthly and/or quarterly
reports on the consolidated credit portfolio in order to ensure that lending policy and limits are
being respected. In addition, we monitor the largest risk concentrations via periodic and ad hoc
reports. Limits are in place at borrower/guarantor, issuer or counterparty level, at sector level and for
specific activities or geographic areas. Moreover, we perform stress tests on certain types of credit
(for instance, mortgages), as well as on the full scope of credit risk.
Whereas some limits are still in notional terms, we also use concepts such as ‘expected loss’ and
‘loss given default’. Together with ‘probability of default’ and ‘exposure at default’, these concepts
form the building blocks for calculating the regulatory capital requirements for credit risk, as KBC
has opted to use the Basel II Internal Rating Based (IRB) approach. After receiving the approval of
the regulators in 2012, the main group entities adopted the IRB Advanced approach and were
joined by a number of smaller entities in 2013. Others are scheduled to shift to the IRB Advanced or
Foundation approaches in 2014. ‘Non-material’ entities will continue to adopt the Basel II
Standardised approach.

Risk report 2013 • KBC Group • 38
Scope of credit risk disclosures
The scope of the disclosures for credit risk is based on the implementation of Basel II at KBC, and
can be inferred from the roll-out plan below.
With regard to the timing of and approach to implementing Basel II, KBC has opted for a phased
roll-out of the IRB approach at all its material entities. A material entity in this respect is defined as
any subsidiary that accounts for more than 1% of the risk-weighted assets for credit risk at KBC
Group NV. Compliance with this criterion is checked at least yearly. The first set of material entities
started adopting the IRB Foundation approach at the beginning of 2007. As already mentioned
above, the main group entities received regulatory approval to switch to the IRB Advanced approach
during 2012. The internal target dates for the other material entities to adopt the IRB Foundation or
IRB Advanced approach are shown in the table below. Any switchover is of course subject to
regulatory approval.
Material entities that had not yet adopted the IRB Foundation or Advanced approach in 2013 are
following the Basel II Standardised approach for the time being. This approach will also be adhered
to until further notice by the other (non-material) entities of the KBC group.
The scope of this report is limited to the material entities appearing in the roll-out table below.
These entities accounted for 95% of the total credit risk weighted assets of the KBC group in 2013.
Because of this limitation in scope, and also because another definition of exposure1 is used in the
accounting figures, a one-to-one comparison cannot be made with similar disclosures in KBC Bank’s
2013 Annual Report.
1 In this report, credit exposure – where possible – is expressed as EAD (Exposure At Default), while it is expressed as an amount granted or an amount outstanding in the
annual report. EAD is a typical measure for exposure within the context of Basel II, pillar I.

Risk report 2013 • KBC Group • 39
Roll-out of Basel II pillar 1 approach at end of
2012 2013 2014 2015
IRB Advancedapproach
KBC BankCBC BanqueCSOB Czech RepublicKBC Credit InvestmentsKBC Finance IrelandKBC Lease Belgium KBC Real Estate1
KBC BankCBC BanqueCSOB Czech RepublicKBC Credit InvestmentsKBC Finance IrelandKBC Lease BelgiumKBC Commercial Finance4
KBC Immolease4
KBC Bank5
CBC BanqueCSOB Czech RepublicKBC Credit InvestmentsKBC Commercial FinanceKBC Finance IrelandKBC Lease BelgiumKBC ImmoleaseK&H Bank
KBC BankCBC BanqueCSOB Czech RepublicKBC Credit InvestmentsKBC Commercial FinanceKBC Finance IrelandKBC Lease BelgiumKBC ImmoleaseK&H BankCSOB Slovak Republic
IRB Foundation approach
KBC Bank IrelandKBC Financial ProductsKBC Bank Deutschland3
Antwerp Diamond Bank3
K&H Bank
KBC Bank IrelandKBC Financial ProductsKBC Bank Deutschland3
Antwerp Diamond Bank3
K&H Bank
KBC Bank IrelandKBC Financial ProductsKBC Bank Deutschland3
Antwerp Diamond Bank3
CSOB Slovak Republic
KBC Bank IrelandKBC Financial Products
Standardised approach
CSOB Slovak RepublicAbsolut Bank2
Non-material entities
CSOB Slovak RepublicAbsolut Bank2
Non-material entities
Non-material entities Non-material entities
1 Although KBC Real Estate is not a material entity according to KBC’s definition above, it also uses the IRB approach as it operates on a shared IT platform. During 2012,
the activities of KBC Real Estate were integrated into KBC Bank and the company dissolved.
2 Absolut Bank was divested in the course of 2013 and is no longer included in the data for 2013.
3 Antwerp Diamond Bank and KBC Bank Deutschland will be divested in 2014.
4 KBC Immolease and KBC Commercial Finance are only included in the data for 2013.
5 KBC Consumer Finance will become part of KBC Bank.
Exposure to credit risk
The tables in this section provide an overview of the overall credit risk expressed in terms of
Exposure At Default (EAD) and are based on the figures for the end of December 2013. Exposure to
securities in the trading book and to structured credit products is excluded. Information on securities
in the trading book is reported in the credit risk section of KBC’s annual report and the related risks
are taken up in the trading market risk VaR. For structured credit exposure, reference is made to the
detailed information in the ‘Structured credit products’ section in this document.
Detailed information is given separately in the following sections: (i) a general aggregate overview of
the total credit risk in scope, (ii) a general (IRB Advanced, IRB Foundation and Standardised)
overview of the lending portfolio, (iii) overviews of concentration in the lending portfolio (including
a quality analysis), (iv) overviews of impaired credit in the lending portfolio, (v) breakdowns of the
counterparty credit risk, (vi) credit risk mitigation and exposure to repo-like transactions and (vii)
information on internal modelling.
In the lending portfolio, EAD is the amount that KBC expects to be outstanding if and when an
obligor were to default. For lending exposure treated under the IRB approach, EAD is composed of

Risk report 2013 • KBC Group • 40
the amount outstanding at the time of the calculation (without taking provisions into account), plus
a weighted part of the off-balance-sheet portion of the exposure. For non-retail exposures, this
weight can be determined either on a regulatory basis according to the IRB Foundation approach or
via internal models according to the IRB Advanced approach. For retail exposures, the weight is
always determined via internal models, in line with the IRB Advanced approach for this asset class.
For lending exposures treated under the Standardised approach, EAD can be regarded as the
amount outstanding at the time of the calculation minus the provisions set aside plus a weighted
part of the off-balance-sheet portion of the exposure. EAD can be stated with or without application
of eligible collateral, i.e. net or gross.
For the portfolio of derivatives, EAD (actually, pre-settlement counterparty credit risk) is calculated as
the sum of the (positive) current replacement value (marked-to-market) of a transaction and the
potential risk as captured by the applicable add-on (= current exposure method). Credit Default
Swaps (CDS) in the banking book (protection bought or sold) are an exception to this calculation,
since they are considered guarantees (obtained or given) and treated as such in this report.
For the portfolio of repo-like instruments, EAD is determined based on the lending leg in the
transaction, which means that for reverse-repos, including tri-party repos, this is based on the
nominal amount of the cash that was provided by KBC, and that for repos it is based on the market
value of the securities sold.
EAD is used as a basis to determine the Risk-Weighted Assets (RWA), which in turn are used to
calculate the capital required for the exposure. RWA can be regarded as an exposure weighted
according to its ‘riskiness’. This ‘riskiness’ depends on such factors as the loss given default (LGD
which in turn is driven by such factors as the amount of collateral or guarantees), the maturity of
the exposure and the probability of default (PD) of the obligor.
As regards the group-wide framework for dealing with model uncertainty – as referred to in the
section on ‘Internal modelling’ later on in this report – KBC has taken (and reported under pillar 1)
additional RWA for known deficiencies and avoidable uncertainties into account for its PD models
since mid-2010, for its LGD models since mid-2012 and for its EAD models since 2013. At year-end
2013, this additional RWA amounted to 0.6 billion euros for PD models, to 0.01 billion euros for
LGD models and to 0.6 billion euros for EAD models. Moreover, in 2013, KBC started to capitalise
unavoidable uncertainties in the models (EAD, PD and LGD models) with an additional RWA impact
of 1.4 billion euros at year-end 2013.

Risk report 2013 • KBC Group • 41
The table below provides an overview of how Basel II credit risk EADs and RWA for the KBC group
changed over 2013. This table shows the overall EAD and RWA figures, including non-material
entities, the structured credit portfolio and the additional RWA for model deficiencies and
uncertainties. Please note, that in all other tables in this report, the scope will be limited to the
material entities (see table above) and exclude the structured credit portfolio and additional RWA for
unavoidable uncertainties.
Entity BII approach (at 31-12-2013)1
Credit RWA (in millions of EUR) Exposure [EAD] (in millions of EUR)
31-12-2012
31-12-2013
Δ 2013 vs 2012
31-12-2012
31-12-2013
Δ 2013 vs 2012
KBC Bank IRB Advanced 28 726 26 118 -2 607 122 535 117 820 -4 715
CBC Banque IRB Advanced 1 642 1 855 213 10 954 10 426 -528
CSOB Czech Republic IRB Advanced 10 526 9 778 -749 41 980 41 933 -46
KBC Credit Investments IRB Advanced 1 260 1 242 -18 5 747 7 412 1 665
KBC Commercial Finance3 IRB Advanced 0 597 597 0 1 908 1 908
KBC Lease Belgium IRB Advanced 1 329 1 465 136 2 151 2 166 15
KBC Immolease3 IRB Advanced 0 284 284 0 714 714
KBC Finance Ireland IRB Advanced 936 610 -326 1 637 1 232 -405
KBC Bank Ireland IRB Foundation 7 402 6 754 -649 17 250 16 439 -811
K&H Bank IRB Foundation 4 131 3 596 -535 8 720 9 122 402
KBC Deutschland4 IRB Foundation 2 105 1 840 -265 3 463 2 781 -682
ADB4 IRB-Foundation 1 385 1 174 -212 1 893 1 731 -162
KBC Financial Products IRB-Foundation 1 105 3 042 1 936 1 473 907 -566
Absolut Bank Standardised 1 669 - -1 669 2 610 - -2 610
Cibank Standardised 516 572 56 811 867 56
CSOB Slovak Republic Standardised 3 353 3 284 -68 5 999 6 388 389
KBC Commercial Finance3 Standardised 1 149 - -1 149 1 271 - -1 271
Other entities5 Mixed 2 133 811 -1 322 2 910 1 705 -1 205
Total² 69 369 63 022 -6 348 231 404 223 551 -7 853
1 Basel II is the main approach pursued by a legal entity. Some entities report under IRB, but still have sub-portfolios or subsidiaries that are reported under the Standard-
ised approach.
2 The figures shown are for the overall scope of credit risk RWA, including structured credit products, counterparty risk and other non-credit obligation, assets but exclud-
ing bonds in trading books and KBC intra-group exposures.
3 In 2013, KBC Commercial Finance and KBC Immolease ceased to use the standardised approach and moved to the IRB Advanced approach.
4 To be divested in 2014.
5 The figures for 2012 include KBC Immolease.
Overall, there was a substantial decrease in EAD and to a greater extent in RWA. At KBC group level,
credit RWA fell by 6.3 billion euros, down 9%, year-on-year. This can be broken down as follows:
• Divestments account for part of the reduction in EAD and RWA, i.e. due to the deconsolidation in
2013 of Absolut Bank (-1.7 billion euros in RWA), and some smaller subsidiaries (-0.3 billion euros
in RWA).
• The further de-risking of the KBC portfolio continued in 2013 and had an estimated impact on
RWA of -3.8 billion euros. This figure includes a sharp reduction in capital requirements for the
legacy structured credit portfolio, due to the de-risking of CDO’s and the sale of positions. The
remaining fall in RWA is related to the decrease in lending in portfolios (for instance in KBC Bank’s
corporate branches abroad). This led to a decrease in the volume of products with a high risk
weighting and resulted in RWA decreasing even more than EAD.
Risk report 2013 • KBC Group • 42
• The renewed focus on retail and SME lending in core countries continued in 2013.
• The decision of the NBB to impose an additional risk weight of 5% on the exposure to Belgian
mortgages pushed up the level of RWA (+1.5 billion euros).
• There was an exceptional +2.7-billion-euro RWA item for retained CDO notes at KBC Financial
Products. These notes, which are held in the banking books, were transferred from market RWA
to credit RWA and have been reported in credit RWA as from 2013. This re-allocation has had no
effect on the calculation of total RWA. There was a sharp increase in RWA in respect of these
notes due to higher valuations resulting from narrowing credit spreads.
• Lower RWA (-1.2 billion euros in RWA) at KBC Commercial Finance, KBC Immolease and CSOB
Leasing following approval of their migration to the IRB Advanced approach in 2013.
• Substantial risk reduction on the loans to Cera and KBC Ancora, due to the sale of a KBC Ancora
loan and the repayment of loans granted to Cera and KBC Ancora. (total decrease in RWA of 1
billion euros)
• In previous years, the counterparties of distressed renegotiated loans in KBC Ireland (specifically
Homeloans and the corporate portfolio) had been assigned PD class 9 but were reclassified as PD
10 (unlikely-to-pay) in 2013, reflecting new insights in expected losses (in the broad sense) on
these counterparties. The shift from PD class 9 to PD class 10 is responsible for an overall decrease
in RWA (-0.6 billion euros RWA) as it is now mostly covered by additional impairment.
• Overall, the model reviews had only a limited effect on RWA. Their consolidated impact was to
increase RWA, primarily on account of the more conservative estimates for the models related to
the Belgian SME and Irish mortgage portfolios.
• Changes in RWA were attributable to currency effects on FX lending (-1.1 billion euros in RWA,
due in particular to the depreciation of the Czech koruna (-8%) and the US dollar (-4%)).
Total exposure to credit risk
In the table below, exposures are broken down according to types of credit exposure. These types
are equal for exposures subject to the Standardised or the IRB Foundation approach.
• On-balance-sheet assets (On-balance): this category contains assets, including equities in the
banking book, whose contract is booked on the balance sheet of the entities in scope excluding
securities in the trading book, repo-like instruments and – in the case of this publication –
securitisation-related assets. On-balance-sheet assets are dealt with in the ‘lending portfolio’
sections.
• Off-balance-sheet assets (Off-balance): this category contains assets whose contract is not booked
on the balance sheet of the entities in scope. The category excludes most derivative instruments,
repo-like instruments and – in the case of this publication – securitisation-related assets. Derivative
instruments related to selling credit protection, i.e. CDS that have been sold are included as
off-balance-sheet assets when they do not relate to trading activity. Off-balance-sheet assets are
dealt with in the ‘lending portfolio’ sections.

Risk report 2013 • KBC Group • 43
• Derivatives: this category contains all credit exposure arising from derivative transactions, such as
Interest Rate Swaps (IRS), Forex deals, etc. (excluding CDS in the banking book, which are treated
as an Off-balance-sheet instrument). Derivatives are dealt with in the section on ‘Counterparty
credit risk’ and not in the ‘Lending portfolio’ sections.
• Repo-like transactions (Repo-like): this category contains all credit exposure arising from repo-,
reverse repo and tri-party repo transactions in scope. More details on these transactions can be
found in the section on ‘Credit risk mitigation’.
EAD is the Exposure At Default after application of the credit conversion factor (and substitution due
to guarantees for IRB foundation entities). For IRB exposures, the EAD is before the application of
eligible collateral (as this is included in the LGD), for Standardised exposures the EAD is after the
application of eligible collateral.
Exposure 31-12-20122
(in billions of EUR)
Lending (on-balance-
sheet)
Lending (off-balance-
sheet)
Derivatives Repo-likeTransactions
Total
Total EAD 188 18 9 11 225
Total RWA 52 5 4 0 62
Exposure 31-12-20131 (in billions of EUR)
Lending (on-balance-
sheet)
Lending (off-balance-
sheet)
Derivatives Repo-likeTransactions
Total
Total EAD 182 16 7 15 220
Total RWA 45 5 2 0 53
1 KBC Commercial Finance and KBC Immolease only included in the figures for 2013.
2 Absolut Bank only included in the figures for 2012.
Credit risk in the lending portfolio
The lending portfolio excludes all derivatives (except for CDS in the banking book) and any repo-like
exposure as these are dealt with in the ‘Counterparty credit risk’ and ‘Credit risk mitigation’
sections. As mentioned above, exposure to securities in the trading book is also excluded. In light of
the capital calculations, the corresponding issuer risk is included in trading market risk.
Lending portfolio [EAD] 31-12-20123
(in millions of EUR)EAD of main categories ‘Other’1 Total EAD
Subject to IRB approach 160 092 3 749 163 842
Subject to Standardised approach 40 684 920 41 603
Total 200 776 4 669 205 445
Lending portfolio [EAD] 31-12-2013(in millions of EUR)
EAD of main categories ‘Other’1 Total EAD
Subject to IRB approach2 155 002 3 500 158 502
Subject to Standardised approach 39 121 601 39 722
Total 194 124 4 101 198 225
1 Exposure to ‘Other’ is given separately and is not included in the disclosures on concentrations and impaired exposure, since the data required to create the breakdowns
is often missing. This category contains mostly ‘other assets’ (e.g., property and equipment, non-assignable accruals, cash balances at central banks).
2 KBC Commercial Finance and KBC Immolease only included in the figures for 2013.
3 Absolut Bank only included in the figures for 2012.

Risk report 2013 • KBC Group • 44
Overall information on the lending portfolio is divided into two tables below. One for a total
overview of the exposure subject to the IRB approach and one for the overview of the exposure
treated via the Standardised approach. This is because each approach has its own (regulatory)
breakdown by type of exposure/asset class.
In the tables relating to concentrations, both are aggregated to provide a total overview of
concentrations in the lending portfolio. This is done at the expense of best-efforts mapping into the
mainstream asset classes. As regards the quality analysis, however, both the IRB and Standardised
approaches are presented separately again, since the manner for indicating quality is not equal.
Credit exposure subject to the IRB approach
The table below shows the total exposure calculated via the IRB approach broken down per asset
class. The asset classes are those defined for the purpose of regulatory reporting according to the
IRB approach, viz.:
• Sovereign: this category includes claims on public sector entities, regional governments and local
authorities as long as they are categorised as ‘Sovereign’ by the local regulator. Multilateral
development banks attracting a 0% risk weighting are included.
• Institutions: this category relates mainly to bank exposure. Claims on public sector entities,
regional governments and local authorities that do not qualify as ‘Sovereign’ are also included in
this category.
• Corporates: besides ordinary corporate exposure, this category also includes specialised lending
exposure (such as project finance and commercial real estate) and non-bank financials.
• SME (treated as) Corporates: these are exposures fulfilling the necessary conditions (total annual
sales of under 50 million euros) for determining the minimum capital requirements according to
the capital weighting formula for corporate SMEs.
• Retail: this includes all types of retail exposure, excluding residential mortgages, such as personal
loans and commercial credit to retail SMEs, for which the total exposure of the counterparty (or
related group of the counterparty) does not exceed a threshold of one million euros. It should be
noted that the IRB Foundation approach for retail exposure does not exist and that IRB Advanced
is the only approach for this asset class.
• Residential mortgages: this category includes home loans to individuals, secured or partly secured
by residential mortgages.
• Other: besides ‘other assets’, this category includes the residual value of leasing transactions.

Risk report 2013 • KBC Group • 45
IRB exposure [EAD] 31-12-2012(in millions of EUR)
Sover-eign
Institu-tions
Corpo-rates
SME Corpo-
rates
Retail Residen-tial
Mort-gages
(sub)Total2
Other Total
Exposure 16 881 7 766 44 098 18 719 18 893 53 734 160 092 3 749 163 842
RWA 1 726 1 592 23 669 8 091 3 602 8 417 47 097 3 741 50 838
IRB exposure [EAD] 31-12-20131 (in millions of EUR)
Sover-eign
Institu-tions
Corpo-rates
SME Corpo-
rates
Retail Resi-dential
Mort-gages
(sub)Total2
Other Total
Exposure 14 088 7 771 40 774 19 716 19 151 53 502 155 002 3 500 158 502
RWA 1 928 1 214 18 398 7 475 4 008 9 591 42 613 3 250 45 862
1 KBC Commercial Finance and KBC ImmoLease are only included in the 2013 data.
2 The (sub)Total is accounted for in the section on concentrations in the lending portfolio.
There was an increase in the ‘SME Corporates’ and ‘Retail’ exposure and a decrease in the other
asset classes with an exception of the asset class ‘Institutions’ which remained virtually unchanged.
There was a material reduction in ‘Corporates’ exposure. This is related to (i) the decrease in the
non-core-portfolio, such as KBC Bank’s branches abroad, the project finance portfolio of KBC
Finance Ireland, etc., (ii) to the repayment of the loans granted to Cera and KBC Ancora (-829
million euros) and (iii) to a downwards impact on the exposure and RWA, owing to the effect of FX
rates on lending in currencies other than the euro, in particular the depreciation of the Czech
koruna and US dollar.
The reduction in ‘Sovereign’ exposure is explained by a change in the bonds portfolio of CSOB
Czech Republic with fewer bonds being treated under the IRB approach and more under the
Standardised approach (‘permanent partial use’ principle).
Credit exposure subject to the Standardised approach
The table below shows the exposure calculated via the Standardised approach broken down per
exposure type. The exposure types are those defined for the purpose of regulatory reporting
according to the Standardised approach, viz.:
• Sovereign: claims on central authorities and governments.
• RGLA: claims on Regional Governments and Local Authorities independently if these qualify as
‘Sovereign’ under the IRB approach.
• PSE: claims on Public Sector Entities.
• MDB: claims on Multilateral Development Banks independently if these qualify as ‘Sovereign’
under the IRB approach.
• International organisations: claims on a specific list of organisations (e.g., International Monetary
Fund, European Central Bank).
• Institutions: claims on banks.
• Corporates: claims on all corporate exposure, including small and medium-sized enterprises that
are treated as corporate clients.
• Retail: claims on retail clients (including SMEs not qualifying for treatment as corporate clients).
Most of these claims are related to mortgages and categorised under ‘secured by real estate’.

Risk report 2013 • KBC Group • 46
• Secured by real estate: claims that are (fully) covered by real estate collateral via mortgages and
including real estate leasing. These are extracted from the above categories (mostly retail or
corporate).
• Past due: all exposure which is past due, meaning that it is more than 90 days in arrears. All past
due exposure is extracted from all the other categories.
• CIU: claims on Collective Investment Undertakings.
• High risk: exposure that is not collateralised and/or not rated, attracting a risk-weighting equal to
or higher than 150% and therefore considered ‘high risk’. Past due and equity exposure are
excluded.
• Covered bonds: exposure for which the credit risk is mitigated by risk positions on very highly
rated governments, authorities or institutions. Past due, equity and high-risk claims are excluded.
• Short term: exposure (to institutions or to corporates) which is rated and has a maturity of less
than three months. Past due, equity and high-risk claims are excluded. This exposure has been
assigned to its respective exposure type, namely ‘Institutions’ or ‘Corporates’.
• Other: all other claims (e.g., other assets).
Exposures are reported net, i.e. after the application of guarantees and eligible collateral.

Risk report 2013 • KBC Group • 47
Standardised exposure [EAD] 31-12-20122
(in millions of EUR)Exposure RWA
Sovereign 31 817 133
RGLA 146 40
PSE 0 0
MDB 9 1
International organisations 0 0
Institutions 566 272
Corporates 3 448 3 449
Retail 2 149 1 607
Secured by real estate 2 315 870
Past due 233 265
CIU 0 0
(sub)Total1 40 684 6 638
High risk 0 0
Covered bonds 0 0
Short term 31 15
Other 889 437
Total 41 603 7 090
Standardised exposure [EAD] 31-12-2013(in millions of EUR)
Exposure RWA
Sovereign 33 079 6
RGLA 135 32
PSE 29 0
MDB 10 1
International organisations 0 0
Institutions 210 109
Corporates 2 276 2 270
Retail 1 528 1 131
Secured by real estate 1 637 628
Past due 218 243
CIU 0 0
(sub)Total1 39 121 4 421
High risk 0 0
Covered bonds 0 0
Short term 0 0
Other 601 260
Total 39 722 4 681
1 Accounted for in the section on concentrations in the lending portfolio.
2 Absolut Bank only included in the figures for 2012.
The increase in exposure in the ‘Sovereign’ category related to a shift in the bond exposure of CSOB
Czech Republic due to application of ‘permanent partial use’.
The divestment of Absolut Bank triggered a decrease in various categories. In the first quarter of
2013, Absolut Bank accounted for 324 million euros in EAD for the ‘Institutions’ exposure class, 767
million euros for ‘Corporates’ class, 234 million euros for the ‘Retail’ class and 892 million euros for
the ‘Secured by real estate’ class. ‘Sovereign RWA’ decreased significantly on account of this
divestment (-133 million euros).

Risk report 2013 • KBC Group • 48
Concentrations to credit risk in the lending portfolio
In order to portray an overall picture of the lending portfolio, the exposure (EAD) calculated
according to the Standardised approach and the IRB approach is aggregated based on the most
material asset classes from the IRB approach. KBC believes this leads to a more transparent and
uniform presentation of the concentrations to credit risk in the lending portfolio.
The exposure types under the Standardised approach are therefore mapped to the most applicable
types/asset classes under IRB Foundation, viz.:
• Secured by real estate: this type of exposure is mapped according to the asset class of the
underlying client from which the exposure originated, mostly ‘Residential mortgages’, ‘Retail’,
‘Corporate’ or ‘SME Corporates’.
• Corporates: this type of exposure is mapped to ‘Corporates’ or ‘SME Corporates’ depending on
the internally used segmentation.
• Past due: this type of exposure is mapped according to the asset class of the underlying client
from which the exposure originated.
• RGLA, PSE, International organisations and MDB: these exposure types are mapped mostly to the
‘Institutions’ asset class, or when distinguishable as eligible sovereign exposure to the ‘Sovereigns’
asset class.
• CIU: this exposure is mapped to the ‘Institutions’ asset class.
The Standardised exposure types of ‘High risk’, ‘Covered bonds’ and ‘Short term’ are all mapped to
the ‘Other’ asset class, due to their immateriality. The other mapping exercises are rather
straightforward.
For reasons of relevancy/materiality/data availability, the ‘Other’ category is not included in the
following tables.
Unless otherwise stated, all exposure is attributed to the asset class after PD substitution. This
implies that if PD substitution is applied to a certain exposure to a borrower guaranteed by another
party, the exposure will shift to the region, sector and exposure class of the guaranteeing party in
the breakdowns below. For example, when a corporate entity is guaranteed by a bank and PD
substitution is applied, this exposure will be incorporated under ‘Institutions’ in the breakdowns
provided. This logic only applies to exposures treated under the Standardised or IRB Foundation
approach (under the IRB Advanced approach, the effect of the guarantee is included in the LGD
measurement).

Risk report 2013 • KBC Group • 49
Total credit exposure in the lending portfolio per geographic region
Exposure [EAD] 31-12-20122
(in millions of EUR)
Sovereign Institu-tions
Corporates SME Corporates
Retail Residential Mortgages
Total
Africa 199 361 105 122 2 0 788
Asia 163 1 416 1 262 121 0 0 2 962
Central and Eastern Europe & Russia
13 219 2 693 10 153 5 440 4 078 14 157 49 740
Of which Bulgaria 149 8 234 141 127 105 765
Czech Republic 7 834 1 004 5 660 3 193 2 685 9 627 30 002
Hungary 3 411 38 1 531 1 042 309 1 980 8 312
Poland 114 694 389 140 2 1 1 342
Russia 290 513 1 205 54 169 822 3 054
Slovak Republic 1 302 116 1 044 865 777 1 609 5 718
Latin America 0 61 84 0 1 0 146
Middle East 0 707 628 9 0 0 1 345
North America 1 020 413 2 417 25 2 0 3 876
Oceania 0 21 617 2 0 1 640
Western Europe 33 734 2 826 31 856 14 053 16 680 42 128 141 278
Of which Belgium 24 290 761 19 033 12 347 16 609 29 676 102 716
Ireland 403 19 2 347 1 042 0 12 446 16 256
Total 48 335 8 498 47 122 19 773 20 762 56 287 200 776
Exposure [EAD] 31-12-20131 (in millions of EUR)
Sovereign Institu-tions
Corporates SME Corporates
Retail Residential Mortgages
Total
Africa 200 368 252 0 3 3 826
Asia 161 2 499 1 199 112 4 36 4 010
Central and Eastern Europe & Russia
13 009 2 004 8 511 5 512 3 443 13 002 45 481
Of which Bulgaria 148 11 267 136 134 125 821
Czech Republic 6 560 872 5 263 3 392 2 153 8 796 27 036
Hungary 4 025 47 1 438 1 064 224 1 876 8 674
Poland 195 250 315 8 10 14 791
Russia 0 479 20 3 1 94 596
Slovak Republic 2 072 163 901 907 915 1 993 6 952
Latin America 0 38 31 9 6 2 86
Middle East 1 928 443 18 3 10 1 404
North America 948 289 1 785 83 21 18 3 144
Oceania 0 29 443 0 0 2 474
Western Europe 32 876 1 953 29 677 15 091 16 795 42 306 138 698
Of which Belgium 21 909 347 17 966 13 154 16 604 30 071 100 051
Ireland 464 17 2 077 1 017 1 12 128 15 704
Total 47 195 8 109 42 342 20 825 20 274 55 379 194 124
1 KBC Commercial Finance and KBC Immolease only included in the the figures for 2013.
2 Absolut Bank only included in the figures for 2012.
The geographic regions in the above table are those where each borrower (or guarantor) is situated.
The table shows that the KBC home markets comprise mainly Belgium (52%), Ireland (8%) and the
remaining four CEE countries (Bulgaria, Czech Republic, Hungary, Slovak Republic) (22%), which
combined represented 82% of exposures in 2013. They even represented more than 99% of EAD

Risk report 2013 • KBC Group • 50
for the ‘Residential Mortgage’ exposure class, more than 98% for ‘Retail’ and more than 94% for
‘SME Corporates’. For corporates and institutions, exposures outside the home markets were
predominantly in Western Europe (mainly Germany, France, the Netherlands, Spain and France), in
North America and in Asia (mainly China, Hong Kong and Singapore).
The decrease in exposure to ‘Residential Mortgages’ is explained by firstly the lower volumes at KBC
Ireland and in the Czech Republic (depreciation of the Czech koruna against the euro) and secondly,
by the divestment of Absolut Bank in 2013.

Risk report 2013 • KBC Group • 51
Total credit exposure in the lending portfolio per sector
Exposure [EAD] 31-12-20123
(in millions of EUR)Sovereign Institu-
tionsCorpo-
ratesSME
Corpo-rates
Retail Residen-tial
Mortgag-es
Total
Agriculture, Farming & Fishing 0 0 399 1 129 2 252 0 3 781
Authorities 48 313 133 421 9 0 0 48 877
Automotive 0 0 1 478 1 048 505 0 3 031
Building & Construction 0 0 3 784 1 422 1 426 0 6 631
Chemicals 0 0 1 398 412 55 0 1 865
Commercial Real Estate 0 0 8 453 2 904 1 146 0 12 504
Distribution 0 0 5 512 3 684 2 517 0 11 713
Electricity 0 0 2 984 410 18 0 3 412
Finance & Insurance 22 8 365 3 650 290 374 0 12 701
Food Producers 0 0 1 423 436 195 0 2 054
Metals 0 0 1 451 569 223 0 2 243
Oil, Gas & Other Fuels 0 0 1 290 61 5 0 1 356
Private Persons 0 0 2 79 6 100 56 287 62 467
Services 0 0 6 281 4 288 3 868 0 14 438
Other1 0 0 8 595 3 031 2 077 0 13 703
Total 48 335 8 498 47 122 19 773 20 762 56 287 200 776
Exposure [EAD] 31-12-20132 (in millions of EUR)
Sovereign Institu-tions
Corpo-rates
SME Corpo-
rates
Retail Residen-tial
Mortgag-es
Total
Agriculture, Farming & Fishing 0 0 385 1 238 2 241 0 3 864
Authorities 47 158 127 351 3 1 0 47 641
Automotive 0 0 1 637 1 313 507 0 3 458
Building & Construction 0 0 3 394 1 383 1 485 0 6 262
Chemicals 0 0 1 324 464 59 0 1 847
Commercial Real Estate 0 0 7 568 3 094 1 121 0 11 783
Distribution 0 0 5 191 3 962 2 570 0 11 723
Electricity 0 0 2 638 208 18 0 2 863
Finance & Insurance 37 7 982 2 102 240 259 0 10 619
Food Producers 0 0 1 386 444 197 0 2 026
Metals 0 0 1 304 597 238 0 2 139
Oil, Gas & Other Fuels 0 0 1 288 15 4 0 1 307
Private Persons 0 0 1 69 5 917 55 379 61 366
Services 0 0 6 273 4 426 4 004 0 14 703
Other1 0 0 7 499 3 369 1 653 0 12 521
Total 47 195 8 109 42 342 20 825 20 274 55 379 194 124
1 All sectors with a concentration of less than 0.75% of the total EAD are aggregated into this category.
2 KBC Commercial Finance and KBC Immolease only included in the figures for 2013.
3 Absolut Bank only included in the figures for 2012.
In view of KBC’s substantial retail activities in most markets, ‘Private Persons’ represent a large share
of this sector distribution. The exposure to ‘Private Persons’ decreased slightly due to lower volumes
and an FX effect. The decrease in ‘Finance & Insurance’ was caused by the repayment of the loans
granted to Cera and KBC Ancora.
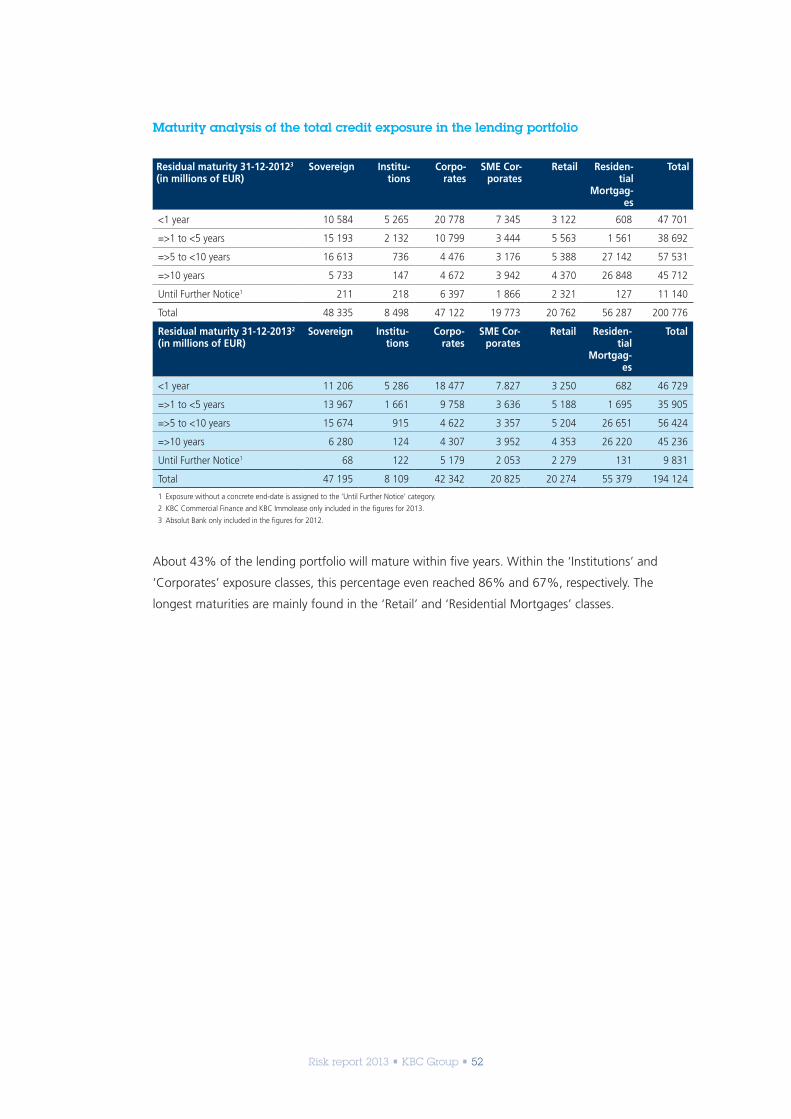
Risk report 2013 • KBC Group • 52
Maturity analysis of the total credit exposure in the lending portfolio
Residual maturity 31-12-20123
(in millions of EUR)Sovereign Institu-
tionsCorpo-
ratesSME Cor-
poratesRetail Residen-
tial Mortgag-
es
Total
<1 year 10 584 5 265 20 778 7 345 3 122 608 47 701
=>1 to <5 years 15 193 2 132 10 799 3 444 5 563 1 561 38 692
=>5 to <10 years 16 613 736 4 476 3 176 5 388 27 142 57 531
=>10 years 5 733 147 4 672 3 942 4 370 26 848 45 712
Until Further Notice1 211 218 6 397 1 866 2 321 127 11 140
Total 48 335 8 498 47 122 19 773 20 762 56 287 200 776
Residual maturity 31-12-20132
(in millions of EUR)Sovereign Institu-
tionsCorpo-
ratesSME Cor-
poratesRetail Residen-
tial Mortgag-
es
Total
<1 year 11 206 5 286 18 477 7.827 3 250 682 46 729
=>1 to <5 years 13 967 1 661 9 758 3 636 5 188 1 695 35 905
=>5 to <10 years 15 674 915 4 622 3 357 5 204 26 651 56 424
=>10 years 6 280 124 4 307 3 952 4 353 26 220 45 236
Until Further Notice1 68 122 5 179 2 053 2 279 131 9 831
Total 47 195 8 109 42 342 20 825 20 274 55 379 194 124
1 Exposure without a concrete end-date is assigned to the ‘Until Further Notice’ category.
2 KBC Commercial Finance and KBC Immolease only included in the figures for 2013.
3 Absolut Bank only included in the figures for 2012.
About 43% of the lending portfolio will mature within five years. Within the ‘Institutions’ and
‘Corporates’ exposure classes, this percentage even reached 86% and 67%, respectively. The
longest maturities are mainly found in the ‘Retail’ and ‘Residential Mortgages’ classes.

Risk report 2013 • KBC Group • 53
Total credit exposure in the lending portfolio per product type
Exposure [EAD] 31-12-20123
(in millions of EUR)Sovereign Institu-
tionsCorpo-
ratesSME Cor-
poratesRetail Residen-
tial Mortgag-
es
Total
Guarantee 669 499 4 939 1 210 498 0 7 816
Debt instrument 37 390 1 797 954 3 0 0 40 145
Equity 0 7 121 17 0 0 146
Leasing 33 1 1 460 794 1 714 0 4 002
Home loans 0 0 0 0 1 1711 56 287 57 457
Other lending 10 242 6 193 39 648 17 749 17 379 0 91 210
Total 48 335 8 498 47 122 19 773 20 762 56 287 200 776
Exposure [EAD] 31-12-20132
(in millions of EUR)Sovereign Institu-
tionsCorpo-
ratesSME Cor-
poratesRetail Residen-
tial Mortgag-
es
Total
Guarantee 837 405 4 453 1 366 610 0 7 670
Debt instrument 36 716 1 696 1 281 3 0 0 39 696
Equity 0 20 119 18 0 0 157
Leasing 31 0 1 062 919 1 236 0 3 248
Home loans 0 0 0 0 1 097 55 379 56 477
Other lending 9 611 5 988 35 428 18 520 17 330 0 86 877
Total 47 195 8 109 42 342 20 825 20 274 55 379 194 124
1 Home loans to individuals which are not (partly) secured by residential mortgages.
2 KBC Commercial Finance and KBC Immolease only included in the figures for 2013.
3 Absolut Bank only included in the figures for 2012.
Quality analysis of the total credit exposure in the lending portfolio – IRB
The graph and table below show credit risk exposure per Probability of Default (PD) class in terms of
average risk weight or EAD at year-end. Only the lending exposure subject to the IRB approach is
captured in this table. A similar overview of the exposure subject to the Standardised approach
appears in a subsequent table. The exposure (EAD) is presented together with the relevant RWA per
PD rating.
Unlike the previous tables, the table below shows exposure before the application of guarantees.
This means that there is no shift in asset class due to PD substitution (for the IRB foundation
entities). The RWA for the exposure, however, is presented after all collateral and guarantees have
been applied. This allows an indication to be given of the mean RWA for a certain original exposure.
The latter is also reflected in the ‘weighted average’ percentage.
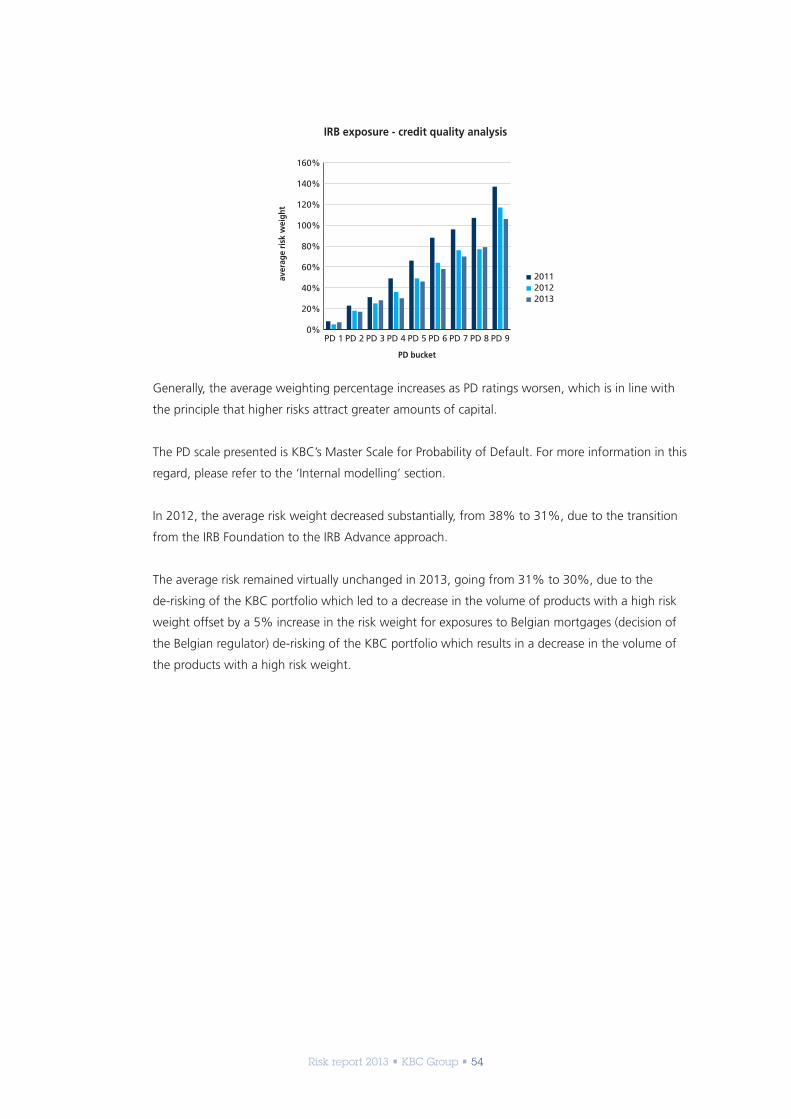
Risk report 2013 • KBC Group • 54
Generally, the average weighting percentage increases as PD ratings worsen, which is in line with
the principle that higher risks attract greater amounts of capital.
The PD scale presented is KBC’s Master Scale for Probability of Default. For more information in this
regard, please refer to the ‘Internal modelling’ section.
In 2012, the average risk weight decreased substantially, from 38% to 31%, due to the transition
from the IRB Foundation to the IRB Advance approach.
The average risk remained virtually unchanged in 2013, going from 31% to 30%, due to the
de-risking of the KBC portfolio which led to a decrease in the volume of products with a high risk
weight offset by a 5% increase in the risk weight for exposures to Belgian mortgages (decision of
the Belgian regulator) de-risking of the KBC portfolio which results in a decrease in the volume of
the products with a high risk weight.
IRB exposure - credit quality analysis
PD bucket
aver
age
risk
wei
ght
0%
20%
40%
60%
80%
100%
120%
140%
160%
PD 9PD 8PD 7PD 6PD 5PD 4PD 3PD 2PD 1
201120122013

Risk report 2013 • KBC Group • 55
In millions of EUR – 31-12-20122
PD Master scale
Exposure [EAD] RWA Average in %
Sover-eign
Institu-tions
Corpo-rates
SME Cor-porates
Retail Residen-tial
Mortgag-es
Total
1 [0.00% - 0.10%]
Sum of EAD 15 145 4 109 5 490 576 3 232 21 786 50 339
Sum of RWA 804 349 782 68 127 291 2 421
weighted average
5% 8% 14% 12% 4% 1% 5%
2 [0.10% - 0.20%]
Sum of EAD 641 1 380 4 937 1 663 2 730 4 509 15 859
Sum of RWA 330 240 1 449 391 189 208 2 807
weighted average
52% 17% 29% 24% 7% 5% 18%
3 [0.20% - 0.40%]
Sum of EAD 150 549 6 965 3 301 3 244 4 552 18 761
Sum of RWA 88 102 2 604 1 107 392 387 4 680
weighted average
59% 19% 37% 34% 12% 9% 25%
4 [0.40% - 0.80%]
Sum of EAD 285 530 8 181 3 005 2 760 8 338 23 098
Sum of RWA 227 110 4 985 1 215 512 1 152 8 202
weighted average
80% 21% 61% 40% 19% 14% 36%
5 [0.80% - 1.60%]
Sum of EAD 222 849 6 590 3 267 2 334 4 597 17 860
Sum of RWA 114 407 4 799 1 605 711 1 089 8 725
weighted average
51% 48% 73% 49% 30% 24% 49%
6 [1.60% - 3.20%]
Sum of EAD 347 52 3 320 2 278 1 712 909 8 617
Sum of RWA 64 17 3 102 1 336 621 355 5 496
weighted average
18% 32% 93% 59% 36% 39% 64%
71 [3.20% - 6.40%]
Sum of EAD 13 144 2 215 1 491 851 999 5 713
Sum of RWA 7 87 2 415 979 318 533 4 338
weighted average
54% 61% 109% 66% 37% 53% 76%
8 [6.40% - 12.80%]
Sum of EAD 7 86 839 586 621 1 029 3 167
Sum of RWA 7 41 1 046 459 235 658 2 446
weighted average
101% 47% 125% 78% 38% 64% 77%
9 [12.80% - 100.00%]
Sum of EAD 44 20 1 117 629 627 3 510 5 946
Sum of RWA 84 11 2 076 717 308 3 743 6 940
weighted average
0% 57% 186% 114% 49% 107% 117%
Total exposure 16 853 7 718 39 655 16 794 18 110 50 229 149 361
Total risk-weight-ed assets
1 726 1 364 23 258 7 877 3 413 8 417 46 055
Total weighted average
10% 18% 59% 47% 19% 17% 31%
1 Unrated exposure has been assigned a PD of 4.53% and been allocated to PD bucket 7.
2 Absolut Bank only included in the figures for 2012.

Risk report 2013 • KBC Group • 56
In millions of EUR – 31-12-20132
PD Master scale
Exposure [EAD] RWA Average in %
Sover-eign
Institu-tions
Corpo-rates
SME Corpo-
rates
Retail Residen-tial
Mortgag-es
Total
1 [0.00% - 0.10%]
Sum of EAD 12 039 3 941 5 263 560 3 124 22 534 47 460
Sum of RWA 886 293 740 58 109 1 429 3 515
weighted average
7% 7% 14% 10% 3% 6% 7%
2 [0.10% - 0.20%]
Sum of EAD 1 168 1 289 4 250 1 528 2 943 4 498 15 677
Sum of RWA 463 311 1 062 289 191 405 2 720
weighted average
40% 24% 25% 19% 6% 9% 17%
3 [0.20% - 0.40%]
Sum of EAD 164 676 7 957 3 304 2 653 655 15 409
Sum of RWA 76 64 3 011 821 325 60 4 358
weighted average
46% 10% 38% 25% 12% 9% 28%
4 [0.40% - 0.80%]
Sum of EAD 58 824 7 496 3 440 2 905 7 220 21 943
Sum of RWA 52 98 3 538 1 284 582 1 089 6 643
weighted average
90% 12% 47% 37% 20% 15% 30%
5 [0.80% - 1.60%]
Sum of EAD 271 663 5 179 3 505 2 454 6 315 18 387
Sum of RWA 253 259 3 796 1 603 788 1 825 8 524
weighted average
93% 39% 73% 46% 32% 29% 46%
6 [1.60% - 3.20%]
Sum of EAD 321 89 3 015 2 418 1 928 1 860 9 631
Sum of RWA 146 27 2 497 1 358 740 848 5 618
weighted average
46% 31% 83% 56% 38% 46% 58%
71 [3.20% - 6.40%]
Sum of EAD 32 106 1 953 1 541 1 101 1 531 6 263
Sum of RWA 32 78 1 869 985 480 943 4 387
weighted average
100% 74% 96% 64% 44% 62% 70%
8 [6.40% - 12.80%]
Sum of EAD 2 145 670 488 517 367 2 187
Sum of RWA 0 28 767 389 217 327 1 729
weighted average
25% 19% 114% 80% 42% 89% 79%
9 [12.80% - 100.00%]
Sum of EAD 30 4 651 567 724 2 206 4 182
Sum of RWA 19 3 860 544 408 2 597 4 430
weighted average
0% 74% 132% 96% 56% 118% 106%
Total exposure 14 084 7 737 36 435 17 350 18 348 47 186 141 140
Total risk-weighted assets
1 928 1 161 18 140 7 332 3 839 9 524 41 923
Total weighted average
14% 15% 50% 42% 21% 20% 30%
1 Unrated exposure has been assigned a PD of 4.53% and been allocated to PD bucket 7.
2 KBC Commercial Finance and KBC Immolease only included in the figures for 2013.

Risk report 2013 • KBC Group • 57
With reference to EAD and LGD, key data are shown in the table below (i.e., EAD, the outstanding
amount, the undrawn amount, the EAD-weighted mean Credit Conversion Factor (CCF %)
applicable to the undrawn amount and the EAD-weighted mean LGD percentages). Only exposures
where KBC uses own CCF and LGD estimates are shown (IRB Advanced approach). As of 2013, the
exposure of KBC Immolease and KBC Commercial Finance has been included as it is also treated
under the IRB Advanced approach. Furthermore, the calculation strategy of the table has changed,
applicable for 2012 and 2013.

Risk report 2013 • KBC Group • 58
Further detailed quality information on IRB Advanced exposure, 31-12-2012*
(in millions of EUR)
Asset class PD 1 2 3 4 5 6 7 8 9 Total
Sovereign
EAD 14 402 279 32 50 72 246 6 16 15 104
Out-standing amount
13 713 277 31 50 71 221 5 1 14 370
Undrawn amount
1 234 5 7 1 12 98 1 15 1 373
Average CCF %
55.9% 22.9% 5.1% 11.7% 9.2% 26.0% 15.8% 95.7% 53.4%
LGD % 19.3% 21.1% 39.7% 19.9% 18.1% 3.7% 23.0% 15.9% 19.1%
Institutions
EAD 3 766 1 339 541 524 796 52 139 83 20 7 260
Out-standing amount
2 989 1 250 401 205 583 26 64 66 13 5 597
Undrawn amount
842 102 144 345 339 26 75 18 6 1 898
Average CCF %
87.5% 81.2% 96.7% 92.1% 62.8% 98.6% 97.6% 85.6% 98.8% 84.7%
LGD % 31.2% 43.8% 20.0% 17.2% 22.4% 13.8% 20.4% 11.6% 11.1% 30.1%
Corporates
EAD 5 284 4 533 6 097 7 116 5 583 2 392 1 624 650 799 34 079
Out-standing amount
4 067 2 709 4 027 5 411 4 401 1 883 1 300 560 680 25 038
Undrawn amount
3 863 4 698 4 476 3 299 2 433 1 088 589 127 181 20 753
Average CCF %
31.2% 37.5% 44.1% 48.3% 46.9% 45.3% 54.3% 69.7% 65.5% 41.9%
LGD % 33.8% 33.1% 27.8% 35.1% 30.5% 30.7% 31.1% 25.1% 32.6% 31.8%
SME
EAD 571 1 655 3 241 2 783 2 864 1 814 1 155 486 441 15 010
Out-standing amount
521 1 482 2 804 2 329 2 384 1 608 997 429 405 12 960
Undrawn amount
239 622 1 021 1 099 1 015 542 384 116 81 5 118
Average CCF %
20.8% 27.4% 41.6% 39.4% 44.5% 37.1% 40.7% 48.0% 42.4% 38.7%
LGD % 23.1% 27.5% 27.6% 26.1% 24.6% 22.8% 19.7% 19.4% 19.4% 24.9%
Retail
EAD 3 232 2 730 3 244 2 760 2 334 1 712 851 621 627 18 110
Out-standing amount
2 687 2 512 3 004 2 558 2 000 1 567 784 583 602 16 297
Undrawn amount
811 720 750 578 610 328 164 89 54 4 104
Average CCF %
65.9% 27.9% 30.6% 34.6% 53.6% 43.9% 40.6% 41.9% 45.1% 43.3%
LGD % 24.7% 21.1% 22.3% 22.4% 27.1% 26.3% 24.2% 22.2% 21.3% 23.6%
Residentialmortgages
EAD 21 786 4 509 4 552 8 338 4 597 909 999 1 029 3 510 50 229
Out-standing amount
21 786 4 509 4 552 8 227 4 387 897 982 1 028 3 503 49 871
Undrawn amount
0 0 0 111 210 11 17 1 6 358
Average CCF - %
100.0% 100.0% 100.0% 100.0% 100.0% 100.0% 100.0% 100.0%
Average LGD - %
11.8% 12.9% 14.2% 16.3% 17.3% 17.5% 16.2% 14.4% 18.1% 14.1%
* Absolut Bank only included in the figures for 2012.

Risk report 2013 • KBC Group • 59
Further detailed quality information on IRB Advanced exposure, 31-12-2013*
(in millions of EUR)
Asset class PD 1 2 3 4 5 6 7 8 9 Total
Sovereign
EAD 11 495 744 81 22 221 259 21 18 12 861
Out-standing amount
10 849 742 80 22 221 255 21 5 12 194
Undrawn amount
904 58 6 8 3 78 2 13 1 071
Average CCF %
71.3% 3.4% 23.3% 4.7% 14.5% 5.4% 6.0% 100.0% 62.2%
LGD % 20.9% 22.2% 21.1% 27.9% 42.0% 16.8% 40.3% 18.4% 21.3%
Institutions
EAD 3 748 1 284 674 798 646 88 102 145 1 7 485
Out-standing amount
3 029 1 199 590 576 431 59 52 108 1 6 046
Undrawn amount
797 91 85 232 359 31 53 37 0 1 686
Average CCF %
88.3% 92.8% 96.3% 95.1% 59.7% 93.6% 92.8% 98.0% 99.7% 83.4%
LGD % 21.3% 26.2% 9.0% 8.5% 18.2% 12.7% 18.0% 4.4% 38.9% 18.6%
Corporates
EAD 5 116 4 070 7 381 6 818 4 600 2 407 1 543 467 541 32 944
Out-standing amount
4 054 2 568 5 149 5 098 3 686 1 790 1 296 391 465 24 498
Undrawn amount
3 312 3 995 4 967 3 445 1 957 1 137 511 132 105 19 561
Average CCF %
31.7% 35.5% 42.1% 45.2% 45.0% 53.0% 47.9% 56.3% 69.1% 40.7%
LGD % 26.2% 29.4% 31.2% 28.0% 30.8% 27.1% 26.1% 20.2% 20.7% 28.2%
SME
EAD 556 1 521 3 246 3 337 3 371 2 290 1 442 424 514 16 701
Out-standing amount
510 1 307 2 829 2 842 2 813 1 952 1 241 381 483 14 359
Undrawn amount
215 578 959 1 181 1 094 628 398 91 91 5 234
Average CCF %
20.9% 35.9% 40.9% 38.8% 47.7% 51.3% 48.8% 46.3% 33.2% 42.3%
LGD % 18.4% 22.7% 21.5% 24.4% 23.8% 23.3% 22.4% 19.5% 18.5% 22.6%
Retail
EAD 3 124 2 943 2 653 2 905 2 454 1 928 1 101 517 724 18 348
Out-standing amount
2 526 2 756 2 384 2 645 2 236 1 770 983 488 693 16 483
Undrawn amount
829 545 603 937 531 480 763 72 61 4 821
Average CCF %
71.1% 34.2% 42.4% 26.3% 40.2% 32.7% 15.1% 39.0% 50.8% 37.5%
LGD % 24.4% 20.0% 23.2% 23.6% 28.5% 27.3% 28.4% 24.3% 24.5% 24.4%
Residentialmortgages
EAD 22 534 4 498 655 7 220 6 315 1 860 1 531 367 2 206 47 186
Out-standing amount
22 533 4 498 654 7 096 6 098 1 837 1 518 366 2 200 46 800
Undrawn amount
1 0 1 124 217 23 13 1 6 386
Average CCF - %
100.0% - 58.5% 100.0% 99.9% 100.0% 100.0% 100.0% 100.0% 100.0%
Average LGD - %
13.1% 14.0% 17.1% 17.8% 20.3% 21.4% 19.5% 19.2% 21.2% 15.9%
* KBC Commercial Finance and KBC Immolease only included in the figures for 2013.

Risk report 2013 • KBC Group • 60
The table shows that LGDs are the lowest for residential mortgages, which by definition have a
partly or fully secured nature. Furthermore, LGDs are on average higher for ‘Corporates’ than for the
‘Retail’ and ‘SME’ classes. The relationship between PDs and LGDs is not a strong one. LGDs are
driven by risk mitigants, such as collateral or guarantees, and through a product- or country-specific
calibration.
Strictly pursuant to Basel II pillar 3 rules, KBC should disclose a comparison of ‘expected losses’ with
‘actual losses’ over a longer period in time and broken down by asset class. Unfortunately, historical
loan loss information is generally not available at Basel II asset class level. KBC believes that this
disclosure is also less relevant to the extent that, up to 2012, the portfolio was largely made up of
exposure subject to the IRB Foundation approach, for which only one underlying parameter of the
EL, namely PD, is subject to own estimates/models.
Therefore, KBC has chosen to disclose this comparison only for the total portfolio which is subject to
the IRB Advanced approach. The graph compares KBC’s EL ratio (EL related to the EAD) with the
actual average credit cost percentage. Note that EL expresses the modelled expectations with a
one-year time horizon and thus there is a time lag compared to the credit cost ratio. This implies
that the 2013 credit cost ratio shown is the actual ratio over 2013, whereas the EL for 2013 is
calculated on the basis of the portfolio at year-end 2013 and is thus a modelled expectation for
2014. Only the normal (i.e. non-default) portfolio is taken into account. Exposures to the low-
default ‘Sovereigns’ and ‘Institutions’ classes have been excluded from this comparison, which
means that the focus lies with the corporate, SME and retail credit portfolio.
Given the focus on the IRB Advanced portfolio, the scope of the graph changes over time. Up to
2008, it had been limited to the Belgian retail portfolio. KBC Homeloans (the retail portfolio of KBC
Bank Ireland) only switched from the Standardised to the IRB approach halfway through 2008 and
was thus only incorporated into the graph below from 2009 on. As of 2012, the graph includes
both the retail and corporate/SME portfolio of those entities that have adopted the IRB Advanced
approach, as well as the retail portfolio of KBC Bank Ireland and K&H Bank.
Comparison historic credit cost and expected loss ratioExposure subject to IRB Advanced
Year
rati
o (%
)
-0,20%
0,00%
0,20%
0,40%
0,60%
0,80%
1,00%
1,20%
Expected LossActual Credit Cost Ratio
2005 2006 2007 2008 2009 2010 2011 2012 2013

Risk report 2013 • KBC Group • 61
The credit cost ratio increased significantly due to substantial additional impairment at KBC Ireland.
After excluding KBC Ireland residential mortgages, the expected loss came to 0.23% and the credit
cost ratio was equal to 0.42% (in 2012, the expected loss came to 0.27% and the credit cost ratio
was equal to 0.33%).
Due to the point of cycle calculation methodology (PD is calculated through the cycle approach and
LGD is calculated by the downturn approach) the EL stays stable over time. The credit cost ratio is a
point of time calculation. In a booming economy, the actual losses are lower than the modelled
losses. In a recession, the actual losses are higher than the modelled losses. Note that the credit cost
ratio is influenced by some specific large cases.
Quality analysis of the total credit exposure in the lending portfolio – Standardised
As mentioned above, only the lending exposure subject to the Standardised approach is dealt with
in this section.
KBC uses the regulatory defined risk buckets to assess the quality and linked risk weight for all
exposure calculated according to the Standardised approach. It uses external ratings from S&P’s,
Fitch and Moody’s to define the risk bucket of exposures. If there are three external ratings with
different risk weights attached to them, the risk weight corresponding with the second best external
rating is applied.
The table below shows credit risk exposure calculated according to the Standardised approach and
broken down by type of exposure and risk bucket.
Much of the exposure is assigned to the unrated bucket. This includes the ‘secured by real estate’
exposure, which does not require a rating. Obviously, the ‘Retail’ exposure is assigned to the unrated
bucket. Even for the ‘Corporates’ exposure, unrated debtors account for 99% of the portfolio, as
can be expected for a portfolio with a focus on Central and Eastern European midcaps (over half of
the unrated corporate exposure originates from CSOB Slovak Republic). Due to the absence of
external ratings, the RWA of the KBC standardised portfolio is primarily volume-driven over time.

Risk report 2013 • KBC Group • 62
Standardised exposure [EAD] 31-12-2012*(in millions of EUR)
Quality steps
1 2 3 4 5 6 Unrated Total
Sovereign 27 147 3 416 0 3 103 0 1 148 31 817
RGLA 0 0 6 0 0 0 140 146
PSE 0 0 0 0 0 0 0 0
MDB 2 0 1 0 0 0 7 9
International organisations 0 0 0 0 0 0 0 0
Institutions 84 197 266 0 0 0 18 566
Corporates 0 0 34 10 0 0 3 404 3 448
Retail 0 0 0 0 0 0 2 149 2 149
Secured by real estate 0 0 0 0 0 0 2 315 2 315
Past due 0 0 0 0 0 0 233 233
High risk 0 0 0 0 0 0 0 0
Covered bonds 0 0 0 0 0 0 0 0
CIU 0 0 0 0 0 0 0 0
Short term 0 0 0 0 31 0 0 31
Other 0 0 0 0 0 0 889 890
Total 27 233 200 724 10 3 134 0 10 303 41 603
Standardised exposure [EAD] 31-12-2013(in millions of EUR)
Quality steps
1 2 3 4 5 6 Unrated Total
Sovereign 27 581 0 148 0 3 816 0 1 532 33 078
RGLA 0 0 0 0 0 0 135 135
PSE 0 0 0 0 0 0 29 29
MDB 2 0 1 0 0 0 8 10
International organisations 0 0 0 0 0 0 0 0
Institutions 44 114 21 0 0 0 30 210
Corporates 0 0 0 251 1 0 2 024 2 276
Retail 0 0 0 0 0 0 1 528 1 528
Secured by real estate 0 0 0 0 0 0 1 637 1 637
Past due 0 0 0 0 0 0 218 218
High risk 0 0 0 0 0 0 0 0
Covered bonds 0 0 0 0 0 0 0 0
CIU 0 0 0 0 0 0 0 0
Short term 0 0 0 0 0 0 0 0
Other 0 0 0 0 0 0 602 602
Total 27 626 114 171 251 3 818 0 7 743 39 722
* Absolut Bank only included in the figures for 2012.
The overall decrease in exposures, especially in the unrated quality step, is due to the divestment of
Absolut Bank in 2013.

Risk report 2013 • KBC Group • 63
Impaired credit exposure in the lending portfolio
The tables show impaired credit risk exposure per geographic region and per sector.
They include all exposure in the lending portfolio, independently of the regulatory approach or the
assigned exposure type or asset class. If exposure is treated according to the IRB approach,
impairment is determined in the same way as for accounting purposes, i.e. the PD assigned to the
obligor of the exposure is PD 10, 11 or 12. If exposure is treated according to the Standardised
approach, impairment is determined by the fact that provisions were set for the exposure and/or as
‘past due’ in this section. It is worth mentioning that the EAD reported here and originated via the
Standardised approach, already takes provisions for the exposure into account. For exposure
calculated according to the IRB approach, this is not the case.
Impaired exposure per geographic region [EAD](in millions of EUR)
31-12-20122 31-12-20131
Africa 0 1
Asia 71 66
Central and Eastern Europe & Russia 2 401 2 194
Latin America 4 4
Middle East 30 15
North America 301 315
Oceania 328 244
Western Europe 8 341 11 307
Of which Belgium 2 589 2 891
Ireland 4 387 7 175
Total 11 477 14 145
Impaired exposure per sector [EAD](in millions of EUR)
31-12-20122 31-12-20131
Agriculture, Farming & Fishing 98 115
Automotive 152 144
Building & Construction 717 695
Chemicals 122 123
Commercial Real Estate 2 638 2 608
Distribution 948 1 032
Electrotechnics 48 32
Finance & Insurance 181 176
Horeca 376 426
IT 101 93
Machinery & Heavy Equipment 57 68
Metals 174 160
Private Persons 3 424 6 063
Services 813 965
Shipping 252 111
Textile & Apparel 132 112
Other3 1 245 1 223
Total 11 477 14 145
1 KBC Commercial Finance and KBC Immolease only included in the figures for 2013.
2 Absolut Bank only included in the figures for 2012.
3 All sectors with a concentration of less than 1% of the total EAD are aggregated into the ‘Other’ category

Risk report 2013 • KBC Group • 64
The exposure increases in ‘Private Persons’ and ‘Ireland’ due to the reclassification of PD 9 loans to
impaired (PD 10) in view of the local economic conditions at KBC Ireland Homeloans.
For all data on impairment, provisions and value adjustments, reference is made to the consolidated
annual accounts section of KBC’s Annual Report for 2013.
Counterparty credit risk
KBC defines counterparty credit risk as the credit risk resulting from over-the-counter transactions
(i.e. where there is no formal Exchange), which are in the main Credit Default Swaps (CDS), interest-
related transactions (e.g., Interest Rate Swaps), currency-related transactions (e.g., FX swap),
equity-related transactions or commodity transactions. In principle, it includes repo-like transactions,
which are measured in-house and managed like other over-the-counter transactions. However, in
this report, repo-like transactions are not covered here, but instead are dealt with in the section on
‘Credit risk mitigation’.
No distinction is made between counterparty credit risk arising from exposures subject to the IRB
approach or to the Standardised approach, nor from the banking or trading book.
The tables show the counterparty credit risk for the entities referred to in the scope description of
credit risk disclosures.
Counterparty limits are set for each individual counterparty, taking into account the general rules
and procedures set out in a group-wide policy. Sub-limits can be put in place for each product type.
The risk is monitored by a real-time limit control system, allowing dealers to check limit availability at
any time. A pre-deal check occurs before the conclusion of each transaction using ‘heavy’ add-ons
which are higher than the regulatory add-ons.
Close-out netting and collateral techniques are used wherever possible (subject to legal certainty
about applicability). These techniques are discussed in the next section. The netting benefits and risk
mitigation through collateral for OTC-derivative transactions are however already shown in the
bottom part of the table below.

Risk report 2013 • KBC Group • 65
Transaction type 31-12-2012(in millions of EUR)
Marked- to-market
Add-on Counterparty risk (EaD)
Notional value of contracts
Regulatory capital*
CDS bought -Trading 354 1 482 1 836 18 762 71
CDS sold - Trading 51 193 244 18 970 2
Other 0 1 1 15 0
Total credit derivatives 405 1 676 2 080 37 747 73
Interest Rate Swaps (IRS) 7 024 1 038 8 063 206 635 158
Caps/Floors 692 234 926 28 794 14
Other 519 319 838 30 389 8
Total interest-related transactions 8 235 1 591 9 827 265 819 179
FX forward 148 165 313 12 720 8
FX swap 497 718 1 215 66 287 6
Cross Currency IRS 761 760 1 521 40 341 14
Other 64 109 173 7 973 2
Total currency-related transactions 1 470 1 752 3 222 127 320 30
Equity swaps 1 938 1 503 3 441 43 389 18
Equity options 319 157 476 2 939 1
Total equity-related transactions 2 257 1 659 3 916 46 327 19
Total commodity transactions 19 34 52 313 0
Gross counterparty risk 12 386 6 711 19 097 477 527
Netting benefit (-) -10 068
Total counterparty risk after netting 9 031
Collateral benefit (-) -1 912
Total net Counterparty risk 7 118 301
* Based on the net counterparty risk of the transaction type.
Transaction type 31-12-20132
(in millions of EUR)Marked-
to-marketAdd-on Counterparty
risk (EaD) Notional value
of contractsRegulatory
capital1
CDS bought -Trading 85 910 995 11 928 23
CDS sold - Trading 47 110 156 13 084 1
Other 0 0 0 0 0
Total credit derivatives 132 1 020 1 152 25 012 24
Interest Rate Swaps (IRS) 4 268 882 5 151 192 840 95
Caps/Floors 613 209 822 25 596 11
Other 394 290 684 28 672 9
Total interest-related transactions 5 276 1 382 6 657 247 107 115
FX forward 196 137 333 10 943 10
FX swap 488 594 1 083 51 755 5
Cross Currency IRS 616 580 1 195 29 918 10
Other 82 103 185 7 666 3
Total currency-related transactions 1 382 1 414 2 796 100 281 27
Equity swaps 1 721 1 489 3 210 40 692 24
Equity options 224 135 359 2 350 1
Total equity-related transactions 1 945 1 624 3 569 43 042 26
Total commodity transactions 29 50 79 493 0
Gross counterparty risk 8 763 5 489 14 252 415 935
Netting benefit (-) -7 035
Total counterparty risk after netting 7 218
Collateral benefit (-) -1 830
Total net Counterparty risk 5 387 192
1 Based on the net counterparty risk of the transaction type.
2 KBC Commercial Finance only included in the figures for 2013.

Risk report 2013 • KBC Group • 66
In 2013, KBC significantly reduced its exposure to counterparty credit risk. Gross counterparty risk
decreased by 25% and net counterparty risk (after netting and collateral benefit) by 24% on an
annual basis. This decrease was primarily marked-to-market driven and to a lesser extent volume
driven, as illustrated by the fact that the marked-to-market exposure fell by 29% (impact of the
credit spread narrowing for super senior swaps) and the notional value of contracts by 13%.
A breakdown of the net counterparty risk is provided below, both by geographic region (i.e. where
the counterparty is located) and by rating band (based on external ratings). This reveals that around
82% of the total counterparty credit risk is exposure to investment-grade counterparties. There was
a decrease in net derivative exposure in the lower rating bands.
Net derivative exposure per geographic region [EAD]1
(in millions of EUR)31-12-2012 31-12-20133
Africa 1 0
Asia 100 84
Central and Eastern Europe & Russia 953 724
Latin America 0 0
Middle East 65 20
North America 412 214
Oceania 61 21
Western Europe 5 526 4 323
Total 7 118 5 387
Net derivative exposure per rating band2 [EAD]1
(in millions of EUR)31-12-2012 31-12-20133
AAA 9 0
AA 1 841 1 184
A 2 618 2 149
BBB 1 138 1 093
BB 615 475
B and below 630 384
No rating 267 102
Total 7 118 5 387
1 After collateral and netting benefits have been taken into consideration.
2 For instance, rating band AA incorporates ratings AA+, AA and AA-. If multiple ratings are available, the second best is used. If no external rating is available, the inter-
nal rating is mapped to the corresponding external rating.
3 KBC Commercial Finance only included in the figures for 2013.
As mentioned earlier, the EAD is calculated as the sum of the (positive) current replacement value
(marked-to-market) of a transaction and the applicable add-on (=current exposure method).

Risk report 2013 • KBC Group • 67
Credit risk mitigation
Credit risk mitigation entails the use of techniques to lower credit risk and hence capital needs, e.g.,
regulatory capital.
Netting
To date, KBC has not engaged in on-balance-sheet netting (i.e. the offsetting of balance-sheet
products such as loans and deposits). Close-out netting, on the other hand, is applied in order to
manage the counterparty risk arising from derivative transactions. For netting to apply, such
transactions need to be documented under ISDA-92 or ISDA-2002 Master Agreements. In addition,
‘suitable for netting’ rules have been established for all relevant jurisdictions and all relevant
products, based on legal opinions published by the ISDA. Accordingly, close-out netting is only
applied if legal effectiveness and enforceability is assured.
Based on figures for the end of December 2013, the netting impact on derivative exposure
amounted to 7 billion euros. Intra-group netting is not included in this figure.
Collateral in repo transactions
KBC engages in the following types of repo transaction:
• Reverse repos and ‘buy and sell-back’ transactions: These transactions are considered deposits
made by KBC, with KBC lending cash against securities until the cash is repaid. The difference
between reverse repos and buy and sell-backs is technical and relates to the way coupon
payments are handled during the transaction.
The securities underlying the reverse repo transactions are almost solely government securities,
with the underlying issuers of the remaining securities being mainly banks and corporate entities.
In order to conclude such transactions, a standard General Master Repurchase Agreement (GMRA)
needs to be concluded with the counterparty, and legal certainty must exist for all relevant
jurisdictions. Transactions also need to be compliant with KBC’s repo policies for all relevant
entities.
• Repos and ‘sell and buy-back’ transactions: These transactions are considered funding, as KBC
receives cash in exchange for securities provided as collateral until the cash is repaid. Here too, the
difference between repos and sell and buy-backs is a technical one.
• Tri-party repo transactions: These transactions are a specific type of reverse repo, where KBC
would lend cash and would receive securities as collateral but, unlike regular reverse repos, the
collateral is managed by a third party and more types of collateral can be used as stipulated in the
tri-party repo contracts. Exposure to these at both reporting dates was zero.

Risk report 2013 • KBC Group • 68
31-12-20125
(in millions of EUR)Exposure (EAD) Covered exposure
(EAD)Covered exposure
(%)
Reverse repos/’buy and sell-back’1 5 308 1 486 28%3
Repos/’sell and buy-back’2 5 294 5 251 99%
Total 10 602 6 737 64%
31-12-20134
(in millions of EUR)Exposure (EAD) Covered exposure
(EAD)Covered exposure
(%)
Reverse repos/’buy and sell-back’1 9 518 3 532 37%
Repos/’sell and buy-back’2 5 296 5 266 99%
Total 14 814 8 798 59%
1 The covered exposure is lower than the exposure, as the security amount is corrected for regulatory haircuts and mismatches.
2 The exposure of repo transactions, which is based on the market value of the securities in the transaction, is higher than the coverage by cash (covered exposure), which
is also due to the notion of haircuts. These haircuts are added to the securities leg of the transaction.
3 This low percentage is mainly due to transactions at CSOB Czech Republic, where the reverse repo counterparty and the counterparty of the securities is the same entity,
namely the Czech National Bank. Therefore, the collateral is not eligible for capital purposes and thus not included in the coverage percentage.
4 KBC Commercial Finance only included in the figures for 2013.
5 Figures exclude the LTRO repo with the ECB at KBC Bank Ireland (exposure of 3.8 billion euros, 3.6 billion euros of which covered), which was repaid at the beginning of 2013.
Other collateral
This section covers credit risk mitigation by means of collateral provided to cover the counterparty
risk arising from derivative transactions and the lending portfolio. The tables show the EAD covered,
broken down into different portfolios and different types of credit risk mitigation.
Counterparty risk arising from derivative transactions (excluding repo-like transactions)
With regard to collateral for counterparty risk arising from derivative transactions (other than repos
which are covered above), a collateral management policy is in place. Financial collateral is only
taken into account if the assets concerned are considered eligible risk-mitigants for regulatory
capital calculations. This implies, among other things, that legal comfort must have been obtained
regarding the ownership of the collateral for all relevant jurisdictions.
Of the total counterparty risk exposure after netting and before collateral, 25.4% (1 830 million
euros of 7 218 million euros) was classified as collateralised at the end of 2013. A breakdown of
covered exposure values by exposure classes and type of collateral is provided in the table below.
Both debt securities and cash collateral were taken into account for credit risk mitigation of
counterparty risk exposure. In this respect, it should be noted that, according to the applicable
policy, equity collateral is not eligible.
Covered exposure 1,2 (EaD) 31-12-2012(in millions of EUR)
LGD % applied
under IRB Foundation
Sovereigns Institutions Corporates SME Corporates
Total
Cash 0% 0 1 383 120 0 1 503
Debt securities 0% 0 116 293 0 409
Total 0 1 499 413 0 1 912
Covered exposure 1,2 (EaD) 31-12-2013(in millions of EUR)
LGD % applied
under IRB Foundation
Sovereigns Institutions Corporates SME Corporates
Total
Cash 0% 0 1 263 54 0 1 318
Debt securities 0% 0 89 424 0 513
Total 0 1 352 478 0 1 830
1 Covered EAD is the EAD amount (after netting) on which a reduced LGD percentage is applied due to collateralisation.
2 The exposure only relates to the covered counterparty risk arising from derivative transactions.

Risk report 2013 • KBC Group • 69
Lending portfolio
Exposures and collateral subject to the Standardised and IRB Advanced approaches are excluded
from the table below. Collateral applying to lending exposure subject to the Standardised approach
have a direct effect by lowering the EAD, which in turn has a direct effect on RWA and on capital.
Since LGD is irrelevant for these exposures, the collateral is not included in the table. Collateral
applying to lending exposure subject to the IRB Advanced approach affects RWA only indirectly as
collateral is included in LGD modelling (see ‘IRB Quality analysis’ and ‘Internal modelling’).
Of the lending EAD subject to the IRB-Foundation approach, 1.0 billion euros was classified as
collateralised at the end of 2013, implying that a lower LGD percentage is applied to this portion of
exposure in the capital calculations. The impacted exposure is to be interpreted as the total
collateralised2 EAD to which an LGD percentage of 0%, 30%, 35% or 40% has been applied in the
capital requirement calculations (compared to an LGD of 45% as used for un-collateralised
amounts). The exact percentages depend on the type of collateral concerned as indicated in the
table below. Additional information on the extent to which collateral was taken into account in the
internal LGD estimation under this approach is provided in the ‘Internal modelling’ section.
It is clear that credit risk mitigation is only applied when the necessary policies and procedures are in
place. Under the IRB Foundation approach, only the collateral meeting the eligibility criteria and
minimum requirements (as imposed by the CRD) to qualify for credit risk mitigation has been
included in the figures. Hence, bearing in mind that the figures refer to collateralised EAD as
described in the previous paragraph, the effective amount of collateral obtained in KBC is much
higher than the figure taken into account for risk mitigation purposes. Real estate collateral
obtained for KBC’s commercial real estate financing activities is not taken into account for credit risk
mitigation purposes, for instance.
2 After the application of haircuts, mismatch corrections and collateralisation floors.

Risk report 2013 • KBC Group • 70
The table below gives the total EAD covered by eligible financial and physical collateral for each
exposure class (limited to exposures treated under the IRB Foundation approach).
Covered IRB Foundation lending exposure [EAD]1 31-12-2012(in millions of EUR)
LGD ap-plied under
IRB Foun-dation2
Sovereign Institutions Corporates SME Corporates
Total
Cash 0% 3 0 93 71 166
Debt securities 0% 0 33 0 0 33
Equity collateral 0% 0 0 0 0 0
Total financial collateral 3 33 93 71 200
Real estate3 30% 10 0 184 601 795
Receivables 35% 0 0 18 2 20
Lease collateral 35% 0 0 0 0 0
Other physical collateral 40% 0 0 2 8 10
Total physical collateral 10 0 204 610 825
General total 13 33 297 681 1 025
Covered IRB Foundation lending exposure [EAD]1 31-12-2013(in millions of EUR)
LGD ap-plied under
IRB Foun-dation2
Sovereign Institutions Corporates SME Corporates
Total
Cash 0% 6 0 104 71 181
Debt securities 0% 0 51 0 0 51
Equity collateral 0% 0 0 0 0 0
Total financial collateral 6 51 104 71 232
Real estate3 30% 10 0 184 518 712
Receivables 35% 0 0 14 1 15
Lease collateral 35% 0 0 0 0 0
Other physical collateral 40% 0 0 0 0 0
Total physical collateral 10 0 198 519 727
General total 16 51 302 590 959
1 Covered EAD is the EAD amount subject to a reduced LGD percentage due to collateralisation.
2 The LGD percentages are those applied in accordance with Belgian regulations.
3 Including real estate leasing.
There is a slight decrease in the collateral which is caused by the light decrease in the loan volume.
The table shows that the bulk of the collateralised amounts relates to physical collateral (0.7 billion
euros), while financial collateral, which has a bigger impact on capital as it attracts a LGD of 0%, is
limited to 0.2 billion. Furthermore, as financial collateral is predominantly cash collateral and
non-cash financial collateral is amply diversified, issuer concentration risk in respect of financial
collateral is negligible.
Where physical collateral is concerned, the concentrations shown in the table are in line with
expectations, as most collateral is held for the ‘Corporates’ and ‘SME Corporates’ asset classes (and
not ‘Sovereign’ and ‘Institutions’). The focus on real estate collateral in these asset classes reflects
the preference for this type of asset when collateral is called for.

Risk report 2013 • KBC Group • 71
Unfunded credit protection
Unfunded credit protection is provided mainly through guarantees and – to a much lesser extent –
credit derivatives entered into for hedging purposes. For guarantees, the impacted exposure (i.e.
amounts receiving a better rating through PD substitution, resulting in lower capital requirements)
amounted to 1.7 billion euros at the end of 2013. This relates solely to exposures treated under the
Standardised and IRB Foundation approaches. Unfunded credit protection applying to lending
exposure under the IRB Advanced approach affects RWA only indirectly as guarantees are included
in LGD modelling. Additional information on how unfunded credit protection was taken into
account in the internal LGD estimation under this approach can be found in the ‘Internal modelling’
section.
Covered exposure (EAD)1,2,3 31-12-2012(in millions of EUR)
Sovereign Institutions Corporates SME Corporates
Total
Credit derivatives 0 0 0 0 0
Guarantees 95 436 1 373 227 2 131
Total 95 436 1 373 227 2 131
Covered exposure (EAD)1,2,3 31-12-2013(in millions of EUR)
Sovereign Institutions Corporates SME Corporates
Total
Credit derivatives 0 0 0 0 0
Guarantees 126 413 988 169 1 696
Total 126 413 988 169 1 696
1 Covered exposure is the EAD amount after netting covered by guarantees or credit derivatives and thus subject to substitution.
2 The breakdown refers to the exposure classes before substitution is applied.
3 The scope of the table includes the Standardised and IRB Foundation approaches.
The main types of guarantors and providers of protection through credit derivatives are government
entities and large financial institutions such as banks, investment banks and insurance companies.
Internal modelling
The credit risk models developed by KBC over the years to support decisions in the credit process
include Probability of Default models (PD), Loss Given Default models (LGD) and Exposure At Default
models (EAD) models, plus application and behavioural scorecards for specific portfolios (retail and
SME).
These models are used in the credit process for:
• defining the delegation level for credit approval (e.g. PD models, LGD models, EAD models);
• accepting credit transactions (e.g., application scorecards);
• setting limits (e.g., EL limits);
• pricing credit transactions (predominantly through the use of the RAROC concept);
• monitoring the risk of a (client) portfolio (Risk Signals Databases);
• calculating the internal economic capital;
• calculating the regulatory capital;
• input for other credit risk models (e.g., behavioural scores as pooling criteria for the retail
portfolio).

Risk report 2013 • KBC Group • 72
Probability of Default models
Probability of Default (PD) is the likelihood that an obligor will default on its obligations within a
one-year time horizon, with default being defined in accordance with Basel II rules. The PD is
calculated for each client or for a portfolio of transactions with similar attributes (pools in retail
portfolios).
There are several approaches to estimating PDs (from purely objective to more subjective methods);
however, all have four steps in common:
Step 1: The segment for which a model will be built is defined (segmentation of the portfolio). It is
important that a good balance be struck between the homogeneity of the segment, the exposure,
the number of clients and the number of default events. Having too many models will lead to
additional operational risks in the credit process, smaller and less reliable data samples and high
maintenance costs. On the other hand, the predictability of the models will go down if the
segments are less homogeneous. Once the segment has been defined, the data sample on which
the model development will be based can be created. This usually requires some ‘cleansing’ of the
available data (for instance, handling missing values and outliers). KBC has built its rating models
mainly on internal data.
Step 2: This entails ranking the clients in the targeted segment according to their creditworthiness.
Depending on the amount of data available and its characteristics (subjective or objective), specific
techniques are used in order to create a ranking model.
• Statistical default/non-default models based on objective inputs: Rankings are derived purely
mechanically with no subjective input, using regression techniques. At KBC, this method is only
used in the retail segment where objective data is plentiful (e.g., behavioural information).
• Statistical default/non-default models based on objective and subjective input: These are very
similar to the purely objective models, but also use subjective input entered by a credit adviser (for
instance management quality). At KBC, this method is used to rank large Western European
corporate customers, for example.
• Statistical expert-based models: Rankings are based on quantitative and qualitative input, but due
to the small number of observed default events, regression is applied to predict expert
assessments of the creditworthiness of the clients, rather than their default/non-default behaviour.
At KBC, this method is used to rank borrowers in the ‘Commercial real estate and site financing’
segment, for example.
• Generic flexible rating tool: This is a template that is used by ‘graders’ to justify and document the
given rating class. In this template, the most relevant risk indicators are given a score and ranked
in order of importance as a basis for a final rating.
Step 3: The ranking score is calibrated to a probability of default.

Risk report 2013 • KBC Group • 73
Step 4: The probability of default is mapped to a rating class. There is a unique rating scale at KBC
for all segments, the so-called KBC Master Scale.
Once all the steps have been taken and the model built and implemented, the quality of the PD
models developed is measured by:
• Statistical analysis: variable distributions (means, standard deviations), rating distributions,
statistical powers of variables and (sub)models.
• The number of overrulings: if users frequently overrule the output of a model, this indicates that
the model might be improved.
• The soundness of model implementation and policies, more specifically as regards system access,
system security, integrity of data input, etc.
• The available documentation (user manual, technical reports, etc.).
Loss Given Default models
Loss Given Default (LGD) is a measure of the loss that a bank would suffer if an obligor defaults. It
can be expressed as an amount or as a percentage of the expected amount outstanding at the time
of default (EAD).
In general, there are many ways of modelling the LGD, such as:
• Market LGD: this is observed from market prices of defaulted bonds or marketable loans soon
after the actual default event.
• Workout LGD: this is determined by the sum of cashflows resulting from the workout and/or
collections process, discounted to the time of default and expressed as a percentage of the
estimated exposure at default.
The LGD models currently used at KBC are all workout LGDs. The models developed are
(methodologically) based on historical recovery rates and cure rates3 per collateral type or per pool
(segmentation-based approach).
A major challenge posed by the Basel II regulations is the ‘downturn requirement’. The underlying
principle is that the LGD is correlated to the PD, and loss rates will be higher in a year with many
defaults. This effect has been demonstrated in a number of studies. However, as these studies
almost exclusively used market LGD, they are not necessarily relevant for workout LGD.
One explanation for the difference in cyclicality between market LGD and workout LGD is the fact
that workout LGD is based on a recovery process that can take several years. In most cases, the
workout period will thus include periods of both upturn and downturn economic conditions.
3 The cure rate is the percentage of defaulted clients returning to a non-default state.

Risk report 2013 • KBC Group • 74
Market LGD is based entirely on information one month after default. In downturn economic
conditions, the market will be hit by a large supply of defaulted bonds, depressing prices. The classic
market mechanism based on supply and demand may prove to be a stronger driver for the
‘downturn’ recovery rates than the macroeconomic conditions that led to the higher number of
defaults.
Data collected from the current credit crisis will help KBC Group to model downturn LGD based on
its own portfolios and workout processes.
Exposure At Default (EAD) models
KBC uses historical information that is available on exposures of defaulted counterparties to model
EAD. The EAD model is used to estimate the amount that is expected to be outstanding when a
counterparty defaults in the course of the next year.
Measuring EAD tends to be less complicated and generally boils down to clearly defining certain
components (discount rate, moment of default and moment of reference) and gathering the
appropriate data. In most cases, EAD equals the nominal amount of the facility, but for certain
facilities (e.g., those with undrawn commitments) it includes an estimate of future drawings prior to
default.
Pooling models
A pool is a set of exposures that share the same attributes (characteristics).
Pooling can be based on continuous estimates of PD, LGD and EAD or on other relevant
characteristics.
• If pooling is based on continuous estimates of PD, LGD and EAD the pooling merely consists of
aggregating the continuous estimates into PD, LGD and EAD bands. The added value of pooling is
that exposure can be processed on an aggregate basis, which enhances calculation performance.
• If pooling is based on other criteria, loans are aggregated into pools based on these criteria. Since
criteria need not be continuous (for example, whether or not there is a current account, which
only has two categories) the resulting PD, LGD and EAD estimates are not necessarily on a
continuous scale.
Group-wide framework for dealing with model uncertainty
While KBC makes extensive use of modelling to steer its business processes, it aims to do so in a
cautious manner. In particular, it recognises that no value or risk model provides a perfect prediction
of future outcomes. Explicit measures for dealing with model risk are therefore imposed. The
potential shortcomings of credit risk models are grouped into three categories, each of which is
evaluated using a fixed group-wide assessment.
• Known deficiencies are shortcomings for which the size of the error is known in some way. An
example is a model implementation where the average model PD differs from the calibration
target. For known deficiencies, a correction is applied to the outcome of the model in order to
arrive at a best estimate.

Risk report 2013 • KBC Group • 75
• Avoidable uncertainties concern measurements that are known to be uncertain and rectifiable,
but for which the size and even the sign of the error is not known. Examples are an uncertainty
triggered by a late model review or not timely reassessed PDs. For avoidable uncertainties, capital
penalties are imposed as incentive for corrective actions.
• Unavoidable uncertainties are similar to avoidable uncertainties, except that here the uncertainty is
inherent and hence not rectifiable. An example is a new credit portfolio for which no relevant
historical data can be found. To raise awareness, estimates of potential errors are made for
unavoidable uncertainties. For PD, EAD and LGD models, a portion of these uncertainties is also
covered by means of capital penalties.
The estimated overall level of uncertainty (avoidable + unavoidable) is clearly communicated to any
stakeholder that uses the model outputs.
This framework was adopted in the last quarter of 2013, replacing a similar one that had been in
place from the second quarter of 2010.

Risk report 2013 • KBC Group • 76
Overview of credit risk models
The table below shows information on some of the most relevant PD models used for capital
calculations under the IRB approach. The scope of the tables excludes all pooled exposure.
PD models used under the IRB approach, 31-12-20131
(in billions of EUR)
Exposure granted (EAD)
Central tendency2
Historical default rate3
Average model PD
(excl. overrulings)4
PD models for government and public sector segments
(Worldwide) model for central governments 14.03 0.70% 0.71% 0.62%
(Worldwide) model for sub national governments (Belgium – UK – USA)
0.92 0.034% 0.034% n/a
Czech municipalities 0.33 0.30% 0.21% 0.24%
Hungarian municipalities 0.12 1.31% 0.97% 0.94%
PD models for corporate and institutional segments
Large corporates6
of which non-Irish 14.69 1.64% 1.60% 1.56%
of which Irish 0.20 4.50% 6.15% 2.91%
Czech corporates and large SMEs7 2.85 1.80% 1.86% 1.77%
Czech Corporates7 2.45 1.20% 1.11% n/a
Hungarian corporates 1.87 2.47% 2.40% 2.78%
(Worldwide) model for banks
of which developed 9.24 0.30% 0.10% 0.41%
of which others 11.29 1.13% 0.46% 1.00%
(Worldwide) model for project finance 2.98 1.54% 2.37% 0.98%
(Worldwide) model for commercial real estate
of which non-Irish 4.34 2.44% 2.28% 1.84%
of which Irish 1.89 8.89% 8.85% 10.37%.
(Worldwide) model for management buy outs 1.06 4.04% 4.78% 4.36%
PD models for SME segments
models for Belgian professionals
of which members of liberal professions5 0.18 0.44% 0.45% 0.44%
of which self-employed5 0.99 1.84% 1.84% 1.79%
of which private persons5 0.40 1.56% 1.56% 1.34%
Belgian farmers5 1.29 1.58% 1.43% 1.52%
Belgian SMEs – small businesses5 16.85 1.96% 1.96% 1.73%
Czech large and mid SMEs7 0.31 2.60% 2.54% n/a
Hungarian upper SMEs 0.08 3.34% 3.27% 3.21%
1 Non-exhaustive list of models used under the IRB approach, and excluding all retail pooling models.
2 The central tendency is the average through-the-cycle default probability of a portfolio.
3 The default rate is the observed number of defaulted obligors during a certain time period as a percentage of total non-defaulted obligors at the beginning of the
period (this result is scaled to a one-year period).
4 The average model PD is the mean PD of all obligors according to the model. The value at the time of the latest review is shown.
5 Central tendency, default rate and average model PD values can differ from entity to entity. The values shown here are those for KBC Bank NV.
6 Large Corporates PD model is a new model that combines the scope of 3 previously existing models (Asia-Pacific corporates, US corporates and Western European
corporates).
7 The previously existing models for Czech corporates and large SMEs on the one hand and Czech mid SMEs on the other hand are gradually being replaced by the
models for Czech corporates on the one hand and Czech large and mid SMEs on the other hand.

Risk report 2013 • KBC Group • 77
The
tabl
e be
low
sho
ws
info
rmat
ion
on s
ome
of t
he m
ost
rele
vant
LG
D m
odel
s us
ed f
or c
apita
l cal
cula
tions
und
er t
he IR
B A
dvan
ced
appr
oach
. The
sco
pe o
f th
e ta
bles
is
limite
d to
the
lend
ing
port
folio
and
doe
s no
t in
clud
e de
rivat
ives
or
repo
-like
tra
nsac
tions
.
LGD
mod
els
used
un
der
the
IRB-
Adv
ance
d ap
proa
ch, 3
1-12
-201
3(in
bill
ions
of
EUR)
Expo
sure
gr
ante
d (E
AD
)A
vera
ge L
GD
no
n-de
faul
ted
expo
sure
s (P
D 1
-9)
Ave
rage
LG
D
defa
ulte
d ex
posu
res
(unc
erta
in, P
D
10-1
1)
Ave
rage
LG
D
defa
ulte
d ex
posu
res
(irre
cove
rabl
e,
PD 1
2)
Expo
sure
co
vere
d by
fi
nanc
ial
colla
tera
l
Expo
sure
co
vere
d by
ph
ysic
al
colla
tera
l
Expo
sure
co
vere
d by
gu
aran
tees
Expo
sure
co
vere
d by
cr
edit
de
riva
tive
s
LGD
mod
els
for g
over
nmen
t and
pub
lic s
ecto
r seg
men
ts
(Wor
ldw
ide)
mod
el fo
r cen
tral
gov
ernm
ents
12.1
20.3
1%-1
-10%
0%0%
0%
LGD
mod
els
for c
orpo
rate
and
fina
ncia
l seg
men
ts2
(Wor
ldw
ide)
fina
ncia
l in
stitu
tions
38.
520
.75%
29.4
4%n/
a0%
0%4%
0%
(Wor
ldw
ide)
cor
pora
tes
17.7
31.7
3%21
.24%
58.0
3%2%
21%
6%0%
(Wor
ldw
ide)
com
mer
cial
re
al e
stat
e pr
ojec
t fina
nce
3.7
23.3
7%33
.11%
n/a
1%54
%7%
0%
(Wor
ldw
ide)
pro
ject
fi
nanc
e42.
418
.41%
- n
/a0%
1%0%
0%
LGD
mod
els
for S
ME
segm
ents
Bel
gian
SM
Es27
.220
.98%
12.5
5%24
.63%
11%
56%
8%0%
Cze
ch c
orpo
rate
s a
nd S
MEs
6.1
23.6
5%25
.63%
- 6%
21%
19%
0%
LGD
poo
ling
mod
els
for r
etai
l seg
men
ts5
LG
D p
oolin
g m
odel
for B
elgi
an re
gula
ted
reta
il33
.515
.36%
30.3
8%52
.45%
--
--
LG
D p
oolin
g m
odel
fo
r Iris
h m
ortg
age
loan
s12
.119
.14%
30.5
6%-
--
--
LG
D p
oolin
g m
odel
s fo
r Cze
ch re
tail
9.4
20.8
2%17
.49%
35.8
8%-
--
-
LG
D p
oolin
g m
odel
fo
r Hun
garia
n re
tail
2.0
27.4
3%46
.21%
--
--
-
1 A
t yea
r-end
201
3, K
BC h
ad n
o de
faul
ted
expo
sure
s us
ing
the
LGD
mod
el fo
r cen
tral
gov
ernm
ents
.
2 N
o sp
ecifi
c LG
D m
odel
exi
sts
for i
rrec
over
able
(PD
12)
exp
osur
e to
fina
ncia
ls, c
omm
erci
al re
al e
stat
e or
pro
ject
fina
nce.
Inst
ead,
the
gene
ric ir
reco
vera
ble
LGD
mod
el fo
r wor
ldw
ide
corp
orat
es is
use
d.
3 Th
e LG
D m
odel
for fi
nanc
ial i
nstit
utio
ns is
also
use
d fo
r non
-ban
k fin
anci
als
that
are
trea
ted
as c
orpo
rate
s un
der B
asel
II. H
ence
, the
sco
pe s
houl
d no
t be
conf
used
with
‘Ins
titut
ions
’ in
this
repo
rt.
4 N
o co
llate
ral o
r gua
rant
ee in
form
atio
n av
aila
ble
for t
he w
orld
wid
e pr
ojec
t fina
nce
mod
el.
5 N
o co
llate
ral o
r gua
rant
ee in
form
atio
n pr
ovid
ed fo
r ret
ail p
oolin
g m
odel
s, a
s LG
Ds
are
dete
rmin
ed b
ased
on
the
allo
catio
n of
tran
sact
ions
to p
rede
fined
poo
ls an
d no
t on
the
leve
l of r
isk m
itiga
tion
at a
tran
sact
iona
l lev
el.

Risk report 2013 • KBC Group • 78
In terms of credit risk mitigation there is an important presence of physical collateral, a material
presence of guarantees and a more modest presence of financial collateral. For the worldwide
corporate model, physical collateral mostly comprises mortgage registrations (1.1 billion euros),
powers of attorney to create a mortgage (0.7 billion euros), pledges (1.1 billion euros), powers of
attorney to establish a pledge (0.3 billion euros) and leased objects (0.6 billion euros), while
guarantees are issued by governments (0.1 billion euros) and insurance agents (0.6 billion euros).
For the worldwide commercial real estate project finance model, physical collateral is almost
exclusively mortgage registrations (1.0 billion euros) and powers of attorney to create a mortgage
(0.4 billion euros). For the Belgian SME model, the bulk of credit risk mitigation comes in the form
of physical collateral. The most material collateral types are mortgage registrations (5.5 billion
euros), powers of attorney to create a mortgage (7.2 billion euros), pledges (1.2 billion euros),
powers of attorney to establish a pledge (0.4 billion euros) and leased objects (0.9 billion euros). The
guarantees are mostly issued by governments (1.2 billion euros) or sureties provided by private
persons (0.7 billion euros).
Credit risk related to KBC Insurance
Notwithstanding the fact that KBC Insurance is not subject to Basel II capital requirements, it holds
financial instruments that attract a credit risk. This risk stems primarily from the investment portfolio
(i.e. issuers of debt instruments).
Credit risk also arises due to insurance or reinsurance contracts concluded mainly by KBC Insurance.
In some cases, however, other entities are also involved.

Risk report 2013 • KBC Group • 79
Credit risk in the investment portfolio of KBC Insurance
For the insurance activities, credit exposure exists primarily in the investment portfolio (towards
issuers of debt instruments) and towards reinsurance companies. We have guidelines in place for
the purpose of controlling credit risk within the investment portfolio with regard to, for instance,
portfolio composition and ratings.
Investment portfolio of KBC group insurance entities(in millions of EUR, market value)1 31-12-20125 31-12-20135
Per balance sheet itemSecurities 19 634 19 284
Bonds and other fixed-income securities 18 983 18 003
Held to maturity 5 788 6 731
Available for sale 13 190 11 266
At fair value through profit or loss and held for trading 0 1
As loans and receivables 5 5
Shares and other variable-yield securities 633 1 262
Available for sale 630 1 260
At fair value through profit or loss and held for trading 3 3
Other 18 19
Property and equipment and investment property 408 354
Investment contracts, unit-linked2 11 847 12 745
Other 89 701
Total 31 978 33 084
Details for bonds and other fixed-income securitiesBy rating3, 4
Investment grade 95% 96%
Non-investment grade 1% 3%
Unrated 4% 1%
By sector3
Governments 63% 64%
Financial6 26% 21%
Other 11% 15%
By currency3
Euro 94% 94%
Other European currencies 6% 6%
US dollar 0% 0%
By remaining term to maturity3
Not more than 1 year 13% 15%
Between 1 and 3 years 19% 20%
Between 3 and 5 years 15% 19%
Between 5 and 10 years 33% 29%
More than 10 years 20% 18%1 The total carrying value amounted to 32 576 million euros at year-end 2013 and to 31 277 million euros at year-end 2012.
2 Representing the assets side of unit-linked (class 23) products and completely balanced on the liabilities side. No credit risk involved for KBC Insurance.
3 Excluding investments for unit-linked life insurance. In certain cases, based on extrapolations and estimates.
4 External rating scale.
5 Excluding entities classified as ‘disposal groups’ under IFRS 5. There were no insurance entities in that classification at year-end 2013. In 2012, the relevant entities (see
‘Remark’ at the start of this section) had an investment portfolio of 0.2 billion euros.
6 Including covered bonds and non-bank financial companies.

Risk report 2013 • KBC Group • 80
Credit risk due to insurance or reinsurance contracts
We are also exposed to a credit risk in respect of (re)insurance companies, since they could default
on their commitments under (re)insurance contracts concluded with us. We measure this particular
type of credit risk by means of a nominal approach (the maximum loss) and expected loss, among
other techniques. Name concentration limits apply. PD – and by extension – expected loss is
calculated using internal or external ratings. We determine the exposure at default by adding up the
net loss reserves and the premiums, and the loss given default percentage is fixed at 50%.
Credit exposure to (re)insurance companies by risk class1: Exposure at Default (EAD) and Expected Loss (EL)2 (in millions of EUR)
EAD 2012 EL 2012 EAD 2013 EL 2013
AAA up to and including A- 179 0.03 141 0.05
BBB+ up to and including BB- 111 0.10 147 0.13
Below BB- 0 0 0 0
Unrated 10 0.22 3 0.07
Total 299 0.35 291 0.24
1 Based on internal ratings.
2 EAD figures are audited, whereas EL figures are not.

Risk report 2013 • KBC Group • 81
Credit risk related to sovereign bond exposures
We hold a significant portfolio of government bonds, primarily as a result of our considerable excess
liquidity position and for the reinvestment of insurance reserves into fixed instruments. A breakdown
per country is provided in the table below. While most credit risk tables are expressed in terms of
gross exposure [EAD], this is not possible for the table below, as the Basel II EAD concept cannot be
applied to insurance entities. Therefore, exposure is reported in terms of carrying value.
Overview of exposure to sovereign bonds at year-end 2013, carrying value1 (in millions of EUR)
Total (by portfolio) Total (by remaining term to maturity)
Econo-mic impact of+100 basis points3
Availa-ble for
sale
Held to matu-
rity
Desig-nated at fair value
through profit or
loss
Loans and
receiva-bles
Held for
trading
Total For com-
parison pur-
poses: total
at year-end
2012
Matur-ing in 2014
Matur-ing in 2015
Matur-ing in 2016
and later
Southern Europe and Ireland
Greece 0 0 0 0 0 0 0 0 0 0 0
Portugal 40 36 0 0 0 77 94 0 10 66 -5
Spain 348 0 0 0 0 348 230 0 0 348 -27
Italy 783 80 0 0 1 865 911 5 1 859 -66
Ireland 153 308 0 0 1 462 451 0 0 462 -23
KBC core countries
Belgium 8 011 15 445 213 0 917 24 586 27 925 3 739 2 678 18 168 -1 092
Czech Rep. 2 309 5 573 66 29 993 8 970 9 503 976 2 318 5 676 -442
Hungary 235 1 677 8 88 258 2 267 2 603 34 448 1 785 -64
Slovakia 1 053 1 269 0 0 73 2 395 1 751 83 96 2 216 -125
Bulgaria 146 16 0 0 0 162 161 8 7 147 -8
Other countries
France 1 058 2 251 0 0 3 3 312 3 091 333 263 2 716 -227
Germany 364 532 16 0 30 942 1 206 104 38 800 -60
Austria 243 440 211 0 0 894 553 43 6 845 -44
Netherlands 239 453 100 0 5 797 530 66 68 663 -37
Rest2 2 918 1 623 155 0 102 4 798 3 180 521 1 530 2 747 -175
Total carrying value
17 900 29 703 771 118 2 385 50 876 52 191 5 912 7 464 37 499 –
Total nominal value
16 691 28 065 728 127 2 366 47 978 48 615 – – – –
1 Including entities classified as ‘disposal groups’ under IFRS 5 (accounted for an aggregate 0.4 billion euros at year-end 2013 and 0.5 billion euros at year-end 2012).
Excluding exposure to supranational entities of selected countries. No material impairment on the government bonds in portfolio.
2 Sum of countries whose individual exposure is less than 0.5 billion euros at year-end 2013 and also including 1.3 billion euros in deposits at the National Bank of Hungary.
3 Theoretical economic impact in fair value terms of a parallel 100-basis-point upward shift in the spread over the entire maturity structure (in millions of euros). Only part
of this impact is reflected in profit or loss and/or equity.
Main changes in 2013:
• The carrying value of the total sovereign bond exposure decreased by 1.3 billion euros, due
primarily to the lower exposure to Belgian government bonds (-3.3 billion euros, mainly on
account of OLOs that had either been sold or reached maturity), partly offset by increases in

Risk report 2013 • KBC Group • 82
Slovakia (+0.6 billion euros) and in other countries (see ‘Rest’ in the table; this heading also
includes a 0.5-billion-euro increase in deposits at the National Bank of Hungary).
• In the past few years, KBC has managed to lower considerably its exposure to GIIPS sovereign
bonds (bonds issued by Greece, Italy, Ireland, Portugal and Spain, see graph). At the end of 2013,
the combined exposure to these bonds was 1.8 billion euros.

Risk report 2013 • KBC Group • 83
Structured Credit Products

Risk report 2013 • KBC Group • 84
This section deals with KBC’s structured credit activities at year-end 2013. These activities relate to
Asset-Backed Securities (ABS) and Collateralised Debt Obligations (CDOs), which are defined as
follows:
• ABS are bonds or notes backed by loans or accounts receivables originated by providers of credit,
such as banks and credit card companies. Typically, the originator of the loans or accounts
receivables transfers the credit risk to a trust, which pools these assets and repackages them as
securities. These securities are then underwritten by brokerage firms, which offer them to the
public.
• CDOs are a type of asset-backed security and a structured finance product in which a distinct legal
entity, a Special Purpose Vehicle (SPV), issues bonds or notes against an investment in an
underlying asset pool. Pools may differ with regard to the nature of their underlying assets and
can be collateralised either by a portfolio of bonds, loans and other debt obligations, or be backed
by synthetic credit exposures through use of credit derivatives and credit-linked notes.
The claims issued against the collateral pool of assets are prioritised in order of seniority by creating
different tranches of debt securities, including one or more investment grade classes and an equity/
first loss tranche. Senior claims are insulated from default risk to the extent that the more junior
tranches absorb credit losses first. As a result, each tranche has a different priority of payment of
interest and/or principal and may thus have a different rating.
KBC was active in the field of structured credits both as an originator and an investor. Since mid-
2007, KBC has tightened its strategy in this regard (see ‘Strategy and processes’ below). As an
originator, KBC also takes on other roles such as sponsor, when it provides liquidity support to the
related SPVs. KBC also invested in structured credit products. These investments appear on KBC’s
balance sheet.
Apart from briefly describing the procedures and defining the scope, this disclosure provides more
insight into:
• structured credit programmes where KBC acts as the originator;
• KBC’s investments in structured credit products at year-end 2013, together with information on
the credit quality of the securities, an amortisation schedule of the investments, a view on the
quality of the underlying collateral, a discussion on valuation and accounting principles, a view on
the results of stress tests;
• the capital charges corresponding to the structured credit exposures.

Risk report 2013 • KBC Group • 85
Strategy and processes
Since 2007, KBC has had a tight strategy in place related to structured credit products and gradually
imposed a moratorium on originating and investing in CDOs and ABS. Before then, KBC had acted
as an originator and investor in structured credit transactions (‘legacy exposure’ in the tables). In
2013, KBC decided to lift the strict moratorium on investments in ABS and to allow treasury
investments in liquid senior European cash ABS (‘treasury ABS exposure’ in the tables), which are
accepted as eligible collateral by the ECB. This allows for further diversification in the investment
portfolios. It should be noted that the moratorium on CDOs is still in place.
A dedicated risk department focuses exclusively on the legacy structured credit positions for the
entire KBC group. This department serves as a direct counterpart to the de-risking focused
managers of structured credit positions. It analyses, identifies and advises – from a risk and capital
perspective – on proposals made by these portfolio managers to reduce the exposure to structured
credit positions in the KBC group. It is also responsible for producing consolidated reports on both
securitised and re-securitised positions and for submitting them to senior management of KBC and
the regulators. In producing these reports, there is no specific or different approach between
securitisation and re-securitisation positions, though members of the dedicated risk department
have in-depth knowledge about the specific risk drivers. This dedicated team not only reports on
positions, but also monitors overall governance to ensure that appropriate decision authorities and
business processes are in place at all levels of the organisation. Since 2012, the risk management of
structured credits has been further enhanced by processes centred on KBC’s continued de-risking
strategy for structured credit exposures. These de-risking activities have significantly lowered the
sensitivity of P&L to movements in credit spreads.
Scope of structured credit activities
All KBC group banking and insurance entities that engage in structured credit activities (both legacy
and treasury activities) are covered in this disclosure.
Structured credit programmes for which KBC acts as originator
The structured credit transactions in which KBC entities have an originating role are summarised
under this heading. These structured credit operations can be broken down into the following
categories:
• structured credit whose underlying assets arise directly from KBC’s credit-granting activities.
• structured credit involving third-party assets with no sponsoring role for KBC.

Risk report 2013 • KBC Group • 86
Structured credit whose underlying assets arise directly from KBC’s credit-granting
activities
The main objective of such structured credit is to optimise the balance sheet and to provide
additional sources of bank funding. The following structured credit transactions fall under this
heading:
Structured credit transactions whose underlying assets arise directly from KBC’s credit-granting activities, 31-12-2013(in millions of EUR)
Programme Role Type of underlying exposure Nominal amount of the underlying
Home Loan Invest 2007 Originator Mortgage loans 2 927
Home Loan Invest 2008 Originator Mortgage loans 0
Home Loan Invest 2009 Originator Mortgage loans 3 119
Home Loan Invest 2011 Originator Mortgage loans 3 071
Phoenix 2 Funding 2008 Originator Mortgage loans 6 236
Phoenix 3 Funding 2008 Originator Mortgage loans 2 582
Phoenix 4 Funding 2009 Originator Mortgage loans 691
Phoenix 5 Funding 2012 Originator Mortgage loans 847
Home Loan Invest 2007
Home Loan Invest 2007 is a ‘Residential Mortgage-Backed Securities’ (RMBS) issue where KBC Bank
acts as the originator. An SPV acquired a pool of Belgian residential mortgages granted by KBC and
raised funds through the issuance of notes (Class A and Class B Notes, rated ‘AAA’ and ‘Aaa’ by
Fitch and Moody’s, respectively) and KBC’s subscription to a subordinated loan of 376 million euros.
The notes are eligible as collateral for the European Central Bank (ECB), and thus provide KBC Bank
with a liquidity buffer. The portfolio of mortgages is a revolving facility where the number of loans
and total amount can vary. In July 2012, the portfolio started to amortise and as such comprised 74
845 loans totalling 2 927 million euros, with notes outstanding 3 553 million euros at year-end
2013. Since KBC holds the first loss piece in the form of the subordinated loan and all notes, after
the successful tender of the outstanding notes in July 2012, the Basel II securitisation framework
does not apply to this structured credit programme, as an insufficient amount of the risk incurred
has been transferred. Assets are held as regular assets on the balance sheet of KBC Bank and
treated accordingly for capital adequacy calculation purposes.
Home Loan Invest 2008
Home Loan Invest 2008, which is similar to Home Loan Invest 2007, was set up as a revolving
transaction in November 2008. The Notes reached their first optional redemption date on 15
October 2013 and were called at that time. The amount outstanding is thus zero.
Home Loan Invest 2009
In April 2009, KBC Bank set up its third securitisation transaction. Home Loan Invest 2009
securitised a portfolio of 6 667 million euros’ worth of Belgian mortgage loans and set aside a
reserve of 60 million euros on account. In January 2011, this deal was restructured to allow the
addition of a Fitch rating. KBC Bank holds the subordinated loan of 727 million euros. The SPV
issued notes in the amount of 6 000 million euros. At issuance, approximately 350 million euros’

Risk report 2013 • KBC Group • 87
worth of notes was placed with external investors, while the rest was retained by KBC Bank. The
notes are eligible as collateral for the ECB and thus provide an added liquidity buffer for KBC Bank.
The Basel II securitisation framework does not apply, as here too an insufficient amount of the risk
incurred has been transferred. This issue amortises over the tenor of the transaction. At 31
December 2013, the outstanding notes amounted to 2 451 million euros (the notional amounts of
the underlying loans are shown in the table above). The subordinated loan amount remained
unchanged.
Home Loan Invest 2011
In October 2011, KBC Bank set up its fourth securitisation transaction. Home Loan Invest 2011
securitised a portfolio of 4 351 million euros’ worth of Belgian mortgage loans and set aside a
reserve of 50 million euros on account. The SPV issued notes in the amount of 3 500 million euros.
At issuance, approximately 175 million euros’ worth of notes was placed with external investors,
while the rest was retained by KBC Bank. The notes are eligible as collateral for the ECB and thus
provide an added liquidity buffer for KBC Bank. The Basel II securitisation framework does not apply,
as here too an insufficient amount of the risk incurred has been transferred. This issue amortises
over the tenor of the transaction. At 31 December 2013, the outstanding notes amounted to 2 531
million euros (the notional amounts are shown in the table above). The subordinated loan amount
remained unchanged.
Phoenix Funding 2
On 16 June 2008, a residential mortgage backed securitisation (RMBS) transaction called Phoenix
Funding 2 was set up as a source of contingent funding. The SPV has a remaining underlying pool
of residential mortgages originated by KBC Bank Ireland plc (a fully owned subsidiary of KBC Bank
NV), with corresponding note balances amounting to 6 236 million euros. KBC Bank Ireland has
retained all of the notes, which implies that the Basel II securitisation framework does not apply, as
an insufficient amount of the risk incurred has been transferred. The notes are divided into two
classes, i.e. 77.4% in class A (Moody’s ‘A3’ / Fitch ‘A+’ ratings / DBRS ‘A’ ratings) and 22.6% in class
B (these notes are not rated), maturing in 2050. The Class A notes are eligible for placement with
the ECB, thus providing KBC Bank Ireland plc with a liquidity buffer.
Phoenix Funding 3
Phoenix Funding 3, which is similar to Phoenix Funding 2, was set up in November 2008. The SPV
has a remaining underlying pool of residential mortgages originated by KBC Bank Ireland, with
corresponding note balances amounting to 2 582 million euros. KBC Bank Ireland plc has retained
all of the notes, which implies that the Basel II securitisation framework does not apply, as an
insufficient amount of the risk incurred has been transferred. The notes are split into two classes, i.e.
77.5% in class A (Moody’s ‘A3’ / Fitch ‘A+’ ratings) and 22.5% in class B (the class B notes are not
rated), maturing in 2050. The class A notes are eligible for placement with the ECB, thus providing
KBC Bank Ireland plc with a liquidity buffer.

Risk report 2013 • KBC Group • 88
Phoenix Funding 4
Phoenix Funding 4 was set up on 4 August 2009. The SPV has a remaining underlying pool of
residential mortgages originated by KBC Bank Ireland plc with corresponding note balances
amounting to 691 million euros. KBC Bank Ireland plc has retained all of the notes. The notes are
split into two classes, i.e. 82.1% in class A (Moody’s ‘A3’ / Fitch ‘A+’ ratings) and 17.9% in class B
(these notes are not rated), maturing in 2046. The class A notes of Phoenix Funding 4 are eligible
for placement with the ECB.
Phoenix Funding 5
Phoenix Funding 5 was set up on 6 June 2012. The SPV has a remaining underlying pool of
residential mortgages originated by KBC Bank Ireland plc with corresponding note balances
amounting to 847 million euros. KBC Bank Ireland plc has retained all of the notes. The assets are
split into three classes of A notes totalling 72% (Fitch ‘A+’ and DBRS A (h) ratings) and an unrated
class Z loan of 28%. The class A notes of Phoenix Funding 5 are eligible for placement with the ECB.
Structured credit involving third-party assets with no sponsoring role for KBC
Via its subsidiary KBC Financial Products, KBC acted as an originator when structuring CDO deals,
based on third party assets. The credit risk related to the underlying assets is transferred to investors.
The original notional underlying pools generally consist of corporate reference names (on average
85%) and ABS (on average 15%). The purpose of this business line was to generate fee income for
KBC as an originator of structured credit.
The CDOs structured by KBC Financial Products are managed CDOs, whereby the manager has the
option to conclude substitutions in the underlying asset portfolios of the CDOs. There were no such
substitutions in 2013.
The capital structure of a CDO deal comprises several tranches, each representing a certain credit
risk profile. These tranches are, in increasing order of seniority:
• the equity pieces, which are always held on the books of KBC and are fully provisioned as of
origination date;
• a number of classes of (credit-linked) notes which have obtained external ratings;
• the super senior portion of the CDO deal structure, which is partly protected with MBIA and partly
covered by the Guarantee Agreement (further information below).

Risk report 2013 • KBC Group • 89
KBC’s structured credit position (where KBC acts as investor)(figures exclude all expired, unwound or terminated CDO positions and after settled credit events)
Under this heading, information is provided on KBC group structured credit investments booked in
both the banking and trading portfolios and covering CDOs protected with MBIA, other CDOs, and
other ABS exposure (both legacy and treasury). Firstly, an overview is given of the overall exposure,
followed by an overview of the credit quality of the securities, an amortisation schedule and details
on the credit quality of the underlying assets of the securities. Lastly, the valuation principles,
accounting principles and stress tests are examined.
Overall net exposure
As from mid 2013, KBC presents the net exposure instead of original notional amounts of its
remaining investment in CDOs or other ABS. With regard to CDOs this means that all impact of
settled credit events and all fully de-risked (i.e. riskless) positions are excluded (in total an effect of
-3.1 billion euros). For other ABS exposure there was no effect.
Further on, over 2013 there was a significant reduction to the tune of -6.5 billion euros in KBC’s
CDO and ABS exposure mainly due to
• the de-risking of several CDOs in the first half of 2013 (a reduction of -6.1 billion euros)
• redemptions in the other legacy ABS portfolio to the tune of -0.5 billion euros
slightly offset by the investment (in the 4th quarter of 2013) in treasury ABS (two RMBS assets
totalling 45 million euros of net exposure).
In the first quarter of 2014, the net legacy CDO exposure decreased further by some 2 billion euros
thanks to the further collapsing of CDO exposure.
In this context, it should also be mentioned that only a few credit events occurred in the first half of
2013 for the names underlying the KBC Financial Products’ CDOs, while none occurred in the
second half of 2013. The credit events settled over 2013 (for less than 0.1 billion euros worth of
events have been settled) have had no impact on P&L because complete value markdowns for the
tranches affected had already been absorbed in the past.

Risk report 2013 • KBC Group • 90
KBC investments in structured credit products (CDOs and ABS)(in millions of EUR)
31-12-2013
Total net exposure 7 524
o/w legacy CDO exposure protected with MBIA 5 251
o/w other legacy CDO exposure 1 075
o/w legacy ABS exposure 1 153
o/w treasury ABS exposure 45
Cumulative value markdowns (mid-2007 to date)1 -355
Value markdowns -301
for other legacy CDO exposure -181
for other legacy ABS exposure -119
Credit Value Adjustment (CVA) on MBIA cover2 -54
Cumulative value markdowns for treasury ABS exposure 7 524
1 Value adjustments to KBC’s CDOs are accounted for via profit or loss instead of directly via shareholders’ equity, since the group’s CDOs are mostly of a synthetic nature
(meaning that the underlying assets are derivative products such as credit default swaps on corporate names). Their synthetic nature is also the reason why KBC’s CDOs
are not eligible for accounting reclassification under IFRS in order to neutralise their impact.
2 The provisioning rate for MBIA was reduced from 80% to 60% as of June 2013.
In 2013, there was a total reduction in net legacy CDO and ABS exposure of 7.3 billion euros, which
was due mainly to the de-risking of several CDOs and some redemptions in the other legacy ABS
portfolio (an impact of -0.5 billion euros). In the first quarter of 2014, the net legacy CDO exposure
was further reduced by some 2 billion euros thanks to the further collapsing of CDO exposures.
In KBC’s treasury portfolio 45 million euros was invested in two RMBS assets over (the fourth quarter
of) 2013.
CDO exposure protected with MBIA
As stated above, KBC bought credit protection from MBIA for a large part of the (super senior)
CDOs it originated.
Moreover, the remaining risk related to MBIA’s insurance coverage is to a large extent mitigated, as
it is included in the scope of the Guarantee Agreement that was agreed with the Belgian State on
14 May 2009. This agreement has a remaining nominal value of 5.9 billion euros, down from 20.0
billion euros at inception, 5.3 billion euros of which relates to the exposure insured with MBIA (after
the further collapsing of CDO exposures in early 2014, the figure of 5.9 billion euros was cut to 3.8
billion euros, 3.2 billion euros of which relates to the exposure insured with MBIA). It should be
noted that the provisioning rate of MBIA was reduced from 80% to 60% at the end of June 2013,
based on a fundamental internal analysis and was maintained at 60% at year-end 2013. The
remaining 0.7 billion euros of exposure covered by the agreement with the Belgian State relates to
part of the ‘Other legacy CDO exposure’. Of this portfolio (i.e. other legacy CDO exposure not
covered by credit protection with MBIA), the super senior assets have also been included in the
scope of the Guarantee Agreement with the Belgian State.

Risk report 2013 • KBC Group • 91
Details for CDO exposure protected with MBIA(in millions of EUR)
31-12-2013
Total insured amount (notional amount of super senior swaps)1 5 251
Details for MBIA insurance coverage
- Fair value of insurance coverage received (modelled replacement value, after taking the Guarantee Agreement into account)
91
- CVA for counterparty risk, MBIA -54
(as a % of fair value of insurance coverage received) 60%2
1 The amount insured with MBIA is included in the Guarantee Agreement with the Belgian State (14 May 2009).
2 The provisioning rate for MBIA was lowered from 80% to 60% in June 2013.
The super senior portions of CDOs originated by KBC Financial Products are mostly hedged via swap
contracts with MBIA, a US monoline insurer. The value of this insurance coverage is adjusted by a
Credit Value Adjustment intended to reflect the creditworthiness of MBIA, as shown in the table
above.
Moreover, the remaining risk related to MBIA’s insurance coverage is largely mitigated, as it is
included in the scope of the Guarantee Agreement (PPA) signed with the Belgian State.
KBC has not granted any straightforward credit facilities to MBIA, but is exposed to reinsurance
cover received for CDOs.
In addition, there is also indirect corporate credit exposure to credit insurers within the collateral
pool of the CDOs held, which is reflected in the overall valuation of the CDO exposure (fair value
approach, as described below).
Other KBC Group investment in structured credit products (year-end 2013)
This heading relates to the CDOs which KBC bought as investments and which are not insured by
credit protection from MBIA (or any other external credit insurer), as well as other ABS held by the
KBC group.
Please note that a portion of the risk attached to KBC group investments in CDOs is mitigated, due
to the fact that the super senior CDO tranches are fully covered by the Guarantee Agreement (PPA)
signed with the Belgian State.

Risk report 2013 • KBC Group • 92
Credit quality of securities held (year-end 2013)
An overview of the quality of the notes and super senior swaps held at year-end 2013 is shown in
the table below.
Credit quality of securities held – based on Moody’s ratings, 31-12-2013Net exposure (in millions of EUR)
Super Senior
(SS)
Aaa Aa A Baa <Baa3 Unrat-ed
Total
Legacy CDO exposure protected by MBIA 5 251 - - - - - - 5 251
Other legacy CDOs (FP CDOs)* - 2 21 138 479 287 87 1 015
Other legacy CDOs (non-FP CDOs) - - - 29 23 9 - 60
Other legacy ABS - 243 8 220 430 196 56 1 153
Other treasury ABS - 45 - - - - - 45
Total for 2013 5 251 290 29 387 932 492 143 7 524
* All Super Senior positions fall within the scope of the Guarantee Agreement signed with the Belgian State (see the ‘Additional information’ section of the 2013 Annual
Report of KBC Group NV (see www.kbc.com)).
Maturity schedule for CDOs issued by KBC Financial Products
The above graph shows how the CDOs originated by KBC Financial Products amortise over the next
number of years. It should be noted that KBC is continuing to look at reducing ABS and CDO
exposure and thus further de-risking would affect the maturity schedule. The first drop in the
maturity schedule is in April 2016. By October 2017, all CDOs issued by KBC Financial Products are
expected to have matured.
0
2.500
Jan-
09
Apr-0
9
Jul-0
9
Oct-0
9
Jan-
10
Apr-1
0
Jul-1
0
Oct-1
0
Jan-
11
Apr-1
1
Jul-1
1
Oct-1
1
Jan-
12
Apr-1
2
Jul-1
2
Oct-1
2
Jan-
13
Apr-1
3
Jul-1
3
Oct-1
3
Jan-
14
Apr-1
4
Jul-1
4
Oct-1
4
Jan-
15
Apr-1
5
Jul-1
5
Oct-1
5
Jan-
16
Apr-1
6
Jul-1
6
Oct-1
6
Jan-
17
Apr-1
7
Jul-1
7
Oct-1
7
5.000
7.500
10.000
12.500
15.000
17.500
20.000
22.500
25.000
27.500
Equity/Cash reserves All Notes issued KBC SSS MBIA SSS Original maturity schedule total notional
Not
iona
l(m
ln E
UR)

Risk report 2013 • KBC Group • 93
Overview of the underlying collateral of the securities held (31-12-2013)
The next few tables provide a breakdown of the underlying assets of the CDO reference portfolios
(both those insured and those not insured by MBIA) and the other ABS portfolio. They contain more
detailed information on KBC’s subprime exposure, on the quality of the underlying collateral and on
the breakdown of corporate reference names according to sector and region. The figures are net of
provisions for equity and junior CDO pieces. Settled credit events, prepayments and all fully de-
risked (riskless) positions are excluded.

Risk report 2013 • KBC Group • 94
Leg
acy
CD
O e
xpos
ure
pro
tect
ed b
y M
BIA
(‘Ful
l loo
k th
roug
h ap
proa
ch’ w
hich
mea
ns t
hat
the
subo
rdin
atio
n of
the
not
es h
eld
is n
ot t
aken
into
acc
ount
)Cr
edit
qua
lity
of s
ecur
itie
s he
ld –
bas
ed o
n M
oody
’s r
atin
gs 3
1-12
-201
3A
mou
nts
at n
omin
al v
alue
(in
mill
ions
of
EUR)
Aaa
Aa
ABa
aBa
BC
aa<C
aa3
Unr
ated
Tota
l
Corp
orat
es2
104
714
2 47
376
347
811
010
040
55
149
Sec
tor
Build
ings
& R
eal E
stat
e-
-64
538
138
5223
1822
857
Bank
ing
-58
191
254
6543
3-
6768
2
Insu
ranc
e-
3511
414
633
3827
--
393
Fina
nce
--
2211
294
--
2342
293
Min
ing,
Ste
el, I
ron
& N
onpr
ecio
us M
etal
s-
-49
133
7520
--
1329
0
Prin
ting
& P
ublis
hing
--
-34
9663
25-
2924
8
Reta
il St
ores
--
2110
628
5222
-11
240
Util
ities
-2
2717
710
--
14
221
Tele
com
mun
icat
ions
-1
7671
2027
3-
1921
7
Aut
omob
ile-
-23
108
3045
-4
521
4
Oil
& G
as2
510
156
27-
--
1121
1
Elec
tron
ics
--
1639
393
20
5015
0
Oth
er-
410
159
810
713
54
5313
11
134
Reg
ion
US
215
283
1 48
750
831
591
7276
2 84
9
EU-
3214
852
919
811
215
1014
61
190
Asia
-53
139
230
2619
419
146
636
Latin
Am
eric
a-
23
20-
--
-12
37
Oth
er2
141
208
3131
--
2543
8
CMBS
-1
0-
--
--
13
RMBS
--
-3
30
610
-22
Orig
inPr
ime
--
--
--
-1
-1
ALT
-A-
--
--
--
1-
1
ALT
-A (<
2005
vin
tage
)-
--
--
--
--
-
ALT
-A (2
005-
2008
vin
tage
)-
--
--
--
1-
1
Subp
rime
--
-3
30
69
-21
Sub
prim
e (<
2005
vin
tage
)-
--
--
-4
5-
9
Sub
prim
e (2
005-
2008
vin
tage
)-
--
33
02
4-
11
Reg
ion
US
--
-3
30
610
-22
Oth
er A
BS-
--
--
--
8-
8
CDO
85
36
12
12
4370
Tota
l10
109
717
2 48
176
848
011
712
044
95
251

Risk report 2013 • KBC Group • 95
Oth
er le
ga
cy C
DO
exp
osur
e
(‘Ful
l loo
k th
roug
h ap
proa
ch’ w
hich
mea
ns t
hat
the
subo
rdin
atio
n of
the
not
es h
eld
is n
ot t
aken
into
acc
ount
)Cr
edit
qua
lity
of u
nder
lyin
g co
llate
ral o
f CD
O h
eld
– ba
sed
on M
oody
’s r
atin
gs 3
1-12
-201
3(in
mill
ions
of
EUR)
Aaa
Aa
ABa
aBa
BC
aa<C
aa3
Unr
ated
Tota
l
Corp
orat
es0
2013
847
814
792
2119
7899
5
Sec
tor
Build
ings
& R
eal E
stat
e-
-12
104
2710
54
416
6
Bank
ing
-11
3749
138
1-
1313
2
Insu
ranc
e-
722
286
75
--
76
Fina
nce
--
422
18-
-5
857
Min
ing,
Ste
el, I
ron
& N
onpr
ecio
us M
etal
s-
-9
2614
4-
-3
56
Prin
ting
& P
ublis
hing
--
-7
1912
5-
648
Reta
il St
ores
--
420
510
4-
246
Util
ities
-0
534
2-
-0
143
Tele
com
mun
icat
ions
-0
1514
45
1-
442
Aut
omob
ile-
-4
216
9-
11
41
Oil
& G
as0
12
305
--
-2
41
Elec
tron
ics
--
38
81
00
1029
Oth
er-
120
116
2126
110
2521
9
Reg
ion
US
03
5528
798
6118
1415
550
EU-
629
102
3822
32
2823
0
Asia
-10
2744
54
14
2812
3
Latin
Am
eric
a-
04
--
--
-2
7
Oth
er-
027
406
6-
-5
85
CMBS
-0
--
--
--
00
RMBS
--
-0
10
12
-4
Orig
inPr
ime
--
--
--
-0
-0
ALT
-A-
--
--
--
0-
0
ALT
-A (<
2005
vin
tage
)-
--
--
--
--
-
ALT
-A (2
005-
2008
vin
tage
)-
--
--
--
0-
0
Subp
rime
--
-0
10
12
-4
Sub
prim
e (<
2005
vin
tage
)-
--
--
-1
1-
2
Sub
prim
e (2
005-
2008
vin
tage
)-
--
01
00
1-
2
Reg
ion
US
--
-0
10
12
-4
Oth
er A
BS-
--
--
--
2-
2
CDO
21
11
00
00
814
Tota
l2
2113
847
914
893
2323
871
015
Oth
er C
DO
exp
osur
e (n
on F
P CD
Os)
--
3823
--
--
-60

Risk report 2013 • KBC Group • 96
Oth
er A
BS e
xpos
ure
Oth
er A
BS e
xpos
ure
brok
en d
own
by t
ype
and
qual
ity,
bas
ed o
n M
oody
’s r
atin
gs 3
1-12
-201
3 am
ount
s at
nom
inal
val
ue (i
n m
illio
ns o
f EU
R)
Oth
er le
gacy
ABS
exp
osur
eA
aaA
aA
Baa
BaB
Caa
<Caa
3U
nrat
edTo
tal
CMBS
141
--
--
--
-15
RMBS
737
198
425
196
--
-56
955
Orig
inPr
ime
662
195
425
196
5694
0
Prim
e (<
2005
vin
tage
)-
222
5340
--
-56
118
Prim
e (2
005-
2008
vin
tage
)66
-17
237
215
6-
--
-82
2
ALT
-A-
-3
--
--
--
3
ALT
-A (<
2005
vin
tage
)-
-3
--
--
--
3
ALT
-A (2
005-
2008
vin
tage
)-
--
--
--
--
-
Subp
rime
75
--
--
--
-13
Sub
prim
e (<
2005
vin
tage
)7
5-
--
--
--
12
S
ubpr
ime
(200
5-20
08 v
inta
ge)
-0
--
--
--
-0
Reg
ion
Uni
ted
Stat
es7
53
5-
--
--
21
Spai
n-
-46
379
28-
--
4750
0
Port
ugal
--
-32
168
--
--
200
Italy
--
146
9-
--
-9
164
Net
herla
nds
56-
--
--
--
-56
U
nite
d Ki
ngdo
m10
--
--
--
--
10
Oth
er-
23
--
--
--
5
Bel
gium
-2
--
--
--
-2
Wes
tern
E
urop
e-
-3
--
--
--
3
Oth
er A
BS15
5-
225
--
--
-18
2
Typ
eC
LO14
9-
--
--
--
-14
9
Leas
es-
-7
5-
--
--
12
SME
loan
s-
-15
--
--
--
15
Con
sum
er lo
ans
7-
--
--
--
-7
Aut
o lo
ans/
leas
es-
--
--
--
--
-
O
ther
--
--
--
--
--
Tota
l24
38
220
430
196
--
-56
1 15
3
Oth
er t
reas
ury
ABS
ex
posu
re
45-
--
--
--
-45
Reg
ion
Net
herla
nds
45-
--
--
--
-45
Typ
e RM
BS P
rime
(v
inta
ge 2
013)
45-
--
--
--
-45

Risk report 2013 • KBC Group • 97
Valuation and accounting principles
Multiple valuation techniques are used to determine the market value of the CDO/ABS portfolio.
For CDOs, KBC applies a level-3 valuation technique. The Gaussian Copula model models the
distribution of default times of the underlying corporate and ABS names in the reference portfolios
of the CDO transactions. The asset default trigger in the model is derived from the credit default
swap spreads in the market. The correlation between the default times is modelled through
Gaussian Copulas4 and can as such be simulated. By discounting the cashflows resulting from the
default time curves on the underlying assets, a value for a specific CDO tranche is determined. The
model also ensures that the inner tranches are valued in line with the market, through the
calibration with CDX and iTraxx credit spread indices. Please refer to Note 26 in the 2013 Annual
Report of KBC Group NV for more information on the methodology we use to value CDOs.
It should be noted that value adjustments to KBC’s CDOs are accounted for via profit and loss
(instead of directly via shareholders’ equity), since the group’s CDOs are mostly of a synthetic nature
(meaning that the underlying assets are derivative products such as credit default swaps on
corporate names). Their synthetic nature is also the reason why KBC’s CDOs are not eligible for
accounting reclassification under IFRS in order to neutralise their impact.
Securitisation activities are accounted for under IFRS according to the guidelines provided by ‘IAS 39
Financial Instruments: Recognition and Measurement’ and ‘SIC 12 Consolidation – Special Purpose
Entities’.
The derecognition rules of IAS 39 determine when the securitised assets may be derecognised from
the balance sheet. This is the case when the contractual rights to receive the cashflows of the
financial asset are transferred or retained but ‘passed through’ and substantially all the risk and
rewards of ownership of the asset are transferred.
In many cases, structured entities (the new name for Special Purpose Entities) are set-up for
securitisation activities. IFRS 10 determines that a company should consolidate such an entity if it
has:
(i) power over the structured entity;
(ii) exposure, or rights, to variable returns from its involvement with the structured entity;
(iii) the ability to use its power over the structured entity to affect the amount of its return.
4 A Gaussian Copula is a dependency structure, which in this case indicates how default events are inter-related.

Risk report 2013 • KBC Group • 98
Stress-test results for KBC group investments in structured credits (31-12-2013)
Two sorts of stress tests have been conducted on the portfolio of investments in CDOs originated by
KBC Financial Products, namely (i) stress tests with an effect on credit defaults, i.e. fundamental
(stressed) value and (ii) stress tests with an impact on P&L, i.e. a P&L sensitivity stress test. The first
type of test determines the (credit) loss in the case of defaults and losses in the assets underlying the
CDOs. The second type shows the (market) loss when the main parameters in the valuation of the
CDOs originated by KBC Financial Products are stressed.
(i) Stress tests with an effect on credit default
Since mid-2008, KBC has used the concept of ‘fundamental value’ for the CDOs issued by KBC
Financial Products. This aims to estimate how (expected) credit events – when claimed, verified and
settled – would affect the principal amounts of the CDO tranches, according to the waterfall
structure (reversed seniority). It serves as a reasonable prediction of the redemption value of the
CDOs originated by KBC Financial Products at or around the respective expected maturity dates. The
calculation of the fundamental value (referred to as the fundamental value scenario in the table
below) is based on a 5.6% loss in the underlying corporate portfolio (which also includes credit
events actually claimed and expected cumulative losses; the realised percentage loss stands at 2.7%)
and on a 85.9% loss in ABS (the realised percentage loss stands at 84.6%). This fundamental value
analysis is performed on a quarterly basis (or more frequently if required by market conditions).
In addition, a further stressed fundamental analysis was performed under the following test
assumptions:
• Stress scenario 1: ABS credit events actually claimed and expected losses on ABS amounting to a
loss of 88.1%, and a 5.7% loss in the underlying corporate portfolio (which also includes credit
events actually claimed and expected cumulative losses).
• Stress scenario 2: ABS credit events actually claimed and expected losses on ABS amounting to a
loss of 88.9%, and a 6.5% loss in the underlying corporate portfolio (which also includes credit
events actually claimed and expected cumulative losses).
The results of these scenarios are summarised in the table1
Stress test results for credit default1
In millions of EUR – 31-12-2013
Notional Estimated loss MtM-loss2
Fundamental value scenario CDO protected with MBIA
5 251 - 87
Other retained positions
1 015 152 156
Stress scenario 1 CDO protected with MBIA
5 251 - 87
Other retained positions
1 015 165 156
Stress scenario 2 CDO protected with MBIA
5 251 - 87
Other retained positions
1 015 196 156
1 Account taken of the Guarantee Agreement with the Belgian State.
2 According to Gaussian Mixture Model minus uncertainties.

Risk report 2013 • KBC Group • 99
(ii) Stress tests with an effect on P&L
KBC has calculated the impact of two stress test scenarios in terms of changes in credit spreads (an
increase or decrease by 10%, 20% and 50%, respectively) on the portfolio of CDOs originated by
KBC Financial Products (net exposure in scope of 6.3 billion euros). As can be seen from the table
below, the de-risking activities undertaken during 2012 have significantly reduced the sensitivity of
P&L to movements in credit spreads.
The calculations take into account the impact of the Guarantee Agreement (PPA) signed with the
Belgian State, which reduces the volatility of the super senior positions in scope on P&L. The
provisioning rate of 60% for MBIA has also been taken into account. It should be noted that KBC
decided to decrease the provisioning rate from 80% to 60% end June 2013 based on a
fundamental internal analysis.
Stress test results for the market sensitivity of CDOsIn millions of EUR – 31-12-2013 (pre-tax)
Market valuation sensitivity Stress test result
Test assumptions
Credit spreads in December x 1.10 -19
Credit spreads in December x 1.20 -37
Credit spreads in December x 1.50 -92
Test assumptions
Credit spreads in December x 0.90 19
Credit spreads in December x 0.80 38
Credit spreads in December x 0.50 92
Further de-risking in early 2014 has reduced the sensitivity of P&L even more. Measured as the
impact of a 50% increase in credit spreads, it decreased to 67 million euros after the collapsing of
CDO exposures.
Structured credit exposure – capital charges under the CRD III (re)securitisation framework
Regulatory capital requirements for structured credit positions are held against credit and market
risks related to such products and positions. Market risk (trading) regulatory capital requirements are
determined through the new CRD III requirements. Under Basel II, there are different approaches
available to determine the required capital for credit risk. The treatment used for the different
structured credit programmes is described throughout this report. The investment positions are dealt
with under the Rating-Based Approach (RBA).
As regards the investments in structured credit products (i.e. this section of the report), the risk
weightings applied for regulatory capital calculations are linked directly to the rating of the
structured credit products invested in. A further distinction is made depending on their classification
as securitisation or re-securitisation (see CRD III, implemented at year-end 2011) and whether they
are senior or non-senior positions. Since these risk weightings rise sharply when ratings fall,

Risk report 2013 • KBC Group • 100
downgrades of the structured credit invested in have a serious impact on the capital charge. The
exposure amount to which the risk weights are applied, depends on the IFRS classification.
Regulatory capital only has to be held by banking entities. Insurance entities are not required to hold
this capital, but this situation will change when the Solvency II regulations are implemented. The
following table refers to the regulatory capital charges for the ABS and retained CDO exposure held
by the KBC group under the CRD III (re)securitisation framework.
Please note that the 59 million euros relating to the re-securitisation capital requirement referred to
in the ‘Market risk’ section is also included in the following table.

Risk report 2013 • KBC Group • 101
Structured credit products – details of capital charges under the CRD III (re)securitisation framework, 31-12-2013(in millions of EUR)
Securiti-sation
Re-secu-ritisation
Net exposure
Total EAD for CRD III
Of which6 – 18%
Of which20 – 35%
Of which50 –
100%
Of which250 – 850%
Of which1250%
RWA31-12-
2013
Banking entities
Trading book - 5 256 5 256 3 - - - - 3 641
CDO exposure - 5 256 5 256 3 - - - - 3 641
of which senior positions
- 5 251 5 251 - - - - - - -
of which non-senior posi-tions1
- 5 5 3 - - - - 3 641
Banking book 1 242 329 1 571 1 571 657 241 272 71 329 3 331
CDO exposure 60 329 389 389 29 52 9 - 329 2 787
of which senior positions
60 - 60 60 29 52 9 - - 18
of which non-senior positions
- 329 329 329 - - - - 329 2 770
Other legacy ABS exposure
1 137 - 1 137 1 137 583 189 264 71 - 541
of which senior positions
1 107 - 1 107 1 107 583 189 264 71 - 530
of which non-senior positions
30 - 30 30 - 30 - - - 10
Other treasury ABS positions
45 - 45 45 45 - - - - 3
of which senior positions
45 - 45 45 45 - - - - 3
Total for bank-ing entities
1 242 5 585 6 827 1 575 657 241 272 71 332 3 972
Insurance entities - 681 697 - - - - - - 3
CDO exposure - 681 681 - - - - - - 3 972
Other ABS exposure
16 - 16 - - - - - - -
Total for insur-ance entities
16 681 697 - - - - - - -
Total net ex-posure for KBC Group
1 258 6 266 7 524 - - - - - - -
Client credit facility2
N/A N/A 337 N/A N/A N/A N/A N/A N/A 32
ABS protection at KBC Financial Products3
27 8 35 35 - - - - 35 51
Total capital charge
4 056
1 Including the capital charge for the de-risked deals as the structures themselves still attract capital as long as they have not been fully terminated.
2 For historical reasons, this credit facility, (with receivables as collateral), is provided to a single client in the form of commercial paper, all of which is held by KBC Group. It is therefore subject to the Supervisory
Formula Approach for the purpose of capital adequacy calculations and is included in this table for the sake of completeness.
3 This protection is retained at KBC Financial Products to facilitate the de-risking process, but does attract Regulatory Capital.

Risk report 2013 • KBC Group • 102
Market Risk Management (non-trading)

Risk report 2013 • KBC Group • 103
The process of managing structural exposure to market risks (including interest rate risk, equity risk,
real estate risk, foreign exchange risk and inflation risk) is also known as Asset/Liability Management
(ALM).
‘Structural exposure’ encompasses all exposure inherent in our commercial activity or in our long-
term positions (banking and insurance). Trading activities are consequently not included. Structural
exposure can also be described as a combination of:
• mismatches in the banking activities linked to the branch network’s acquisition of working funds
and the use of those funds (via lending, among other things);
• mismatches in the insurance activities between liabilities in the non-life and life businesses and the
cover for these liabilities present in the investment portfolios held for this purpose;
• the risks associated with holding an investment portfolio for the purpose of reinvesting
shareholders’ equity;
• the structural currency exposure stemming from the activities abroad (investments in foreign
currency, results posted at branches or subsidiaries abroad, exchange risk linked to the currency
mismatch between the insurer’s liabilities and its investments).
Strategy and processes
The main building blocks of KBC’s ALM Risk Management Framework are:
• A focus on ‘economic value’ as the cornerstone of ALM policy, with attention also being paid to
criteria such as income, solvency and liquidity.
• The use of a uniform ALM methodology for banking and insurance activities across the group,
based on ‘fair value models’ that forecast the value of a product group under different market
scenarios and that are translated into replicating portfolios (combinations of market instruments
that allow the relevant product groups to be hedged with the lowest risk).
• The use of a Value-at-Risk (VaR) measurement method for the various categories of risk
throughout the group for risk budgeting and limit-setting purposes. This VaR measures the
maximum loss that might be sustained over a one-year time horizon with a certain confidence
level, as a result of movements in interest rates and other fluctuations in market risk factors.
• The definition of an ALM VaR limit at group level and the breakdown of this limit into various
types of risk and entities.
• The use of VaR, which is calculated using fair value models for non-maturing products, taking into
account different embedded options and guarantees in the portfolio.
• The use of other risk measurement methods, such as Basis-Point-Value (BPV), notional amounts,
etc., to supplement VaR.

Risk report 2013 • KBC Group • 104
KBC group non-trading market risk (VaR 99.93%, 1-year time horizon)(in billions of EUR)*
31-12-2012 31-12-2013
Total 3.81 3.83
* Excluding a number of small group companies. Cyclical prepayment options embedded in mortgage loans have not been captured. Excluding entities classified as
‘disposal groups’ under IFRS 5. In 2013, the impact of these entities (see ‘Remark’ at the start of this report) on the group’s ALM VaR was 6.3 million euros. In 2012, the
impact of the relevant entities (see ‘Remark’ at the start of this report) on the group’s ALM VaR was 11.2 million euros. KBC Pension Fund has been excluded (its impact
on the group’s ALM VaR was 278 million euros in 2013 and 193 million euros in 2012). The VaR at year-end 2012 was restated from 1.06 billion euros to 1.34 billion
euros after the 99% confidence interval was brought into line with the 99.93% used in internal economic capital modelling, and from 1.34 billion euros to 3.81 billion
euros after including credit spread risk in VaR. VaR is measured using the VaR-CoVaR approach.
Scope of non-trading market risk disclosures
The ALM framework is applicable to all material KBC group entities that are subject to non-trading
market risks. In practice, this means all entities of the KBC group with the exception of entities that
only conduct trading activities. In banking entities with both trading and other activities, the balance
sheet is split into a trading book and a banking book, with ALM only dealing with the risks incurred
in the banking book.
Equity risk and interest rate risk account for the lion’s share of the total risk and will thus be
discussed in more detail. However, credit spread risk, real estate risk, inflation risk and foreign
exchange risk are also briefly addressed below.
Interest rate risk
Interest rate risk for the banking activities
We use two main techniques to measure interest rate risks: 10 BPV and VaR (see above). The 10 BPV
measures the extent to which the value of the portfolio would change if interest rates were to go up
by ten basis points across the entire curve (negative figures indicate a decrease in the value of the
portfolio). We set 10 BPV limits in such a way that interest rate positions combined with the other
structural exposures (equity, real estate, etc.) remain within the overall VaR limits. We also use other
techniques such as gap analysis, the duration approach, scenario analysis and stress testing (both
from an economic value perspective and from an income perspective).
In addition, we report the group-wide IFRS sensitivity to interest rate movements on a regular basis,
including both the banking and insurance activities.
We manage the ALM interest rate positions of the banking entities via a system of market-oriented
internal pricing for products with a fixed maturity date, and via a replicating portfolio technique
– reviewed on a dynamic basis – for products without a fixed maturity date (e.g., current and
savings accounts).

Risk report 2013 • KBC Group • 105
The bank takes interest rate positions mainly through government bonds, with a view to acquiring
interest income, both in a bond portfolio used for reinvesting equity and in a bond portfolio
financed with short-term funds. The table shows the bank’s exposure to interest rate risk in terms of
10 BPV.
BPV of the ALM book, banking activities*(in millions of EUR)
31-12-2012 31-12-2013
Average for 1Q -52 -33
Average for 2Q -49 -27
Average for 3Q -49 -21
Average for 4Q -47 -22
As at 31 December -39 -22
Maximum in year -57 -40
Minimum in year -39 -21
* Excluding entities classified ‘as disposal groups’ under IFRS 5 (see ‘Remark’ at the start of this report). Including these entities would lead to an overall BPV
for the banking activities of -22 million euros at year-end 2013 and -44 million euros at year-end 2012.
In line with the Basel II guidelines, we conduct a 200-basis-point stress test at regular intervals. It
sets off the total interest rate risk in the banking book (given a 2% parallel shift in interest rates)
against total capital and reserves. For the banking book at KBC group level, this risk came to 11.7%
of total capital and reserves at year-end 2013. This is well below the 20% threshold (where a bank
is considered an ‘outlier bank’ and which can lead to a higher regulatory capital charge).
The following table shows the interest sensitivity gap of the ALM banking book. In order to
determine the sensitivity gap, we break down the carrying value of assets (positive amount) and
liabilities (negative amount) according to either the contractual repricing date or the maturity date,
whichever is earlier, in order to obtain the length of time for which interest rates are fixed. We
include derivative financial instruments, mainly to reduce exposure to interest rate movements, on
the basis of their notional amount and repricing date.
Interest sensitivity gap of the ALM book (including derivatives), banking activities*(in millions of EUR)
≤ 1 month 1–3 months
3–12 months
1–5 years 5–10 years > 10 years Non- interest- bearing
instruments
Total
31-12-2012 3 731 3 904 -1 251 -7 095 4 450 2 039 -5 778 0
31-12-2013 13 665 323 -1 653 -3 146 6 730 788 -16 706 0
* Excluding a number of small group companies. Entities classified as ‘disposal groups’ under IFRS 5 have also been excluded (figures for these entities are given below).
Non-maturity contracts were isolated in the ‘non-interest bearing’ category in 2013, whereas they had been included in the ‘≤ 1 month’ bucket in 2012.
31-12-2012 633 -74 -220 128 258 258 -981 0
31-12-2013 182 -88 46 41 14 0 -196 0
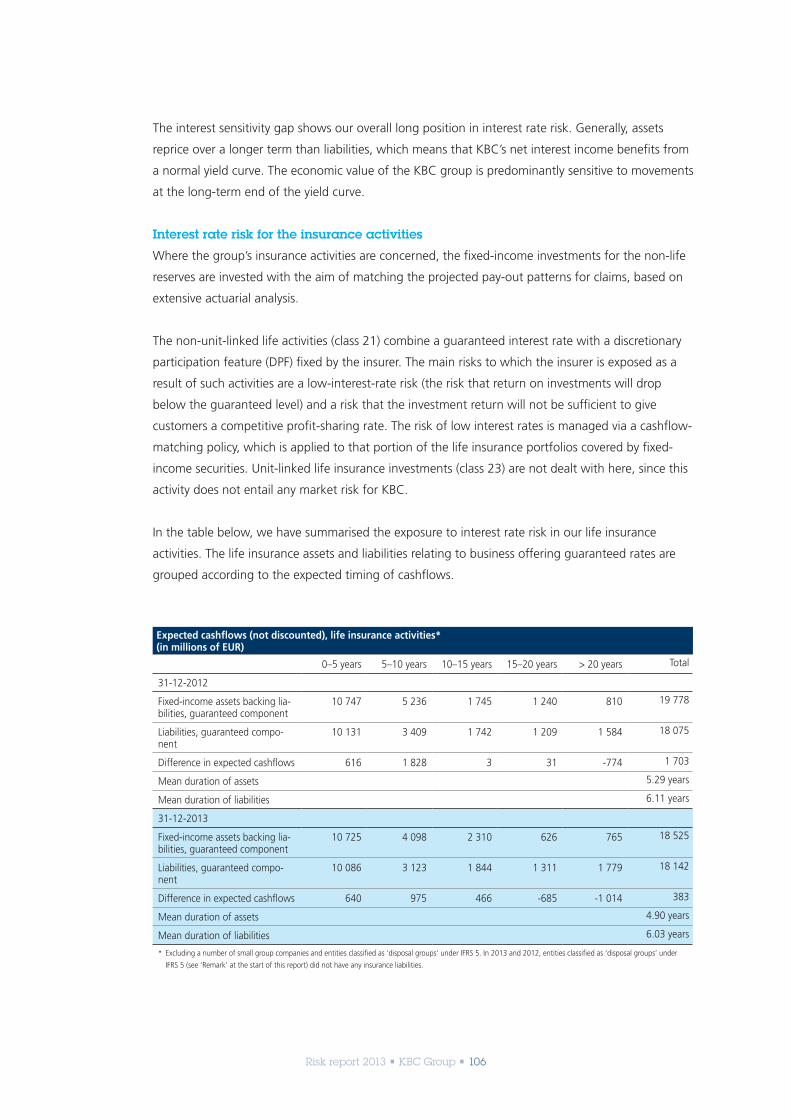
Risk report 2013 • KBC Group • 106
The interest sensitivity gap shows our overall long position in interest rate risk. Generally, assets
reprice over a longer term than liabilities, which means that KBC’s net interest income benefits from
a normal yield curve. The economic value of the KBC group is predominantly sensitive to movements
at the long-term end of the yield curve.
Interest rate risk for the insurance activities
Where the group’s insurance activities are concerned, the fixed-income investments for the non-life
reserves are invested with the aim of matching the projected pay-out patterns for claims, based on
extensive actuarial analysis.
The non-unit-linked life activities (class 21) combine a guaranteed interest rate with a discretionary
participation feature (DPF) fixed by the insurer. The main risks to which the insurer is exposed as a
result of such activities are a low-interest-rate risk (the risk that return on investments will drop
below the guaranteed level) and a risk that the investment return will not be sufficient to give
customers a competitive profit-sharing rate. The risk of low interest rates is managed via a cashflow-
matching policy, which is applied to that portion of the life insurance portfolios covered by fixed-
income securities. Unit-linked life insurance investments (class 23) are not dealt with here, since this
activity does not entail any market risk for KBC.
In the table below, we have summarised the exposure to interest rate risk in our life insurance
activities. The life insurance assets and liabilities relating to business offering guaranteed rates are
grouped according to the expected timing of cashflows.
Expected cashflows (not discounted), life insurance activities*(in millions of EUR)
0–5 years 5–10 years 10–15 years 15–20 years > 20 years Total
31-12-2012
Fixed-income assets backing lia-bilities, guaranteed component
10 747 5 236 1 745 1 240 810 19 778
Liabilities, guaranteed compo-nent
10 131 3 409 1 742 1 209 1 584 18 075
Difference in expected cashflows 616 1 828 3 31 -774 1 703
Mean duration of assets 5.29 years
Mean duration of liabilities 6.11 years
31-12-2013
Fixed-income assets backing lia-bilities, guaranteed component
10 725 4 098 2 310 626 765 18 525
Liabilities, guaranteed compo-nent
10 086 3 123 1 844 1 311 1 779 18 142
Difference in expected cashflows 640 975 466 -685 -1 014 383
Mean duration of assets 4.90 years
Mean duration of liabilities 6.03 years
* Excluding a number of small group companies and entities classified as ‘disposal groups’ under IFRS 5. In 2013 and 2012, entities classified as ‘disposal groups’ under
IFRS 5 (see ‘Remark’ at the start of this report) did not have any insurance liabilities.

Risk report 2013 • KBC Group • 107
The main interest rate risk for the insurer is a downside one. We adopt a liability driven ALM
approach focused on mitigating the interest rate risk in accordance with KBC’s risk appetite. For the
remaining interest rate risk, we adhere to a policy that takes into account the possible negative
consequences of a sustained decline in interest rates, and have built up adequate supplementary
reserves.
Breakdown of the reserves for non-unit-linked life insurance by guaranteed inte-rest rate, insurance activities1
31-12-2012 31-12-2013
5.00% and higher2 3% 3%
More than 4.25% up to and including 4.99% 10% 10%
More than 3.50% up to and including 4.25% 5% 4%
More than 3.00% up to and including 3.50% 30% 27%
More than 2.50% up to and including 3.00% 24% 22%
2.50% and lower 27% 32%
0.00% 2% 2%
Total 100% 100%
1 Excluding a number of small group companies and entities classified as ‘disposal groups’ under IFRS 5. In 2013 and 2012, entities classified as ‘disposal groups’ under
IFRS 5 (see ‘Remark’ at the start of this report) did not have any nominal exposure.
2 Contracts in Central and Eastern Europe.
Aggregate interest rate risk for the KBC group
The figures below show the impact on the KBC group of a 10-basis-point parallel upward shift of
yield curves, broken down by currency. Interest Rate Risk - BPV in thousands of EUR – 31-12-20121
Overall EUR CHF USD GBP CZK HUF PLN Other
Banking activities -39 272 -28 396 -171 181 63 -9 520 -1 676 142 103
Insurance activities 8 174 8 243 21 -26 0 411 -201 4 -279
Total2 -22 145 -11 157 -150 151 63 -9 109 -1 876 135 -203
Interest Rate Risk - BPV in thousands of EUR – 31-12-20131
Overall EUR CHF USD GBP CZK HUF PLN Other
Banking activities -21 631 -20 054 -59 2 514 53 -2 433 -1 541 3 -116
Insurance activities 10 481 10 060 -15 -13 0 877 -127 1 -301
Total2 -11 150 -9 994 -74 2 502 53 -1 556 -1 668 5 -418
1 The entities classified as ‘disposal group’ under IFRS 5 had a total BPV of -5 million euros at year-end 2012 and -0,3 mln EUR at year-end 2013.
2 KBC Pension Fund excluded in 2013. The BPV of KBC Pension Fund at year-end 2013 was 21.8 million euros.
The group-wide sensitivity of IFRS-based net profit to interest rate movements is reported on a
regular basis and at the same time for both the banking and the insurance activities. The table
illustrates the impact on net profit of a 1% increase and a 1% decrease in the yield curve, given the
positions at the reporting date.

Risk report 2013 • KBC Group • 108
Impact on net profit (IFRS) of an increase/decrease in the yield curve for the KBC group1
(in millions of EUR)
Increase by 1%2 Decrease by 1%2
31-12-2012 31-12-2013 31-12-2012 31-12-2013
Banking activities -44 87 55 50
Insurance activities 10 24 -12 -28
Total -34 110 43 22
1 Excluding entities classified as ‘disposal groups’ under IFRS 5 (see ‘Remark’ at the start of this report). In 2013, a 100-basis-point increase in the yield curve would have
had an impact of 0,.05 million euros on net profit and an impact of -2.2 million euros on the market value of these entities. In 2012, the corresponding figures would
have been 0.7 million euros and -51 million euros, respectively.
2 Full market value, regardless of accounting classification or impairment rules. Excluding KBC Pension Fund (impact of 7 million euros on net profit and 12 million euros
on value in 2013).
Credit spread risk
We manage the credit spread risk for the sovereign portfolio by monitoring the extent to which the
value of the sovereign bonds would change if credit spreads were to go up by 100 basis points
across the entire curve. The economic sensitivity of the main sovereign positions to changes in
spreads is dealt with in the ‘Credit risk’ section.

Risk report 2013 • KBC Group • 109
Equity risk
The main exposure to equity is within our insurance business, where the ALM strategies are based
on a risk-return evaluation, account taken of the market risk attached to open equity positions.
Please note that a large part of the equity portfolio is held for the DPF of insurance liabilities
(especially profit-sharing in the Belgian market). Apart from the insurance entities, smaller equity
portfolios are also held by other group entities, e.g., KBC Bank and KBC Asset Management. We
have provided more information on total non-trading equity exposures at KBC in the tables below.
Equity portfolio of the KBC group1, 2
(breakdown by sector, in %)Banking activities Insurance activities Group
31-12-2012 31-12-2013 31-12-2012 31-12-2013 31-12-2012 31-12-2013
Financial 23% 60% 26% 20% 25% 25%
Consumer non-cyclical 11% 1% 12% 10% 12% 8%
Communication 0% 0% 1% 0% 1% 0%
Energy 3% 0% 7% 7% 6% 6%
Industrial 21% 27% 9% 38% 12% 37%
Utilities 2% 0% 3% 3% 3% 3%
Consumer cyclical 4% 1% 4% 15% 4% 13%
Basic materials 3% 0% 11% 5% 9% 4%
Other and not specified 33% 12% 27% 3% 28% 4%
Total 100% 100% 100% 100% 100% 100%2
In billions of EUR 0.2 0.2 0.5 1.3 0.7 1.4
of which unlisted 0.1 0.0 0.1 0.0 0.2 0.0
1 Excluding a number of small group companies and entities classified as ‘disposal groups’ under IFRS 5. In 2013 and 2012, entities classified as ‘disposal groups’ (see
‘Remark’ at the start of this report) did not have an equity portfolio. The equity portfolio of KBC Pension Fund is not included (0.7 billion euros at year-end 2013 and 0.7
billion euros at year-end 2012).
2 The main differences between the 1.4 billion euros in this table and the 1.9 billion euros for ‘Equity instruments‘ in the table appearing in Note 18 of the ‘Consolidated
financial statements’ section of the 2013 Annual Report for KBC Group NV – besides a number of minor differences in the scope of consolidation – are that:
(a) Shares in the trading book (0.3 billion euros) are excluded above, but are included in the table in Note 18.
(b) Real estate participations that are not consolidated are classified as’ investments in building’ in this table, but classified as ‘shares’ in the table in Note 18 (as they are
not consolidated).
(c) Most ‘investments in funds’ are treated on a ‘look-through’ basis (according to the underlying asset mix of the fund and therefore also partially classified as ‘fixed-in-
come instruments’), whereas they are classified as ‘shares’ in the table in Note 18.
The table below provides an overview of the sensitivity of income and economic value to
fluctuations in the equity markets.
Impact of a 12.5% drop in equity prices*
(in millions of EUR)Impact on net profit (IFRS) Impact on value
31-12-2012 31-12-2013 31-12-2012 31-12-2013
Banking activities -12 -11 -22 -21
Insurance activities -4 -1 -54 -158
Total -17 -12 -74 -179
* Excluding entities classified as ‘disposal groups’ under IFRS 5 (see ‘Remark’ at the start of this report). At year-end 2013 and 2012, the entities classified as ‘disposal
groups’ under IFRS 5 (see ‘Remark’ at the start of this report) did not have any equity exposure. Excluding the equity portfolio of KBC Pension Fund (year-end 2013:
impact of -1.8 million euros on net profit and -92 million euros on value). Equity positions were increased at KBC Insurance, leading to a heightened economic sensitivity
to equity shocks.

Risk report 2013 • KBC Group • 110
The table provides an overview of the realised and unrealised gains on the equity portfolio.
Non-trading equity exposure1
(in millions of EUR)Net realised gains
(in income statement)Net unrealised gains
on year-end exposure (in equity)
31-12-2012 31-12-2013 31-12-2012 31-12-2013
Banking activities 11 80 47 73
Insurance activities 143 44 160 252
Total2 156 126 215 335
1 Excluding a number of small group companies and entities classified as ‘disposal groups’ under IFRS 5. In 2013 and 2012, the entities with this classification (see
‘Remark’ at the start of this report) did not have any equity exposure.
2 The total figure includes gains from some equity positions directly attributable to the KBC group. Gains from joint participations involving the banking and insurance
entities of the KBC group have been eliminated, since these participations are consolidated at group level.
Real estate risk
The groups’ real estate businesses hold a limited real estate investment portfolio with a view to
realising capital gains over the long term. KBC Insurance also holds a diversified real estate portfolio,
which is held as an investment for non-life reserves and long-term life activities. The real estate
exposure is viewed as a long-term hedge against inflation risks and as a way of optimising the risk/
return profile of these portfolios. The table provides an overview of the sensitivity of economic value
to fluctuations in the property markets.
Impact of a 12.5% drop in real estate prices*(in millions of EUR) Impact on value
31-12-2012 31-12-2013
Bank portfolios -66 -59
Insurance portfolios -37 -40
Total -102 -99
* Excluding a number of small group companies. Entities classified as ‘disposal groups’ under IFRS 5 have also been excluded (see ‘Remark’ at the start of this report); they
had no impact in 2013 and 2012. Excluding the real estate portfolio of KBC Pension Fund (an impact of -18 million euros on value at year-end 2013 and -17 million
euros at year-end 2012).
Inflation risk
KBC’s exposure to inflation is primarily secondary in nature, i.e. via changes in interest rates. We
monitor and hedge this risk in line with the policy for managing interest rate risk (see above). The
direct exposure of KBC to the inflation risk is limited and mainly arises from contractual payments
that are linked to wage inflation, e.g., in the non-life insurance business in Central Europe and in
the pension fund for own employees. This direct inflation risk is monitored using the ALM VaR
technique (see above), with a limit being set on the total exposure to ‘other risks’ for the KBC
group.

Risk report 2013 • KBC Group • 111
Foreign exchange risk
We pursue a prudent policy as regards our structural currency exposure, essentially seeking to avoid
currency risk. Foreign exchange exposures in the ALM books of banking entities with a trading book
are transferred to the trading book where they are managed within the allocated trading limits. The
foreign exchange exposure of banking entities without a trading book, of the insurance entities and
of other entities has to be hedged, if material. Equity holdings in non-euro currencies that are part
of the investment portfolio do not need to be hedged. Participating interests in foreign currency are
in principle funded by borrowing an amount in the relevant currency equal to the value of the net
assets excluding goodwill.

Risk report 2013 • KBC Group • 112
Market Risk Management
(trading)

Risk report 2013 • KBC Group • 113
Market risk is defined as the potential negative deviation from the expected value of a financial
instrument (or portfolio of such instruments) due to changes in the level or in the volatility of market
prices, e.g., interest rates, exchange rates and equity or commodity prices. Market risk also covers
the risk of price fluctuations in negotiable securities as a result of credit risk, country risk and
liquidity risk. This section focuses on the trading positions. The interest rate, foreign exchange and
equity risks of the non-trading positions in the banking book and of the insurer’s positions are all
included in ALM exposure.
Strategy and processes
The objective of market risk management (trading) is to measure, report and advise on the market
risk of the aggregate trading position at group level, taking into account the main risk factors and
specific risk in order to ensure that activities are consistent with the Group Risk Appetite. The Group
Risk Appetite, including the strategic objectives with regard to (trading) market risk tolerance, is
determined by the Board of Directors by means of an annual review. For the 2013 reporting period,
the Group Markets Committee (GMC) decide upon and periodically reviews a framework of limits
and policies on trading activities that is consistent with this Group Risk Appetite. This framework is
submitted to the Board of Directors for approval.
This risk framework consists of a hierarchy of limits. Whereas HVaR calculations serve as a primary
risk measurement tool, risk concentrations are monitored via a series of secondary limits including
equity concentration limits, FX concentration limits and basis-point-value limits for interest rate risk
and basis risk. The specific risk associated with a particular issuer or country is also subject to
concentration limits. Scenario analysis limits have also been set up, involving multiple shifts of
underlying risk factors. In addition, secondary limits are in place to monitor the risks inherent in
options (the so-called ‘greeks’). Complex and/or illiquid instruments, which cannot be modelled in
an HVaR context, are subject to nominal and/or scenario limits.
The centralisation of trading risk management implies close co-operation between all value and risk
management units at both group and local level. This close co-operation allows consistent reporting
to group senior management through the GMC, which is chaired by the Group CRO and includes
senior representatives from line management, risk management and other top management. It
manages market risk and addresses the operational and counterparty risks of the dealing rooms. It
keeps track of structural trends, monitors group-wide and local risk limits and may decide to impose
corrective actions. The GMC meets formally every four weeks in order to enable the KBC group to
take decisions regarding trading risk on the basis of accurate and up-to-date information.

Risk report 2013 • KBC Group • 114
Scope of market risk management
KBC is exposed to market risk via the trading books of the dealing rooms in Western Europe,
Central and Eastern Europe, and Asia. The traditional dealing rooms, with the dealing room in
Brussels accounting for the lion’s share of the limit exposures and risks, focus on trading in interest
rate instruments, while activity on the FX markets has traditionally been limited. All dealing rooms
focus on providing customer service in money and capital market products and on funding the bank
activities.
At KBC Financial Products, the only ongoing activity – European Equity Derivatives – has been
managed directly from Brussels since March 2012. The market risk of the legacy CDO portfolio is
managed stringently, with a number of de-risking trades having taken place during the year. These
trades have significantly lowered risk and the sensitivity of P&L to credit spread movements.
The remaining legacy business lines at KBC Financial Products, namely Fund Derivatives, Reverse
Mortgages and Insurance Derivatives, which represent less than 2% of market risk regulatory capital
charges for trading activities, continue to be monitored and wound down by dedicated teams.
The VaR model
The VaR method is the principal tool for managing and monitoring market risk exposures in the
trading book. Accordingly, VaR is the primary building block of KBC’s market risk management
framework and regulatory capital calculations.
VaR is defined as an estimate of the amount of economic value that might be lost on a given
portfolio due to market risk over a defined holding period, with a given confidence level. The
measurement only takes account of the market risk of the current portfolio and does not attempt to
capture possible losses due to further trading or hedging, counterparty default or operational losses.
The risk factors used in the VaR calculations cover all the main market risk drivers for the trading
books, namely interest rates, interest rate volatility, basis risk, credit spreads, exchange rates,
exchange rate volatility, equity, equity volatility and inflation rates. To compute shifts in the risk
factors, the historical method is used (HVaR). This means that the actual market performance is used
in order to simulate how the market could develop going forward, i.e. this method does not rely on
assumptions regarding the distribution of price fluctuations or correlations, but is based on patterns
of experience in the past. Past movements in market parameters are transformed into scenarios that
are applied to the current market situation and the corresponding P&Ls are computed. KBC’s current
HVaR methodology is based on a 10-day holding period and a 99% confidence level, with historical
data going back 500 working days i.e. it equals the fifth worst outcome (1% of 500 scenarios). This
is in compliance with regulatory requirements.

Risk report 2013 • KBC Group • 115
We calculate an overall VaR for each specialised subsidiary and for all trading entities worldwide
based on a 10-day holding period.
In the following table, the VaR for KBC Bank includes both the linear and non-linear exposure of the
traditional dealing rooms, as well as KBC Securities (from April 2013 onwards). KBC Financial
Products’ HVaR, which comprises the single names credit derivatives portfolio and the remaining
correlation portfolio, is also shown in the table until the third quarter of 2013. As of October 2013
the HVaR for KBC Financial Products’ credit derivatives had fallen to zero due to a series of trades
with an external counterpartythat generated and exact match of the offsetting positions in the
scope of KBC Financial Products’ VaR model (perfect match, Back-to-Back). As a result, and due to
the above-mentioned inclusion of KBC Securities in the HVaR for KBC Bank, all trading activity for
the KBC group measured by HVaR has been included in the ’10-day HVaR for KBC Bank’ figure from
that point on.
Market risk (VaR)(in millions of EUR)
10 day HVaR KBC Bank 10 day HVaR KBC Financial Products
2012 2013 2012 2013
Holding period: 10 days
Average for 1Q 30 37 12 1
Average for 2Q 341,2 37 23 1
Average for 3Q 30 34 2 1
Average for 4Q 30 29 1 -
As at 31 December 37 28 2 -
Maximum in year 39 50 18 5
Minimum in year 23 26 1 0
1 Change in scope as of 1 March 2012: European Equity Derivatives moved from KBC Financial Products to KBC Bank.
2 KBL EPB included until the second quarter of 2012.
3 Large decrease in the use of average HVaR for KBC Financial Products due to simplification of the credit event settlement process.
A breakdown of the risk factors (averaged) in KBC Bank’s HVaR model from 1 March 2012 (when
the scope changed and the European equity derivatives business was included) to 31 December
2012 and for full-year 2013 is shown in the table below. Please note that the equity risk stems from
the European equity business, and also from KBC Securities (from April 2013).
Breakdown by risk factor of the trading HVaR for KBC Bank (in millions of EUR)
Average last 10 months 2012 Average 2013
Interest rate risk 31.0 33.3
FX risk 2.2 2.9
FX Option Risk 2.0 1.8
Equity risk 1.6 1.9
Diversification effect -5.7 -5.6
Total HVaR 31.1 34.3

Risk report 2013 • KBC Group • 116
Regulatory capital
Both KBC Bank and KBC Financial Products have been authorised by the Belgian regulator to use
their respective HVaR models to calculate regulatory capital requirements for part of their trading
activities (Approved Internal Models or AIM). CSOB (Czech Republic) has also received approval from
the local regulator to use its HVaR model for capital requirement purposes. These models are also
used for the calculation of Stressed VaR (SVaR), which is one of the CRD III Regulatory Capital
charges that entered into effect at year-end 2011. The SVaR, like the HVaR, measures the maximum
loss from an adverse market movement within a given confidence level (99%) and for a given
holding period (10 days). However, the 500 scenarios which are used for calculating the SVaR are
not based on the most recent past, but consist of 250 ‘regular’ historical scenarios from the period
which resulted in the most negative VaR figure for that entity (the ‘stressed’ period), and 250
anti-thetic (‘mirror’) scenarios, obtained by reversing these 250 regular scenarios. The stressed
period which is used for calculating the SVaR has to be calibrated at least on a yearly basis. As at the
date of preparation of this report, the period relevant to the measurement of SVaR for 2013 and the
period that will be used from 2014 on are shown in the table below:
Approved Internal Model
2013 2014
KBC NV AIM Jan 2008 – Dec 2008 May 2011 – Apr 2012
KBC FP AIM June 2008 – June 2009* May 2007 – May 2008
CSOB (Czech Republic) AIM Mar 2008 – Mar 2009 Jul 2009 – Jun 2010
* The period shown for 2013 is different from the 2012 Risk Report as there was a recalibration of the SVaR period in April 2013. This recalibration took place because
further portfolio derisking had changed the risk profile of the position, which meant that a different stressed period was more relevant to the remaining positions.
In addition, KBC Financial Products has implemented models (as required by CRD III) to calculate and
report an Incremental Risk Charge (IRC) for the credit risk positions that carry default and migration
risks (i.e. the single name corporate CDS) and a Comprehensive Risk Measure (CRM) that covers all
price risks in the bespoke CDO tranches. However, as mentioned above, because the offsetting
positions in the scope of KBC Financial Products’ VaR model matched exactly as from October 2013,
the IRC and CRM charges fell to zero. It should be noted that the risk attached to ABS and retained
CDO positions follows the (re)securitisation framework (for further information, please refer to the
‘Structured credit products’ section of this risk report).
The resulting capital requirements for trading risk at year-end 2012 and year-end 2013 are shown in
the table below. The trading regulatory capital requirements of local KBC entities not receiving
approval from their respective regulator to use an internal model for capital calculations, as well as
the business lines not included in the HVaR calculations, are measured according to the Standardised
approach. This approach sets out general and specific risk weightings per type of market risk
(interest risk, equity risk, foreign exchange risk and commodity risk).

Risk report 2013 • KBC Group • 117
Trading regulatory capital require-ments, by risk type (in millions of EUR)
Interest rate risk
Equity risk
FX risk
Commo-dity risk
Incre-mental Risk Charge
Compre-hensive Risk Measure
Re-securiti-sation
Total
31-12-2012
Market risks assessed by internal model
HVaRSVaR
88 114
3 4
10 20
- -
1 34 - 274
Market risks assessed by the Standardised Approach
60 12 11 2 - - 340 425
Total 263 18 42 2 1 34 340 698
31-12-2013
Market risks assessed by internal model
HVaRSVaR
83100
26
1322
- -
- - - 226
Market risks assessed by the Standardised Approach
39 7 12 2 - - 59* 119
Total 222 15 47 2 - - 59 345
* The scope represented by this figure is different than in 2012 because the retained CDO positions on the banking book in 2013 have been included under ‘credit risk’
and no longer under ‘market risk’ (as was the case until 2012). If the scope had remained the same, the trading regulatory capital requirements for re-securitisation
would have fallen from 340 million euros in 2012 to 274 million euros in 2013.
Stress testing
As the VaR model cannot encompass all potential extreme events, the VaR calculations are
supplemented by stress tests which reflect the impact of exceptional circumstances and events with
a low degree of probability. Stress tests help to verify the adequacy of established limits and
assigned capital and are used as an additional input for informed decisions about how much risk
senior management is willing to take (acting as a tool that helps to evaluate risk tolerance).
For the Financial Markets activities (including European Equity derivatives) both hypothetical and
historical stress tests are performed on a weekly basis, whereby interest rates (IR), exchange rates
(FX) and equity prices (EQ) are shifted.
On the one hand, hypothetical stress tests encompass portfolio-dependent scenarios, i.e. simulating
predefined events that are independent of the portfolio composition. These scenarios model inter
alia parallel interest rate shifts, steepening/flattening of interest rate curves, changes in basis swap
spreads, FX rate (volatility) movements and equity price shifts. On the other hand, portfolio-
independent stress tests apply shifts to the risk factors driving the major positions.

Risk report 2013 • KBC Group • 118
Besides hypothetical stress tests, historical stress tests are carried out that use a number of historical
scenarios, going back as far as 1987, as shown in the table below.
Events Period (start to end)
Financial crisis after collapse of Lehman Brothers 01-07-2007 to 01-07-2009
2nd Gulf War 01-09-2002 to 30-04-2003
11 September 2001 10-09-2001 to 12-12-2001
Increase in long-term interest rates 18-01-1999 to 14-10-1999
Brazilian crisis 18-01-1999 to 14-10-1999
LTCM fund collapse 25-09-1998 to 17-11-1998
Large swing in exchange rates 17-08-1998 to 17-11-1998
Russia crisis 15-06-1998 to 17-11-1998
Southeast-Asian crisis 01-01-1997 to 01-08-1998
Kobe earthquake (Japan) 16-01-1995 to 16-04-1995
Mexico crisis 15-12-1994 to 30-04-1995
Increase in long-term interest rates 31-12-1993 to 05-10-1994
1st Gulf War 02-08-1990 to 31-03-1991
Stock market decline 25-08-1987 to 31-03-1988
ERM crisis 28-12-1992 to 31-08-1993
For the CDO portfolio, stress tests on credit spreads are performed biweekly. Every quarter,
comprehensive stress tests are performed by stressing the correlation and the level of credit spreads
as well as by simulating losses in the underlying collateral pool, based on the current level of the
credit spreads.
The stress test results are presented to the GMC meetings. In addition, a more in-depth report on
stress test results, as well as on historical stress tests, is submitted to the GMC on a quarterly basis.
In all the stress tests conducted during the year, it turned out that both Regulatory and Economic
Capital would provide a sufficient buffer were such scenarios to materialise.
Back-testing
Back-testing plays a crucial role in assessing the quality and accuracy of the HVaR model, as it
compares model-generated risk measures to daily P&L figures.
In line with regulatory requirements, a daily theoretical back-test procedure is in place, consisting of
three steps. Firstly, a ‘no action P&L’ is generated. This is the P&L that the portfolio produces if all
positions remain unchanged, but the market data changes to the next day’s data. This P&L excludes
non-trading components such as commissions and fees, and P&L from intraday trading. Secondly,
the ‘no action P&L’ is compared with the VaR calculated (99%, one-day holding period). The last
step entails reporting negative exceptions to the relevant risk committees (both on an ad-hoc and a
quarterly basis), i.e. when the negative P&L result exceeds the one-day VaR. These negative
exceptions are also referred to as outliers.

Risk report 2013 • KBC Group • 119
The 2013 theoretical back-tests at Approved Internal Model (AIM) level resulted in one outlier for
KBC Bank AIM, none for KBC Financial Products AIM and four for CSOB Czech Republic AIM (see
graphs below). The outlier for KBC Bank AIM, and the two outliers at CSOB Czech Republic AIM in
June, occurred when announcements from the Fed concerning ‘tapering of Quantitative Easing’
caused considerable volatility on the financial markets. The other two outliers for CSOB Czech
Republic AIM were in January 2013 and were caused mainly by sharp yield increases in Czech
government bonds, when market data was showing indications of a recovery on the EU market.
KBC Bank AIM KBC FP AIM CSOB CR AIM
Number of outliers for theoretical back-testing of the Approved Internal Models of the KBC group
2012 1 2 2
2013 1 0 4
Graphs comparing the 1-day HVaR with the daily theoretical P&L results during 2013 at AIM level:
* The figures for six dates have been removed because the P&L results for those days cannot be considered to be a test of the performance of the HVaR model: four were
related to quarterly bookings and two were due to bookings that relate to multi-day movements. For these six dates, the average is taken of the previous and next data
point.
-20
-15
-10
-5
0
5
10
Mill
ion
EUR
KBC Bank AIM
1D HVaR Theoretical P&L
-5
-4
-3
-2
-1
0
1
2
3
4
5
Mill
ion
USD
KBC FP AIM*
1D HVaR Theoretical P&L

Risk report 2013 • KBC Group • 120
Please note that theoretical and real back-testing is performed on a wide variety of portfolios for
which an HVaR limit is defined. This provides a good indication of the HVaR model performance for
a specific (product) portfolio. In general, the number of outliers on a more granular (product)
portfolio level increases as there is less diversification. However, allowing for this, the number of
outliers for all entity levels underpinned the quality of the HVaR model.
Validation and reconciliation
VaR implementation is validated by an independent validation entity. In order to guarantee the
quality of transaction data used in the risk calculation engine, a daily reconciliation process has been
set up. The transaction data generated by the source system are reconciled with the data used in
the risk calculation engine.
Furthermore, the VaR method is reviewed and subjected to a validation exercise by the KBC Risk
Validation Unit at least once a year. In addition, the VaR model is audited on a regular basis.
Valuation
One of the building blocks of sound risk management is prudent valuation. A daily independent
middle-office valuation of front-office positions is performed. Whenever the independent nature or
the reliability of the valuation process is not guaranteed, a parameter review is performed. Where
applicable, adjustments to the fair value are made to reflect close-out costs, adjustments for less
liquid positions or markets, mark-to-model-related valuation adjustments, counterparty risk, liquidity
risk and operations-related costs.
-6
-4
-2
-
2
4
6 M
illio
n EU
R
CSOB CR AIM
1D HVaR Theoretical P&L

Risk report 2013 • KBC Group • 121
KBC applies the IFRS fair value hierarchy which gives priority to the use of quoted prices in an active
market whenever they are available. If there are no price quotes available, KBC determines the fair
value by using a model based on observable or unobservable inputs. In line with the IFRS principles,
the use of observable inputs is maximised, whereas the use of unobservable inputs is minimised.
Examples of observable inputs are the risk-free rate, exchange rates, stock prices and implied
volatility. Valuation techniques based on observable inputs can include discounted cash flow
analysis, reference to the current or recent fair value of a similar instrument, or third-party pricing,
provided that the third-party price is in line with alternative observable market data. Unobservable
inputs reflect KBC’s own assumptions about the assumptions that market participants would use in
pricing the asset or liability (including assumptions regarding the risks involved). Unobservable inputs
reflect a market that is not active. For example, proxies and correlation factors can be considered to
be unobservable in the market.
The KBC valuation methodology of the most commonly used financial instruments are summarised
in Note 24 of the 2013 Annual Report for KBC Group NV.
Within KBC, valuation models are validated by an independent Risk Validation Unit. In addition, the
Group Executive Committee of KBC established a Group Valuation Committee (GVC) to ensure that
KBC Group NV and its entities are compliant with all the relevant regulatory requirements
concerning the valuation of financial instruments that are measured at fair value. For this purpose,
the GVC monitors the consistent implementation of the KBC Valuation Framework, which consists
of several policies including the CDO Revaluation Policy, the Group Market Value Adjustments Policy
and the Group Parameter Review Policy. Furthermore, the GVC meets twice per quarter to approve
significant changes in valuation methodologies (including but not limited to models, market data,
input parameters) or deviations from group policies for financial instruments measured at fair value.
The GVC consists of members of the Group Finance, Risk Markets IPF, and Middle Office units.

Risk report 2013 • KBC Group • 122
Operational Risk Management

Risk report 2013 • KBC Group • 123
Operational risk is the risk of loss resulting from inadequate or failed internal processes, people and
systems or from external events. Operational risks include the risk of fraud, and legal, compliance
and tax risks.
This definition is similar to the one given in the Basel II Capital Accord and the Capital Requirements
Directive.
The impact of incidents on the group’s reputation is taken into consideration when establishing
vulnerability to operational risk incidents.
For a description of business risk, reputation risk and business continuity management, see ‘Other
non-financial risks’ at the end of this section.
Information on legal disputes is provided in Note 36 of the ‘Consolidated financial statements’
section of the 2013 Annual Report of KBC Group NV.
Strategy and processes
We have a single, global framework for managing operational risk across the entire group. It
consists of a uniform operational risk language embedded in group-wide key controls, one
methodology, one set of centrally developed ICT applications, and centralised and decentralised
reporting.
Scope of operational risk management
KBC’s operational risk management framework covers all entities in which it, directly or indirectly,
holds at least 50% of the shares or in respect of which it has the power de jure or de facto to
exercise a decisive influence on the appointment of the majority of its directors or managers.
Information is presented below on operational risk governance, the tools used to manage
operational and other non-financial risks and the capital charges for them.
Operational risk governance
The main precept of operational risk management is that ultimate responsibility for managing
operational risk lies with business’ line management, which receives support from local operational
risk managers, and is supervised by local independent risk functions.

Risk report 2013 • KBC Group • 124
The Group risk function is primarily responsible for defining the operational risk management
framework for the entire group. The development and implementation of this framework is
supported by an extensive operational risk governance model covering all entities of the group. This
framework was redesigned in 2012 in line with the KBC Risk Management Framework and will
gradually be implemented (with full implementation in 2015).
The Group risk function creates an environment where risk specialists (in various areas, including
information risk management, business continuity and disaster recovery, compliance, anti-fraud,
legal, tax and accounting matters) can work together (setting priorities, using the same language
and tools, uniform reporting, etc.). It is assisted by the local value and risk management units, which
are likewise independent of the business.
Toolbox for the management of operational risks
We use a number of building blocks for managing operational risks, which cover all aspects of
operational risk management.
Between 2011 and 2015, specific attention is being given to the structured set-up of process-based
Group Key Controls, which will gradually replace the former Group Standards. These Controls are
policies containing top-down basic control objectives and are used to mitigate key and killer risks
inherent in the processes of KBC entities. As such, they are an essential building block of both the
operational risk management framework and the internal control system.
• A first set was approved in 2011 for the Credit, Life, Non-life, Personal Financial Advice, Legal,
Tax, Business Continuity Management and Risk & Capital Management processes.
• A second set was approved in 2012 for the Cash, Current Account, Savings Account, Lease,
Trading and Sales (part 1), Portfolio Management, Customer Administration, Human Resources,
Corporate Communication and Accounting and External Financial Reporting processes.
• A third set was approved in 2013 for the Balance Sheet Management, Collections (Cheque and
Direct Debits), Corporate Governance, Custody, Distribution of Customer Information Output,
Funds Transfer, Information Security, Marketing: Commercial Communication, Marketing: New
and Active Product Process, Reinsurance, Fixed-Term Savings Products, Retail Brokerage and
Information Technology processes.
The business and (local) control functions assess these Group Key Controls. The risk self-assessments
are consolidated at the Group risk function and ensure that there is a consistent relationship
between (i) processes, (ii) risks, (iii) control activities and (iv) assessment scores. KBC created an
objective management tool to evaluate its internal control environment and to benchmark the
approach across its entities. Each year, we report the assessment results to the National Bank of
Belgium in our Internal Control Statement.

Risk report 2013 • KBC Group • 125
Besides these Group Key Controls, there are a number of other building blocks:
• The Loss Event Database. All operational losses of 1 000 euros or more have been recorded in a
central database since 2004. This database also includes all legal claims filed against group
companies. Consolidated loss reports are regularly submitted to the Group Internal Control
Committee, the Group Executive Committee and the ARC Committee.
• Risk Scans (bottom-up and top-down). These self-assessments focus on the identification of key
operational risks at critical points in the process/organisation that are not properly mitigated, and
on new or emerging operational risks that are relevant at (sub)group level.
• Case-Study Assessments. These are used to test the effectiveness of the protection afforded by
existing controls against major operational risks that have actually occurred elsewhere in the
financial sector. Case studies are discussed on a quarterly basis in the Group Internal Control
Committee.
• Key Risk Indicators. A limited set of KRIs are used to monitor the exposure to certain operational
risks and track the existence and effectiveness of the internal controls.
The quality of the internal control environment and related risk exposure as identified, assessed and
managed by means of these building blocks is reported to KBC’s senior management via a
management dashboard and to the National Bank of Belgium and the FSMA via the annual Internal
Control Statement. Information on the internal control and risk management systems can be found
in the ‘Corporate governance statement’ section of the 2013 Annual Report of KBC Group NV (see
www.kbc.com).
Operational risk capital charge
KBC uses the Standard approach to calculate operational risk capital under Basel II. Operational risk
capital for KBC Bank at the consolidated level totalled 847 million euros at the end of 2013,
compared with 884 million euros at the end of 2012.
For divested entities, KBC keeps operational risk capital (under pillar 2) in line with the outstanding
contractual liabilities.
Other non-financial risks
Business risk
Business risk is the risk arising from changes in external factors that impact the demand for and/or
profitability of our products and services.
Risk factors that are taken into consideration include the macroeconomic environment, the
regulatory framework, client behaviour, the competitive landscape and the socio-demographic
environment. Business risk is assessed on the basis of structured risk scans.
Risk report 2013 • KBC Group • 126
KBC reserves a pillar 2 capital charge specifically for business risk. Business risk capital is based on
the operating expenses for the various KBC group entities. The portion of operating expenses to be
set aside as economic capital for business risk depends on the level of risk attached to the activities
of each entity, as determined on the basis of quantitative and qualitative assessments of activities
across KBC group entities.
Reputation risk
This is the risk arising from the negative perception on the part of customers, counterparties,
shareholders, investors, debt-holders, market analysts, other relevant parties or regulators that can
adversely affect a financial institution’s ability to maintain existing, or establish new business
relationships and to have continued access to sources of funding (for instance, through the
interbank or securitisation markets). Reputation risk is a secondary or derivative risk since it is mostly
connected to and will materialise together with another risk.
We redesigned the Reputation Risk Management Framework in 2012, in line with the KBC Risk
Management Framework. The pro-active and re-active management of reputation risk is the
responsibility of the business, supported by many specialist units (e.g., Group Communication,
Investor Relations).
Under the pillar 2 approach to capital adequacy, the impact of reputation risk on the current
business is covered in the first place by the capital charge for primary risks (such as credit or
operational risk, etc.). It is also covered by the capital reserved for business risk.
Business Continuity Management (BCM)
The Group risk function is responsible for developing a group-wide framework to ensure the
continuity of operations, following the operational risk governance. Via the local value and risk
management units, the Group risk function is also responsible for overseeing the practical
implementation of this framework by line management.
The annual business continuity report has also been included in KBC’s Internal Control Statement
since 2011.

Risk report 2013 • KBC Group • 127
Insurance Risk Management

Risk report 2013 • KBC Group • 128
Technical insurance risks stem from uncertainty regarding how often insured losses will occur and
how extensive they will be. All these risks are kept under control through appropriate underwriting,
pricing, claims reserving, reinsurance and claims handling policies of line management and through
independent insurance risk management.
Strategy and processes
The Group risk function develops and rolls out a group-wide framework for managing insurance
risks. It is responsible for providing support for local implementation and for the functional direction
of the insurance risk management process of the insurance subsidiaries.
The insurance risk management framework is designed primarily around the following building
blocks:
• Adequate identification and analysis of material insurance risks by, inter alia, analysing new
emerging risks, concentration or accumulation risks, and developing early warning signals.
• Appropriate risk measurements and use of these measurements to develop applications aimed at
guiding the company towards creating maximum shareholder value. Examples include natural
catastrophe, non-life and health exposure modelling, stress testing and required economic capital
calculations.
• Determination of insurance risk limits and conducting compliance checks, as well as providing
advice on reinsurance programmes.
Scope of insurance risk management
The following entities are in scope, viz. KBC Insurance (Belgium), Maatschappij voor
Brandherverzekering, Sepia, KBC Group Re, K&H Insurance, CSOB Pojišt’ovna (Czech Republic),
CSOB Poist’ovna (Slovak Republic) and DZI Insurance.

Risk report 2013 • KBC Group • 129
Insurance risk classification
Part of the risk identification process consists of reliably classifying all insurance risks that may be
triggered by (re)insurance contracts.
Under the Solvency II directive, insurance activities are split up into three main categories, namely
Life, Non-life and Health.
• Life insurance risks are further split up into catastrophe risks and non-catastrophe risks. Life
non-catastrophe risks cover the biometric risks (longevity, mortality and disability-morbidity risk),
revision risk, expense risk and lapse risk related to life insurance contracts.
• Non-life insurance risks are further split up into catastrophe and non-catastrophe risks. Non-life
non-catastrophe risks cover the premium risk, reserve risk and lapse risk related to non-life
insurance contracts.
• Health risks are also split up into catastrophe risks and non-catastrophe risks. The latter are then
further subdivided into Health Similar to Life Techniques (includes longevity, mortality, disability-
morbidity, expense risk and lapse risk) and Health Non-Similar to Life Techniques (premium and
reserve risk, lapse risk). In other words, all subtypes included under ‘Life’ and ‘Non-life’ also
appear in the ‘Health’ category.
The various subtypes of insurance risk, linked to the different insurance categories (Life, Non-life and
Health) are defined as follows:
• Catastrophe risk: the risk that a single damaging event, or series of correlated events, of major
magnitude, usually over a well-defined short-time period leads to a significant deviation in actual
claims from the total expected claims. A distinction is made between natural catastrophes (e.g.,
wind storms, floods, earthquakes) and man-made catastrophes (e.g., terrorist attacks like 9/11).
Not only the non-life, but also the life insurance business can be exposed to catastrophes, such as
the pandemic threat of bird flu or accidental events.
• Lapse risk: the risk that the actual rate of policy lapses (i.e. premature full or partial termination of
the contract by the policyholder) differs from those used in pricing.
• Expense risk: the risk that the cost assumptions used in pricing or valuing insurance liabilities in
terms of acquisition costs, administration costs or internal settlement costs, turn out to be too
optimistic.
• Revision risk: the potential negative deviation from the expected value of an insurance contract or
a portfolio thereof due to unexpected revisions of claims. Only to be applied to annuities where
the amount of the annuity may be revised during the next year.
• Biometric risk: the potential negative deviation from the expected value of an insurance contract
or a portfolio thereof due to unexpected changes related to human life conditions.
- Longevity risk: the risk that the mortality rates used in pricing annuity products (or other
products with negative capital at risk) turn out to be too high, i.e. people live longer than
expected.
- Mortality risk: the risk that the mortality rates used in pricing will turn out to be too low, i.e.
people die earlier than expected.

Risk report 2013 • KBC Group • 130
- Disability-morbidity risk: the risk that the part of the premium charged to cover hospitalisation
or disability claims is not sufficient, due to a higher number of claims or more expensive claims
than expected.
• Premium risk: the risk that the premium that will be earned next year will not be enough to cover
all liabilities resulting from claims in this portfolio, due for instance to the fact that the number of
claims will be higher than expected (frequency problem) or the severity of the claims will be higher
than expected (severity problem).
• Reserve risk: the risk that the liabilities stemming from claims, which have occurred in the past,
but have still to be finally settled, will turn out to be more expensive than expected.
Insurance risk measurement
We develop models from the bottom up for all material group-wide insurance liabilities, i.e. (i) future
claims that will occur over a predefined time horizon, as well as the claims settlement pattern, (ii)
the future settlement of claims (whether already reported to the insurer or not) that have occurred
in the past but have not yet been fully settled, and (iii) the impact of the reinsurance programme on
these claims. We use these models to steer the group’s insurance entities towards creating more
shareholder value, by means of applications to calculate economic capital, support decisions on
reinsurance, calculate the ex post profitability of specific sub-portfolios and set off economic capital
requirements against the relevant return in pricing insurance policies.
Insurance risk management has developed an internal model for the group-wide exposure to natural
hazards. This model measures most material natural catastrophe risks for all group insurance and
reinsurance companies, with account being taken of outward reinsurance (external and intra group).
Work is currently being carried out to develop other internal models for measuring insurance risks.
The internally developed models and frameworks follow the Risk Measurement Framework and are
validated within this scope by the independent validation unit.
Best estimate valuations of insurance liabilities
As part of its mission to independently monitor insurance risks, the Group Risk Integration &
Support Directorate regularly carries out in-depth studies. Adequacy is checked per business line at
subsidiary level and the overall adequacy is assessed at subsidiary level for all business lines
combined.
In addition, ‘Liability Adequacy Tests’ (LAT) that meet local and IFRS requirements are conducted by
the various group companies for the life technical provisions. Calculations are made using
prospective methods (cashflow projections that take account of lapse rates and a discount rate that
is set for each insurance entity based on local macroeconomic conditions and regulations), and extra
market-value margins are built in to deal with the factor of uncertainty in a number of parameters.

Risk report 2013 • KBC Group • 131
Since no deficiencies were recorded by year-end 2013, there was no need for a deficiency reserve to
be set aside within the KBC group.
The techniques used to perform these best estimate valuations will become the foundation of future
group-wide insurance liabilities’ valuation frameworks to be used within Solvency II and IFRS 4/2.
Technical provisions and loss triangles, non-life business
The table shows claims settlement figures in the non-life business over the past few years and
includes KBC Insurance NV, CSOB Pojišt’ovna (Czech Republic), CSOB Poist’ovna (Slovakia, from
financial year 2008), DZI Insurance (from financial year 2008), K&H Insurance and KBC Group Re
(from financial year 2005). All provisions for claims to be paid at the close of 2013 have been
included. The claims-settlement figures incorporate all amounts that can be allocated to individual
claims, including the Incurred But Not Reported (IBNR) and Incurred But Not Enough Reserved
(IBNER) provisions, and the external handling expenses for settling claims, but do not include
internal claims settlement expenses and provisions for amounts expected to be recovered. The
figures included are before reinsurance and have not been adjusted to eliminate intercompany
amounts.
The first row in the table shows the total claims burden (claims paid plus provisions) for the claims
that occurred during a particular year, as estimated at the end of the year of occurrence. The
following rows indicate the situation at the end of the subsequent calendar years. We restated the
amounts to reflect exchange rates at year-end 2013.
Loss triangles, KBC Insurance
Year of occur-rence
Year of occur-rence
Year of occur-rence
Year of occur-rence
Year of occur-rence
Year of occur-rence
Year of occur-rence
Year of occur-rence
Year of occur-rence
Year of occur-rence
(in millions of EUR) 2004 20051 2006 2007 20082 2009 2010 2011 2012 2013
Estimate at the end of the year of occurrence
547 578 631 686 793 824 871 806 849 917
1 year later 483 506 537 621 757 724 773 714 743 -
2 years later 454 484 511 588 728 668 725 656 - -
3 years later 448 483 500 567 714 652 720 - - -
4 years later 444 474 486 561 710 635 - - - -
5 years later 445 461 478 557 702 - - - - -
6 years later 441 462 464 550 - - - - - -
7 years later 433 458 458 - - - - - - -
8 years later 431 454 - - - - - - - -
9 years later 427 - - - - - - - - -
Current estimate 427 454 458 550 702 635 720 656 743 917
Cumulative payments 376 377 398 464 589 515 588 495 484 347
Current provisions 51 77 60 86 113 119 133 161 259 570
1 From financial year 2005, KBC Group Re’s figures have been included. If these figures had not been taken into account, the following amounts would have been arrived
at for financial year 2005 (amount and year of occurrence): 455 for 2004.
2 From financial year 2008, the figures for CSOB Poist’ovna (Slovak Republic) and DZI Insurance (Bulgaria) have been included. If these figures had not been taken into
account, the following amounts would have been arrived at for financial year 2008 (amount and year of occurrence): 432 for 2004; 453 for 2005; 485 for 2006; and
573 for 2007.

Risk report 2013 • KBC Group • 132
Stress testing and scenario analysis
In 2012, the sensitivity of technical insurance risks to extreme events was analysed in a number of
ways, including the IMF stress test. The purpose of these tests was to identify and quantify the
impact of different stress scenarios on the financial position of the insurance group and included
catastrophic and severe insurance events for both the life (e.g., mass lapse shock) and non-life
insurance businesses (e.g., Maximum Probable Loss for either a natural or man-made catastrophe
event, whichever is largest).
In addition to the regulatory required stress tests, we perform internal stress tests. For the non-life
business, KBC’s internal natural catastrophe models are able to estimate the anticipated claim costs,
should natural catastrophes that have been observed in the past occur again today. Moreover, they
can determine the expected impact on bottom-line economic profit of natural catastrophe events,
which are expected to occur on average only once within a given time frame (e.g., 100 or 250 years).
For the life insurance business, a sensitivity analysis is typically performed within the framework of
the annual calculation of the market consistent embedded value. The results for three types of
sensitivity to insurance risk are reported, viz. ‘mortality rate: plus and minus 5%’, ‘lapses: plus and
minus 10%’, ‘expenses: plus and minus 10%’.
Other stress testing exercises are performed on an ad hoc basis.
Insurance risk mitigation by reinsurance
The insurance portfolios are protected against the impact of serious claims or the accumulation of
losses (due, for instance, to a concentration of insured risks) by means of reinsurance. We divide
these reinsurance programmes into three main groups, i.e. property insurance, liability insurance
and personal insurance, and we re-evaluate and renegotiate them every year.
Most of our reinsurance contracts are concluded on a non-proportional basis, which provides cover
against the impact of serious claims or loss events. The independent insurance risk management
function is also responsible for advising on the restructuring of the reinsurance programmes,
especially with a view to creating shareholder value. This approach has resulted in optimising the
retention of the KBC group particularly in respect of its exposure to natural catastrophe risk. In view
of reducing P&L volatility, KBC Insurance (Belgium) has concluded a multi-line multi-year reinsurance
agreement covering the most important Non-Life business lines for three years.
More information on the insurance activities of the group can be found under Notes 9, 10, 11 and
35 of the ‘Consolidated financial statements’ section of the 2013 Annual Report of KBC Group NV.
A breakdown by business unit of earned premiums and technical charges is provided in the notes
dealing with segment reporting.

Risk report 2013 • KBC Group • 133
Glossary

Risk report 2013 • KBC Group • 134
ABS (Asset Backed Securities)
ABS are bonds or notes backed by loans or accounts receivables originated by providers of credit
such as banks and credit card companies. Typically, the originator of the loans or accounts
receivables transfers the credit risk to a trust, which pools these assets and repackages them as
securities. These securities are then underwritten by brokerage firms, which offer them to the public.
Add-On
Basel-II-defined factor to reflect the potential future increase in exposure stemming from derivatives
transactions.
ALM (Asset and Liability Management)
The ongoing process of formulating, implementing, monitoring and revising strategies for both
on-balance-sheet and off-balance-sheet items, in order to achieve an organisation’s financial
objectives, given the organisation’s risk tolerance and other constraints.
Alt-A
A classification of mortgages considered riskier than prime, but less risky than subprime. As a result
of the subprime crisis, Alt-A mortgages came under particular scrutiny.
Asset class
A classification of credit exposures according to the Capital Requirements Directive – IRB approach.
The main classes are Sovereigns, Institutions, Corporates, SME Corporates and Retail. Classification
depends on the type of obligor, the total annual sales of the obligor, the type of product and the
exposure value.
Banking book
KBC’s banking book is defined as all positions in the KBC Bank group that are not in the trading
book. A trading book consists of positions in financial instruments and commodities held either with
trading intent or in order to hedge other elements of the trading book. To be eligible for trading
book capital treatment, financial instruments must either be free of any covenants restricting their
tradability or be able to be hedged completely. In addition, positions should be frequently and
accurately valued, and the portfolio actively managed.
Basel III
Basel III is a global regulatory standard on bank capital adequacy, stress testing and market liquidity
risk agreed upon by the members of the Basel Committee on Banking Supervision in 2010.
Basel III was developed in response to the deficiencies in financial regulation revealed by the
late-2000s financial crisis.

Risk report 2013 • KBC Group • 135
BIS (Bank for International Settlements)
The Bank for International Settlements (BIS) is an international organisation that fosters cooperation
towards monetary and financial stability and serves as a bank for central banks. It is the world’s
oldest international financial institution and remains to this day the principal centre for international
central bank cooperation. (BIS website: www.bis.org).
BPV (Basis Point Value)
The measure that reflects the change in the net present value of interest rate positions, due to an
upward parallel shift of 10 basis points (i.e. 0.10%) in the zero coupon curve.
Business risk
Business risk is the risk arising from changes in external factors that impact the demand for and/or
profitability of our products and services. Risk factors that are taken into consideration include the
macroeconomic environment, the regulatory framework, client behaviour, the competitive landscape
and the socio-demographic environment. Business risk is assessed on the basis of structured risk
scans.
CAD ratio
Total eligible capital / Risk-weighted assets (the result must be at least 8% according to the Basel
regulations).
CDO (Collateralised Debt Obligation)
CDOs are a type of asset-backed security and a structured finance product in which a distinct legal
entity, a special purpose vehicle (SPV), issues bonds or notes against an investment in an underlying
asset pool. Pools may differ with regard to the nature of their underlying assets and can be
collateralised either by a portfolio of bonds, loans and other debt obligations, or be backed by
synthetic credit exposures through use of credit derivatives and credit-linked notes.
The claims issued against the collateral pool of assets are prioritised in order of seniority by creating
different tranches of debt securities, including one or more investment grade classes and an equity/
first loss tranche. Senior claims are insulated from default risk to the extent that the more junior
tranches absorb credit losses first. As a result, each tranche has a different priority of payment of
interest and/or principal and may thus have a different rating.
CDS (Credit Default Swap)
A privately negotiated bilateral agreement where one party (the protection-buyer or risk-shedder)
pays a premium to another party (the protection-seller or risk-taker) in order to secure protection
against any losses that may be incurred through exposure to a reference entity or investment as a
result of an unforeseen development (or ‘credit event’).
Central Tendency
Average through-the-cycle default probability of a segment.

Risk report 2013 • KBC Group • 136
CLO (Collateralised Loan Obligation)
CDO holding only loans as underlying assets.
CP (Commercial Paper)
Unsecured short-term promissory notes which generally have maturities of less than 270 days.
CRD (Capital Requirements Directive)
European-Union-specific interpretation of the general Basel II regulations. The CRD is in turn
transposed into the national legislation and regulations of the EU Member States.
Credit risk
Credit risk is the potential negative deviation from the expected value of a financial instrument
arising from the non-payment or non-performance by a contracting party (for instance, a borrower,
guarantor, insurer or re-insurer, counterparty in a professional transaction or issuer of a debt
instrument), due to that party’s insolvency, inability or lack of willingness to pay or perform, or to
events or measures taken by the political or monetary authorities of a particular country (country
risk). Credit risk thus encompasses default risk and country risk, but also includes migration risk,
which is the risk for adverse changes in credit ratings.
CSMC (CRO Services Management Committee)
Overarching and integrated risk committee at KBC group level that supports the Group Executive
Committee in assessing the adequacy of, and compliance with, the KBC Risk Management
Framework and defines and implements the vision, mission and strategy for the CRO Services of the
KBC group.
Cure rate
Rate of clients who default and revert subsequently to ‘non-default’ status.
Downturn LGD
LGD in an economic downturn. The underlying idea in the Basel regulation is that LGD is correlated
to PD and loss rates will be higher in a year with many defaults.
DPF (Discretionary Participation Feature)
Part of the annual profit that is attributed to the policyholders of an insurance contract.
EAD (Exposure At Default)
The amount expected to be outstanding if and when an obligor defaults. At the time of default, it is
equal to the actual amount outstanding, and therefore is no longer an expectation.

Risk report 2013 • KBC Group • 137
EBA (European Banking Authority)
The successor to the CEBS (Committee of European Banking Supervisors).
A committee comprised of high level representatives from the banking supervisory authorities and
central banks of the European Union. It gives advice to the European Commission on banking policy
issues and promotes co-operation and convergence of supervisory practice across the European
Union. The committee also fosters and reviews common implementation and consistent application
of Community legislation.
ECAP (Economic Capital)
Economic capital is the amount of capital needed to absorb very severe losses, expressed in terms of
the potential reduction in the economic value of the group (= difference between the current
economic value and the worst case economic value over a one-year time horizon and measured at a
certain confidence level). It represents the minimum amount of capital which is required in order to
protect KBC group debt holders against economic insolvency under extreme circumstances.
EIOPA (European Insurance and Occupational Pensions Authority)
The successor to the Committee of European Insurance and Occupational Pensions Supervisors
(CEIOPS), EIOPA is part of the European System of Financial Supervision consisting of three European
Supervisory Authorities and the European Systemic Risk Board. It is an independent advisory body to
the European Parliament and the Council of the European Union. EIOPA’s core responsibilities are to
support the stability of the financial system, transparency of markets and financial products, as well
as the protection of insurance policyholders, pension scheme members and beneficiaries.
EL (Expected Loss)
The expected value of losses due to default over a specified horizon. EL is typically calculated by
multiplying the Probability of Default (a percentage) by the Exposure At Default (an amount) and
Loss Given Default (a percentage). It is always considered ‘an expectation’ due to the ‘Probability of
Default’ factor.
Fair value
The amount for which an asset could be exchanged or a liability settled between knowledgeable,
willing parties in an arm’s length transaction. Market-consistent value or fair value is based on
relative pricing or the ‘no arbitrage’ argument.
FSMA (Financial Services and Markets Authority)
The FSMA is the successor to the former Banking, Financial and Insurance Commission (CBFA).
It is responsible for supervising the financial markets and listed companies, authorising and
supervising certain categories of financial institutions, overseeing compliance by financial
intermediaries with codes of conduct and supervising the marketing of investment products to the
general public, as well as for the ‘social supervision’ of supplementary pensions. The Belgian
government has also tasked the FSMA with contributing to the financial education of savers and
investors.

Risk report 2013 • KBC Group • 138
GRIS (Group Risk Integration & Support)
The Group Risk Integration & Support (GRIS) division supports the CRO of KBC Group, KBC Bank
and KBC Insurance and business entities at group level. GRIS designs the KBC Risk Management
Framework (RMF) and most of its underlying building blocks.
GMRA (General Master Repurchase Agreement)
Standardised contract used when entering into (reverse) repo-like transactions.
Haircuts
The difference between the market value of a security and its collateral value. Haircuts are taken in
order to account for a possible decline in the market value of a collateralising security upon
liquidation.
HVaR (Historical Value at Risk)
Historical Value-at-Risk estimates the maximum amount of money that can be lost on a given
portfolio due to adverse market movements over a defined holding period, with a given confidence
level and using real historical market performance data.
ICAAP (Internal Capital Adequacy Assessment Process)
The internal process a bank should have in place for assessing its overall capital adequacy in relation
to its risk profile, as well as its strategy for maintaining adequate capital levels in the future.
Insurance risk
The potential negative deviation from the expected value of an insurance contract or pension claim
(or a portfolio thereof).
Interest rate risk
The potential negative deviation from the expected value of a financial instrument or portfolio
thereof due to changes in the level or in the volatility of interest rates.
IRB (Internal Ratings-Based)
An approach defined in the Capital Requirements Directive to calculate the credit-risk-related capital
requirements, where a financial institution uses its own models to perform the calculation. There are
two possibilities: the IRB Foundation or the IRB Advanced approach. When applying the IRB
Foundation approach, internal estimates of the Probability of Default are used to calculate minimum
requirements, while the IRB Advanced methodology also takes into account the internal estimates of
Exposure At Default and Loss Given Default.
ISDA Master Agreements
Standardised contracts developed by the International Swaps and Derivatives Association and used
to document bilateral professional transactions. The presence of such contracts also allows
professional exposures between the contracting parties to be netted.

Risk report 2013 • KBC Group • 139
Lapse risk
The potential negative deviation from the expected value of an insurance contract or a portfolio
thereof due to unexpected changes in policy lapses. Note that the term surrender risk refers
specifically to contracts with surrender value.
LCR (Liquidity Coverage Ratio)
‘Stock of high-quality liquid assets minus Total net cash outflows over the next 30 calendar days’.
A result of 100% (or more) indicates that a bank is maintaining a sufficient stock of ‘high-quality
liquid assets’ to cover net cash outflows for a 30-day period under a stress scenario. The parameters
of the stress scenario are defined under Basel III.
LGD (Loss Given Default)
The loss a bank expects to experience if an obligor defaults, taking into account the eligible
collateral and guarantees provided for the exposure. It can be expressed as an amount or as a
percentage of the EAD (Exposure At Default). At the time of default, the loss experienced is a loss of
the actual amount outstanding, thus no longer an expectation.
Liquidity risk
Liquidity risk is the risk that an organisation will be unable to meet its payment obligations as they
come due because of the inability to liquidate assets or obtain adequate funding (liability liquidity
risk) or the risk that it cannot easily unwind or offset specific exposures without significantly
lowering market prices because of inadequate market depth or market disruptions (asset liquidity
risk).
Market risk
The potential negative deviation from the expected value of a financial instrument (or portfolio
thereof) due to changes in the level or volatility of market prices.
Market value
The cost that would be incurred or the gain that would be realised if an outstanding contract was
replaced at current market prices (also called replacement value).
Mark-to-Market
The act of assigning a market value to an asset
MVA (Market Value Adjustment)
IFRS-inspired adjustments or reserves recognised on positions at fair value. MVAs cover close-out
costs, adjustments for less liquid positions or markets, counterparty exposure resulting from OTC
derivatives, model-linked valuation adjustments, operation-related costs, as well as transaction-
specific adjustments.

Risk report 2013 • KBC Group • 140
NBB (National Bank of Belgium)
One of the tasks of the NBB is financial supervision, which is the instrument for ensuring financial
stability, and the second key function of a central bank, alongside monetary stability. Financial
supervision covers the:
1. prudential supervision of financial institutions from both the micro-prudential and macro-
prudential angle, and the prompt detection of systemic risk;
2. supervision of information, the functioning of the financial markets and respect for the
appropriate code of conduct, together with consumer protection.
Netting
An agreed offsetting of positions or obligations by trading partners or participants to an agreement.
Netting reduces the number of individual positions or obligations subject to an agreement to a
single obligation or position.
NSFR (Net Stable Funding Ratio)
‘Available Stable Funding/Required Stable Funding’, where available stable funding is derived from
different components on the liabilities side of the balance sheet (required funding = assets side).
Basel III defined weightings for determining stability are assigned to the different components (both
assets and liabilities). An NSRF of 100% means that the funding situation is stable.
Operational risk
The potential negative deviation from the expected value of the organisation resulting from
inadequate or failed internal processes, people and systems or from sudden man-made or natural
external events. Operational risk excludes business, strategic and reputational risk.
ORSA (Own Risk and Solvency Assessment)
The Own Risk and Solvency Assessment covers the entirety of the processes and procedures
employed for identifying, assessing, monitoring, managing, and reporting on the short- and
long-term risks a (re)insurance undertaking faces or may face, and for determining the own funds
necessary to ensure that the undertaking’s overall solvency needs are met at all times.
OTC (Over The Counter)
An over-the-counter contract is a bilateral contract where two parties agree on how a particular
trade or agreement is to be settled in the future. It is usually a direct contract between a bank (or an
investment bank) and its clients. It contrasts with exchange trading.
PD (Probability of Default)
The probability that an obligor will default within a one-year horizon.
PIT PD (Point-In-Time PD)
PD reflecting the expected default rate in the next year, based on current economic conditions
(contrast with Through-the-cycle PD).

Risk report 2013 • KBC Group • 141
RAPM (Risk-Adjusted Performance Measurement)
The risk-adjusted performance measurement policy defines a set of risk-adjusted performance
metrics to be used for (1) allocating capital and (2) setting variable remuneration.
RAROC
A measure, expressed as a percentage, used to reflect the profitability of transactions and/or
financial instruments, account taken of the risk involved in these transactions and/or financial
instruments. Generally speaking, it equals the ‘expected profits minus the expected losses’ divided
by the capital invested.
RBA (Ratings-Based Approach)
Basel II approach for calculating the risk-weighted assets applied to securitisation exposures that are
externally rated, or where a rating can be inferred.
RMBS (Residential Mortgage-Backed Security)
A type of structured credit product whose underlying assets are residential debt such as mortgages,
home-equity loans and subprime mortgages.
RWA (Risk-Weighted Asset)
An exposure weighted according to the ‘riskiness’ of the asset concerned. ‘Riskiness’ depends on
factors such as the probability of default by the obligor, the amount of collateral or guarantees and
the maturity of the exposure.
SFA (Supervisory Formula Approach)
Basel II approach used to calculate the risk-weighted assets of a structured credit product based on a
formula defined in the Basel II securitisation framework.
Solvency II
Solvency II is a project, initiated by the European Commission in 2001, which establishes capital
requirements and risk management standards that will apply across the EU and will affect all areas
of an insurer’s operations. Solvency II aims to move away from the idea that ‘one approach fits all’
and thus encourages companies to manage risk in a way which is appropriate to the size and nature
of their business in order to provide protection to policyholders by reducing the risk of insolvency to
insurers.
SPV (Special Purpose Vehicle)
A Special Purpose Vehicle in the context of this document is any distinct entity created to achieve (a)
narrow and well-defined objective(s). SPVs may be created by the KBC group, managed by the KBC
group, created by third parties for the account of the KBC group or managed by third parties for the
account of the KBC group.

Risk report 2013 • KBC Group • 142
SSS (Super Senior Swap)
In the so-called unfunded portion of a synthetic CDO, the risk embedded in a portfolio of assets (as
opposed to the assets themselves) is transferred directly to a ‘super-senior counterparty’ via a
super-senior CDS. In this instance, the CDO acts as the protection-buyer, by agreeing to pay a
premium to the counterparty (the protection-seller) in return for a commitment from the
counterparty to pay compensation to the CDO in the event of any defaults in the reference
portfolio. It is the best part in terms of subordination.
SVaR (Stressed Value At Risk)
Stressed Value-At-Risk is analogous to the Historical VaR, but it is calculated for the time series of a
maximum stressed period in recent history.
(Core) Tier 1-ratio
[tier-1 capital] / [total weighted risks]. The calculation of the core tier-1 ratio does not include hybrid
instruments (but does include the core-capital securities sold to the Belgian and Flemish
governments).
Trading book
The trading book consists of positions in financial instruments and commodities held either with
trading intent or in order to hedge other elements of the trading book. Positions held for trading
intent are those held intentionally for resale in the short term and/or with the intent of benefiting
from actual or expected price movements in the short term or to lock in arbitrage profits.
TTC PD (Through-The-Cycle PD)
PD reflecting the one-year expected default rate averaged out over a longer period (contrast with
Point-in-time PD).
VaR (Value At Risk)
The unexpected loss in the fair value (= difference between the expected and worst case fair value),
at a certain confidence level and with a certain time horizon.

Risk report 2013 • KBC Group • 143

Verantwoordelijk uitgever: KBC Groep NV, Havenlaan 2, 1080 Brussel, België - 03-2014
www.kbc.com