kbc group - kbc bank · pdf filekbc group “risk, return & growth ... merrill lynch...
TRANSCRIPT
KBC Group
“Risk, Return & Growth - Getting the Balance right”Merrill Lynch Banking & Insurance Conference, October 2006
1
Important information for investors
� This presentation is provided for informational purposes only. It does not constitute an offer to sell or the solicitation to buy any security issued by the KBC Group.
� KBC believes that this presentation is reliable, although the information is condensed and therefore incomplete.
� This presentation contains forward-looking statements, involving numerous assumptions and uncertainties. The risk exists that these statements may not be fulfilled and that future developments differ materially. Moreover, KBC does not undertake any obligation to update the presentation in line with new developments.
� By reading this presentation, each investor is deemed to represent that it possesses sufficient expertise to understand the risks involved.
2
Introduction: strategy framework
REMINDER
KBC’s strategy framework include:� Focused business scope:
• Retail-, bancassurance- and wealth-management-oriented• Geographical focus on Belgium, CEE and selected Western
European markets (mostly Belgium’s neighbours)� Standalone basis� Conservative management style combined with a solid level of financial
strength / solvency� Shareholder orientation, strict capital discipline and steady dividend
growth
3
Introduction (2): business mix
REMINDER
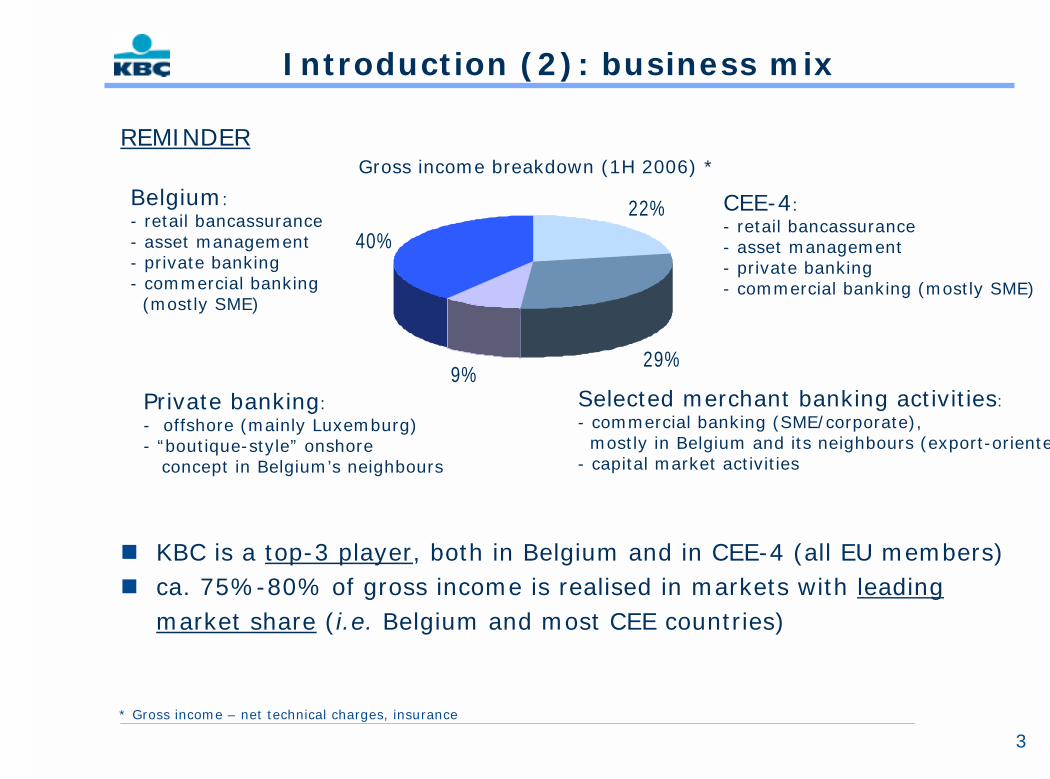
� KBC is a top-3 player, both in Belgium and in CEE-4 (all EU members)� ca. 75%-80% of gross income is realised in markets with leading
market share (i.e. Belgium and most CEE countries)
Gross income breakdown (1H 2006) *
Belgium:- retail bancassurance- asset management- private banking- commercial banking (mostly SME)
CEE-4:- retail bancassurance- asset management- private banking- commercial banking (mostly SME)
22%
29%9%
40%
Selected merchant banking activities:- commercial banking (SME/corporate), mostly in Belgium and its neighbours (export-oriented)
- capital market activities
Private banking:- offshore (mainly Luxemburg)- “boutique-style” onshore
concept in Belgium’s neighbours
* Gross income – net technical charges, insurance
4
Introduction (3): business developments
Over the past 12 months, we have been carrying out what we promised:
� Optimisation of Group structure:• Divestiture of non-core assets (Gevaert-related assets, insurance in
Ireland, private banking in Spain) for an amount of ca. 1.4 bn• Further simplification of the legal structure• Implementation of a new group management structure
� New investments:• Buyout of third-party stakes in CEE for an amount of ca. 0.8 bn
(incl. some small bolt-on acquisitions in Benelux private banking)• Support of organic growth in CEE by opening additional branches• Study of acquisition possibilities in EU candidate countries, while
maintaining strict capital discipline nevertheless� Share buy-back:
• Execution of the 1 bn euro 2006 programme (ca. 850m realised as at 30 September)
5
Introduction (4): financial track record
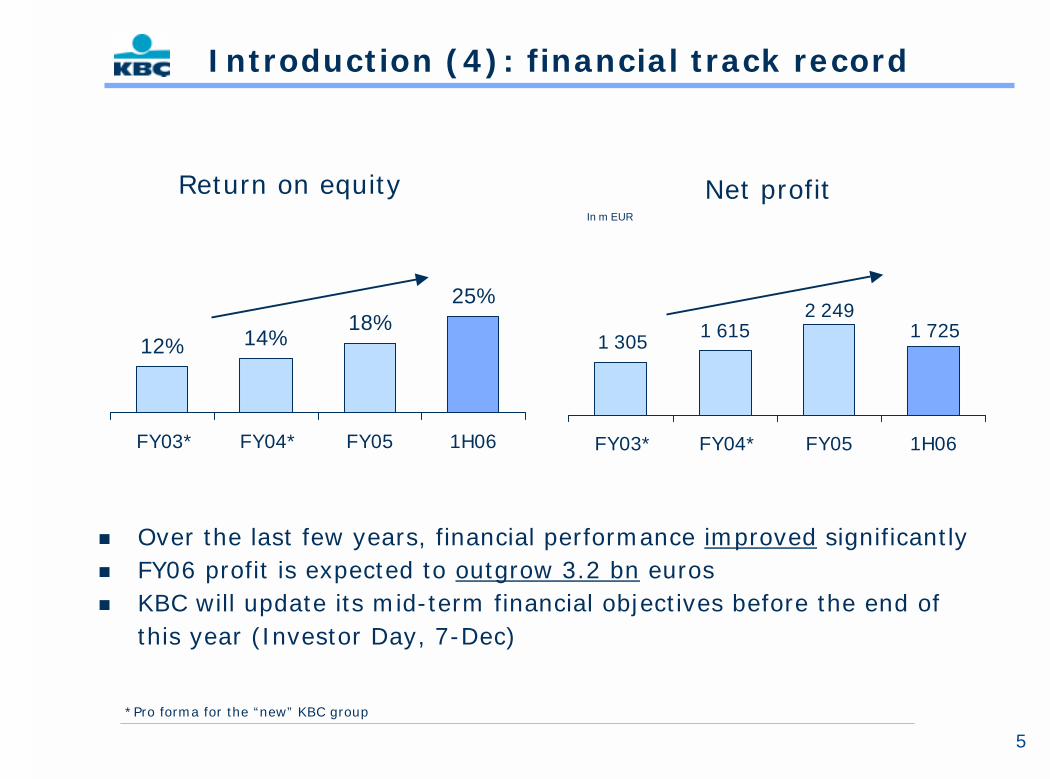
1 305 1 7251 6152 249
FY03* FY04* FY05 1H06
Net profitIn m EUR
12% 14%18%
25%
FY03* FY04* FY05 1H06
Return on equity
*Pro forma for the “new” KBC group
� Over the last few years, financial performance improved significantly� FY06 profit is expected to outgrow 3.2 bn euros� KBC will update its mid-term financial objectives before the end of
this year (Investor Day, 7-Dec)
6
1st dimension: “Growth”
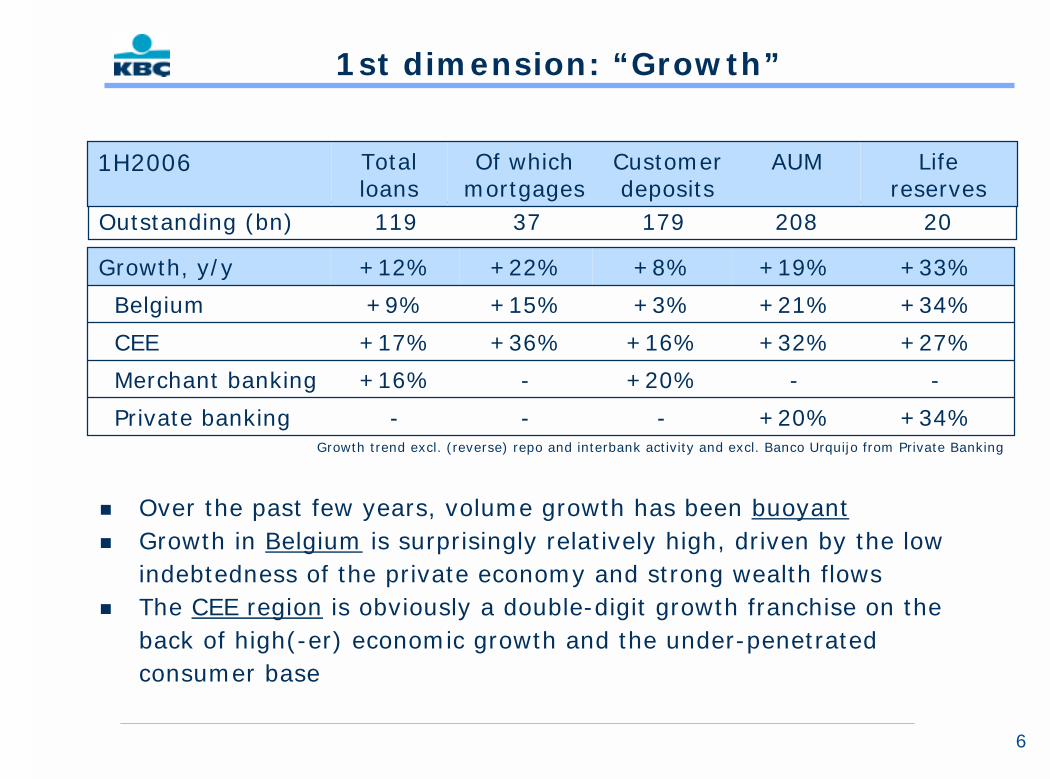
Growth trend excl. (reverse) repo and interbank activity and excl. Banco Urquijo from Private Banking
2020817937119Outstanding (bn)
AUMCustomer deposits
Life reserves
Of which mortgages
Total loans
1H2006
--+20%-+16%Merchant banking
+34%+20%---Private banking
+32%
+21%
+19%
+16%
+3%
+8% +33%+22%+12%Growth, y/y
+27%+36%+17%CEE
+34%+15%+9%Belgium
� Over the past few years, volume growth has been buoyant� Growth in Belgium is surprisingly relatively high, driven by the low
indebtedness of the private economy and strong wealth flows� The CEE region is obviously a double-digit growth franchise on the
back of high(-er) economic growth and the under-penetrated consumer base
7
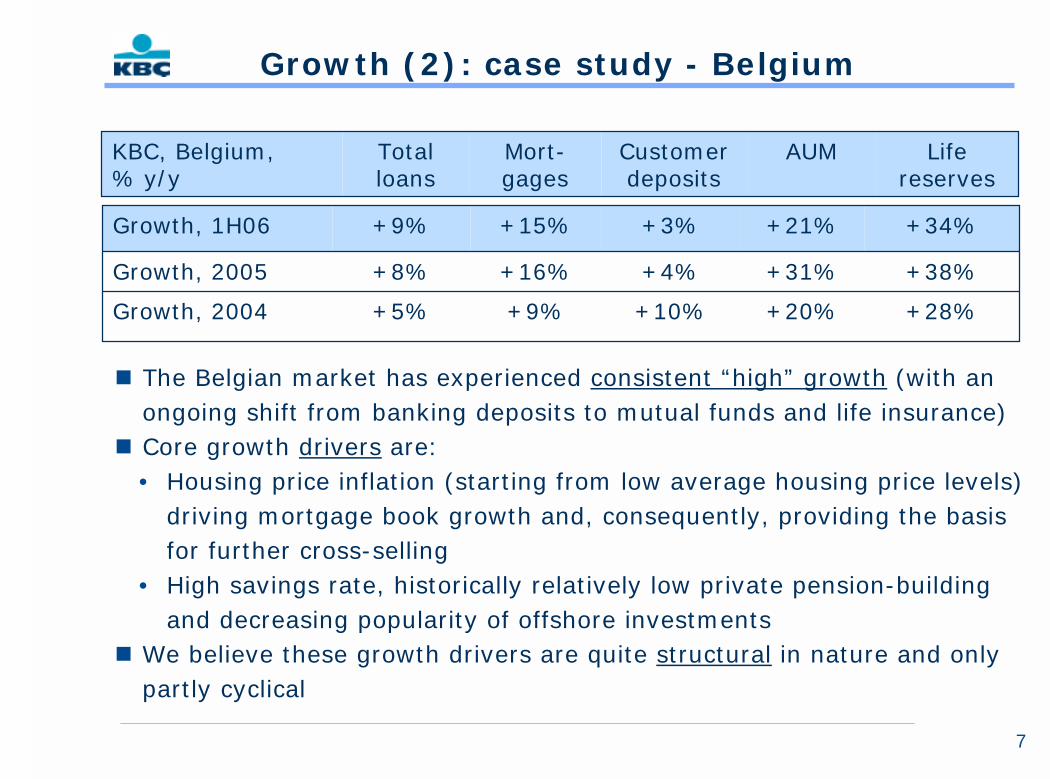
� The Belgian market has experienced consistent “high” growth (with an ongoing shift from banking deposits to mutual funds and life insurance)
� Core growth drivers are:• Housing price inflation (starting from low average housing price levels)
driving mortgage book growth and, consequently, providing the basis for further cross-selling
• High savings rate, historically relatively low private pension-building and decreasing popularity of offshore investments
� We believe these growth drivers are quite structural in nature and only partly cyclical
AUM Customer deposits
Lifereserves
Mort-gages
Total loans
KBC, Belgium,% y/y
+28%+20%+10%+9%+5%Growth, 2004
+38%+31%+4%+16%+8%Growth, 2005
+21%+3% +34%+15%+9%Growth, 1H06
Growth (2): case study - Belgium
8
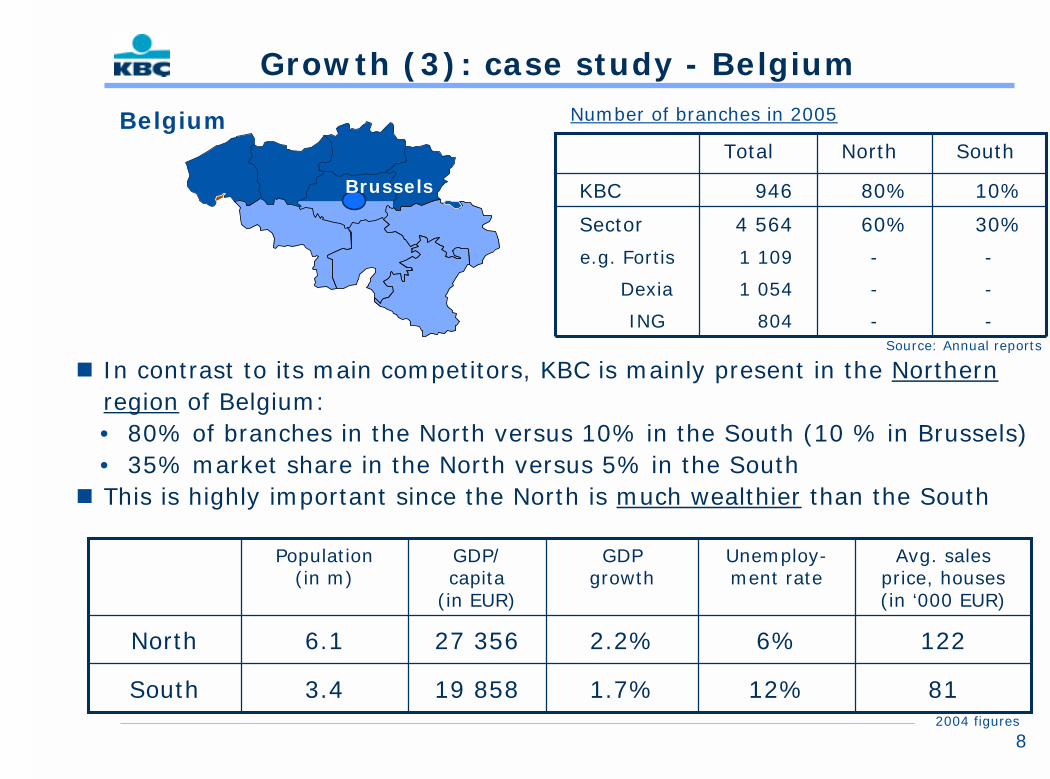
Growth (3): case study - Belgium
� In contrast to its main competitors, KBC is mainly present in the Northernregion of Belgium:• 80% of branches in the North versus 10% in the South (10 % in Brussels)• 35% market share in the North versus 5% in the South
� This is highly important since the North is much wealthier than the South
12%
6%
Unemploy-ment rate
3.4
6.1
Population(in m)
1.7%
2.2%
GDP growth
8119 858South
12227 356North
Avg. sales price, houses (in ‘000 EUR)
GDP/capita
(in EUR)
30%60%4 564Sector
--1 109e.g. Fortis
--1 054Dexia
--804ING
10%80%946KBC
SouthNorthTotal
Number of branches in 2005Belgium
Brussels
Source: Annual reports
2004 figures
9
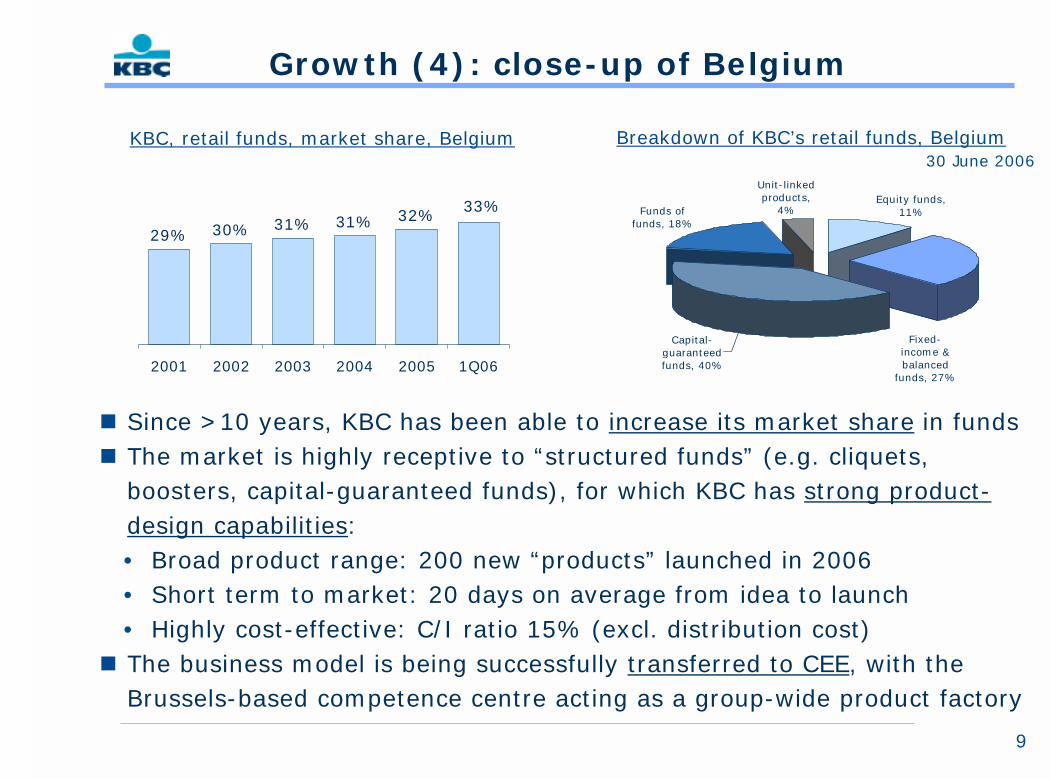
Growth (4): close-up of Belgium
� Since >10 years, KBC has been able to increase its market share in funds� The market is highly receptive to “structured funds” (e.g. cliquets,
boosters, capital-guaranteed funds), for which KBC has strong product-design capabilities:• Broad product range: 200 new “products” launched in 2006• Short term to market: 20 days on average from idea to launch• Highly cost-effective: C/I ratio 15% (excl. distribution cost)
� The business model is being successfully transferred to CEE, with the Brussels-based competence centre acting as a group-wide product factory
29% 30% 31% 31% 32% 33%
2001 2002 2003 2004 2005 1Q06
KBC, retail funds, market share, Belgium
Equity funds, 11%Funds of
funds, 18%
Unit-linked products,
4%
Capital-guaranteed funds, 40%
Fixed-income & balanced
funds, 27%
Breakdown of KBC’s retail funds, Belgium30 June 2006
10
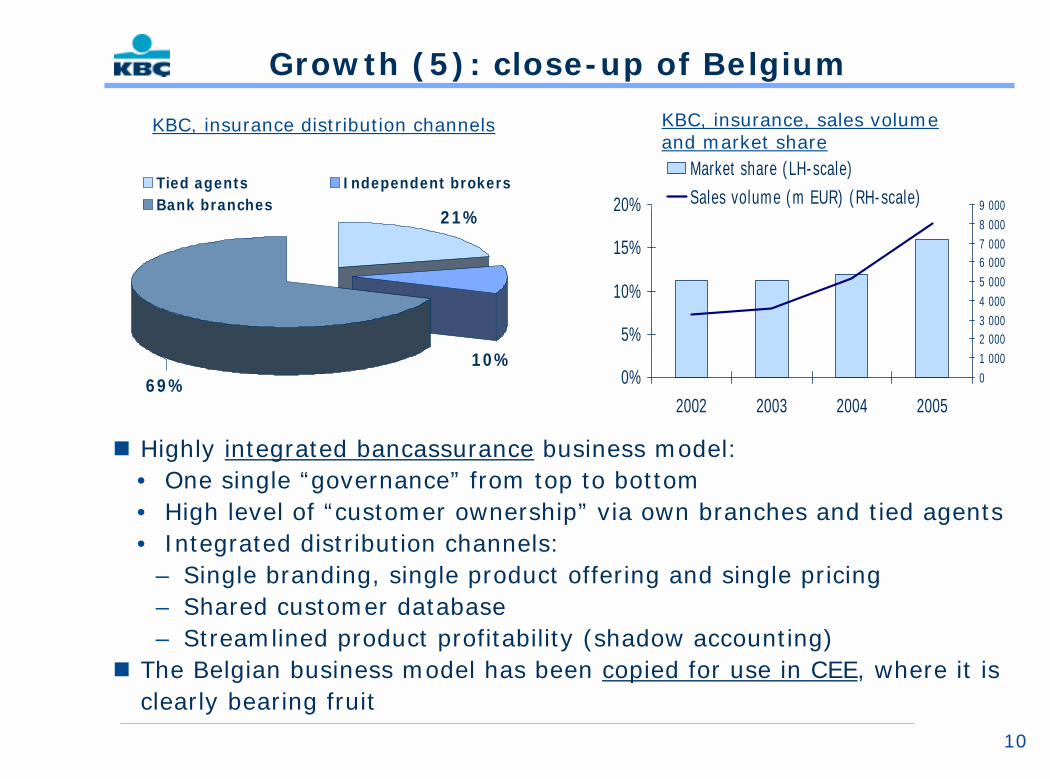
Growth (5): close-up of Belgium
� Highly integrated bancassurance business model:• One single “governance” from top to bottom• High level of “customer ownership” via own branches and tied agents• Integrated distribution channels:
– Single branding, single product offering and single pricing– Shared customer database– Streamlined product profitability (shadow accounting)
� The Belgian business model has been copied for use in CEE, where it is clearly bearing fruit
21%
69%10%
Tied agents Independent brokersBank branches
0%
5%
10%
15%
20%
2002 2003 2004 200501 0002 0003 0004 0005 0006 0007 0008 0009 000
Market share (LH-scale)Sales volume (m EUR) (RH-scale)
KBC, insurance distribution channels KBC, insurance, sales volume and market share
11
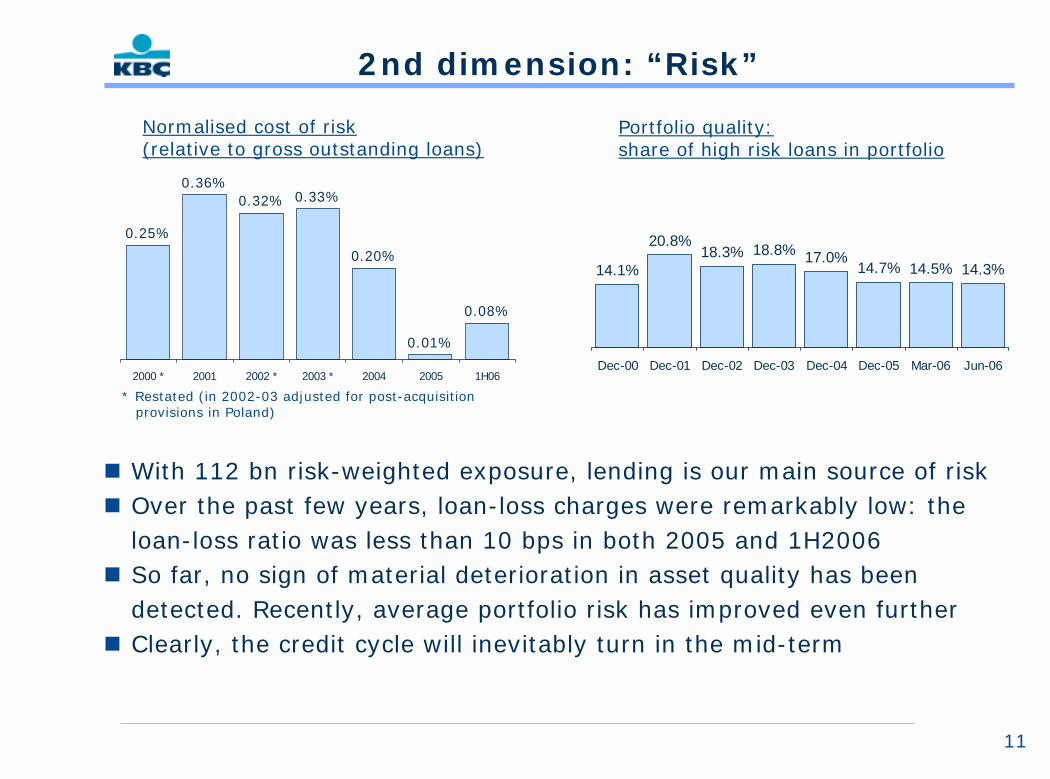
2nd dimension: “Risk”
0.36%
0.20%
0.08%
0.33%
0.25%
0.01%
0.32%
2000 * 2001 2002 * 2003 * 2004 2005 1H06
14.1%
20.8%18.3% 18.8% 17.0%
14.7% 14.5% 14.3%
Dec-00 Dec-01 Dec-02 Dec-03 Dec-04 Dec-05 Mar-06 Jun-06
� With 112 bn risk-weighted exposure, lending is our main source of risk� Over the past few years, loan-loss charges were remarkably low: the
loan-loss ratio was less than 10 bps in both 2005 and 1H2006� So far, no sign of material deterioration in asset quality has been
detected. Recently, average portfolio risk has improved even further� Clearly, the credit cycle will inevitably turn in the mid-term
* Restated (in 2002-03 adjusted for post-acquisitionprovisions in Poland)
Portfolio quality:share of high risk loans in portfolio
Normalised cost of risk(relative to gross outstanding loans)
12
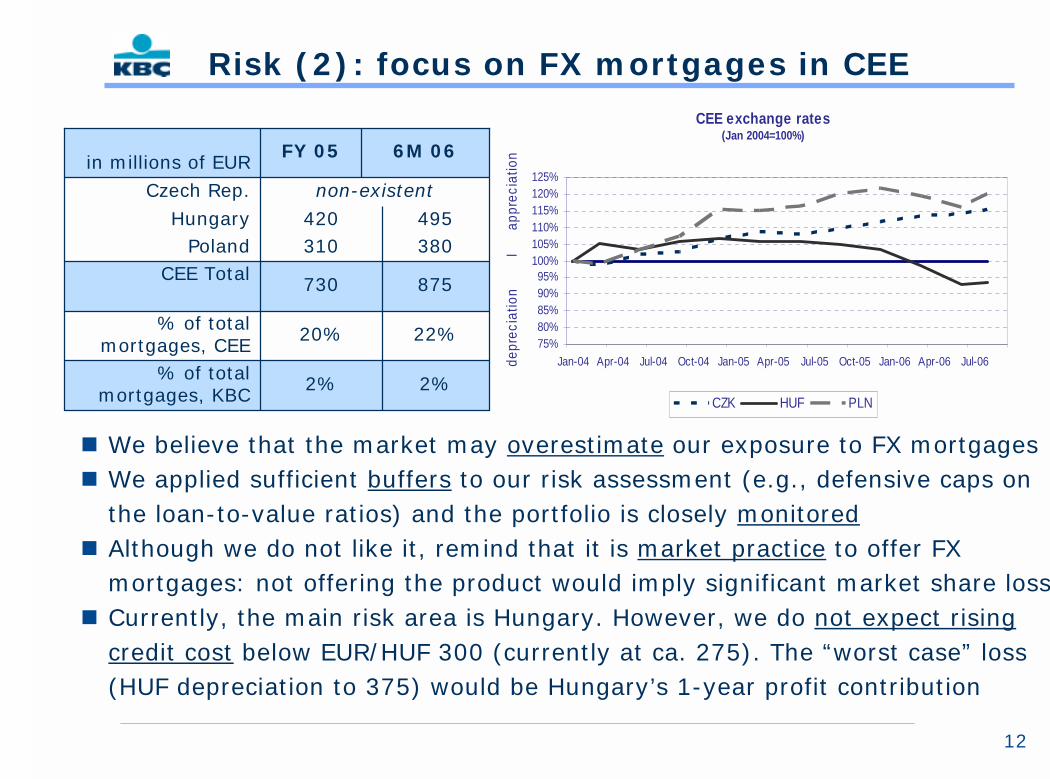
Risk (2): focus on FX mortgages in CEE
22%20%% of total mortgages, CEE
2%
730
310420
non-existent
FY 05
2%
875
380495
6M 06
% of total mortgages, KBC
CEE TotalPoland
Hungary
Czech Rep.in millions of EUR
� We believe that the market may overestimate our exposure to FX mortgages� We applied sufficient buffers to our risk assessment (e.g., defensive caps on
the loan-to-value ratios) and the portfolio is closely monitored� Although we do not like it, remind that it is market practice to offer FX
mortgages: not offering the product would imply significant market share loss� Currently, the main risk area is Hungary. However, we do not expect rising
credit cost below EUR/HUF 300 (currently at ca. 275). The “worst case” loss(HUF depreciation to 375) would be Hungary’s 1-year profit contribution
CEE exchange rates (Jan 2004=100%)
75%80%85%90%95%
100%105%110%115%120%125%
Jan-04 Apr-04 Jul-04 Oct-04 Jan-05 Apr-05 Jul-05 Oct-05 Jan-06 Apr-06 Jul-06depr
ecia
tion
I
appr
ecia
tion
CZK HUF PLN
13
Risk (3): market risk
Banking book (simplified):� The entire loan book is hedged
(no interest-rate risk). However, the surplus of bank deposits to loans is invested in treasury bonds (ca. 3-yrs duration), which intentionally creates an interest-rate mismatch
� The P&L impact of a simulated parallel market rate shift is quasizero. As at 30-Jun-06, a simulated flattening of the yield curve (+50 bps ECB-rate, +25 bps deposit re-pricing and flat LT-yields) would negatively impact 2006 NII by ca. 35m (pre-tax)
Trading book:� The trading activities focus on
currency and fixed-income products (predominantly client-driven), on the one hand, and some skills-based niche activities in the derivatives markets, on the other
� Average value-at-risk (10d-holding, 99% confidence,) in 1H06 stood at:• Money and debt capital
markets: ca. 20m• Equity and credit derivatives
markets: ca. 34m• Cash equity markets: ca. 3m
14
Risk (4): insurance risk (life)
� The cross-selling of insurance products (life/non-life) is one of the key features in enhancing return levels in our home markets
� We have ca. 20 bn life reserves on the balance sheet, the bulk of which are investments-oriented, typically collected as lump-sum amounts in the retail market.
� We believe our underwriting policy has been consistently conservative:• 75% of current sales (1H2006) is unit-linked business, generating
recurring, “risk-free” commission income• In the “guaranteed rate” business, rates are typically guaranteed for an
8-yr period and do not apply for future premium payments (which obviously facilitate ALM matching)
• Important: we underwrite very little annuity business (typically, lump-sum capital amounts are paid at maturity), which avoids significant exposure to longevity risk
� The embedded value of the insurance business (total) stands at 3.5 bn(31-Dec-05), with the 2005 value of new life business at 98m (new business margin of 17%)
15
Risk (5): insurance risk (non-life)
� We underwrite ca. 1.7 bn non-life premiums per year (2005 figure) and we believe our underwriting policy has been consistently conservative:• Our non-life franchise is predominantly a “private persons’” business
(low level of corporate risk), with car- and fire insurance counting for 73% of earned premiums
• 75% of the business is underwritten via “own” distribution channels(bank branches, tied agents) which allow us to stick to strict underwriting discipline
• Our combined ratio (91% in 1H2006) has been consistently lower than the sector average and we feel comfortable keeping it at around 95% over-the-cycle
• Our claims-coverage ratio (claims paid relative to earned premiums) stands at a stable 178% and run-off triangles year after year show evidence that provision levels are adequate, even conservative
16
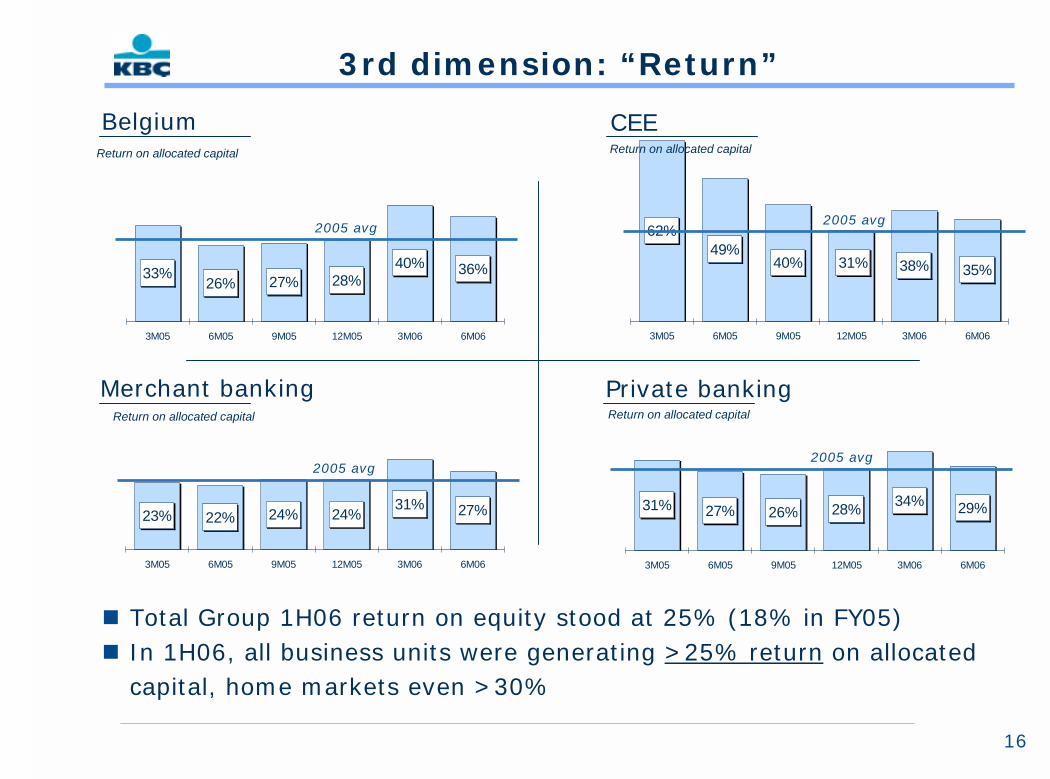
23% 22% 24% 24%31% 27%
3M05 6M05 9M05 12M05 3M06 6M06
31% 27% 26% 28% 34% 29%
3M05 6M05 9M05 12M05 3M06 6M06
33%26% 27% 28%
40% 36%
3M05 6M05 9M05 12M05 3M06 6M06
62%49%
40% 38% 35%31%
3M05 6M05 9M05 12M05 3M06 6M06
Belgium CEE
Merchant banking Private banking
3rd dimension: “Return”
� Total Group 1H06 return on equity stood at 25% (18% in FY05)� In 1H06, all business units were generating >25% return on allocated
capital, home markets even >30%
Return on allocated capital
Return on allocated capital Return on allocated capital
Return on allocated capital
2005 avg
2005 avg 2005 avg
2005 avg
17
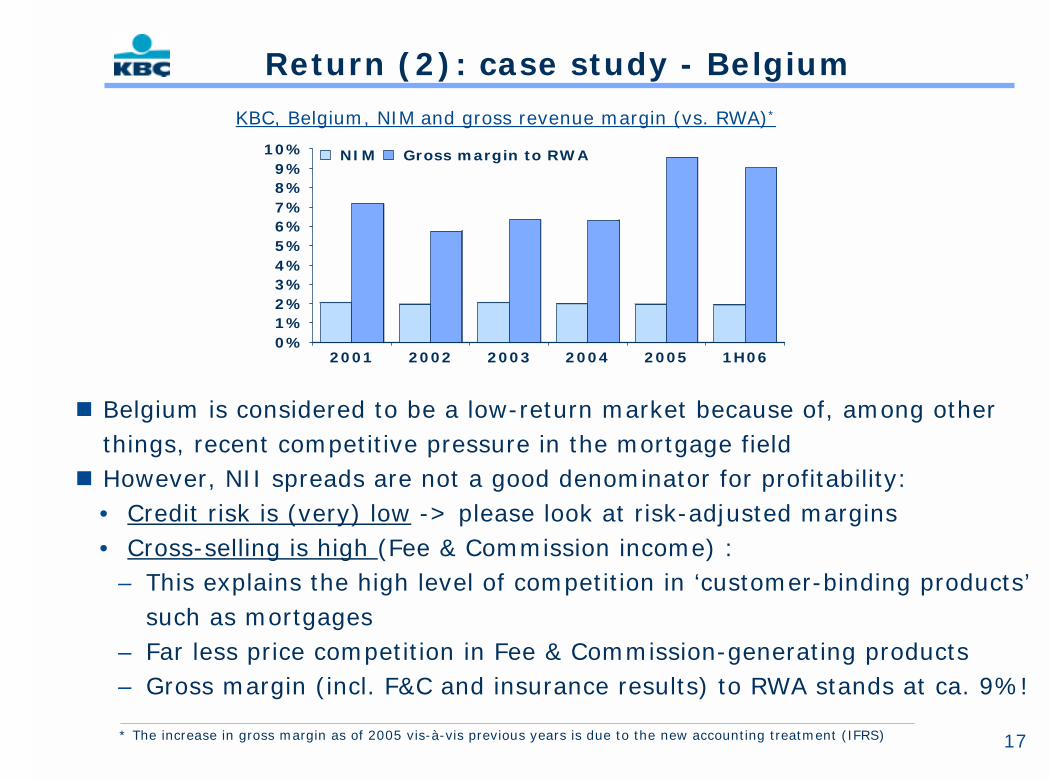
� Belgium is considered to be a low-return market because of, among other things, recent competitive pressure in the mortgage field
� However, NII spreads are not a good denominator for profitability:• Credit risk is (very) low -> please look at risk-adjusted margins• Cross-selling is high (Fee & Commission income) :
– This explains the high level of competition in ‘customer-binding products’ such as mortgages
– Far less price competition in Fee & Commission-generating products– Gross margin (incl. F&C and insurance results) to RWA stands at ca. 9%!
0%1%2%3%4%5%6%7%8%9%
10%
2001 2002 2003 2004 2005 1H06
NIM Gross margin to RWA
KBC, Belgium, NIM and gross revenue margin (vs. RWA)*
* The increase in gross margin as of 2005 vis-à-vis previous years is due to the new accounting treatment (IFRS)
Return (2): case study - Belgium
18
The end
� We believe that we can offer you an attractive “balance”:• Interesting growth potential in Belgium and CEE, boosted by a
“winning” bancassurance business model• Modest risk profile (e.g., moderated “emerging market risk”)• Solid return levels
� We will update our mid-term strategy and quantified growth/return targets before the end of the year (Investor Day, 7-Dec-06)
“Risk, Return & Growth - Getting the Balance right”

Additional information
20
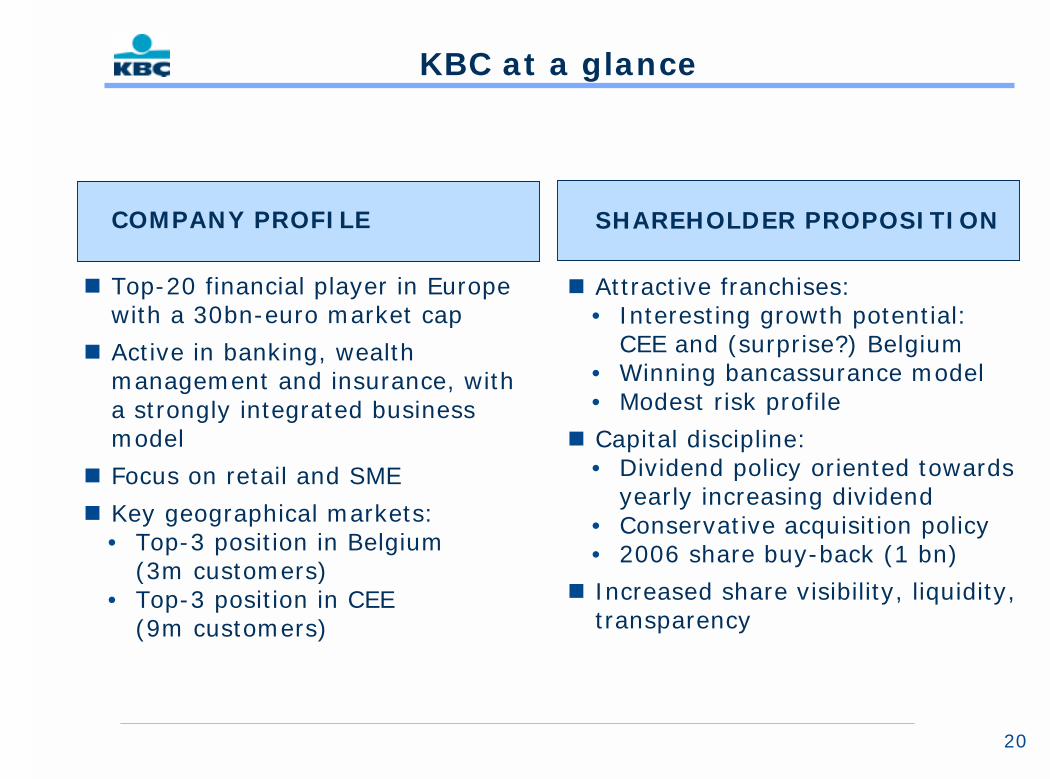
KBC at a glance
COMPANY PROFILE
� Top-20 financial player in Europe with a 30bn-euro market cap
� Active in banking, wealth management and insurance, with a strongly integrated business model
� Focus on retail and SME
� Key geographical markets:• Top-3 position in Belgium
(3m customers)• Top-3 position in CEE
(9m customers)
SHAREHOLDER PROPOSITION
� Attractive franchises:• Interesting growth potential:
CEE and (surprise?) Belgium• Winning bancassurance model• Modest risk profile
� Capital discipline:• Dividend policy oriented towards
yearly increasing dividend• Conservative acquisition policy• 2006 share buy-back (1 bn)
� Increased share visibility, liquidity, transparency
21
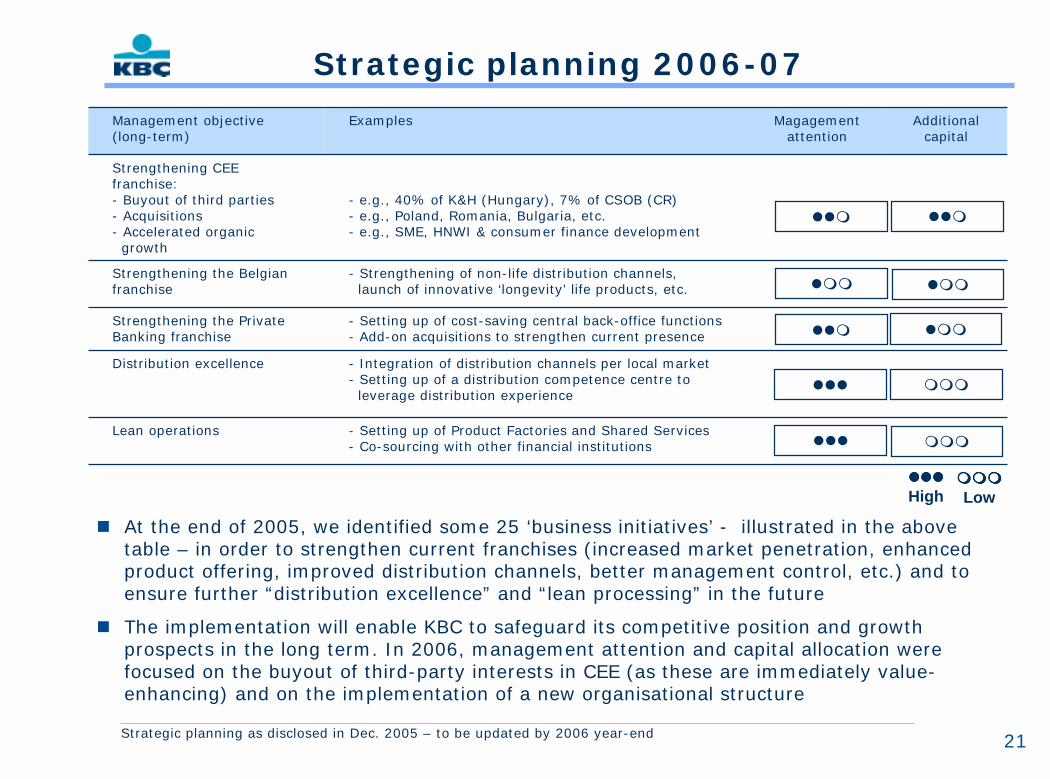
Magagementattention
- Setting up of Product Factories and Shared Services- Co-sourcing with other financial institutions
- Integration of distribution channels per local market- Setting up of a distribution competence centre to leverage distribution experience
- Setting up of cost-saving central back-office functions- Add-on acquisitions to strengthen current presence
- Strengthening of non-life distribution channels, launch of innovative ‘longevity’ life products, etc.
- e.g., 40% of K&H (Hungary), 7% of CSOB (CR)- e.g., Poland, Romania, Bulgaria, etc.- e.g., SME, HNWI & consumer finance development
Examples Additional capital
Lean operations
Distribution excellence
Strengthening the Belgian franchise
Strengthening the Private Banking franchise
Strengthening CEE franchise:- Buyout of third parties- Acquisitions- Accelerated organic growth
Management objective(long-term)
Strategic planning 2006-07
� At the end of 2005, we identified some 25 ‘business initiatives’ - illustrated in the above table – in order to strengthen current franchises (increased market penetration, enhanced product offering, improved distribution channels, better management control, etc.) and to ensure further “distribution excellence” and “lean processing” in the future
� The implementation will enable KBC to safeguard its competitive position and growth prospects in the long term. In 2006, management attention and capital allocation were focused on the buyout of third-party interests in CEE (as these are immediately value-enhancing) and on the implementation of a new organisational structure
���
���
���
���
���
���
���
���
��� ���
������������
High������������
Low
Strategic planning as disclosed in Dec. 2005 – to be updated by 2006 year-end
22
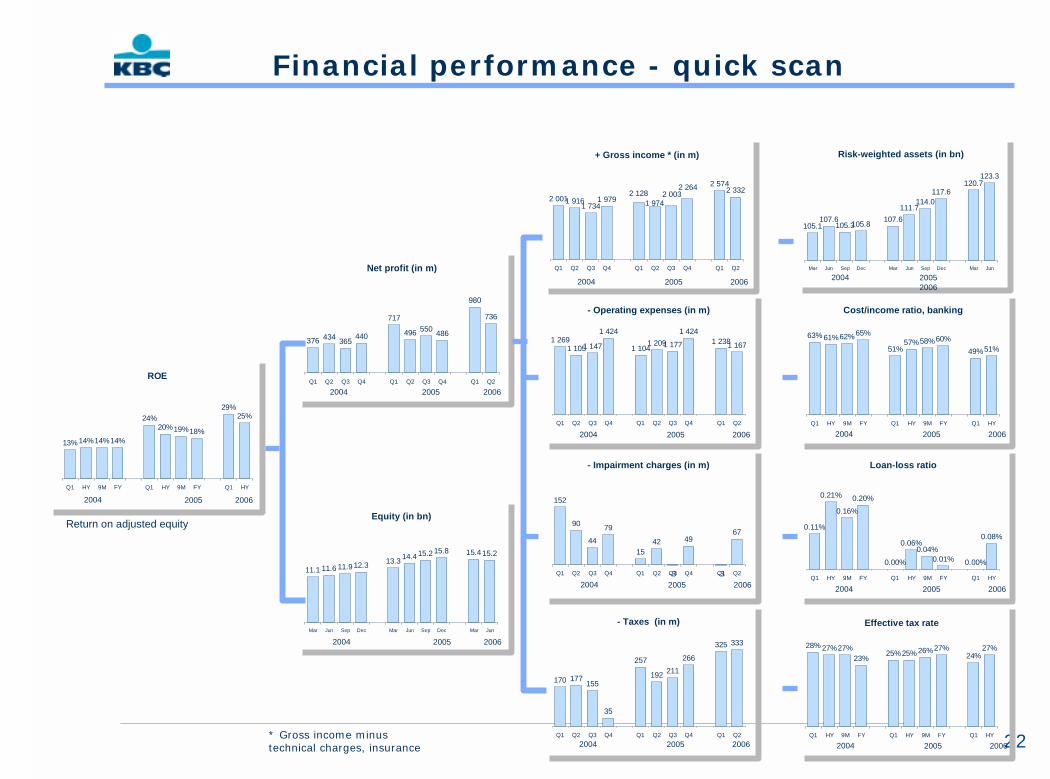
Financial performance - quick scan
ROE
13% 14%14%14%
24%20%19%18%
29%25%
Q1 HY 9M FY Q1 HY 9M FY Q1 HY
Equity (in bn)
11.1 11.6 11.9 12.3 13.3 14.4 15.2 15.8 15.4 15.2
Mar Jun Sep Dec Mar Jun Sep Dec Mar Jun
Net profit (in m)
376 434 365 440
717
496 550 486
980
736
Q1 Q2 Q3 Q4 Q1 Q2 Q3 Q4 Q1 Q2
+ Gross income * (in m)
2 0011 9161 7341 979
2 5742 3322 003
1 974
2 2642 128
Q1 Q2 Q3 Q4 Q1 Q2 Q3 Q4 Q1 Q2
- Operating expenses (in m)
1 2691 1051 147
1 424
1 1041 2091 177
1 4241 2381 167
Q1 Q2 Q3 Q4 Q1 Q2 Q3 Q4 Q1 Q2
- Impairment charges (in m)
152
90
44
79
1542
-3
49
-3
67
Q1 Q2 Q3 Q4 Q1 Q2 Q3 Q4 Q1 Q2
- Taxes (in m)
170 177155
35
257
192 211266
325 333
Q1 Q2 Q3 Q4 Q1 Q2 Q3 Q4 Q1 Q2
Cost/income ratio, banking
63% 61%62%65%
51%57%58%60%
49%51%
Q1 HY 9M FY Q1 HY 9M FY Q1 HY
Loan-loss ratio
0.11%
0.21%
0.16%0.20%
0.00%
0.06%0.04%
0.01% 0.00%
0.08%
Q1 HY 9M FY Q1 HY 9M FY Q1 HY
Effective tax rate
28% 27%27%23% 25%25% 26%27%
24%27%
Q1 HY 9M FY Q1 HY 9M FY Q1 HY
2004 2005 2006
2004 2005 2006
* Gross income minus technical charges, insurance
Return on adjusted equity
2004 2005 2006
2004 2005 2006
2004 2005 2006
2004 2005 2006
2004 2005 2006
2004 2005 2006
2004 2005 2006
2004 2005 2006
Risk-weighted assets (in bn)
105.1107.6
105.3105.8 107.6111.7
114.0117.6
120.7123.3
Mar Jun Sep Dec Mar Jun Sep Dec Mar Jun
2004 2005 2006
23
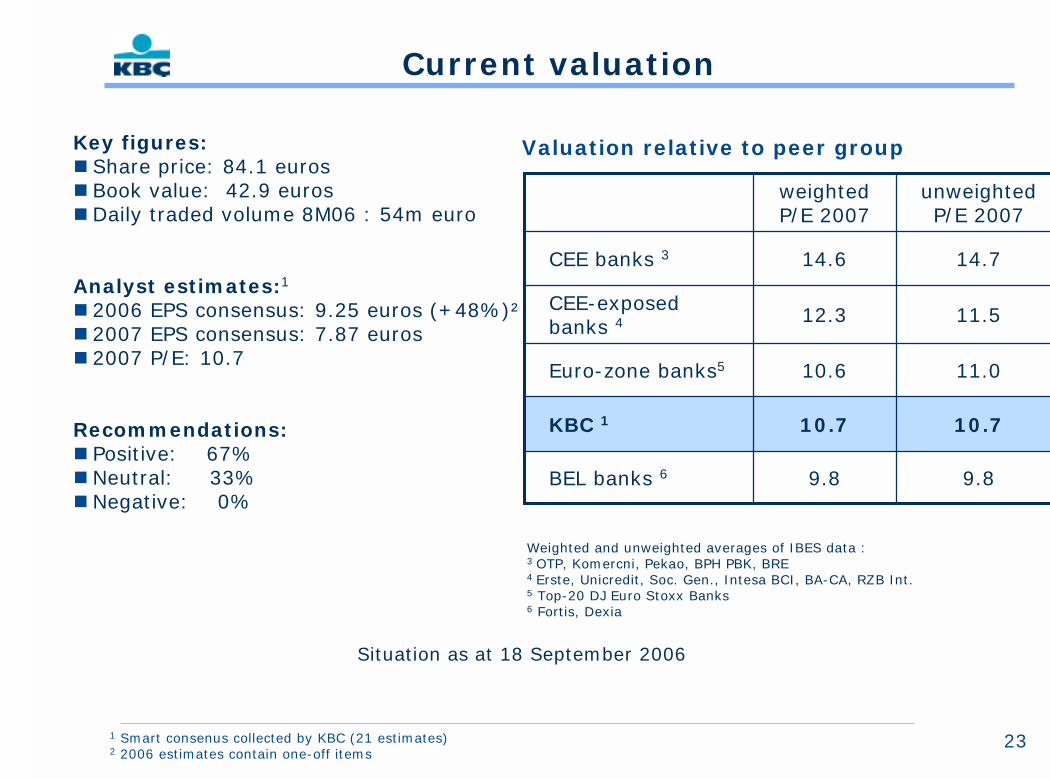
Current valuation
Key figures: � Share price: 84.1 euros� Book value: 42.9 euros� Daily traded volume 8M06 : 54m euro
Analyst estimates:1
� 2006 EPS consensus: 9.25 euros (+48%)²� 2007 EPS consensus: 7.87 euros� 2007 P/E: 10.7
Recommendations:� Positive: 67%� Neutral: 33%� Negative: 0%
Situation as at 18 September 2006
1 Smart consenus collected by KBC (21 estimates)2 2006 estimates contain one-off items
9.89.8BEL banks 6
10.710.7KBC 1
11.010.6Euro-zone banks5
11.512.3CEE-exposedbanks 4
14.714.6CEE banks 3
unweightedP/E 2007
weightedP/E 2007
Weighted and unweighted averages of IBES data :3 OTP, Komercni, Pekao, BPH PBK, BRE4 Erste, Unicredit, Soc. Gen., Intesa BCI, BA-CA, RZB Int.5 Top-20 DJ Euro Stoxx Banks6 Fortis, Dexia
Valuation relative to peer group
24
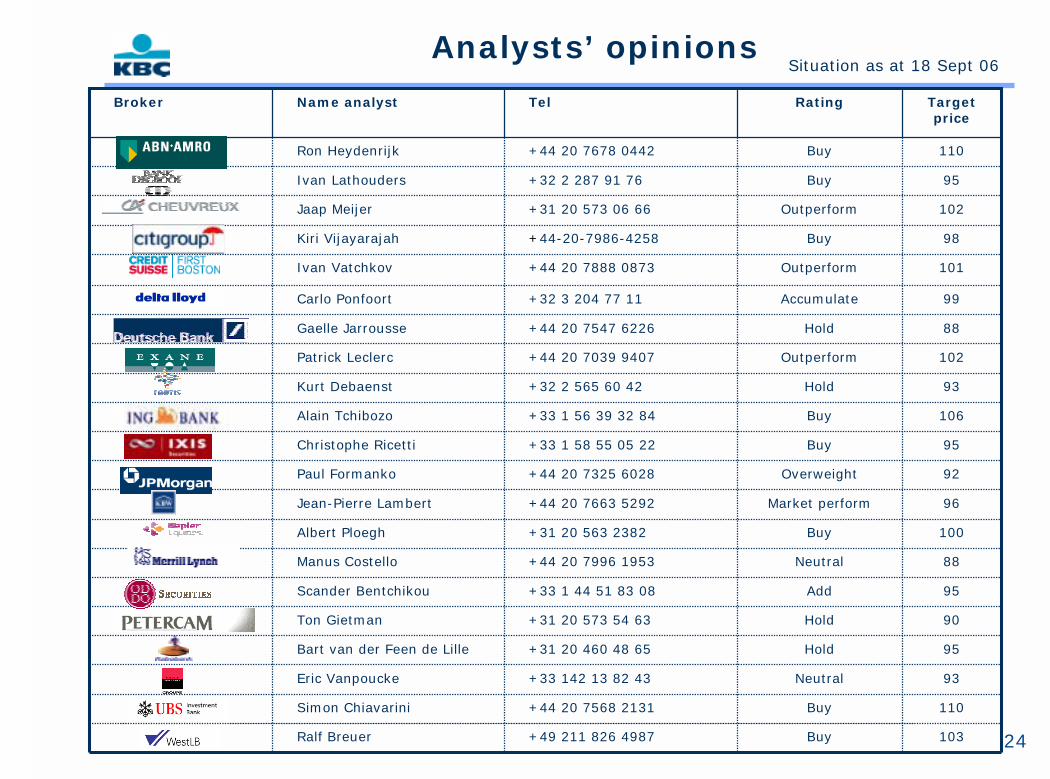
Analysts’ opinions
98Buy+44-20-7986-4258Kiri Vijayarajah
90Hold+31 20 573 54 63 Ton Gietman
95Hold+31 20 460 48 65Bart van der Feen de Lille
93Neutral+33 142 13 82 43Eric Vanpoucke
93Hold+32 2 565 60 42Kurt Debaenst
106Buy+33 1 56 39 32 84Alain Tchibozo
92Overweight+44 20 7325 6028Paul Formanko
95Buy+33 1 58 55 05 22Christophe Ricetti
96Market perform+44 20 7663 5292Jean-Pierre Lambert
100Buy+31 20 563 2382Albert Ploegh
88Neutral+44 20 7996 1953Manus Costello
95Buy+32 2 287 91 76Ivan Lathouders
103Buy+49 211 826 4987Ralf Breuer
110Buy+44 20 7568 2131Simon Chiavarini
95Add+33 1 44 51 83 08Scander Bentchikou
102Outperform+44 20 7039 9407Patrick Leclerc
88Hold+44 20 7547 6226Gaelle Jarrousse
99Accumulate+32 3 204 77 11Carlo Ponfoort
101Outperform+44 20 7888 0873Ivan Vatchkov
102Outperform+31 20 573 06 66Jaap Meijer
110Buy+44 20 7678 0442Ron Heydenrijk
Target price
RatingTelName analystBroker
Situation as at 18 Sept 06
25
Contact information
Investor Relations Office
Luc Cool, Director of IR
E-mail: [email protected] to www.kbc.com for the latest update