pickerington local school district – fairfield county
TRANSCRIPT
PICKERINGTON LOCAL SCHOOL DISTRICT – FAIRFIELD COUNTY ASSUMPTIONS FOR FIVE-YEAR FINANCIAL FORECAST
PROJECTED FISCAL YEARS ENDING JUNE 30, 2019 THROUGH JUNE 30, 2023
INTRODUCTION TO THE FIVE YEAR FORECAST AND UNDERSTANDING THE PURPOSE OF THE FIVE YEAR FORECAST The Ohio Department of Education provides the following guidance on how to read a Five Year Forecast: http://education.ohio.gov/Topics/Finance-and-Funding/Five-Year-Forecast/How-to-Read-a-Five-Year-Forecast A forecast is somewhat like a painting of the future based upon a snapshot of today. That snapshot, however, will be adjusted and the further into the future the forecast extends, the more likely it is that the projections will deviate from actual experience. A variety of events will ultimately impact the latter years of the forecast, such as state budgets (adopted every two years), tax levies (new/renewal/ replacement), salary increases, or businesses moving in or out of the district. The five-year forecast is viewed as a key management tool and must be updated periodically. In Ohio, most school districts understand how they will manage their finances in the current year. The five-year forecast encourages district management teams to examine future years’ projections and identify when challenges will arise. This then helps district management to be proactive in meeting those challenges. School districts are encouraged to update their forecasts with ODE when events take place that will significantly change their forecast or, at a minimum, when required under statute. In a financial forecast, the numbers only tell a small part of the story. For the numbers to be meaningful, the reader must review and consider the Assumptions to the Financial Forecast before drawing conclusions or using the data as a basis for other calculations. The assumptions are very important to understanding the rationale of the numbers, particularly when a significant increase or decrease is reflected. PURPOSES/OBJECTIVES OF THE FIVE-YEAR FORECAST Here are at least three purposes or objectives of the five-year forecast:
(1) To engage the local board of education and the community in long range planning and discussions of financial issues facing the school district
(2) To serve as a basis for determining the school district’s ability to sign the certificate required by O.R.C. §5705.412, commonly known as the “412 certificate”
(3) To provide a method for the Department of Education and Auditor of State to identify schools districts with potential financial problems
O.R.C. and O.A.C. REQUIREMENTS O.R.C. §5705.391 and O.A.C. 3301-92-04 require a Board of Education (BOE) to submit a five-year projection of operational revenues and expenditures along with assumptions to the Department of Education prior to October 31 of each fiscal year and to update this forecast between April 1 and May 31 of each fiscal year. ODE encourages school districts to update their forecast whenever events take place that will significantly change the forecast.
Required funds to be included in the forecast are:
General funds (001) Any special cost center associated with general fund money Emergency levy funds (016) Any debt service (002) activity that would otherwise have gone to the general fund Education Jobs Fund (504)
For the Pickerington Local School District, this forecast is required to consider the general fund and the other special cost centers associated with general fund money. Additionally, a small portion of Ed Jobs funding, which was provided by the federal government via stimulus funding, is also included for fiscal year 2013. The following definitions will assist the reader/community member as he/she reads the assumptions to the forecast, or takes part in discussions about the forecast. DEFINITIONS
412 Certificates – ORC 5705.412 requires the treasurer, superintendent, and president of the board of education to certify that adequate revenues will be available to maintain all personnel and programs for the current fiscal year and for a number of days in the succeeding fiscal years. 412 Certificates must be attached to:
Appropriations for the current fiscal year Qualifying contracts covering the term of contract Wage and salary schedule for the term of contract Negotiated agreement(s) and contracts for benefits
Encumbrances – Money obligated to pay for any purchase. An end of year encumbrance is money obligated in the current fiscal year to be paid in the next fiscal year. Expenditures – The spending of any public money for a specified purpose as approved by the BOE policy and procedures. Fiscal Year – In education and state government, the fiscal year runs from July 1 through June 30, and each fiscal year is dated by the ending date. Example: FY12 would start July 1, 2011 and end June 30, 2012. Revenues – Receipts generated from property taxes, school district income taxes, state foundation formula, and local monies (such as donations, fees, tuition, etc.).

Finally, since the preparation of a meaningful five-year forecast is as much an art as it is a science and entails many intricacies, it is recommended that you contact the Treasurer/Chief Fiscal Officer of the Pickerington Local School District, Ryan Jenkins at (614) 834-2140 to discuss any questions you may have. You may also email him at [email protected].
Rest of Page Left Intentionally Blank
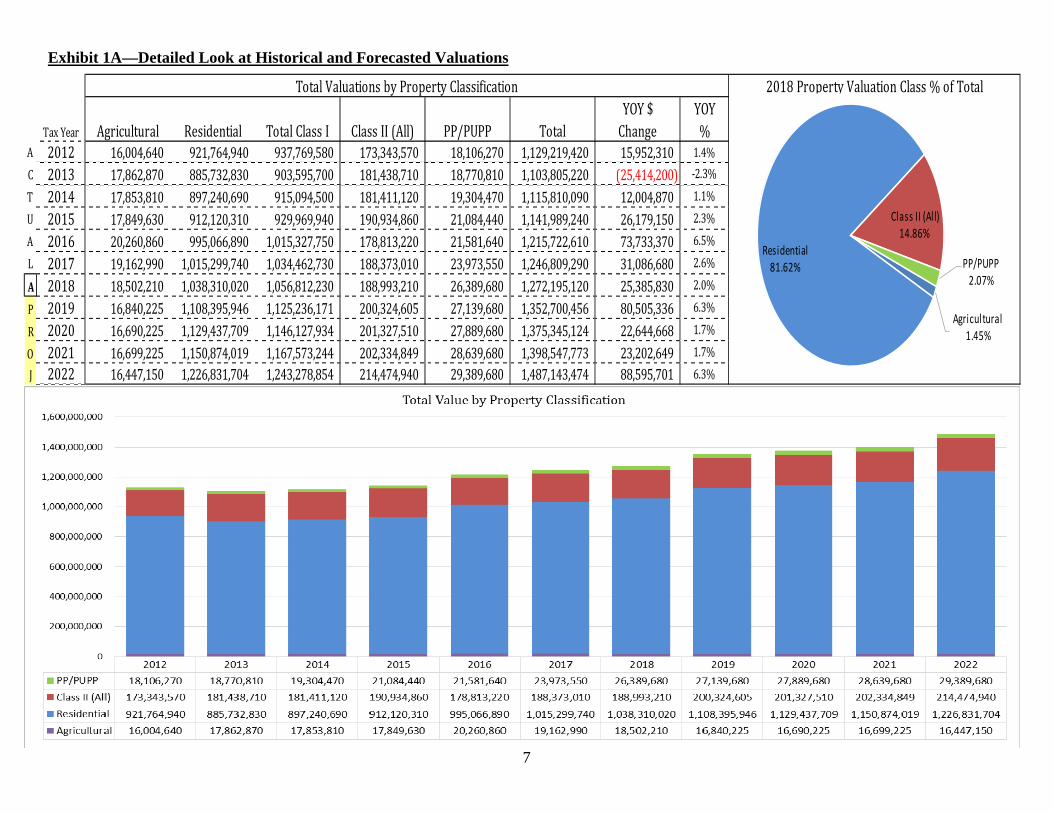
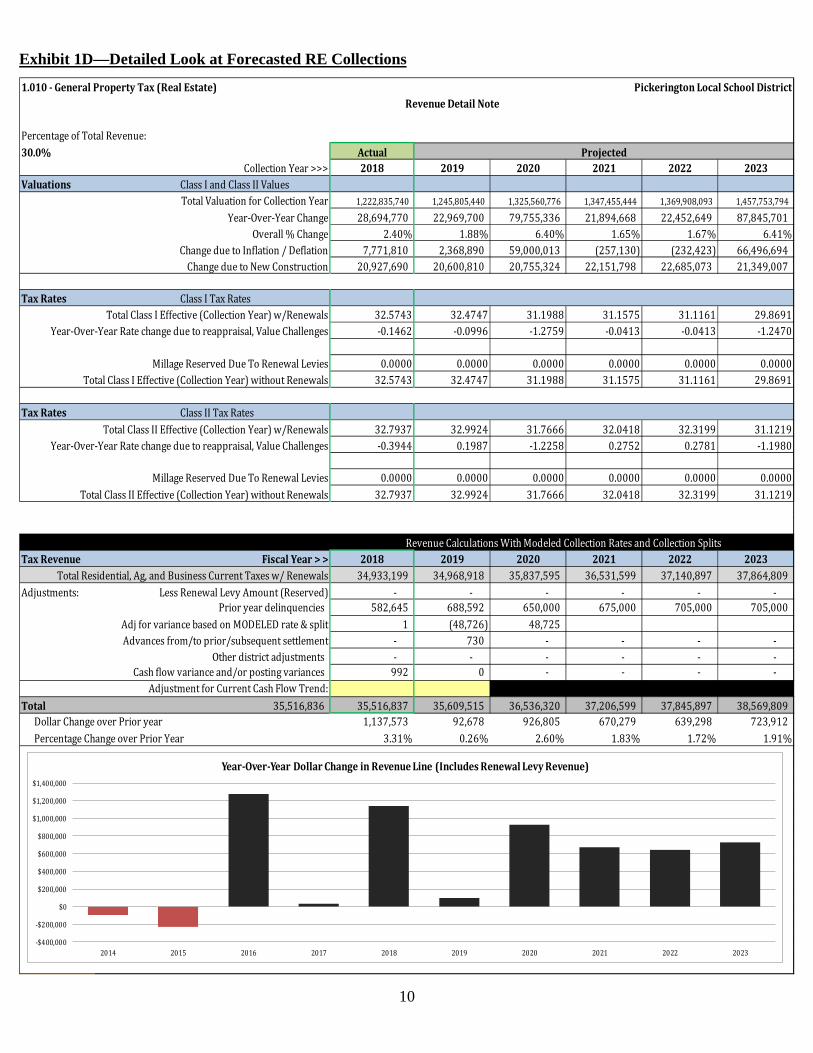
REVENUES LINE 1.010--General Property Tax (Real Estate) Property taxes currently comprise 30.0% of total general fund revenue—a significant source of revenue for the District. Changes in valuation due to inflation/reappraisal are ‘offset’ by increases or decreases in millage so that the District receives the same amount of tax revenue as in the previous year. The District will undergo a complete reappraisal in 2019, and a triennial update in 2022. The forecasted increase in overall residential/agricultural values (Class I values) due to reappraisal/inflation for 2019 is 4.56%, and it is 4.69% in 2022. On the Class II (Commercial/Industrial) side, the 2019 and 2022 forecasted increases due to reappraisal/inflation are each 4.31% respectively. New construction in the District does allow for growth in tax revenue. For the 2018 (payable in 2019) tax year, the effect of new construction on Class I picked up a bit, coming in at about 1.8% over 2017. On the Class II side (commercial/industrial), the District saw an increase of 1.0% due to new construction of businesses in the community. For the forecasted 2019 tax duplicate (to be released in November 2019), we are expecting growth of 1.80% for new construction for Class I property, and 1.50% for Class II property values. New construction/growth in Class I property values has historically been vibrant in the PLSD community, although the Great Recession of 2008 negatively impacted this growth from 2009 to about 2013. The growth shown in in the past few years for residential properties is a very positive sign. This forecast anticipates increases in residential valuation due to new construction for Class I property to be at 1.80% per year for tax years 2019 through 2021 (affecting fiscal years 2021, 2022 and 2023), and 1.60% for tax year 2022 (affecting fiscal years 2023 and 2024). This growth will be mainly attributed to 10—12 subdivisions in various stages of planning and development around the District. These developments, and the possible new homes that they might bring to the District, are in the following chart:
Rest of Page Left Intentionally Blank
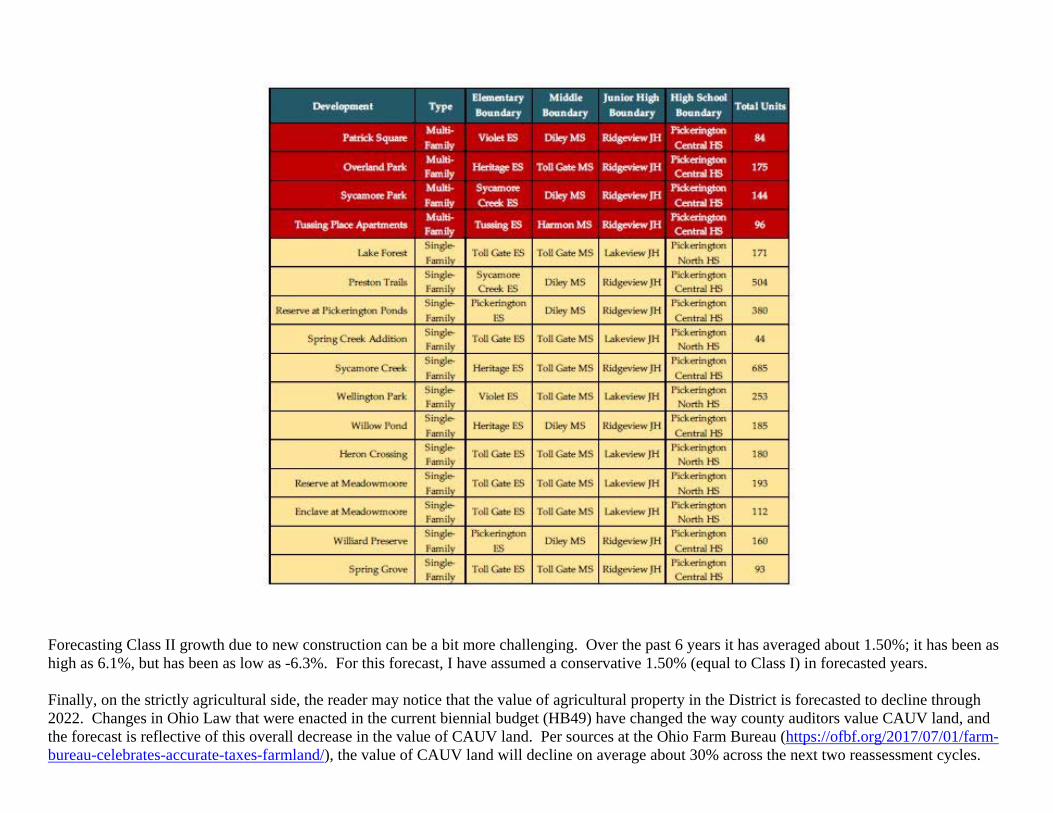
Forecasting Class II growth due to new construction can be a bit more challenging. Over the past 6 years it has averaged about 1.50%; it has been as high as 6.1%, but has been as low as -6.3%. For this forecast, I have assumed a conservative 1.50% (equal to Class I) in forecasted years. Finally, on the strictly agricultural side, the reader may notice that the value of agricultural property in the District is forecasted to decline through 2022. Changes in Ohio Law that were enacted in the current biennial budget (HB49) have changed the way county auditors value CAUV land, and the forecast is reflective of this overall decrease in the value of CAUV land. Per sources at the Ohio Farm Bureau (https://ofbf.org/2017/07/01/farm-bureau-celebrates-accurate-taxes-farmland/), the value of CAUV land will decline on average about 30% across the next two reassessment cycles.

For Fairfield County, this will occur during the 2019 and 2022 cycles. (Note: CAUV is agricultural land, and HB49 would not affect agricultural land not in CAUV, nor will it affect agricultural buildings.) While this may result in a decline in taxes paid on CAUV land, note that due to HB920 millage adjustment factors, these changes in valuation will be offset by millage adjustments that ensure that the District receives the same overall tax revenue. So these CAUV adjustments will simply ‘shift’ a bit of the tax burden to the residential property base. A more detailed look at property values and Real Estate Collections follows in Exhibits 1A—1D:
Rest of Page Left Intentionally Blank
7
ACTUAL Agricultura#A Residential #P ClassII(All #R PP/PUPP #OJ
27,889,68028,639,68029,389,680
2021 16,699,2252022 16,447,150
TotalValuationsbyPropertyClassification
2015 17,849,6302016 20,260,8602017 19,162,990
18,502,210200,324,605201,327,510
16,840,2252020 16,690,225
31,086,68025,385,830
12,004,87026,179,15073,733,370
Residential
2019
181,411,120190,934,860178,813,220188,373,010188,993,210
181,438,710885,732,83017,862,870
ClassII(All)173,343,570 18,106,270
19,304,47021,084,44021,581,64023,973,55026,389,68027,139,680
2013
Total1,129,219,420921,764,940
897,240,690912,120,310995,066,890
1,015,299,7401,038,310,0201,108,395,9461,129,437,7091,150,874,0191,226,831,704
TotalClassI937,769,580903,595,700915,094,500929,969,940
1,015,327,7501,034,462,7301,056,812,2301,125,236,1711,146,127,9341,167,573,2441,243,278,854
TaxYear Agricultural PP/PUPP
2018
18,770,810 1,103,805,220 (25,414,200) ‐2.3%1.1%2.3%6.5%2.6%2.0%6.3%1.7%1.7%6.3%
80,505,33622,644,668
202,334,849214,474,940
2012 16,004,640
2014 17,853,810
23,202,64988,595,701
2018
2018PropertyValuationClass%ofTotalYOY%1.4%
1,115,810,0901,141,989,2401,215,722,6101,246,809,2901,272,195,1201,352,700,4561,375,345,1241,398,547,7731,487,143,474
YOY$Change15,952,310
Agricultural1.45%
Residential81.62%
Class II (All)14.86%
PP/PUPP2.07%
Exhibit 1A—Detailed Look at Historical and Forecasted Valuations

8
SelectMainCounty‐‐>
ACTUAL
APROJ
Fairfield
(49,020)
253,810(1,608,390)
2014
(152,075) 57,318,145 9,105,068
‐0.7%1.4%
Agricultural Residential ClassII(All)
3,983,520
‐1.0%
4,732,900
0.0%‐0.9%‐2.0%
109,000
YOY$Chg.
4.5%
0.0%‐0.2%%YOY
0.0%
0.1%0.1%5.0%
(40,640,340)
%
1,230,760 4,048,730(1,313,570)2,492,320
24.9%1.0%
2.7%
‐1.0%
2013
1,671,151 (2,012,574)0.6%0.7%
2019 (1,411,985) 51,915,501 8,496,497
2015 (48,420) 1,207,510175,800
20162017
2020
YOY% YOY$Chg.
100,000 1,644,833 (2,001,963)
(568,830) 4,251,290
(346,790) (2,076,610) 68,490YOY$Chg.TaxYear
2012
2021
2018
2022
2,416,420 69,735,920
‐4.4%
YOY
(3,645,500)
ValuationChangeTriennialUpdate/Reappraisal/BOR
‐2.2%
‐7.6%
‐0.9%
‐0.3%13.5%6.1%‐3.0% 0.4%
0.4%7.6%0.1%
5.0%
4.5%
Exhibit 1B—Detailed Look at Historical and Forecasted Valuation Increases Due to Inflationary/Reappraisal/BOR

9
ACTUAL
APROJ
(12,077,350)11,132,130
(91,950) 18,758,990 1,933,770
‐0.6%1.5%1.5%
3,035,023 750,000
(184,860)44,240 1,779,970
%
ValuationChangeNewConstruction/Exempted/Other
2022
YOY%
21.3%3.7%2.8%9.2%2.4%11.1%10.1%2.8%2.8%2.7%2.6%
2.4%%YOY YOY
%
1.3%1.5%
PP/PUPP
0.5%
‐1.4%
384,890
533,660
YOY$Chg. YOY$Chg. YOY$Chg.5,260,740 9,482,570 3,179,020
664,540
3,019,913 750,000
TaxYear2012
2,416,130750,000750,000
2021
2018
20162017
2020
1.9%2.0%6.1%‐6.3%4.0%1.0%1.5%
1.5%
0.2%‐1.0%‐13.3%
YOYClassII(All)
(250,000) 19,396,929 3,004,869
0.6%
(2,328,630) 16,184,120 7,072,200 2,391,910
1.8%1.8%1.6%
11,254,050 3,617,9102013 3,362,240
(100,000) 19,765,160
2019 (250,000) 18,170,425 2,834,898
2015
5.8%
1.4%1.6%1.8%1.8%
13,672,110497,200
YOY$Chg.
‐1.5%
4,608,230(2,125,290)
Agricultural Residential
2014
(100,000) 18,413,984
‐0.5%‐11.5%0.0%
‐0.6%
13,210,660(5,190)
Exhibit 1C—Detailed Look at Historical and Forecasted Valuation Increases Due to New Construction/Growth
10
1.010‐GeneralPropertyTax(RealEstate) PickeringtonLocalSchoolDistrictRevenueDetailNote
PercentageofTotalRevenue:30.0% Actual Projected
CollectionYear>>> 2018 2019 2020 2021 2022 2023Valuations ClassIandClassIIValues
TotalValuationforCollectionYear 1,222,835,740 1,245,805,440 1,325,560,776 1,347,455,444 1,369,908,093 1,457,753,794
Year‐Over‐YearChange 28,694,770 22,969,700 79,755,336 21,894,668 22,452,649 87,845,701Overall%Change 2.40% 1.88% 6.40% 1.65% 1.67% 6.41%
ChangeduetoInflation/Deflation 7,771,810 2,368,890 59,000,013 (257,130) (232,423) 66,496,694ChangeduetoNewConstruction 20,927,690 20,600,810 20,755,324 22,151,798 22,685,073 21,349,007
TaxRates ClassITaxRatesTotalClassIEffective(CollectionYear)w/Renewals 32.5743 32.4747 31.1988 31.1575 31.1161 29.8691
Year‐Over‐YearRatechangeduetoreappraisal,ValueChallenges ‐0.1462 ‐0.0996 ‐1.2759 ‐0.0413 ‐0.0413 ‐1.2470
MillageReservedDueToRenewalLevies 0.0000 0.0000 0.0000 0.0000 0.0000 0.0000TotalClassIEffective(CollectionYear)withoutRenewals 32.5743 32.4747 31.1988 31.1575 31.1161 29.8691
TaxRates ClassIITaxRatesTotalClassIIEffective(CollectionYear)w/Renewals 32.7937 32.9924 31.7666 32.0418 32.3199 31.1219
Year‐Over‐YearRatechangeduetoreappraisal,ValueChallenges ‐0.3944 0.1987 ‐1.2258 0.2752 0.2781 ‐1.1980
MillageReservedDueToRenewalLevies 0.0000 0.0000 0.0000 0.0000 0.0000 0.0000TotalClassIIEffective(CollectionYear)withoutRenewals 32.7937 32.9924 31.7666 32.0418 32.3199 31.1219
RevenueCalculationsWithModeledCollectionRatesandCollectionSplitsTaxRevenue FiscalYear>> 2018 2019 2020 2021 2022 2023
TotalResidential,Ag,andBusinessCurrentTaxesw/Renewals 34,933,199 34,968,918 35,837,595 36,531,599 37,140,897 37,864,809Adjustments: LessRenewalLevyAmount(Reserved) ‐ ‐ ‐ ‐ ‐ ‐
Prioryeardelinquencies 582,645 688,592 650,000 675,000 705,000 705,000AdjforvariancebasedonMODELEDrate&split 1 (48,726) 48,725Advancesfrom/toprior/subsequentsettlement ‐ 730 ‐ ‐ ‐ ‐
Otherdistrictadjustments ‐ ‐ ‐ ‐ ‐ ‐Cashflowvarianceand/orpostingvariances 992 0 ‐ ‐ ‐ ‐
AdjustmentforCurrentCashFlowTrend:Total 35,516,836 35,516,837 35,609,515 36,536,320 37,206,599 37,845,897 38,569,809
DollarChangeoverPrioryear 1,137,573 92,678 926,805 670,279 639,298 723,912PercentageChangeoverPriorYear 3.31% 0.26% 2.60% 1.83% 1.72% 1.91%
2013 33,397,0542014 33,301,006 (96,048) ‐0.29%2015 33,074,020 (226,986) ‐0.68%2016 34,345,569 1,271,549 3.84%2017 34,379,264 33,695 0.10%2018 35,516,836 1,137,572 3.31%2019 35,609,515 92,679 0.26%2020 36,536,320 926,805 2.60%2021 37,206,599 670,279 1.83%2022 37,845,897 639,298 1.72%2023 38,569,809 723,912 1.91%
‐$400,000
‐$200,000
$0
$200,000
$400,000
$600,000
$800,000
$1,000,000
$1,200,000
$1,400,000
2014 2015 2016 2017 2018 2019 2020 2021 2022 2023
Year‐Over‐YearDollarChangeinRevenueLine(IncludesRenewalLevyRevenue)
Exhibit 1D—Detailed Look at Forecasted RE Collections

11
LINE 1.020--Tangible Personal Property Tax. The tangible personal property tax has been eliminated for business tangible property (per HB 66). However, it has not been eliminated for public utility tangible personal property (PUPP). In the past, this revenue line had been included into the real estate values above. At only about 1.43% of total general fund revenue, and totaling only $1.693 MM in total collections in FY2018, PUPP doesn’t generate a great deal of revenue. However, the District currently has about $23.97 MM in PUPP valuation (TY2018), and given recent trends that have seen PUPP valuations increase by as much as 11%, we are forecasting about a 3% increase in PUPP valuations moving forward. Subsequently, PUPP tax receipts are projected to grow by about 4.30% on average during the forecasted fiscal years. A more detail look at TPP (PUPP) follows in Exhibit 2:
Rest of Page Left Intentionally Blank

12
1.020‐PublicUtilityPersonalProperty PickeringtonLocalSchoolDistrictPublicUtilityPersonalProperty RevenueDetailNote
PercentageofTotalRevenue:1.43% Actual Projected
TaxCollectionYear>>> 2018 2019 2020 2021 2022 2023Valuations PersonalProperty(PUPP) ProjectionsarenotBasedUponPreviousFiscalYear
TotalValuationforCollectionYear 23,973,550 26,389,680 27,139,680 27,889,680 28,639,680 29,389,680Year‐Over‐YearChange 2,391,910 2,416,130 750,000 750,000 750,000 750,000
Overall%Change 11.08% 10.08% 2.84% 2.76% 2.69% 2.62%
TaxRates FullVoted(PUPP)TangibleFullVotedApprovedLevies 72.2000 72.2000 72.2000 72.2000 72.2000 72.2000
YearoverYearChange 0.0000 0.0000 0.0000 0.0000 0.0000 0.0000Overall%Change 0.00% 0.00% 0.00% 0.00% 0.00% 0.00%
TaxRevenue FiscalYear>> 2018 2019 2020 2021 2022 2023TotalTaxesLeviedforFiscalYear 1,693,297 1,799,519 1,927,252 1,981,131 2,035,010 2,088,888AdjforMODELEDrate&split ‐ 14,457 (14,458) ‐ ‐ ‐
Delinquencies 0 ‐ ‐ ‐ ‐ ‐Adjusts&cashflow/settlementpostingvarianceandLevyReservation (1) 0 ‐ ‐ ‐ ‐
OtherAdjustments:AdjustmentforCurrentCashFlowTrend:
Total 1,693,297 1,693,296 1,813,977 1,912,795 1,981,131 2,035,010 2,088,888DollarChangeoverPrioryear 141,230 120,681 98,818 68,336 53,879 53,878PercentageChangeoverPriorYear 9.10% 7.13% 5.45% 3.57% 2.72% 2.65%
2013 1,192,1752014 1,313,104 120,929 10.14%2015 1,462,491 149,387 11.38%2016 1,484,704 22,213 1.52%2017 1,552,066 67,362 4.54%2018 1,693,297 141,231 9.10%2019 1,813,977 120,680 7.13%2020 1,912,795 98,818 5.45%2021 1,981,131 68,336 3.57%2022 2,035,010 53,879 2.72%2023 2,088,888 53,878 2.65%$0
$20,000
$40,000
$60,000
$80,000
$100,000
$120,000
$140,000
$160,000
2014 2015 2016 2017 2018 2019 2020 2021 2022 2023
Year‐Over‐YearDollarChangeinRevenueLine(IncludesRenewalLevyRevenue)
Exhibit 2—Detailed Look at Forecasted PUPP Tax Revenue
13
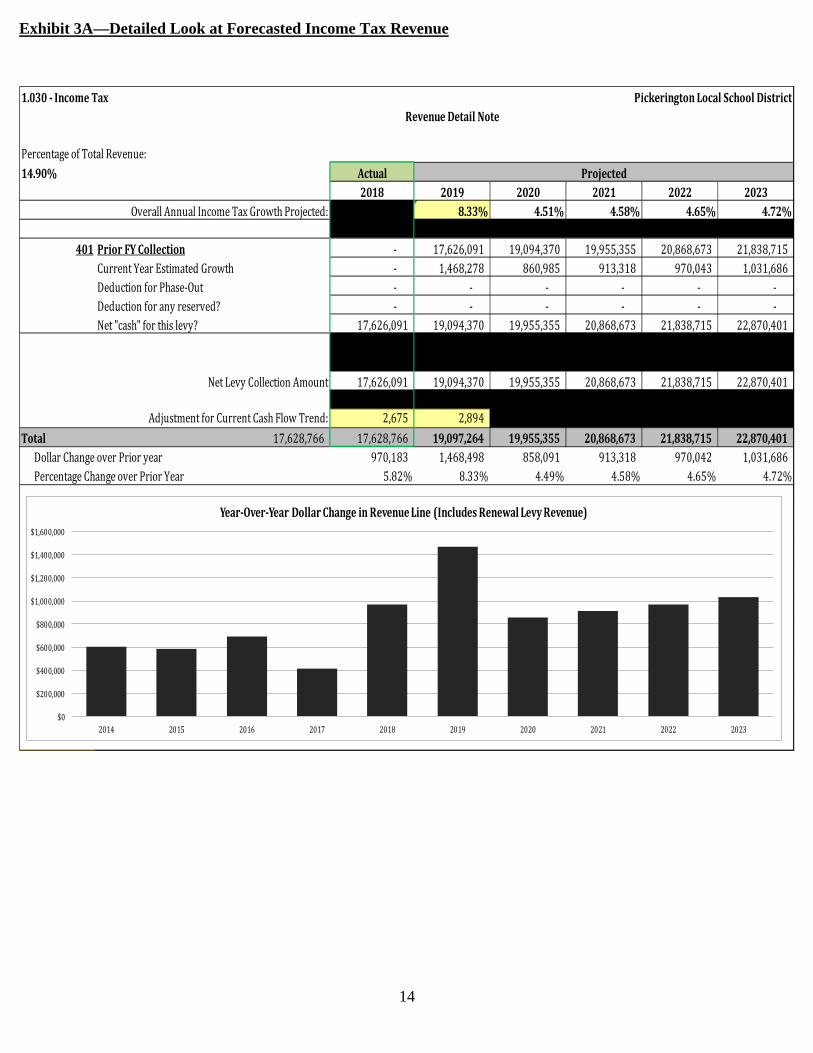
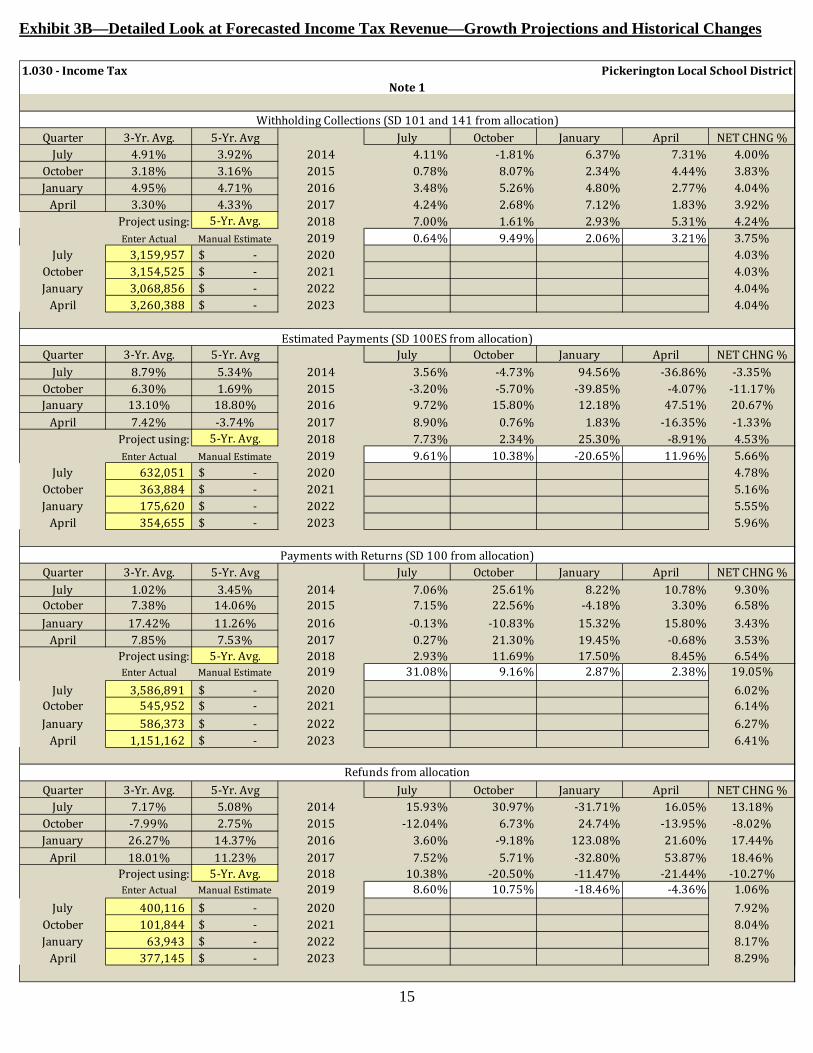
LINE 1.030—Income Tax. With all income tax settlements received for FY19, suffice it to say that income tax collections have heated up again. FY18 collections were 5.82% higher than FY17, and FY19 collections are 8.33% higher than FY18. We are forecasting year-over-year increases of about 4.61%, on average, per year for FY20-FY23. As a note, this revenue stream is roughly equivalent to 15.01 effective mills of property tax for Pickerington Schools. This revenue source has become one of the fastest growing and most significant sources of revenue for the District, and it continues to increase in its share of total general fund revenue (currently 14.90%).
Rest of Page Left Intentionally Blank
14
1.030‐IncomeTax PickeringtonLocalSchoolDistrictRevenueDetailNote
PercentageofTotalRevenue:14.90% Actual Projected
2018 2019 2020 2021 2022 2023OverallAnnualIncomeTaxGrowthProjected: 8.33% 4.51% 4.58% 4.65% 4.72%
401 PriorFYCollection ‐ 17,626,091 19,094,370 19,955,355 20,868,673 21,838,715CurrentYearEstimatedGrowth ‐ 1,468,278 860,985 913,318 970,043 1,031,686DeductionforPhase‐Out ‐ ‐ ‐ ‐ ‐ ‐Deductionforanyreserved? ‐ ‐ ‐ ‐ ‐ ‐Net"cash"forthislevy? 17,626,091 19,094,370 19,955,355 20,868,673 21,838,715 22,870,401
NetLevyCollectionAmount 17,626,091 19,094,370 19,955,355 20,868,673 21,838,715 22,870,401
AdjustmentforCurrentCashFlowTrend: 2,675 2,894Total 17,628,766 17,628,766 19,097,264 19,955,355 20,868,673 21,838,715 22,870,401
DollarChangeoverPrioryear 970,183 1,468,498 858,091 913,318 970,042 1,031,686PercentageChangeoverPriorYear 5.82% 8.33% 4.49% 4.58% 4.65% 4.72%
2013 14,357,7562014 14,963,889 606,133 4.22%2015 15,548,189 584,300 3.90%2016 16,242,763 694,574 4.47%2017 16,658,583 415,820 2.56%2018 17,628,766 970,183 5.82%2019 19,097,264 1,468,498 8.33%2020 19,955,355 858,091 4.49%2021 20,868,673 913,318 4.58%2022 21,838,715 970,042 4.65%2023 22,870,401 1,031,686 4.72%
$0
$200,000
$400,000
$600,000
$800,000
$1,000,000
$1,200,000
$1,400,000
$1,600,000
2014 2015 2016 2017 2018 2019 2020 2021 2022 2023
Year‐Over‐YearDollarChangeinRevenueLine(IncludesRenewalLevyRevenue)
Exhibit 3A—Detailed Look at Forecasted Income Tax Revenue
15
1.030‐IncomeTax PickeringtonLocalSchoolDistrictNote1
WithholdingCollections(SD101and141fromallocation)Quarter 3‐Yr.Avg. 5‐Yr.Avg July October January April NETCHNG%July 4.91% 3.92% 2014 4.11% ‐1.81% 6.37% 7.31% 4.00%
October 3.18% 3.16% 2015 0.78% 8.07% 2.34% 4.44% 3.83%January 4.95% 4.71% 2016 3.48% 5.26% 4.80% 2.77% 4.04%April 3.30% 4.33% 2017 4.24% 2.68% 7.12% 1.83% 3.92%
Projectusing: 5‐Yr.Avg. 2018 7.00% 1.61% 2.93% 5.31% 4.24%EnterActual ManualEstimate 2019 0.64% 9.49% 2.06% 3.21% 3.75%
July 3,159,957 ‐$ 2020 4.03%October 3,154,525 ‐$ 2021 4.03%January 3,068,856 ‐$ 2022 4.04%April 3,260,388 ‐$ 2023 4.04%
EstimatedPayments(SD100ESfromallocation)Quarter 3‐Yr.Avg. 5‐Yr.Avg July October January April NETCHNG%July 8.79% 5.34% 2014 3.56% ‐4.73% 94.56% ‐36.86% ‐3.35%
October 6.30% 1.69% 2015 ‐3.20% ‐5.70% ‐39.85% ‐4.07% ‐11.17%January 13.10% 18.80% 2016 9.72% 15.80% 12.18% 47.51% 20.67%April 7.42% ‐3.74% 2017 8.90% 0.76% 1.83% ‐16.35% ‐1.33%
Projectusing: 5‐Yr.Avg. 2018 7.73% 2.34% 25.30% ‐8.91% 4.53%EnterActual ManualEstimate 2019 9.61% 10.38% ‐20.65% 11.96% 5.66%
July 632,051 ‐$ 2020 4.78%October 363,884 ‐$ 2021 5.16%January 175,620 ‐$ 2022 5.55%April 354,655 ‐$ 2023 5.96%
PaymentswithReturns(SD100fromallocation)Quarter 3‐Yr.Avg. 5‐Yr.Avg July October January April NETCHNG%July 1.02% 3.45% 2014 7.06% 25.61% 8.22% 10.78% 9.30%
October 7.38% 14.06% 2015 7.15% 22.56% ‐4.18% 3.30% 6.58%January 17.42% 11.26% 2016 ‐0.13% ‐10.83% 15.32% 15.80% 3.43%April 7.85% 7.53% 2017 0.27% 21.30% 19.45% ‐0.68% 3.53%
Projectusing: 5‐Yr.Avg. 2018 2.93% 11.69% 17.50% 8.45% 6.54%EnterActual ManualEstimate 2019 31.08% 9.16% 2.87% 2.38% 19.05%
July 3,586,891 ‐$ 2020 6.02%October 545,952 ‐$ 2021 6.14%January 586,373 ‐$ 2022 6.27%April 1,151,162 ‐$ 2023 6.41%
RefundsfromallocationQuarter 3‐Yr.Avg. 5‐Yr.Avg July October January April NETCHNG%July 7.17% 5.08% 2014 15.93% 30.97% ‐31.71% 16.05% 13.18%
October ‐7.99% 2.75% 2015 ‐12.04% 6.73% 24.74% ‐13.95% ‐8.02%January 26.27% 14.37% 2016 3.60% ‐9.18% 123.08% 21.60% 17.44%April 18.01% 11.23% 2017 7.52% 5.71% ‐32.80% 53.87% 18.46%
Projectusing: 5‐Yr.Avg. 2018 10.38% ‐20.50% ‐11.47% ‐21.44% ‐10.27%EnterActual ManualEstimate 2019 8.60% 10.75% ‐18.46% ‐4.36% 1.06%
July 400,116 ‐$ 2020 7.92%October 101,844 ‐$ 2021 8.04%January 63,943 ‐$ 2022 8.17%April 377,145 ‐$ 2023 8.29%
Exhibit 3B—Detailed Look at Forecasted Income Tax Revenue—Growth Projections and Historical Changes

16
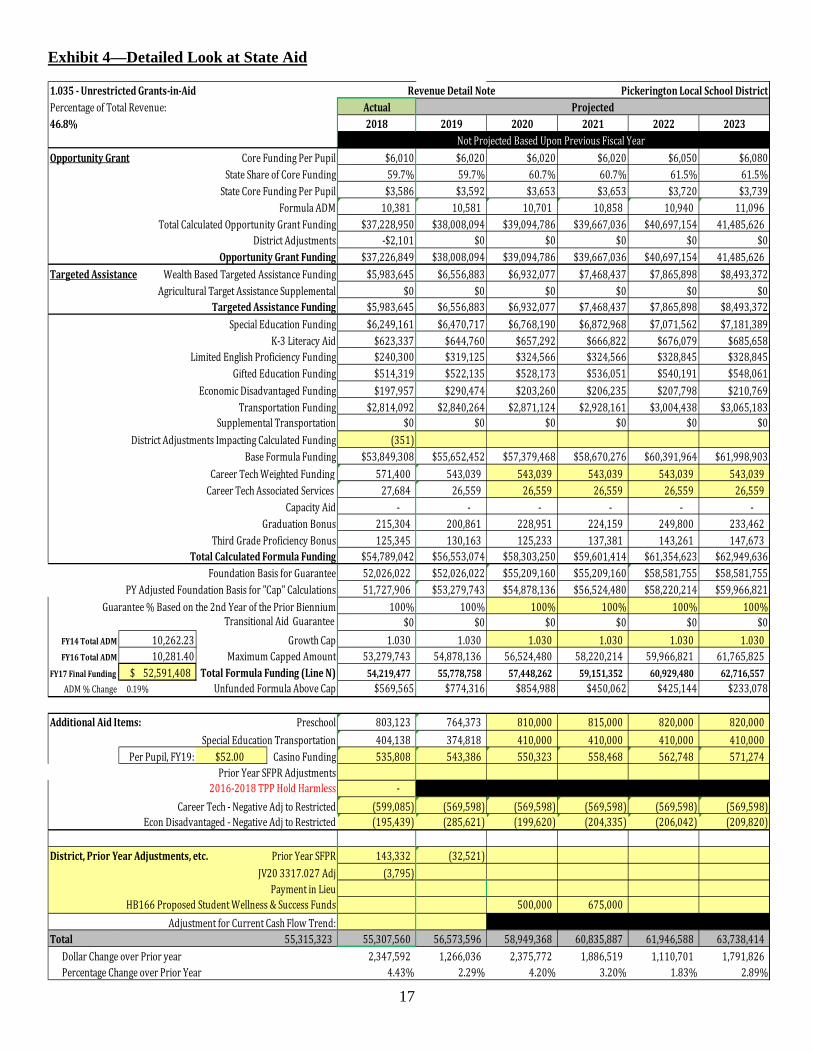
LINE 1.035--Unrestricted Grants-in-Aid (State Foundation). Representing 46.8% of general fund revenue, Unrestricted Grants in Aid (a.k.a. State Foundation) is the most critical piece of funding for the District. This is also the piece of the funding that is directly tied to the biennial budget. HB 166, the 2020-2021 biennium budget bill, was adopted by the House on May 9, 2019. While the final details of the budget bill will unfold over the course of the next 6 weeks, there are pieces of information that have been adopted in these assumptions. Per pupil funding has been set at $6,020 per pupil. Weighted categorical funding for special education has been increased minimally—by 1% for each school year. There is still a 3% gain cap for state funding, which is the biggest factor that may change moving forward. The model also continues to change the State Share Index over the biennium, which is adding to state funding. In fiscal years 2022 and 2023, the per pupil funding is $6,050 and $6,080 respectively. A more detailed look at State Aid follows in Exhibit 4:
17
1.035‐UnrestrictedGrants‐in‐Aid RevenueDetailNote PickeringtonLocalSchoolDistrictPercentageofTotalRevenue: Actual Projected46.8% 2018 2019 2020 2021 2022 2023
NotProjectedBasedUponPreviousFiscalYearOpportunityGrant CoreFundingPerPupil $6,010 $6,020 $6,020 $6,020 $6,050 $6,080
StateShareofCoreFunding 59.7% 59.7% 60.7% 60.7% 61.5% 61.5%StateCoreFundingPerPupil $3,586 $3,592 $3,653 $3,653 $3,720 $3,739
FormulaADM 10,381 10,581 10,701 10,858 10,940 11,096TotalCalculatedOpportunityGrantFunding $37,228,950 $38,008,094 $39,094,786 $39,667,036 $40,697,154 41,485,626
DistrictAdjustments ‐$2,101 $0 $0 $0 $0 $0OpportunityGrantFunding $37,226,849 $38,008,094 $39,094,786 $39,667,036 $40,697,154 41,485,626
TargetedAssistance WealthBasedTargetedAssistanceFunding $5,983,645 $6,556,883 $6,932,077 $7,468,437 $7,865,898 $8,493,372AgriculturalTargetAssistanceSupplemental $0 $0 $0 $0 $0 $0
TargetedAssistanceFunding $5,983,645 $6,556,883 $6,932,077 $7,468,437 $7,865,898 $8,493,372SpecialEducationFunding $6,249,161 $6,470,717 $6,768,190 $6,872,968 $7,071,562 $7,181,389
K‐3LiteracyAid $623,337 $644,760 $657,292 $666,822 $676,079 $685,658LimitedEnglishProficiencyFunding $240,300 $319,125 $324,566 $324,566 $328,845 $328,845
GiftedEducationFunding $514,319 $522,135 $528,173 $536,051 $540,191 $548,061EconomicDisadvantagedFunding $197,957 $290,474 $203,260 $206,235 $207,798 $210,769
TransportationFunding $2,814,092 $2,840,264 $2,871,124 $2,928,161 $3,004,438 $3,065,183SupplementalTransportation $0 $0 $0 $0 $0 $0
DistrictAdjustmentsImpactingCalculatedFunding (351)BaseFormulaFunding $53,849,308 $55,652,452 $57,379,468 $58,670,276 $60,391,964 $61,998,903
CareerTechWeightedFunding 571,400 543,039 543,039 543,039 543,039 543,039CareerTechAssociatedServices 27,684 26,559 26,559 26,559 26,559 26,559
CapacityAid ‐ ‐ ‐ ‐ ‐ ‐GraduationBonus 215,304 200,861 228,951 224,159 249,800 233,462
ThirdGradeProficiencyBonus 125,345 130,163 125,233 137,381 143,261 147,673TotalCalculatedFormulaFunding $54,789,042 $56,553,074 $58,303,250 $59,601,414 $61,354,623 $62,949,636
FoundationBasisforGuarantee 52,026,022 $52,026,022 $55,209,160 $55,209,160 $58,581,755 $58,581,755PYAdjustedFoundationBasisfor"Cap"Calculations 51,727,906 $53,279,743 $54,878,136 $56,524,480 $58,220,214 $59,966,821
Guarantee%Basedonthe2ndYearofthePriorBiennium 100% 100% 100% 100% 100% 100%TransitionalAidGuarantee $0 $0 $0 $0 $0 $0
FY14TotalADM 10,262.23 GrowthCap 1.030 1.030 1.030 1.030 1.030 1.030FY16TotalADM 10,281.40 MaximumCappedAmount 53,279,743 54,878,136 56,524,480 58,220,214 59,966,821 61,765,825
FY17FinalFunding 52,591,408$ TotalFormulaFunding(LineN) 54,219,477 55,778,758 57,448,262 59,151,352 60,929,480 62,716,557ADM%Change 0.19% UnfundedFormulaAboveCap $569,565 $774,316 $854,988 $450,062 $425,144 $233,078
AdditionalAidItems: Preschool 803,123 764,373 810,000 815,000 820,000 820,000SpecialEducationTransportation 404,138 374,818 410,000 410,000 410,000 410,000
PerPupil,FY19: $52.00 CasinoFunding 535,808 543,386 550,323 558,468 562,748 571,274PriorYearSFPRAdjustments
2016‐2018TPPHoldHarmless ‐CareerTech‐NegativeAdjtoRestricted (599,085) (569,598) (569,598) (569,598) (569,598) (569,598)
EconDisadvantaged‐NegativeAdjtoRestricted (195,439) (285,621) (199,620) (204,335) (206,042) (209,820)
District,PriorYearAdjustments,etc. PriorYearSFPR 143,332 (32,521)JV203317.027Adj (3,795)
PaymentinLieuHB166ProposedStudentWellness&SuccessFunds 500,000 675,000
AdjustmentforCurrentCashFlowTrend:Total 55,315,323 55,307,560 56,573,596 58,949,368 60,835,887 61,946,588 63,738,414
DollarChangeoverPrioryear 2,347,592 1,266,036 2,375,772 1,886,519 1,110,701 1,791,826PercentageChangeoverPriorYear 4.43% 2.29% 4.20% 3.20% 1.83% 2.89%
Exhibit 4—Detailed Look at State Aid
18
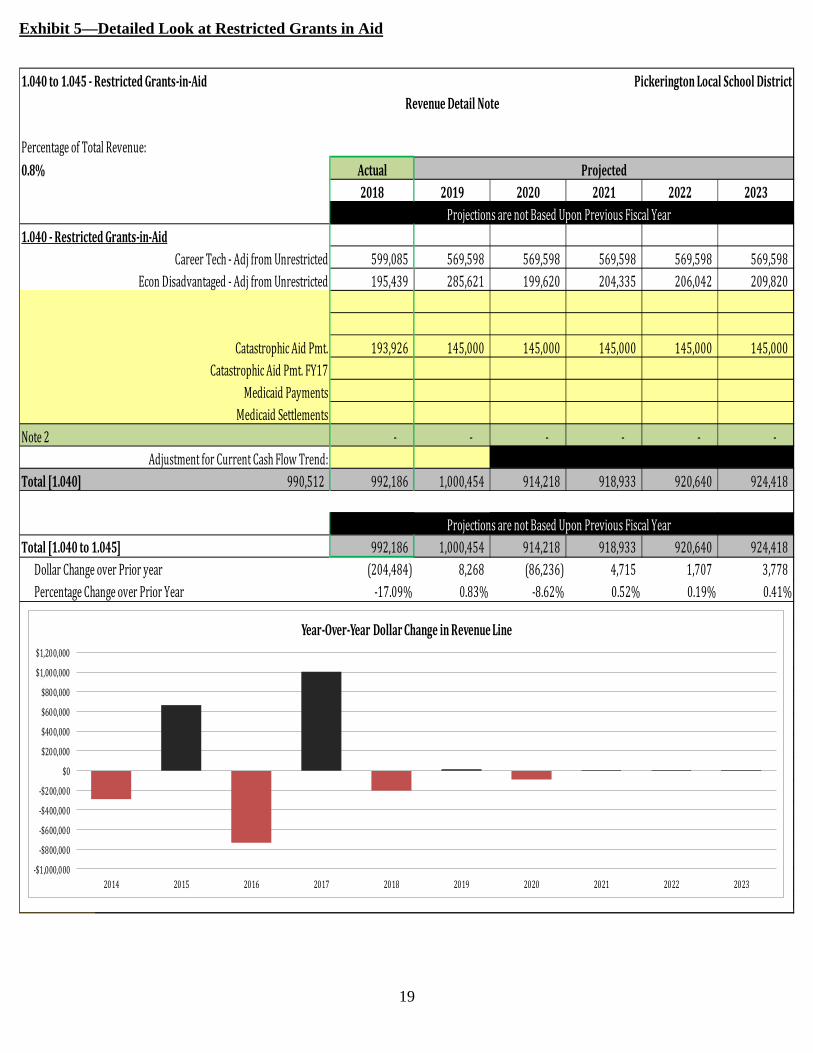
LINES 1.040 AND 1.045--Restricted Grants-in-Aid. This funding is only forecasted to include the Career Technical funding received from the state and Economically Disadvantaged Funding (moved to Restricted Funding by HB 59). While Restricted Grants in Aid are not a significant source of funding for the District in total (only about .8% of overall general funding), the District, through a concerted effort to offer high quality Career Technical courses in the areas of Engineering and Biomedical Science, has increased CTE funding to nearly $600,000 per year. A more detailed look at Restricted Grants in Aid follows in Exhibit 5:
Rest of Page Left Intentionally Blank
19
1.040to1.045‐RestrictedGrants‐in‐Aid PickeringtonLocalSchoolDistrictRevenueDetailNote
PercentageofTotalRevenue:0.8% Actual Projected
2018 2019 2020 2021 2022 2023ProjectionsarenotBasedUponPreviousFiscalYear
1.040‐RestrictedGrants‐in‐AidCareerTech‐AdjfromUnrestricted 599,085 569,598 569,598 569,598 569,598 569,598
EconDisadvantaged‐AdjfromUnrestricted 195,439 285,621 199,620 204,335 206,042 209,820
CatastrophicAidPmt. 193,926 145,000 145,000 145,000 145,000 145,000CatastrophicAidPmt.FY17
MedicaidPaymentsMedicaidSettlements
Note2 ‐ ‐ ‐ ‐ ‐ ‐AdjustmentforCurrentCashFlowTrend:
Total[1.040] 990,512 992,186 1,000,454 914,218 918,933 920,640 924,418
ProjectionsarenotBasedUponPreviousFiscalYearTotal[1.040to1.045] 992,186 1,000,454 914,218 918,933 920,640 924,418
DollarChangeoverPrioryear (204,484) 8,268 (86,236) 4,715 1,707 3,778PercentageChangeoverPriorYear ‐17.09% 0.83% ‐8.62% 0.52% 0.19% 0.41%
2013 548,6802014 259,606 (289,074) ‐52.69%2015 926,404 666,798 256.85%2016 194,845 (731,559) ‐78.97%2017 1,196,670 1,001,825 514.17%2018 990,512 (206,158) ‐17.23%2019 1,000,454 9,942 1.00%2020 914,218 (86,236) ‐8.62%2021 918,933 4,715 0.52%2022 920,640 1,707 0.19%2023 924,418 3,778 0.41%
‐$1,000,000
‐$800,000
‐$600,000
‐$400,000
‐$200,000
$0
$200,000
$400,000
$600,000
$800,000
$1,000,000
$1,200,000
2014 2015 2016 2017 2018 2019 2020 2021 2022 2023
Year‐Over‐YearDollarChangeinRevenueLine
Exhibit 5—Detailed Look at Restricted Grants in Aid
20
LINE 1.050--Property Tax Allocation. This category includes State reimbursements for property tax rollbacks and homestead exemptions, and comprises about 3.80% of total general fund revenue. In the past, this revenue line also included the business tangible personal property reimbursement payments to District as a way to hold them harmless from the effects of eliminating business TPP from local tax duplicates (see line 1.020). However, because TPP ‘hold-harmless’ payments accounted for less than 2% of total resources for the District (defined by HB 153 as less than 2% of state aid and local property tax revenue), TPP hold-harmless payments were phased out for the District. This revenue line now includes only those reimbursements from the state of the 12.5% property tax credit provided to local homeowners. Additionally, because all of the District’s current expense levies were in place prior to November of 2013, and are continuing in nature, the HB59 limitation on applying the 10% and 2.5% tax credits to new or replacement levies passed on or after November of 2013 will not affect the rollback reimbursements currently collected by the District. However, it should be noted that for any future levies that the District might seek, these rollbacks will not apply. Exhibit 6, which shows a more detailed look at this revenue line, follows.
Rest of Page Left Intentionally Blank

21
1.050‐PropertyTaxAllocation PickeringtonLocalSchoolDistrictRevenueDetailNote
PercentageofTotalRevenue:3.8% Actual Projected
2018 2019 2020 2021 2022 2023ProjectionsarenotBasedUponPreviousFiscalYear
RollbackandHomestead 10%RollbackTotalDollars 3,346,745 3,403,828 3,474,347 3,543,947 3,605,218 3,676,5412.5%ResidentialRollbackTotalDollars 685,181 698,471 712,942 727,224 739,797 754,432
HomesteadTotalDollars 516,095 513,005 523,634 534,123 543,358 554,107Adjustments (770) 5,081 ‐ ‐ ‐ ‐
RenewalLevyReservation ‐ ‐ ‐ ‐ ‐
TotalRollbackandHomestead 4,547,251 4,620,385 4,710,922 4,805,294 4,888,372 4,985,080
AdjustmentforCurrentCashFlowTrend: 7,316Total 4,547,251 4,554,567 4,620,385 4,710,922 4,805,294 4,888,372 4,985,080
DollarChangeoverPrioryear 55,683 65,818 90,537 94,372 83,078 96,708PercentageChangeoverPriorYear 1.24% 1.45% 1.96% 2.00% 1.73% 1.98%
2013 4,374,1752014 4,398,940 24,765 0.57%2015 4,414,914 15,974 0.36%2016 4,458,194 43,280 0.98%2017 4,498,884 40,690 0.91%2018 4,547,251 48,367 1.08%2019 4,620,385 73,134 1.61%2020 4,710,922 90,537 1.96%2021 4,805,294 94,372 2.00%2022 4,888,372 83,078 1.73%2023 4,985,080 96,708 1.98%
$0
$20,000
$40,000
$60,000
$80,000
$100,000
$120,000
2014 2015 2016 2017 2018 2019 2020 2021 2022 2023
Year‐Over‐YearDollarChangeinRevenueLine(IncludesRenewalLevyRevenue)
Exhibit 6—Detailed Look at Property Tax Allocation
22
LINE 1.060--All Other Revenues. This category mostly includes tuition payments made to PLSD for special education students attending the District, TIF payments, interest on investments, and Medicaid School Provider payments. This revenue line only accounts for about 2.2% of total general fund revenue, but based on the rebound of interest rates and an aggressive investment strategy by the District, investment income has nearly tripled over the last 3 fiscal years. Moreover, the District has taken an active approach in BOR cases, which has resulted in various PILOT (payment in lieu of taxes) arrangements with various businesses. A more detailed look at All Other Revenues follows in Exhibits 7A, 7B, and 7C:
Rest of Page Left Intentionally Blank

23
1.060‐AllOtherOperatingRevenues PickeringtonLocalSchoolDistrictRevenueDetailNote
PercentageofTotalRevenue:2.2% Actual Projected
2018 2019 2020 2021 2022 2023ActualAmountReceivedinPriorYear: 1,541,798 2,597,545 2,663,766 2,249,246 2,011,217 1,834,154
One‐TimeAdjustmentstoPriorYearBasis
NetBasistobeUsedforCurrentandSubsequentForecastedAmount: 1,541,798 2,597,545 2,663,766 2,249,246 2,011,217 1,834,154
Note1‐TuitionRelatedRevenue 592,354 (195,824) (87,047) 2,957 2,972 2,987Note2‐FeeBasedRevenue 3,426 (6,552) 51 51 51 51Note3‐OtherOperatingRevenue 459,969 268,597 (327,524) (241,036) (180,085) (134,369)
AdjustmentforCurrentCashFlowTrend:Total 2,597,545 2,597,546 2,663,766 2,249,246 2,011,217 1,834,154 1,702,823
DollarChangeoverPrioryear 1,055,748 66,220 (414,520) (238,029) (177,063) (131,331)PercentageChangeoverPriorYear 68.48% 2.55% ‐15.56% ‐10.58% ‐8.80% ‐7.16%
2013 1,002,8802014 899,811 (103,069) ‐10.28%2015 939,489 39,678 4.41%2016 1,378,335 438,846 46.71%2017 1,541,798 163,463 11.86%2018 2,597,545 1,055,747 68.48%2019 2,663,766 66,221 2.55%2020 2,249,246 (414,520) ‐15.56%2021 2,011,217 (238,029) ‐10.58%2022 1,834,154 (177,063) ‐8.80%2023 1,702,823 (131,331) ‐7.16%
‐$600,000
‐$400,000
‐$200,000
$0
$200,000
$400,000
$600,000
$800,000
$1,000,000
$1,200,000
2014 2015 2016 2017 2018 2019 2020 2021 2022 2023
Year‐Over‐YearDollarChangeinRevenueLine
Exhibit 7A—Detailed Look at All Other Revenues

24
1.060‐AllOtherOperatingRevenues PickeringtonLocalSchoolDistrictNote1
NameofRevenuetobePresentedTuitionRelatedRevenue
Description 2017 2018 2019 2020 2021 2022 2023
1221‐SF14Tuition 127,208 452,445 333,565 276,375 277,757 279,146 280,541%Changefromprioryear ‐42.4% 255.7% ‐26.3% ‐17.1% 0.5% 0.5% 0.5%
1223‐SF14H 85,661 294,874 190,841 183,956 184,876 185,800 186,729%Changefromprioryear ‐62.4% 244.2% ‐35.3% ‐3.6% 0.5% 0.5% 0.5%
1223‐ExcessCostRevenue 114,531 127,183 153,624 130,000 130,000 130,000 130,000%Changefromprioryear 0.0% 11.0% 20.8% ‐15.4% 0.0% 0.0% 0.0%
1219/1290OtherTuition(PreSc 84,509 129,761 130,410 131,062 131,717 132,376 133,038%Changefromprioryear 82.9% 53.5% 0.5% 0.5% 0.5% 0.5% 0.5%
OtherMisc.Tuition%Changefromprioryear 0.0% 0.0% 0.0% 0.0% 0.0% 0.0% 0.0%
TotalOperatingRevenues 1,541,798 2,597,545 2,663,766 2,249,246 2,011,217 1,834,154 1,702,823TotalTuitionRelatedRevenue 411,910 1,004,263 808,440 721,393 724,350 727,322 730,308TotalforDetailedNote1 592,354 ‐195,824 ‐87,047 2,957 2,972 2,987
TotalTuitionRelatedRevenue 100% 100% 100% 100% 100% 100%TuitionRelatedRevenueasa%ofTotalratingRe 39% 30% 32% 36% 40% 40%AnnualChangeinTuitionRelatedRevenue
39%30% 32% 36% 40% 40%
0%
20%
40%
60%
80%
100%
120%
2018 2019 2020 2021 2022 2023
TuitionRelatedRevenueas a% ofTotal ratingRevenues
TotalOperatingRevenues TuitionRelatedRevenue
‐300,000
‐200,000
‐100,000
0
100,000
200,000
300,000
400,000
500,000
600,000
700,000
2018 2019 2020 2021 2022 2023
Annual Change inTuitionRelatedRevenue
TuitionRelatedRevenue
0
200,000
400,000
600,000
800,000
1,000,000
1,200,000
2017 2018 2019 2020 2021 2022 2023
TuitionRelatedRevenue
1221‐SF14Tuition 1223‐SF14H 1223‐ExcessCostRevenue 1219/1290OtherTuition(PreSchool) OtherMisc.Tuition
Exhibit 7B—Detailed Look at Tuition Related Revenue

25
1.060‐AllOtherOperatingRevenues PickeringtonLocalSchoolDistrictNote3
NameofRevenuetobePresentedOtherOperatingRevenue
Description 2017 2018 2019 2020 2021 2022 2023
1410‐InterestIncome 599,887 867,372 1,300,000 975,000 731,250 548,438 411,328%Changefromprioryear 119.1% 44.6% 49.9% ‐25.0% ‐25.0% ‐25.0% ‐25.0%
1880‐TIF/PILOTRevenues 118,311 366,528 119,497 120,095 120,695 121,299 121,905%Changefromprioryear 28.4% 209.8% ‐67.4% 0.5% 0.5% 0.5% 0.5%
4220‐MedicaidReimbursement 372,777 305,726 375,729 377,608 379,496 381,393 383,300%Changefromprioryear ‐21.7% ‐18.0% 22.9% 0.5% 0.5% 0.5% 0.5%
1490‐SDITInterestIncome 25,687 37,004 50,000 45,000 45,225 45,451 45,678%Changefromprioryear 62.4% 44.1% 35.1% ‐10.0% 0.5% 0.5% 0.5%
%Changefromprioryear 0.0% 0.0% 0.0% 0.0% 0.0% 0.0% 0.0%TotalOperatingRevenues 1,541,798 2,597,545 2,663,766 2,249,246 2,011,217 1,834,154 1,702,823TotalOtherOperatingRevenue 1,116,661 1,576,630 1,845,226 1,517,702 1,276,666 1,096,581 962,212TotalforDetailedNote3 459,969 268,597 ‐327,524 ‐241,036 ‐180,085 ‐134,369
Exhibit 7C—Detailed Look at Other Operating Revenue

26
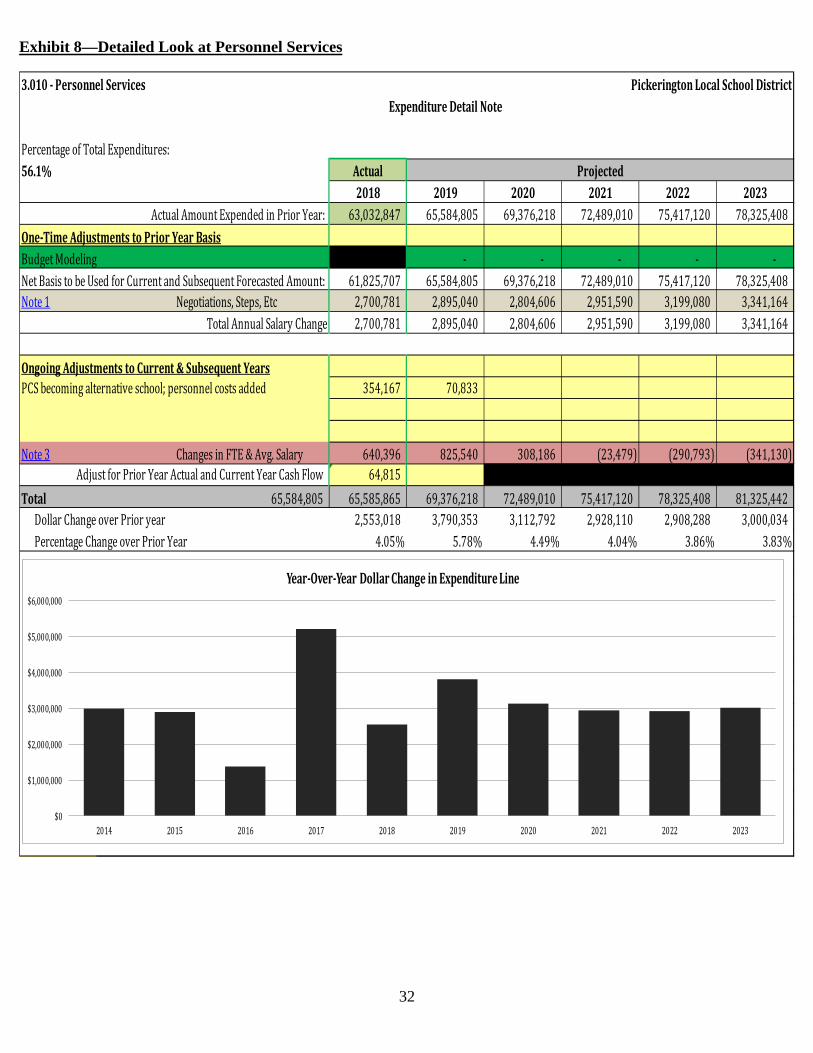
EXPENDITURES LINE 3.010--Personnel Services. Calculations for Personnel Services (salaries and wages) are based on actual historical expenditures, current staffing levels, forecasted staffing levels, and approved salary schedules and contracts with the Pickerington Education Association (PEA) and the Pickerington Support Staff Association (PSSA). Expenditures for salaries currently comprise about 56.1% of all general fund expenses. For FY18 and forward, increased technology demands; a need to increase offerings in the Arts and Music; a need to add student supports to meet diverse learning needs; a need for additional administrative staffing at the Junior High and Middle School levels; and population growth have driven the following staffing changes:
Area of Need 2017-2018 2018-2019 2019-2020 2020-2021 Technology +1.0 FTE Systems Analyst;
+2.0 FTE Technology Coordinators
+1.0 FTE Network Admin
Additional Programming
+1.0 FTE Computer Science Teacher JH Level ; +2.5 General Music Teachers Elementary School ; +1 Art Teacher ; +.5 Arts Coordinator ;
+.50 FTE Tech Teacher Elementary Level ; +1.5 FTE Music Teacher ; +1.0 FTE Computer Science Teacher JH Level ;
+1.0 FTE Science/SS Coach +1.0 FTE Science/SS Coach ; +1.0 FTE PLTW Teacher
Student Population Growth
+ 1.0 FTE Gr. 6 Harmon ; +1.0 FTE Elementary Teacher Violet ES ; +.50 FTE KLIP Teacher Tussing ES ;
+3.0 FTE in for K-6 growth +3.0 FTE for overall student growth; +2.0 Team Teachers ELA/Math Lakeview JH ; +.50 FTE ELA Teacher PHSC
+3.0 FTE for -FY22 for overall student growth
Student Support for Subgroups
+3.0 FTE Intervention Specialists for MD Unit Growth ; +5.0 FTE Paras for MD Support ; +2.0 FTE Inclusion Teachers ; +3.0 FTE Paras Inclusion Support ; +1.0 FTE Special Ed Coach ; +1.0 FTE EL Coach ; +.50 FTE KLIP Teacher Tussing ES ; +.50 FTE Para for KLIP Tussing ES ; +1.0 FTE Pyschologist
+1.0 FTE Inclusion Teacher ; +1.0 FTE EL Teacher ; +.50 FTE KLIP Teacher Fairfield ES ; +1.0 ELA Teacher PAS ; +1.0 KLIP Parapro Fairfield ES ; +1.0 FTE Pyschologist ; +1.6 FTE Speech/Lang. Therapists (Fed Funds)
+2.0 FTE Inclusion Teachers
Student Health/Wellness Needs
+1.0 FTE Nurse +1.0 FTE Social Worker
Administrative +2.0 FTE Admins (1.0 FTE MS Admin; 1.0 FTE JH [Admin split .50 FTE per Lakeview and Ridgeview JH])
27
In May of 2018, the PEA and the Board agreed to a new collective bargaining agreement that will run from July 1, 2018 to June 30, 2021. The PEA agreed to a base wage increase of 2.50% for FY19; and 2.0% for both FY20 and FY21. Insurance splits did not change (80% Board-20% employee). The contract with the PSSA runs from July 1, 2017 through June 30, 2020. The parties negotiated base wage increases of 2.25% in FY18; 2.25% in FY19; and 1.50% for FY20. Like the PEA agreement, the PSSA agreement contains a provision whereby health insurance premiums are split 80%-20%. But the PSSA agreement also provides a high deductible health plan option that has an 85%-15% split of premiums. The forecast also continues to assume wage inflation (comprised as step and base increases, whether negotiated or not) as follows on the next page:
Rest of Page Left Intentionally Blank

28
ToMenu 03.010‐PersonnelServices PickeringtonLocalSchoolDistrict
Negotiations,Steps,&Other Note1
AllocationofPriorYearSalaryExpenditures 2018 2019 2020 2021 2022 2023Certified 72.81% 72.62% 72.57% 72.55% 72.44% 72.33%Classified 12.91% 13.00% 13.01% 13.02% 13.07% 13.12%Administrative 9.81% 9.97% 10.03% 10.04% 10.08% 10.12%OT/Subs/Severance 3.41% 3.37% 3.36% 3.36% 3.38% 3.39%Supplementals 1.05% 1.04% 1.03% 1.03% 1.04% 1.04%Other 0.00% 0.00% 0.00% 0.00% 0.00% 0.00%
TotalPercentage(should=100%) 100.00% 100.00% 100.00% 100.00% 100.00% 100.00%AnnualSalaryTotal 61,825,707 65,584,805 69,376,218 72,489,010 75,417,120 78,325,408EstimatedCertifiedAnnualSalary 45,018,079 47,626,178 50,345,208 52,588,655 54,632,048 56,653,975AnnualPercentageforExperienceSteps 2.03% 2.03% 2.03% 2.03% 2.03% 2.03%AnnualPercentageforDegreeChange 0.40% 0.40% 0.40% 0.40% 0.40% 0.40%AnnualPercentageChangeforNegotiations 2.25% 2.50% 2.00% 2.00% 2.25% 2.25%AnnualPercentageChangeforMeritPay 0.00% 0.00% 0.00% 0.00% 0.00% 0.00%TotalPercentageChange 4.68% 4.93% 4.43% 4.43% 4.68% 4.68%DollarChangeduetoPercentageChange 2,106,846 2,347,971 2,230,293 2,329,677 2,556,780 2,651,406OtherDollarChangeTotalDollarChangeCertified 2,106,846 2,347,971 2,230,293 2,329,677 2,556,780 2,651,406EstimatedClassifiedAnnualSalary 7,982,317 8,529,113 9,023,089 9,435,268 9,854,735 10,274,981Annual%BlendedAllocationClassified 2.00% 2.00% 2.00% 2.00% 2.00% 2.00%Annual%BlendedAllocationExempted 0.00% 0.00% 0.00% 0.00% 0.00% 0.00%AnnualPercentageChangeforNegotiations 2.25% 2.25% 1.50% 2.25% 2.25% 2.25%AnnualPercentageChangeforMeritPay 0.00% 0.00% 0.00% 0.00% 0.00% 0.00%TotalPercentageChange 4.25% 4.25% 3.50% 4.25% 4.25% 4.25%DollarChangeduetoPercentageChange 339,248 362,487 315,808 400,999 418,826 436,687OtherDollarChangeTotalDollarChangeClassified 339,248 362,487 315,808 400,999 418,826 436,687EstimatedAdministrativeAnnualSalary 6,067,018 6,538,392 6,958,350 7,276,211 7,599,692 7,923,774AnnualPercentageforExperienceSteps 0.00% 0.00% 0.00% 0.00% 0.00% 0.00%AnnualPercentageforDegreeChange 0.00% 0.00% 0.00% 0.00% 0.00% 0.00%AnnualPercentageChangeforNegotiations 0.00% 0.00% 0.00% 0.00% 0.00% 0.00%AnnualPercentageChangeforMeritPay 2.50% 2.50% 2.50% 2.50% 2.50% 2.50%TotalPercentageChange 2.50% 2.50% 2.50% 2.50% 2.50% 2.50%DollarChangeduetoPercentageChange 151,675 163,460 173,959 181,905 189,992 198,094OtherDollarChangeTotalDollarChangeAdministrative 151,675 163,460 173,959 181,905 189,992 198,094EstimatedAnnualAmountforOT/Subs/Severanc 2,109,369 2,210,949 2,332,121 2,438,654 2,547,070 2,655,687
AnnualPercentageChange 2.50% 2.50% 2.50% 2.50% 2.50% 2.50%DollarChangeduetoPercentageChange 52,734 55,274 58,303 60,966 63,677 66,392OtherDollarChangeTotalDollarChangeOT/Subs/Severance 52,734 55,274 58,303 60,966 63,677 66,392EstimatedAnnualAmountforSupplementals 648,799 680,043 717,313 750,080 783,427 816,835
AnnualPercentageChange 0.72% 0.72% 0.72% 0.72% 0.72% 0.72%DollarChangeduetoPercentageChange 4,671 4,896 5,165 5,401 5,641 5,881OtherDollarChangeTotalDollarChangeSupplementals 4,671 4,896 5,165 5,401 5,641 5,881EstimatedAnnualAmountforOther ‐ ‐ ‐ ‐ ‐ ‐
AnnualPercentageChange 0.00% 0.00% 0.00% 0.00% 0.00% 0.00%DollarChangeduetoPercentageChange ‐ ‐ ‐ ‐ ‐ ‐OtherDollarChangeTotalDollarChangeOther ‐ ‐ ‐ ‐ ‐ ‐
AnnualChangeinAllGroups 2,655,176$ 2,934,088$ 2,783,527$ 2,978,948$ 3,234,916$ 3,358,460$Howmuchofthischangeisallocatedtothecurrent 86.00% 86.00% 86.00% 86.00% 86.00% 86.00%DollarIncreasefromCurrentYear'sChanges 2,283,451$ 2,523,315$ 2,393,833$ 2,561,896$ 2,782,028$ 2,888,276$DollarIncreasesfromPreviousYear'sChanges 417,330 371,725$ 410,772$ 389,694$ 417,053$ 452,888$TotalforDetailedNote1‐FTEChange 2,700,781 2,895,040 2,804,606 2,951,590 3,199,080 3,341,164
29
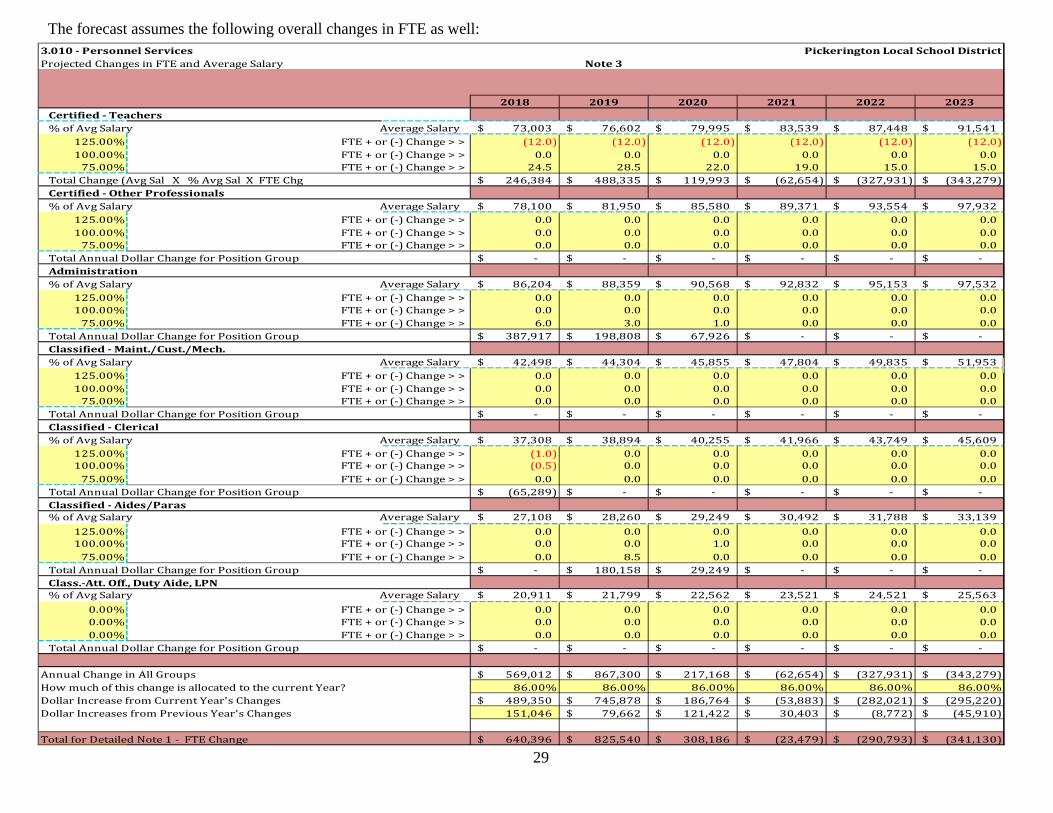
3.010‐PersonnelServices PickeringtonLocalSchoolDistrictProjectedChangesinFTEandAverageSalary Note3
2018 2019 2020 2021 2022 2023Certified‐Teachers%ofAvgSalary AverageSalary 73,003$ 76,602$ 79,995$ 83,539$ 87,448$ 91,541$
125.00% FTE+or(‐)Change>> (12.0) (12.0) (12.0) (12.0) (12.0) (12.0)100.00% FTE+or(‐)Change>> 0.0 0.0 0.0 0.0 0.0 0.075.00% FTE+or(‐)Change>> 24.5 28.5 22.0 19.0 15.0 15.0
TotalChange(AvgSalX%AvgSalXFTEChg 246,384$ 488,335$ 119,993$ (62,654)$ (327,931)$ (343,279)$Certified‐OtherProfessionals%ofAvgSalary AverageSalary 78,100$ 81,950$ 85,580$ 89,371$ 93,554$ 97,932$
125.00% FTE+or(‐)Change>> 0.0 0.0 0.0 0.0 0.0 0.0100.00% FTE+or(‐)Change>> 0.0 0.0 0.0 0.0 0.0 0.075.00% FTE+or(‐)Change>> 0.0 0.0 0.0 0.0 0.0 0.0
TotalAnnualDollarChangeforPositionGroup ‐$ ‐$ ‐$ ‐$ ‐$ ‐$Administration%ofAvgSalary AverageSalary 86,204$ 88,359$ 90,568$ 92,832$ 95,153$ 97,532$
125.00% FTE+or(‐)Change>> 0.0 0.0 0.0 0.0 0.0 0.0100.00% FTE+or(‐)Change>> 0.0 0.0 0.0 0.0 0.0 0.075.00% FTE+or(‐)Change>> 6.0 3.0 1.0 0.0 0.0 0.0
TotalAnnualDollarChangeforPositionGroup 387,917$ 198,808$ 67,926$ ‐$ ‐$ ‐$Classified‐Maint./Cust./Mech.%ofAvgSalary AverageSalary 42,498$ 44,304$ 45,855$ 47,804$ 49,835$ 51,953$
125.00% FTE+or(‐)Change>> 0.0 0.0 0.0 0.0 0.0 0.0100.00% FTE+or(‐)Change>> 0.0 0.0 0.0 0.0 0.0 0.075.00% FTE+or(‐)Change>> 0.0 0.0 0.0 0.0 0.0 0.0
TotalAnnualDollarChangeforPositionGroup ‐$ ‐$ ‐$ ‐$ ‐$ ‐$Classified‐Clerical%ofAvgSalary AverageSalary 37,308$ 38,894$ 40,255$ 41,966$ 43,749$ 45,609$
125.00% FTE+or(‐)Change>> (1.0) 0.0 0.0 0.0 0.0 0.0100.00% FTE+or(‐)Change>> (0.5) 0.0 0.0 0.0 0.0 0.075.00% FTE+or(‐)Change>> 0.0 0.0 0.0 0.0 0.0 0.0
TotalAnnualDollarChangeforPositionGroup (65,289)$ ‐$ ‐$ ‐$ ‐$ ‐$Classified‐Aides/Paras%ofAvgSalary AverageSalary 27,108$ 28,260$ 29,249$ 30,492$ 31,788$ 33,139$
125.00% FTE+or(‐)Change>> 0.0 0.0 0.0 0.0 0.0 0.0100.00% FTE+or(‐)Change>> 0.0 0.0 1.0 0.0 0.0 0.075.00% FTE+or(‐)Change>> 0.0 8.5 0.0 0.0 0.0 0.0
TotalAnnualDollarChangeforPositionGroup ‐$ 180,158$ 29,249$ ‐$ ‐$ ‐$Class.‐Att.Off.,DutyAide,LPN%ofAvgSalary AverageSalary 20,911$ 21,799$ 22,562$ 23,521$ 24,521$ 25,563$
0.00% FTE+or(‐)Change>> 0.0 0.0 0.0 0.0 0.0 0.00.00% FTE+or(‐)Change>> 0.0 0.0 0.0 0.0 0.0 0.00.00% FTE+or(‐)Change>> 0.0 0.0 0.0 0.0 0.0 0.0
TotalAnnualDollarChangeforPositionGroup ‐$ ‐$ ‐$ ‐$ ‐$ ‐$
AnnualChangeinAllGroups 569,012$ 867,300$ 217,168$ (62,654)$ (327,931)$ (343,279)$HowmuchofthischangeisallocatedtothecurrentYear? 86.00% 86.00% 86.00% 86.00% 86.00% 86.00%DollarIncreasefromCurrentYear'sChanges 489,350$ 745,878$ 186,764$ (53,883)$ (282,021)$ (295,220)$DollarIncreasesfromPreviousYear'sChanges 151,046 79,662$ 121,422$ 30,403$ (8,772)$ (45,910)$
TotalforDetailedNote1‐FTEChange 640,396$ 825,540$ 308,186$ (23,479)$ (290,793)$ (341,130)$
The forecast assumes the following overall changes in FTE as well:

30
3.010‐PersonnelServices PickeringtonLocalSchoolDistrictHistoricalandProjectedFTE&AverageSalaries Note2
Historical>>> 2012 2013 2014 2015 2016 2017AllFundsperODEEMIS Certified 642.21 651.63 682.33 706.92 703.50 736.65
Classified 259.17 252.60 261.90 280.88 287.47 311.16Total 901.38 904.23 944.23 987.80 990.97 1,047.81
NetChange 2.85 40.00 43.57 3.17 56.842018 2019 2020 2021 2022 2023
AvgSalary<< 201873,003$ Certified‐Teachers 660.06 676.56 686.56 693.56 696.56 699.5678,100$ Certified‐OtherProfessionals 27.00 27.00 27.00 27.00 27.00 27.0086,204$ Administration 76.19 79.19 80.19 80.19 80.19 80.1942,498$ Classified‐Maint./Cust./Mech. 82.27 82.27 82.27 82.27 82.27 82.2737,308$ Classified‐Clerical 58.06 58.06 58.06 58.06 58.06 58.0627,108$ Classified‐Aides/Paras 79.28 87.78 88.78 88.78 88.78 88.7820,911$ Class.‐Att.Off.,DutyAide,LPN 43.28 43.28 43.28 43.28 43.28 43.28
‐$ FoodService‐‐InformationalOnly 45.64 45.64 45.64 45.64 45.64 45.64NetFTEAllFunds 1,071.78 1,099.78 1,111.78 1,118.78 1,121.78 1,124.78
CertifiedNotClassifiedAboveClassifiedNotIncludedAbove
NetFTEAllFunds 1,071.78 1,099.78 1,111.78 1,118.78 1,121.78 1,124.78
Certified 763.25 782.75 793.75 800.75 803.75 806.75Classified 308.53 317.03 318.03 318.03 318.03 318.03
Total 1,071.78 1,099.78 1,111.78 1,118.78 1,121.78 1,124.78NetChange 23.97 28.00 12.00 7.00 3.00 3.00
The following chart shows historical and projected FTE levels: **Note: Beginning in FY17, this tool is also used to track federally funded staff instead of just local staff. To reconcile the difference between FY16 and FY17 in total FTE for the general fund only, subtract 30.0 FTE staff members who are federally funded. I.E., FY17 total FTE with federal funds is 1,047.81. Subtract out 30.0 FTE federal staff FTE to get a net General Fund FTE for FY17 of 1,017.81. Net change in general fund FTE from FY16 to FY17 is therefore 26.84 FTE. Additionally, beginning in FY17, food service staff pulled out into its own group—no effect on general fund finances due to food service being paid from fund 006.

31
A detailed look at the changes in wage inflation and FTEs, and how these factors affect overall personnel wages, follows in Exhibit 8.
Rest of Page Left Intentionally Blank
32
3.010‐PersonnelServices PickeringtonLocalSchoolDistrictExpenditureDetailNote
PercentageofTotalExpenditures:56.1% Actual Projected
2018 2019 2020 2021 2022 2023ActualAmountExpendedinPriorYear: 63,032,847 65,584,805 69,376,218 72,489,010 75,417,120 78,325,408
One‐TimeAdjustmentstoPriorYearBasisBudgetModeling ‐ ‐ ‐ ‐ ‐NetBasistobeUsedforCurrentandSubsequentForecastedAmount: 61,825,707 65,584,805 69,376,218 72,489,010 75,417,120 78,325,408Note1 Negotiations,Steps,Etc 2,700,781 2,895,040 2,804,606 2,951,590 3,199,080 3,341,164
TotalAnnualSalaryChange 2,700,781 2,895,040 2,804,606 2,951,590 3,199,080 3,341,164
OngoingAdjustmentstoCurrent&SubsequentYearsPCSbecomingalternativeschool;personnelcostsadded 354,167 70,833
Note3 ChangesinFTE&Avg.Salary 640,396 825,540 308,186 (23,479) (290,793) (341,130)AdjustforPriorYearActualandCurrentYearCashFlow 64,815
Total 65,584,805 65,585,865 69,376,218 72,489,010 75,417,120 78,325,408 81,325,442DollarChangeoverPrioryear 2,553,018 3,790,353 3,112,792 2,928,110 2,908,288 3,000,034PercentageChangeoverPriorYear 4.05% 5.78% 4.49% 4.04% 3.86% 3.83%
2013 ##########2014 ########## 2,972,773 5.88%2015 ########## 2,891,301 5.40%2016 ########## 1,382,214 2.45%2017 ########## 5,189,393 8.97%2018 ########## 2,551,958 4.05%2019 ########## 3,791,413 5.78%2020 ########## 3,112,792 4.49%2021 ########## 2,928,110 4.04%2022 ########## 2,908,288 3.86%2023 ########## 3,000,034 3.83%
$0
$1,000,000
$2,000,000
$3,000,000
$4,000,000
$5,000,000
$6,000,000
2014 2015 2016 2017 2018 2019 2020 2021 2022 2023
Year‐Over‐YearDollarChangeinExpenditureLine
Exhibit 8—Detailed Look at Personnel Services
33
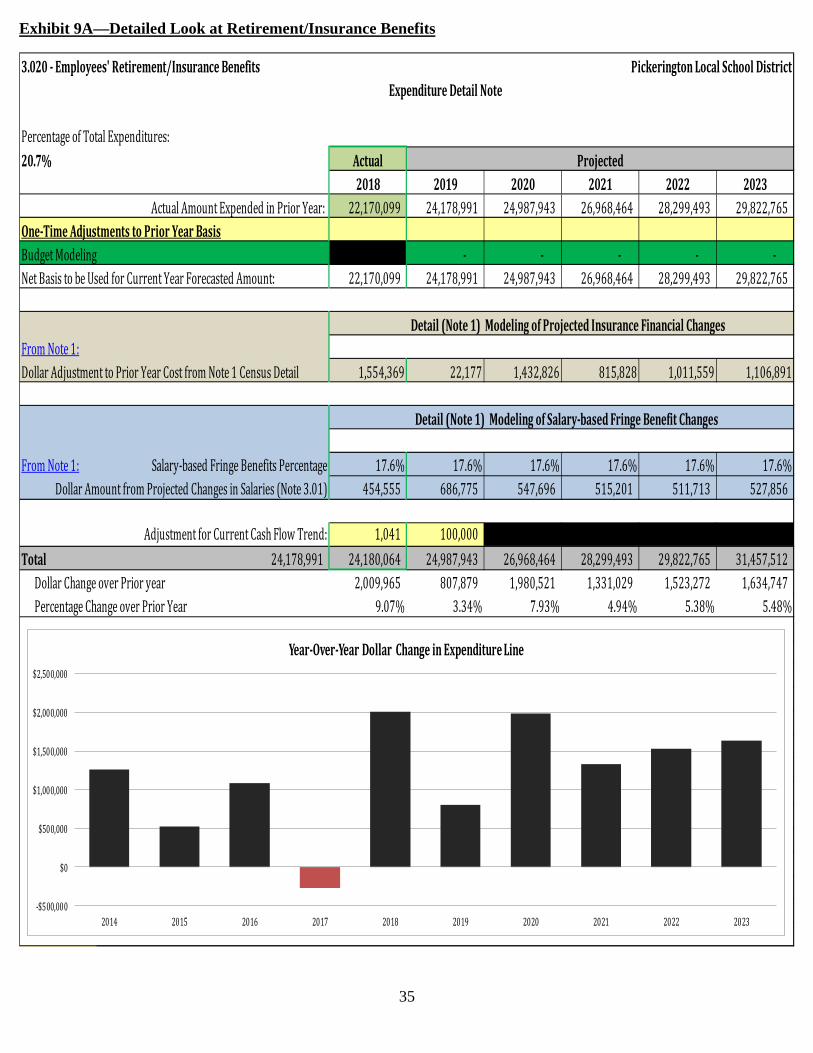
LINE 3.020--Employees’ Retirement/Insurance Benefits. This line item is based on the negotiated agreement with the PEA and PSSA, employee benefit plans and Board policy. Representing 20.7% of general fund expenses, this category includes retirement system contributions, Medicare, medical/dental/life insurance, workers’ compensation, School Employees Retirement System surcharge, and unemployment compensation. As noted in the note on Personnel Services/Salaries (Line 3.010), the PLSD Board of Education completed negotiations with the PEA in May of 2018, and the PSSA in the spring of 2017. The new PEA agreement is effective July 1, 2018, and runs through June 30, 2021. The PSSA agreement runs through June 30, 2020. During the most recent negotiations with the PEA in May of 2018, minor changes to the plan were enacted to help to offset some claims costs. However, even with those changes, the forecasted increase for health care premiums for the 2018-2019 school year was 10.1%. For the 2019-2020 school year, the medical insurance premiums will stay steady due to the performance of the health insurance self-insured fund (i.e. 0% increase). For 2020-2021, 2021-2022, and 2022-2023, the forecasted increases are 6.50%, 6.75%, and 7.00%. These are considerably lower than the October submission due to updated medical trend data provided to the District by its insurance consultants. Based on increased staffing projections noted in Line 3.010, the District is forecasting increased costs for salary driven fringes. Every school must pay an additional 14% in STRS/SERS contributions for each $1 paid to an employee. Additionally, the Board share of Medicare is 1.45%, and Worker’s Compensation is about an additional .5%. In all, every $1 paid to an employee results in an additional $.16 paid in salary driven fringes. Hence, new employees add additional benefit costs. Finally, additional employees also typically generate increased enrollment in the health care plan. With the Board paying 80% of premium costs, added staffing also adds to health care costs in the form of more premium volume. Along with the increase in premium costs each year of the forecast, the added staffing is forecasted to substantially increase the cost of health care for the District in future years. Future enrollment trends are forecasted as follows: 2018-2019: 795 employees 2019-2020: 806 employees (increase of about 11 employees over 2018-2019) 2020-2021: 810 employees (increase of about 4 employees over 2019-2020) 2021-2022: 813 employees (increase of about 3 employees over 2020-2021) 2022-2023: 816 employees (increase of about 3 employees over 2021-2022) Finally, the Cadillac Tax, as enacted by the Patient Protection and Affordable Care Act, has again been delayed by Congress until 2022. This trend will always need to be monitored as the 40% Excise Tax associated with it would be devastating to the District.
34
A more detailed look at Retirement/Insurance Benefit costs follows in Exhibits 9A—9E:
Rest of Page Left Intentionally Blank
35
3.020‐Employees'Retirement/InsuranceBenefits PickeringtonLocalSchoolDistrictExpenditureDetailNote
PercentageofTotalExpenditures:20.7% Actual Projected
2018 2019 2020 2021 2022 2023ActualAmountExpendedinPriorYear: 22,170,099 24,178,991 24,987,943 26,968,464 28,299,493 29,822,765
One‐TimeAdjustmentstoPriorYearBasisBudgetModeling ‐ ‐ ‐ ‐ ‐NetBasistobeUsedforCurrentYearForecastedAmount: 22,170,099 24,178,991 24,987,943 26,968,464 28,299,493 29,822,765
Detail(Note1)ModelingofProjectedInsuranceFinancialChangesFromNote1:DollarAdjustmenttoPriorYearCostfromNote1CensusDetail 1,554,369 22,177 1,432,826 815,828 1,011,559 1,106,891
Detail(Note1)ModelingofSalary‐basedFringeBenefitChanges
FromNote1: Salary‐basedFringeBenefitsPercentage 17.6% 17.6% 17.6% 17.6% 17.6% 17.6%DollarAmountfromProjectedChangesinSalaries(Note3.01) 454,555 686,775 547,696 515,201 511,713 527,856
AdjustmentforCurrentCashFlowTrend: 1,041 100,000Total 24,178,991 24,180,064 24,987,943 26,968,464 28,299,493 29,822,765 31,457,512
DollarChangeoverPrioryear 2,009,965 807,879 1,980,521 1,331,029 1,523,272 1,634,747PercentageChangeoverPriorYear 9.07% 3.34% 7.93% 4.94% 5.38% 5.48%
2013 ##########2014 ########## 1,253,383 6.40%2015 ########## 527,852 2.53%2016 ########## 1,081,862 5.07%2017 ########## (270,315) ‐1.20%2018 ########## 2,008,892 9.06%2019 ########## 808,952 3.35%2020 ########## 1,980,521 7.93%2021 ########## 1,331,029 4.94%2022 ########## 1,523,272 5.38%2023 ########## 1,634,747 5.48%
‐$500,000
$0
$500,000
$1,000,000
$1,500,000
$2,000,000
$2,500,000
2014 2015 2016 2017 2018 2019 2020 2021 2022 2023
Year‐Over‐YearDollarChangeinExpenditureLine
Exhibit 9A—Detailed Look at Retirement/Insurance Benefits
36
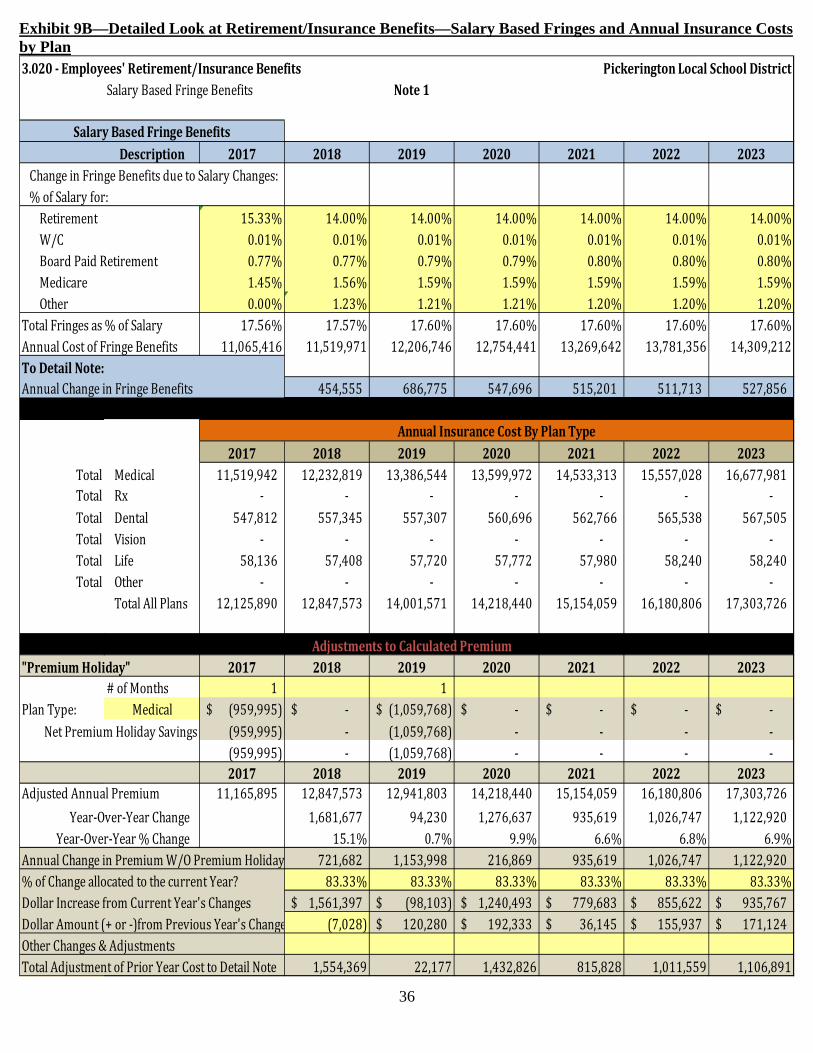
3.020‐Employees'Retirement/InsuranceBenefits PickeringtonLocalSchoolDistrictSalaryBasedFringeBenefits Note1
SalaryBasedFringeBenefitsDescription 2017 2018 2019 2020 2021 2022 2023
ChangeinFringeBenefitsduetoSalaryChanges:%ofSalaryfor:Retirement 15.33% 14.00% 14.00% 14.00% 14.00% 14.00% 14.00%W/C 0.01% 0.01% 0.01% 0.01% 0.01% 0.01% 0.01%BoardPaidRetirement 0.77% 0.77% 0.79% 0.79% 0.80% 0.80% 0.80%Medicare 1.45% 1.56% 1.59% 1.59% 1.59% 1.59% 1.59%
Other 0.00% 1.23% 1.21% 1.21% 1.20% 1.20% 1.20%TotalFringesas%ofSalary 17.56% 17.57% 17.60% 17.60% 17.60% 17.60% 17.60%AnnualCostofFringeBenefits 11,065,416 11,519,971 12,206,746 12,754,441 13,269,642 13,781,356 14,309,212ToDetailNote:AnnualChangeinFringeBenefits 454,555 686,775 547,696 515,201 511,713 527,856
AnnualInsuranceCostByPlanType2017 2018 2019 2020 2021 2022 2023
Total Medical 11,519,942 12,232,819 13,386,544 13,599,972 14,533,313 15,557,028 16,677,981Total Rx ‐ ‐ ‐ ‐ ‐ ‐ ‐Total Dental 547,812 557,345 557,307 560,696 562,766 565,538 567,505Total Vision ‐ ‐ ‐ ‐ ‐ ‐ ‐Total Life 58,136 57,408 57,720 57,772 57,980 58,240 58,240Total Other ‐ ‐ ‐ ‐ ‐ ‐ ‐
TotalAllPlans 12,125,890 12,847,573 14,001,571 14,218,440 15,154,059 16,180,806 17,303,726
AdjustmentstoCalculatedPremium"PremiumHoliday" 2017 2018 2019 2020 2021 2022 2023
#ofMonths 1 1PlanType: Medical (959,995)$ ‐$ (1,059,768)$ ‐$ ‐$ ‐$ ‐$
NetPremiumHolidaySavings (959,995) ‐ (1,059,768) ‐ ‐ ‐ ‐(959,995) ‐ (1,059,768) ‐ ‐ ‐ ‐2017 2018 2019 2020 2021 2022 2023
AdjustedAnnualPremium 11,165,895 12,847,573 12,941,803 14,218,440 15,154,059 16,180,806 17,303,726Year‐Over‐YearChange 1,681,677 94,230 1,276,637 935,619 1,026,747 1,122,920
Year‐Over‐Year%Change 15.1% 0.7% 9.9% 6.6% 6.8% 6.9%AnnualChangeinPremiumW/OPremiumHoliday 721,682 1,153,998 216,869 935,619 1,026,747 1,122,920%ofChangeallocatedtothecurrentYear? 83.33% 83.33% 83.33% 83.33% 83.33% 83.33%DollarIncreasefromCurrentYear'sChanges 1,561,397$ (98,103)$ 1,240,493$ 779,683$ 855,622$ 935,767$DollarAmount(+or‐)fromPreviousYear'sChange (7,028) 120,280$ 192,333$ 36,145$ 155,937$ 171,124$OtherChanges&AdjustmentsTotalAdjustmentofPriorYearCosttoDetailNote 1,554,369 22,177 1,432,826 815,828 1,011,559 1,106,891
Exhibit 9B—Detailed Look at Retirement/Insurance Benefits—Salary Based Fringes and Annual Insurance Costs by Plan

37
3.020‐Employees'Retirement/InsuranceBenefits PickeringtonLocalSchoolDistrictFTE‐basedInsuranceBenefits Note2
EnternumberofGeneralFundPlans InsuranceEnrollment(Census)andCost
2017 2018 2019 2020 2021 2022 2023PlanDescription Actual Actual InsuranceCensusbyPlanProjectionsBlueAccessPPOPlanASingle1.0FTE 210 224 215 222 225 227 230BlueAccessPPOPlanAFamily1.0FTE 557 559 567 574 575 576 576BlueAccessPPOPlanA‐NonAdminSingleCert.7FTE ‐ ‐ ‐ ‐ ‐ ‐ ‐BlueAccessPPOPlanA‐NonAdminFamilyCert.7FTE ‐ ‐ ‐ ‐ ‐ ‐ ‐BlueAccessPPOPlanA‐NonAdminSingleCert.625FTE ‐ ‐ ‐ ‐ ‐ ‐ ‐BlueAccessPPOPlanA‐NonAdminFamilyCert.625FTE ‐ ‐ ‐ ‐ ‐ ‐ ‐BlueAccessPPOPlanA‐NonAdminSingleCert.60FTE ‐ ‐ ‐ ‐ ‐ ‐ ‐BlueAccessPPOPlanA‐NonAdminFamilyCert.60FTEBlueAccessPPOPlanA‐NonAdminSingleCert.50FTE 1BlueAccessPPOPlanA‐NonAdminFamilyCert.50FTE 1 3BlueAccessPPOPlanA‐NonAdminSingleClassupto.75FTE 4 3BlueAccessPPOPlanA‐NonAdminFamilyClassupto.75FTE 7 5BlueAccessPPOPlanA‐NonAdminSingleClassupto.5625FTE 3 ‐BlueAccessPPOPlanA‐NonAdminFamilyClassupto.5625FTE 2 2BlueAccessPPOPlanA‐NonAdminSingleClassupto.375FTE 4 1BlueAccessPPOPlanA‐NonAdminFamilyClassupto.375FTE ‐ ‐ ‐ ‐ ‐ ‐ ‐LumenosHDHPSingleAdmin 1LumenosHDHPFamilyAdminLumenosHDHPSingleClassified 5 5 5 5 5 5LumenosHDHPFamilyClassified 3 5 4 5 5 5 5LifeInsurance 1,118 1,104 1,110 1,111 1,115 1,120 1,120DeltaDentalAdmins 57 69 75 76 77 78 78DeltaDentalNon‐Admins 760 770 771 775 775 776 777DeltaDentalOtherBlended 16 ‐ ‐ ‐ ‐ ‐ ‐
Exhibit 9C—Detailed Look at Retirement/Insurance Benefits—Forecasted Number of Plan Participants
38
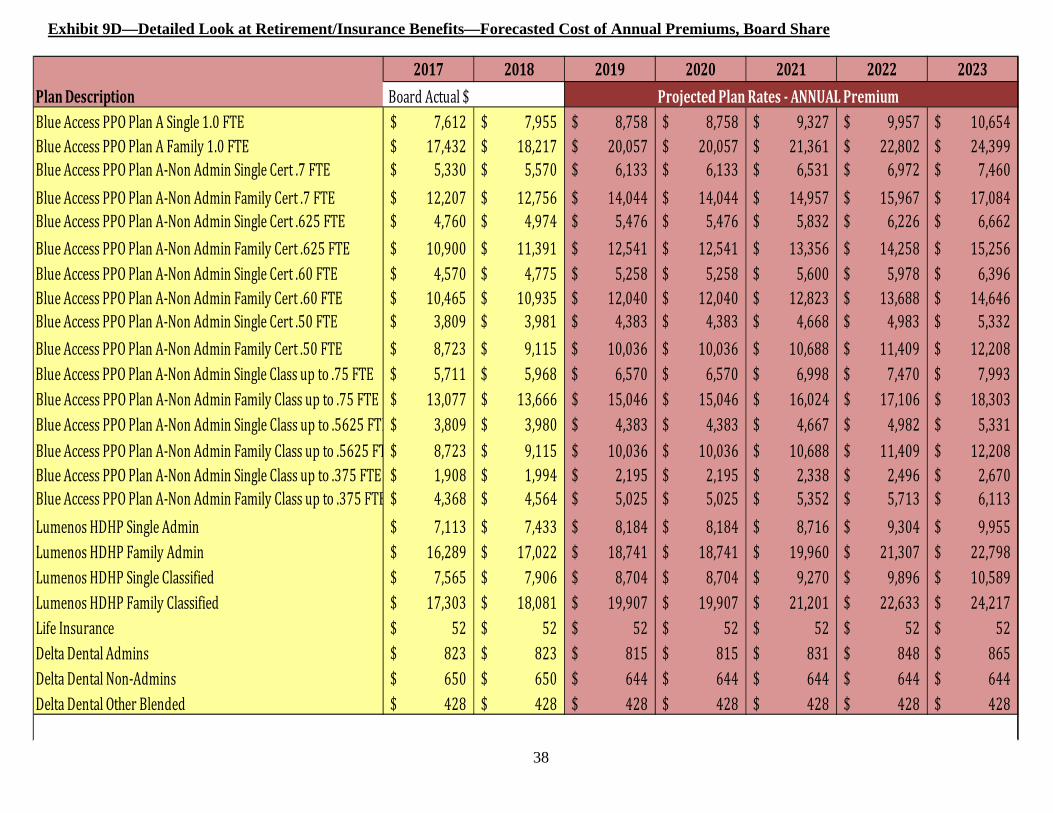
2017 2018 2019 2020 2021 2022 2023PlanDescription BoardActual$ ProjectedPlanRates‐ANNUALPremiumBlueAccessPPOPlanASingle1.0FTE 7,612$ 7,955$ 8,758$ 8,758$ 9,327$ 9,957$ 10,654$BlueAccessPPOPlanAFamily1.0FTE 17,432$ 18,217$ 20,057$ 20,057$ 21,361$ 22,802$ 24,399$BlueAccessPPOPlanA‐NonAdminSingleCert.7FTE 5,330$ 5,570$ 6,133$ 6,133$ 6,531$ 6,972$ 7,460$BlueAccessPPOPlanA‐NonAdminFamilyCert.7FTE 12,207$ 12,756$ 14,044$ 14,044$ 14,957$ 15,967$ 17,084$BlueAccessPPOPlanA‐NonAdminSingleCert.625FTE 4,760$ 4,974$ 5,476$ 5,476$ 5,832$ 6,226$ 6,662$BlueAccessPPOPlanA‐NonAdminFamilyCert.625FTE 10,900$ 11,391$ 12,541$ 12,541$ 13,356$ 14,258$ 15,256$BlueAccessPPOPlanA‐NonAdminSingleCert.60FTE 4,570$ 4,775$ 5,258$ 5,258$ 5,600$ 5,978$ 6,396$BlueAccessPPOPlanA‐NonAdminFamilyCert.60FTE 10,465$ 10,935$ 12,040$ 12,040$ 12,823$ 13,688$ 14,646$BlueAccessPPOPlanA‐NonAdminSingleCert.50FTE 3,809$ 3,981$ 4,383$ 4,383$ 4,668$ 4,983$ 5,332$BlueAccessPPOPlanA‐NonAdminFamilyCert.50FTE 8,723$ 9,115$ 10,036$ 10,036$ 10,688$ 11,409$ 12,208$BlueAccessPPOPlanA‐NonAdminSingleClassupto.75FTE 5,711$ 5,968$ 6,570$ 6,570$ 6,998$ 7,470$ 7,993$BlueAccessPPOPlanA‐NonAdminFamilyClassupto.75FTE 13,077$ 13,666$ 15,046$ 15,046$ 16,024$ 17,106$ 18,303$BlueAccessPPOPlanA‐NonAdminSingleClassupto.5625FTE 3,809$ 3,980$ 4,383$ 4,383$ 4,667$ 4,982$ 5,331$BlueAccessPPOPlanA‐NonAdminFamilyClassupto.5625FT 8,723$ 9,115$ 10,036$ 10,036$ 10,688$ 11,409$ 12,208$BlueAccessPPOPlanA‐NonAdminSingleClassupto.375FTE 1,908$ 1,994$ 2,195$ 2,195$ 2,338$ 2,496$ 2,670$BlueAccessPPOPlanA‐NonAdminFamilyClassupto.375FTE 4,368$ 4,564$ 5,025$ 5,025$ 5,352$ 5,713$ 6,113$LumenosHDHPSingleAdmin 7,113$ 7,433$ 8,184$ 8,184$ 8,716$ 9,304$ 9,955$LumenosHDHPFamilyAdmin 16,289$ 17,022$ 18,741$ 18,741$ 19,960$ 21,307$ 22,798$LumenosHDHPSingleClassified 7,565$ 7,906$ 8,704$ 8,704$ 9,270$ 9,896$ 10,589$LumenosHDHPFamilyClassified 17,303$ 18,081$ 19,907$ 19,907$ 21,201$ 22,633$ 24,217$LifeInsurance 52$ 52$ 52$ 52$ 52$ 52$ 52$DeltaDentalAdmins 823$ 823$ 815$ 815$ 831$ 848$ 865$DeltaDentalNon‐Admins 650$ 650$ 644$ 644$ 644$ 644$ 644$DeltaDentalOtherBlended 428$ 428$ 428$ 428$ 428$ 428$ 428$
Exhibit 9D—Detailed Look at Retirement/Insurance Benefits—Forecasted Cost of Annual Premiums, Board Share
39
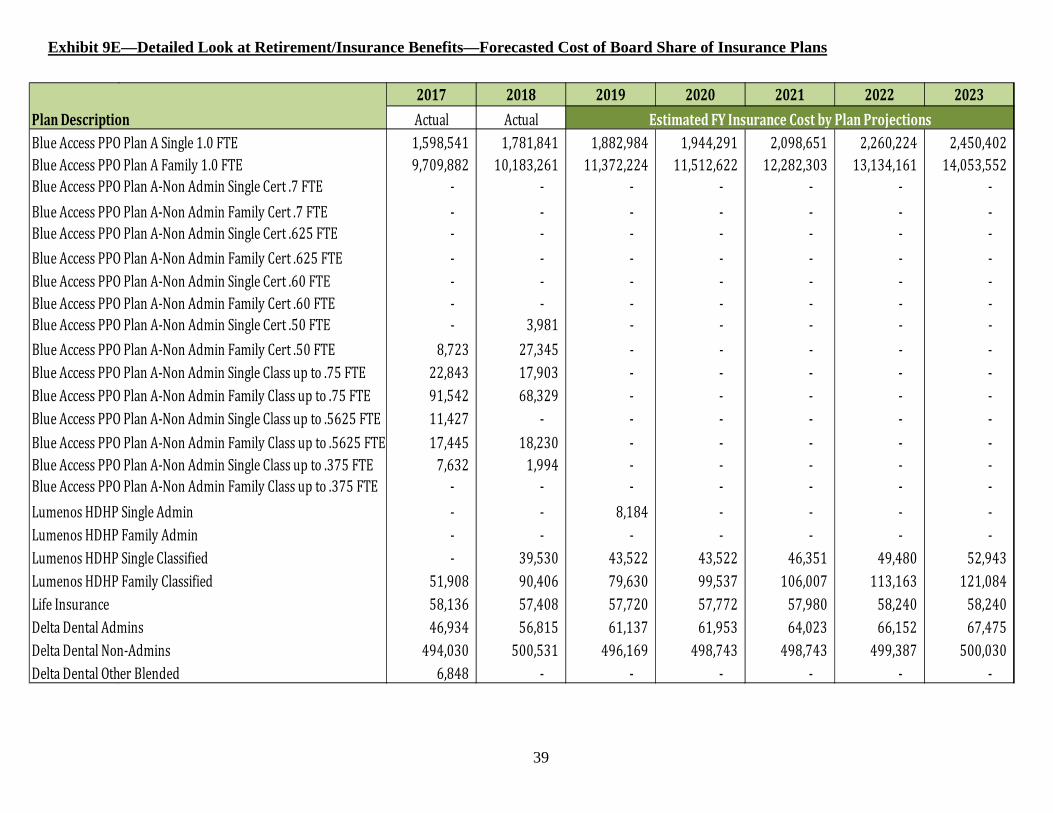
2017 2018 2019 2020 2021 2022 2023PlanDescription Actual Actual EstimatedFYInsuranceCostbyPlanProjectionsBlueAccessPPOPlanASingle1.0FTE 1,598,541 1,781,841 1,882,984 1,944,291 2,098,651 2,260,224 2,450,402BlueAccessPPOPlanAFamily1.0FTE 9,709,882 10,183,261 11,372,224 11,512,622 12,282,303 13,134,161 14,053,552BlueAccessPPOPlanA‐NonAdminSingleCert.7FTE ‐ ‐ ‐ ‐ ‐ ‐ ‐BlueAccessPPOPlanA‐NonAdminFamilyCert.7FTE ‐ ‐ ‐ ‐ ‐ ‐ ‐BlueAccessPPOPlanA‐NonAdminSingleCert.625FTE ‐ ‐ ‐ ‐ ‐ ‐ ‐BlueAccessPPOPlanA‐NonAdminFamilyCert.625FTE ‐ ‐ ‐ ‐ ‐ ‐ ‐BlueAccessPPOPlanA‐NonAdminSingleCert.60FTE ‐ ‐ ‐ ‐ ‐ ‐ ‐BlueAccessPPOPlanA‐NonAdminFamilyCert.60FTE ‐ ‐ ‐ ‐ ‐ ‐ ‐BlueAccessPPOPlanA‐NonAdminSingleCert.50FTE ‐ 3,981 ‐ ‐ ‐ ‐ ‐BlueAccessPPOPlanA‐NonAdminFamilyCert.50FTE 8,723 27,345 ‐ ‐ ‐ ‐ ‐BlueAccessPPOPlanA‐NonAdminSingleClassupto.75FTE 22,843 17,903 ‐ ‐ ‐ ‐ ‐BlueAccessPPOPlanA‐NonAdminFamilyClassupto.75FTE 91,542 68,329 ‐ ‐ ‐ ‐ ‐BlueAccessPPOPlanA‐NonAdminSingleClassupto.5625FTE 11,427 ‐ ‐ ‐ ‐ ‐ ‐BlueAccessPPOPlanA‐NonAdminFamilyClassupto.5625FTE 17,445 18,230 ‐ ‐ ‐ ‐ ‐BlueAccessPPOPlanA‐NonAdminSingleClassupto.375FTE 7,632 1,994 ‐ ‐ ‐ ‐ ‐BlueAccessPPOPlanA‐NonAdminFamilyClassupto.375FTE ‐ ‐ ‐ ‐ ‐ ‐ ‐LumenosHDHPSingleAdmin ‐ ‐ 8,184 ‐ ‐ ‐ ‐LumenosHDHPFamilyAdmin ‐ ‐ ‐ ‐ ‐ ‐ ‐LumenosHDHPSingleClassified ‐ 39,530 43,522 43,522 46,351 49,480 52,943LumenosHDHPFamilyClassified 51,908 90,406 79,630 99,537 106,007 113,163 121,084LifeInsurance 58,136 57,408 57,720 57,772 57,980 58,240 58,240DeltaDentalAdmins 46,934 56,815 61,137 61,953 64,023 66,152 67,475DeltaDentalNon‐Admins 494,030 500,531 496,169 498,743 498,743 499,387 500,030DeltaDentalOtherBlended 6,848 ‐ ‐ ‐ ‐ ‐ ‐
Exhibit 9E—Detailed Look at Retirement/Insurance Benefits—Forecasted Cost of Board Share of Insurance Plans
40
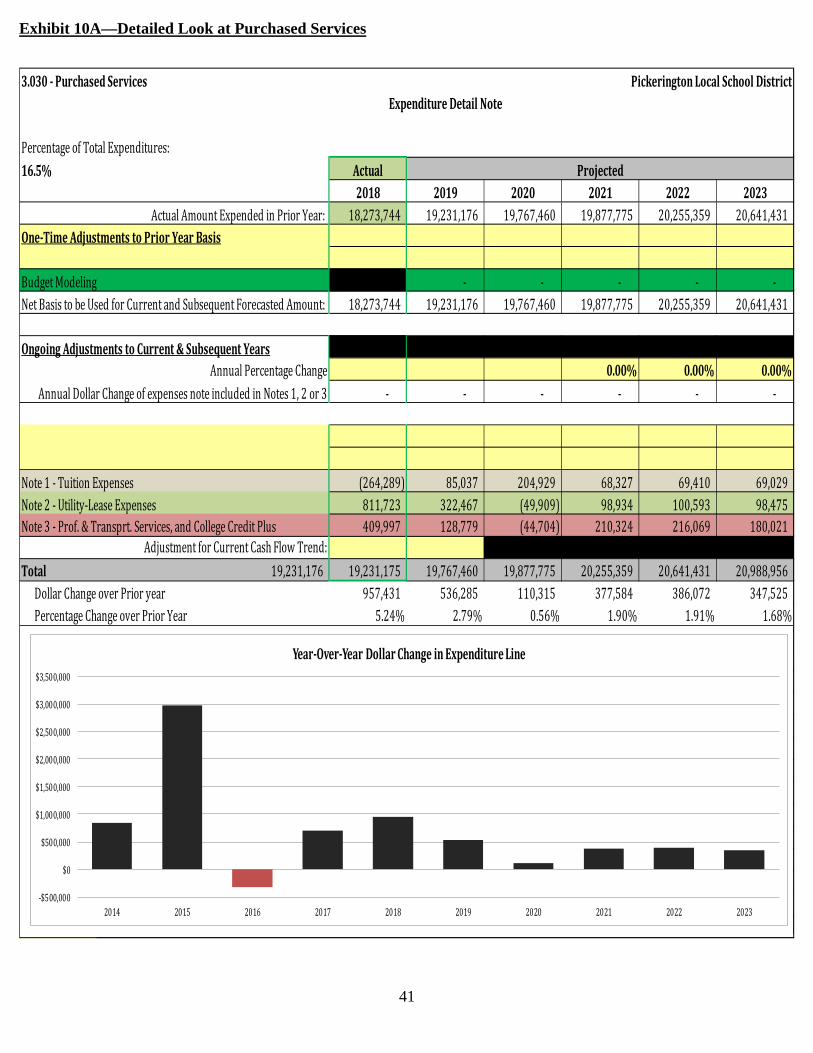
LINE 3.030—Purchased Services. This line item is based on historical patterns and current economic factors. Year over year increases for major components like utilities, transportation services, etc. are now included in the detailed notes for the specific object codes referencing these items (see exhibits 10B-10D). Expenses for purchased services account for about 16.5% of general fund expenses. This category includes a wide variety of expenditures, including:
utilities; student transportation; tuition paid to other Districts (SF-14, SF-14H, SF-PD, etc.—deductions automatically taken from State Funding) College Credit Plus Tuition Legal fees and other professional services; repairs and maintenance all District major leases, including the 1:1 technology device leases network connectivity for Internet and WAN (wide area network) connectivity
A more detailed look at Purchased Services costs follows in Exhibits 10A—10D:
Rest of Page Left Intentionally Blank
41
3.030‐PurchasedServices PickeringtonLocalSchoolDistrictExpenditureDetailNote
PercentageofTotalExpenditures:16.5% Actual Projected
2018 2019 2020 2021 2022 2023ActualAmountExpendedinPriorYear: 18,273,744 19,231,176 19,767,460 19,877,775 20,255,359 20,641,431
One‐TimeAdjustmentstoPriorYearBasis
BudgetModeling ‐ ‐ ‐ ‐ ‐NetBasistobeUsedforCurrentandSubsequentForecastedAmount: 18,273,744 19,231,176 19,767,460 19,877,775 20,255,359 20,641,431
OngoingAdjustmentstoCurrent&SubsequentYearsAnnualPercentageChange 0.00% 0.00% 0.00%
AnnualDollarChangeofexpensesnoteincludedinNotes1,2or3 ‐ ‐ ‐ ‐ ‐ ‐
Note1‐TuitionExpenses (264,289) 85,037 204,929 68,327 69,410 69,029Note2‐Utility‐LeaseExpenses 811,723 322,467 (49,909) 98,934 100,593 98,475Note3‐Prof.&Transprt.Services,andCollegeCreditPlus 409,997 128,779 (44,704) 210,324 216,069 180,021
AdjustmentforCurrentCashFlowTrend:Total 19,231,176 19,231,175 19,767,460 19,877,775 20,255,359 20,641,431 20,988,956
DollarChangeoverPrioryear 957,431 536,285 110,315 377,584 386,072 347,525PercentageChangeoverPriorYear 5.24% 2.79% 0.56% 1.90% 1.91% 1.68%
2013 14,077,9942014 14,915,445 837,451 5.95%2015 17,887,951 2,972,506 19.93%2016 17,571,040 (316,911) ‐1.77%2017 18,273,744 702,704 4.00%2018 19,231,176 957,432 5.24%2019 19,767,460 536,284 2.79%2020 19,877,775 110,315 0.56%2021 20,255,359 377,584 1.90%2022 20,641,431 386,072 1.91%2023 20,988,956 347,525 1.68%
‐$500,000
$0
$500,000
$1,000,000
$1,500,000
$2,000,000
$2,500,000
$3,000,000
$3,500,000
2014 2015 2016 2017 2018 2019 2020 2021 2022 2023
Year‐Over‐YearDollarChangeinExpenditureLine
Exhibit 10A—Detailed Look at Purchased Services

42
3.030‐PurchasedServices PickeringtonLocalSchoolDistrictNote1
NameofExpensestobePresentedTuitionExpenses
Description 2017 2018 2019 2020 2021 2022 2023
471OtherDistrictTuition(SF14) 16,804 55,984 39,467 44,000 45,000 46,000 46,000%Changefromprioryear 0.0% 233.2% ‐29.5% 11.5% 2.3% 2.2% 0.0%
474ExcessCostTuition 49,624 55,068 28,856 50,372 50,624 50,877 50,877%Changefromprioryear 43.9% 11.0% ‐47.6% 74.6% 0.5% 0.5% 0.0%
475SF14H 6,798 58,281 20,246 45,451 45,678 45,907 45,907%Changefromprioryear 0.0% 757.4% ‐65.3% 124.5% 0.5% 0.5% 0.0%
475Scholarships 597,296 674,071 732,603 680,829 684,233 687,654 691,092%Changefromprioryear 10.7% 12.9% 8.7% ‐7.1% 0.5% 0.5% 0.5%
475OtherSpec.Ed./VEC 139,327 129,940 112,420 131,243 131,899 132,559 133,222%Changefromprioryear 0.0% ‐6.7% ‐13.5% 16.7% 0.5% 0.5% 0.5%
477OpenEnrollment 578,015 640,539 634,163 666,416 679,745 693,340 707,207%Changefromprioryear 5.0% 10.8% ‐1.0% 5.1% 2.0% 2.0% 2.0%
478Community&STEMSchool 2,332,643 1,362,176 1,468,573 1,497,944 1,527,903 1,558,461 1,589,631%Changefromprioryear ‐4.7% ‐41.6% 7.8% 2.0% 2.0% 2.0% 2.0%
479PS,OtherSpec.EdTuition 1,320,071 1,800,231 1,825,000 1,950,000 1,969,500 1,989,195 2,009,087%Changefromprioryear 5.5% 36.4% 1.4% 6.8% 1.0% 1.0% 1.0%
TotalPurchasedServices 18,273,744 19,231,176 19,767,460 19,877,775 20,255,359 20,641,431 20,988,956TotalTuitionExpenses 5,040,579 4,776,290 4,861,327 5,066,256 5,134,582 5,203,993 5,273,022TotalforDetailedNote1 ‐264,289 85,037 204,929 68,327 69,410 69,029
TotalPurchasedServices 100% 100% 100% 100% 100% 100%TuitionExpensesasa%oftotalPurchasedServic 25% 25% 25% 25% 25% 25%AnnualChangeinTuitionExpenses
25% 25% 25% 25% 25% 25%
0%
20%
40%
60%
80%
100%
120%
2018 2019 2020 2021 2022 2023
TuitionExpensesas a% oftotalPurchasedServices
TotalPurchasedServices TotalTuitionExpenses
‐300,000
‐200,000
‐100,000
0
100,000
200,000
300,000
2018 2019 2020 2021 2022 2023
Annual Change inTuitionExpenses
TuitionExpenses
0
1,000,000
2,000,000
3,000,000
4,000,000
5,000,000
6,000,000
2017 2018 2019 2020 2021 2022 2023
TuitionExpenses
471OtherDistrictTuition(SF14) 474ExcessCostTuition 475SF14H 475Scholarships 475OtherSpec.Ed./VEC 477OpenEnrollment 478Community&STEMSchool 479PS,OtherSpec.EdTuition
Exhibit 10B—Detailed Look at Tuition Expenses
43
3.030‐PurchasedServices PickeringtonLocalSchoolDistrictNote2
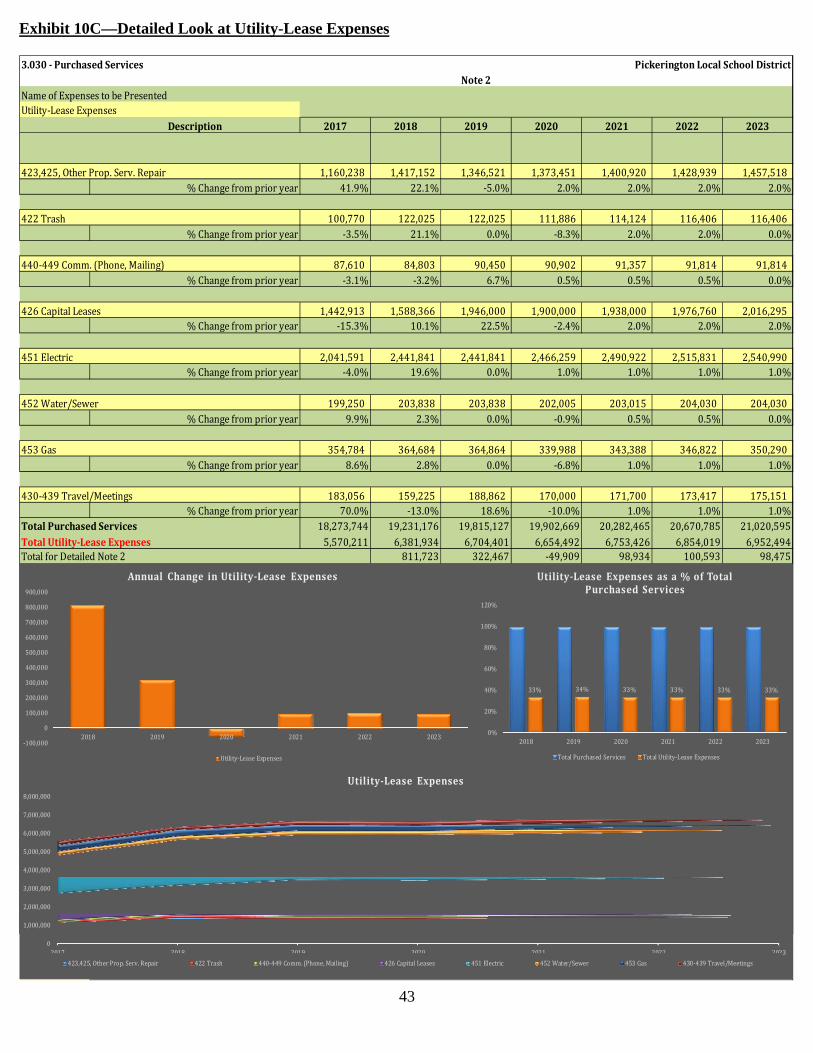
NameofExpensestobePresentedUtility‐LeaseExpenses
Description 2017 2018 2019 2020 2021 2022 2023
423,425,OtherProp.Serv.Repair 1,160,238 1,417,152 1,346,521 1,373,451 1,400,920 1,428,939 1,457,518%Changefromprioryear 41.9% 22.1% ‐5.0% 2.0% 2.0% 2.0% 2.0%
422Trash 100,770 122,025 122,025 111,886 114,124 116,406 116,406%Changefromprioryear ‐3.5% 21.1% 0.0% ‐8.3% 2.0% 2.0% 0.0%
440‐449Comm.(Phone,Mailing) 87,610 84,803 90,450 90,902 91,357 91,814 91,814%Changefromprioryear ‐3.1% ‐3.2% 6.7% 0.5% 0.5% 0.5% 0.0%
426CapitalLeases 1,442,913 1,588,366 1,946,000 1,900,000 1,938,000 1,976,760 2,016,295%Changefromprioryear ‐15.3% 10.1% 22.5% ‐2.4% 2.0% 2.0% 2.0%
451Electric 2,041,591 2,441,841 2,441,841 2,466,259 2,490,922 2,515,831 2,540,990%Changefromprioryear ‐4.0% 19.6% 0.0% 1.0% 1.0% 1.0% 1.0%
452Water/Sewer 199,250 203,838 203,838 202,005 203,015 204,030 204,030%Changefromprioryear 9.9% 2.3% 0.0% ‐0.9% 0.5% 0.5% 0.0%
453Gas 354,784 364,684 364,864 339,988 343,388 346,822 350,290
%Changefromprioryear 8.6% 2.8% 0.0% ‐6.8% 1.0% 1.0% 1.0%
430‐439Travel/Meetings 183,056 159,225 188,862 170,000 171,700 173,417 175,151%Changefromprioryear 70.0% ‐13.0% 18.6% ‐10.0% 1.0% 1.0% 1.0%
TotalPurchasedServices 18,273,744 19,231,176 19,815,127 19,902,669 20,282,465 20,670,785 21,020,595TotalUtility‐LeaseExpenses 5,570,211 6,381,934 6,704,401 6,654,492 6,753,426 6,854,019 6,952,494TotalforDetailedNote2 811,723 322,467 ‐49,909 98,934 100,593 98,475
TotalUtility‐LeaseExpenses 100% 100% 100% 100% 100% 100%Utility‐LeaseExpensesasa%ofTotalPurchasedServices 33% 34% 33% 33% 33% 33%AnnualChangeinUtility‐LeaseExpenses
0
1,000,000
2,000,000
3,000,000
4,000,000
5,000,000
6,000,000
7,000,000
8,000,000
2017 2018 2019 2020 2021 2022 2023
Utility‐Lease Expenses
423,425,OtherProp.Serv.Repair 422Trash 440‐449Comm.(Phone,Mailing) 426CapitalLeases 451Electric 452Water/Sewer 453Gas 430‐439Travel/Meetings
33% 34% 33% 33% 33% 33%
0%
20%
40%
60%
80%
100%
120%
2018 2019 2020 2021 2022 2023
Utility‐Lease Expensesas a% ofTotalPurchasedServices
TotalPurchasedServices TotalUtility‐LeaseExpenses
‐100,000
0
100,000
200,000
300,000
400,000
500,000
600,000
700,000
800,000
900,000
2018 2019 2020 2021 2022 2023
Annual Change inUtility‐Lease Expenses
Utility‐LeaseExpenses
Exhibit 10C—Detailed Look at Utility-Lease Expenses

44
3.030‐PurchasedServices PickeringtonLocalSchoolDistrictNote3
NameofExpensestobePresentedProf.&Transprt.Services,andCollegeCreditPlus
Description 2017 2018 2019 2020 2021 2022 2023
480‐489Transportation 4,946,346 5,008,466 5,108,635 5,210,808 5,367,132 5,528,146 5,693,990%Changefromprioryear 3.7% 1.3% 2.0% 2.0% 3.0% 3.0% 3.0%
418Legal/Prof.Services 395,534 404,651 414,767 423,062 431,524 440,154 448,957%Changefromprioryear ‐8.7% 2.3% 2.5% 2.0% 2.0% 2.0% 2.0%
410‐417,419Prof.Services 1,838,039 2,124,419 2,174,755 2,016,295 2,056,621 2,097,754 2,097,754%Changefromprioryear 0.9% 15.6% 2.4% ‐7.3% 2.0% 2.0% 0.0%
460‐461Print,490AllOther 215,235 220,599 175,055 178,556 182,127 185,770 189,485%Changefromprioryear 30.5% 2.5% ‐20.6% 2.0% 2.0% 2.0% 2.0%
479CollegeCreditPlus 267,800 257,601 267,519 267,000 268,335 269,677 271,025%Changefromprioryear 352.1% ‐3.8% 3.8% ‐0.2% 0.5% 0.5% 0.5%
479OtherNon‐SpecEdTuition(JDC,SF‐PerDiem,Etc.) 57,215 61,000 61,305 61,612 61,920 62,229%Changefromprioryear 0.0% 0.0% 6.6% 0.5% 0.5% 0.5% 0.5%
TotalPurchasedServices 18,273,744 19,231,176 19,767,460 19,877,775 20,255,359 20,641,431 20,988,956TotalProf.&Transprt.Services,andCollegeCreditPlus 7,662,954 8,072,951 8,201,731 8,157,026 8,367,350 8,583,419 8,763,440TotalforDetailedNote3 409,997 128,779 ‐44,704 210,324 216,069 180,021
Exhibit 10D—Detailed Look at Professional & Transportation Expenses, & College Credit Plus

45
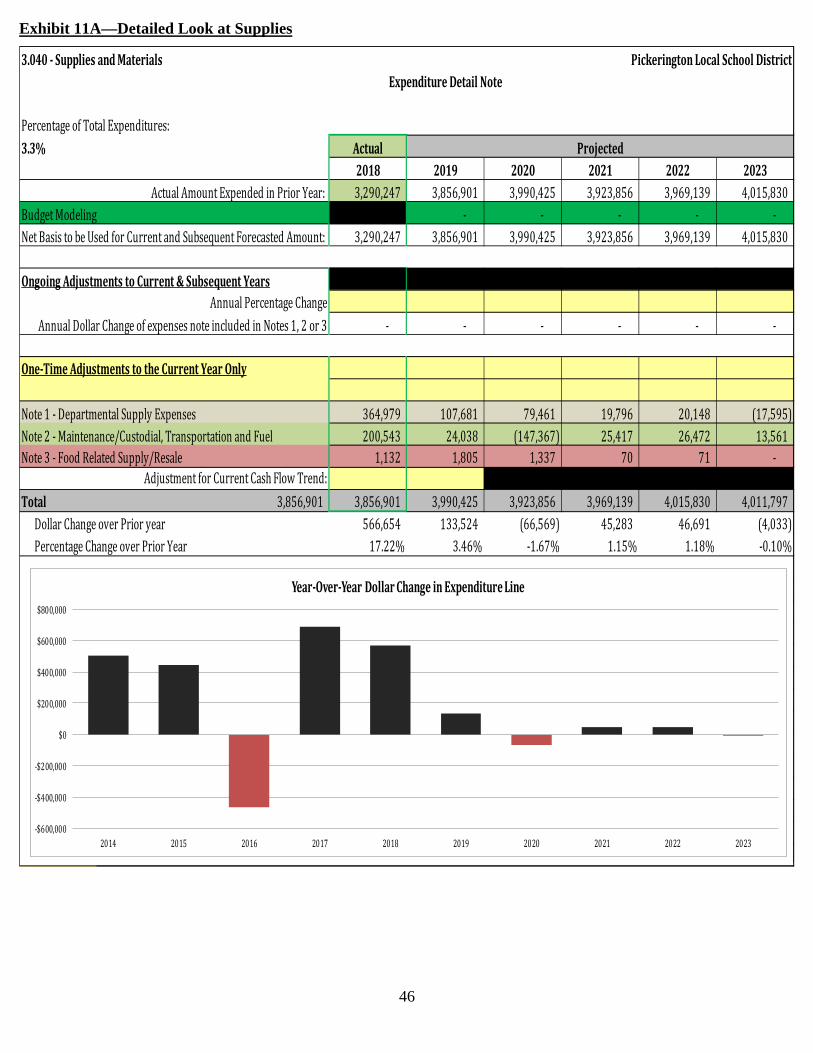
Line 3.040--Supplies and Materials. This line, which only comprises about 3.3% of general fund expenses, again contains a wide variety of expenses. Some major categories include:
Fuel for vehicles and buses, and maintenance and custodial supplies/repair parts (historically approximately 30% to 35% of supply purchases)—fluctuations in fuel prices may significantly impact the expenditures in this category.
Instructional materials, general supplies, textbooks (including CCP texts), and electronic subscriptions (about 65%-70% of supply purchases) A more detailed look at Supply costs follows in Exhibits 11A—11C:
Rest of Page Left Intentionally Blank
46
3.040‐SuppliesandMaterials PickeringtonLocalSchoolDistrictExpenditureDetailNote
PercentageofTotalExpenditures:3.3% Actual Projected
2018 2019 2020 2021 2022 2023ActualAmountExpendedinPriorYear: 3,290,247 3,856,901 3,990,425 3,923,856 3,969,139 4,015,830
BudgetModeling ‐ ‐ ‐ ‐ ‐NetBasistobeUsedforCurrentandSubsequentForecastedAmount: 3,290,247 3,856,901 3,990,425 3,923,856 3,969,139 4,015,830
OngoingAdjustmentstoCurrent&SubsequentYearsAnnualPercentageChange
AnnualDollarChangeofexpensesnoteincludedinNotes1,2or3 ‐ ‐ ‐ ‐ ‐ ‐
One‐TimeAdjustmentstotheCurrentYearOnly
Note1‐DepartmentalSupplyExpenses 364,979 107,681 79,461 19,796 20,148 (17,595)Note2‐Maintenance/Custodial,TransportationandFuel 200,543 24,038 (147,367) 25,417 26,472 13,561Note3‐FoodRelatedSupply/Resale 1,132 1,805 1,337 70 71 ‐
AdjustmentforCurrentCashFlowTrend:Total 3,856,901 3,856,901 3,990,425 3,923,856 3,969,139 4,015,830 4,011,797
DollarChangeoverPrioryear 566,654 133,524 (66,569) 45,283 46,691 (4,033)PercentageChangeoverPriorYear 17.22% 3.46% ‐1.67% 1.15% 1.18% ‐0.10%
2013 2,120,6952014 2,624,843 504,148 23.77%2015 3,067,313 442,470 16.86%2016 2,601,630 (465,683) ‐15.18%2017 3,290,247 688,617 26.47%2018 3,856,901 566,654 17.22%2019 3,990,425 133,524 3.46%2020 3,923,856 (66,569) ‐1.67%2021 3,969,139 45,283 1.15%2022 4,015,830 46,691 1.18%2023 4,011,797 (4,033) ‐0.10%
‐$600,000
‐$400,000
‐$200,000
$0
$200,000
$400,000
$600,000
$800,000
2014 2015 2016 2017 2018 2019 2020 2021 2022 2023
Year‐Over‐YearDollarChangeinExpenditureLine
Exhibit 11A—Detailed Look at Supplies

47
3.040‐SuppliesandMaterials PickeringtonLocalSchoolDistrictNote1
NameofExpensestobePresentedDepartmentalSupplyExpenses
Description 2017 2018 2019 2020 2021 2022 2023
510‐519‐GeneralSupplies 1,360,585 1,609,335 1,572,306 1,625,429 1,625,429 1,625,429 1,588,029%Changefromprioryear 13.9% 18.3% ‐2.3% 3.4% 0.0% 0.0% ‐2.3%
520‐529Textbooks 258,966 341,662 370,047 373,747 377,485 381,260 385,072%Changefromprioryear 70.6% 31.9% 8.3% 1.0% 1.0% 1.0% 1.0%
530‐539LibraryBooks 50,928 19,114 24,666 33,448 33,782 34,120 34,120%Changefromprioryear 58.4% ‐62.5% 29.0% 35.6% 1.0% 1.0% 0.0%
540‐549Newspapers/Periodica 1,673 1,411 3,163 1,600 1,600 1,600 1,600%Changefromprioryear ‐27.6% ‐15.7% 124.2% ‐49.4% 0.0% 0.0% 0.0%
590Miscellaneous 41,434 17,182 35,000 35,349 35,703 36,060 36,060%Changefromprioryear 22.0% ‐58.5% 103.7% 1.0% 1.0% 1.0% 0.0%
546ElectronicSubscriptions 572,417 662,279 753,481 768,551 783,922 799,600 815,592%Changefromprioryear 102.3% 15.7% 13.8% 2.0% 2.0% 2.0% 2.0%
TotalSupplies&Materials 3,290,247 3,856,901 3,990,425 3,923,856 3,969,139 4,015,830 4,011,797TotalDepartmentalSupplyExp 2,286,003 2,650,982 2,758,663 2,838,124 2,857,920 2,878,068 2,860,473TotalforDetailedNote1 364,979 107,681 79,461 19,796 20,148 ‐17,595
TotalDepartmentalSupplyExpenses 100% 100% 100% 100% 100% 100%DepartmentalSupplyExpensesasa%ofTotalSu 69% 69% 72% 72% 72% 71%AnnualChangeinDepartmentalSupplyExpenses
69% 69% 72% 72% 72% 71%
0%
20%
40%
60%
80%
100%
120%
2018 2019 2020 2021 2022 2023
Departmental SupplyExpenses as a% ofTotalSupplies andMaterials
TotalSupplies&Materials TotalDepartmentalSupplyExpenses
‐50,000
0
50,000
100,000
150,000
200,000
250,000
300,000
350,000
400,000
2018 2019 2020 2021 2022 2023
Annual Change inDepartmental SupplyExpenses
DepartmentalSupplyExpenses
0
500,000
1,000,000
1,500,000
2,000,000
2,500,000
3,000,000
3,500,000
2017 2018 2019 2020 2021 2022 2023
Departmental SupplyExpenses
510‐519‐GeneralSupplies 520‐529Textbooks 530‐539LibraryBooks 540‐549Newspapers/Periodicals,NOT546 590Miscellaneous 546ElectronicSubscriptions
Exhibit 11B—Detailed Look at Departmental Supply Expense
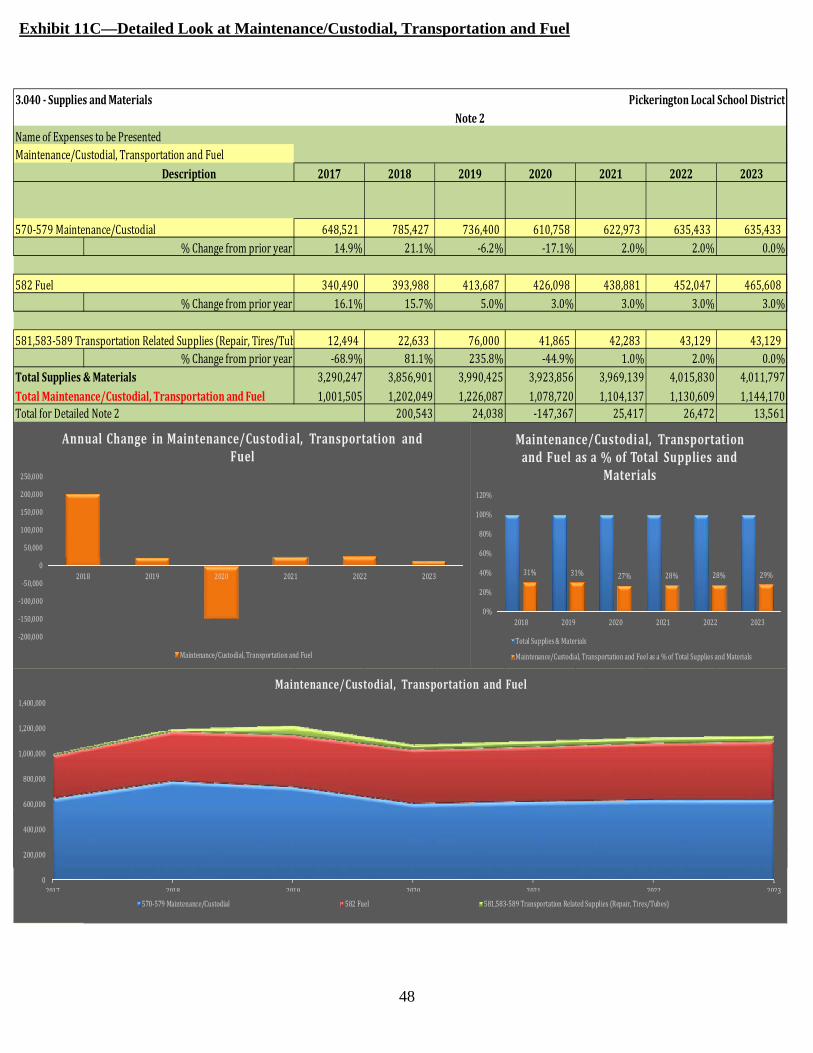
48
3.040‐SuppliesandMaterials PickeringtonLocalSchoolDistrictNote2
NameofExpensestobePresentedMaintenance/Custodial,TransportationandFuel
Description 2017 2018 2019 2020 2021 2022 2023
570‐579Maintenance/Custodial 648,521 785,427 736,400 610,758 622,973 635,433 635,433%Changefromprioryear 14.9% 21.1% ‐6.2% ‐17.1% 2.0% 2.0% 0.0%
582Fuel 340,490 393,988 413,687 426,098 438,881 452,047 465,608%Changefromprioryear 16.1% 15.7% 5.0% 3.0% 3.0% 3.0% 3.0%
581,583‐589TransportationRelatedSupplies(Repair,Tires/Tub 12,494 22,633 76,000 41,865 42,283 43,129 43,129%Changefromprioryear ‐68.9% 81.1% 235.8% ‐44.9% 1.0% 2.0% 0.0%
TotalSupplies&Materials 3,290,247 3,856,901 3,990,425 3,923,856 3,969,139 4,015,830 4,011,797TotalMaintenance/Custodial,TransportationandFuel 1,001,505 1,202,049 1,226,087 1,078,720 1,104,137 1,130,609 1,144,170TotalforDetailedNote2 200,543 24,038 ‐147,367 25,417 26,472 13,561
TotalSupplies&Materials 100% 100% 100% 100% 100% 100%Maintenance/Custodial,TransportationandFuelasa%ofTotalSuppliesandMate 31% 31% 27% 28% 28% 29%AnnualChangeinMaintenance/Custodial,TransportationandFuel
‐200,000
‐150,000
‐100,000
‐50,000
0
50,000
100,000
150,000
200,000
250,000
2018 2019 2020 2021 2022 2023
AnnualChange inMaintenance/Custodial, Transportation andFuel
Maintenance/Custodial,TransportationandFuel
31% 31% 27% 28% 28% 29%
0%
20%
40%
60%
80%
100%
120%
2018 2019 2020 2021 2022 2023
Maintenance/Custodial, Transportation and Fuel asa%ofTotal Supplies and
Materials
TotalSupplies&Materials
Maintenance/Custodial,TransportationandFuelasa%ofTotalSuppliesandMaterials
0
200,000
400,000
600,000
800,000
1,000,000
1,200,000
1,400,000
2017 2018 2019 2020 2021 2022 2023
Maintenance/Custodial, Transportation andFuel
570‐579Maintenance/Custodial 582Fuel 581,583‐589TransportationRelatedSupplies(Repair,Tires/Tubes)
Exhibit 11C—Detailed Look at Maintenance/Custodial, Transportation and Fuel
49
LINE 3.050--Capital Outlay. Though only accounting for about .80% of general fund expenses, expenditures for capital outlay in future years includes significant additions for the purchase of technological equipment. This is designed to allow the District to stay up to speed with state testing other required programmatic changes (Ohio Academic Content Standards, STEM, Project Lead the Way, etc.) which require more robust technology infrastructure. Finally, because of the savings appreciated via our transportation contracts by purchasing our own buses, the District is also budgeting to purchase 2—3 additional buses and 3—4 additional school vehicles per year through 2023. Exhibits 12A—12B show a more detailed look at Capital Outlay expenses:
Rest of Page Left Intentionally Blank
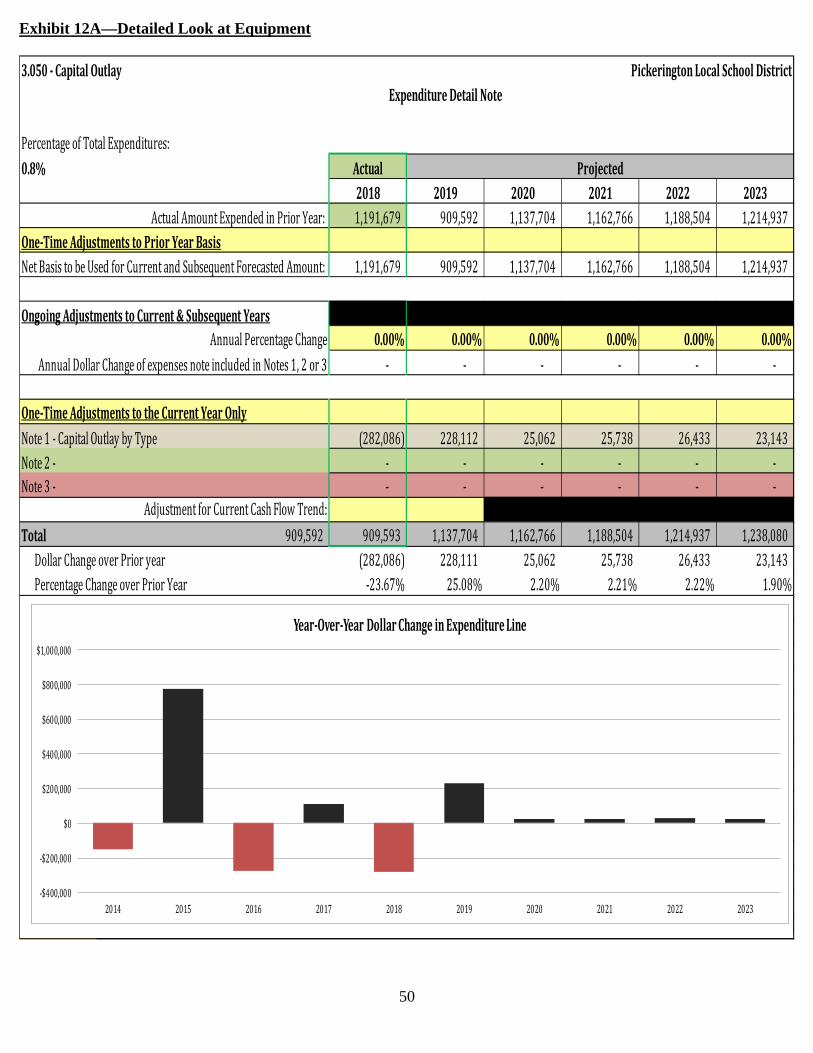
50
3.050‐CapitalOutlay PickeringtonLocalSchoolDistrictExpenditureDetailNote
PercentageofTotalExpenditures:0.8% Actual Projected
2018 2019 2020 2021 2022 2023ActualAmountExpendedinPriorYear: 1,191,679 909,592 1,137,704 1,162,766 1,188,504 1,214,937
One‐TimeAdjustmentstoPriorYearBasisNetBasistobeUsedforCurrentandSubsequentForecastedAmount: 1,191,679 909,592 1,137,704 1,162,766 1,188,504 1,214,937
OngoingAdjustmentstoCurrent&SubsequentYearsAnnualPercentageChange 0.00% 0.00% 0.00% 0.00% 0.00% 0.00%
AnnualDollarChangeofexpensesnoteincludedinNotes1,2or3 ‐ ‐ ‐ ‐ ‐ ‐
One‐TimeAdjustmentstotheCurrentYearOnlyNote1‐CapitalOutlaybyType (282,086) 228,112 25,062 25,738 26,433 23,143Note2‐ ‐ ‐ ‐ ‐ ‐ ‐Note3‐ ‐ ‐ ‐ ‐ ‐ ‐
AdjustmentforCurrentCashFlowTrend:Total 909,592 909,593 1,137,704 1,162,766 1,188,504 1,214,937 1,238,080
DollarChangeoverPrioryear (282,086) 228,111 25,062 25,738 26,433 23,143PercentageChangeoverPriorYear ‐23.67% 25.08% 2.20% 2.21% 2.22% 1.90%
2013 734,6452014 581,149 (153,496) ‐20.89%2015 1,353,797 772,648 132.95%2016 1,079,347 (274,450) ‐20.27%2017 1,191,679 112,332 10.41%2018 909,592 (282,087) ‐23.67%2019 1,137,704 228,112 25.08%2020 1,162,766 25,062 2.20%2021 1,188,504 25,738 2.21%2022 1,214,937 26,433 2.22%2023 1,238,080 23,143 1.90%
‐$400,000
‐$200,000
$0
$200,000
$400,000
$600,000
$800,000
$1,000,000
2014 2015 2016 2017 2018 2019 2020 2021 2022 2023
Year‐Over‐YearDollarChangeinExpenditureLine
Exhibit 12A—Detailed Look at Equipment
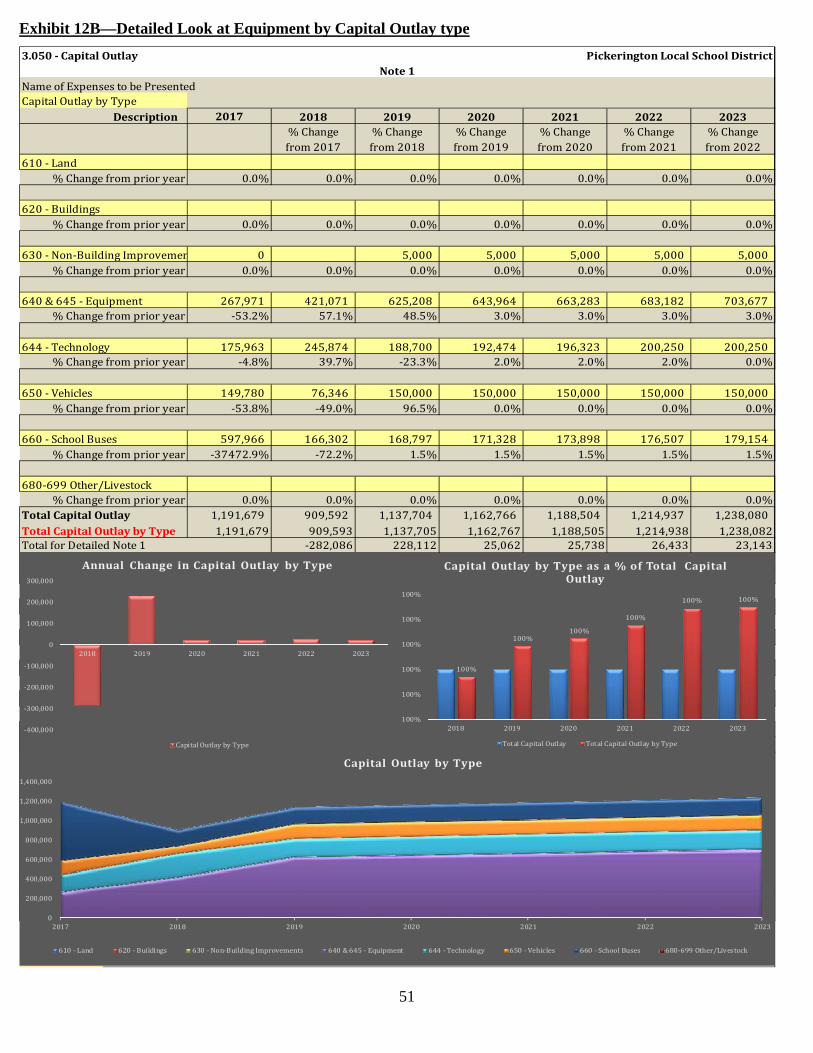
51
3.050‐CapitalOutlay PickeringtonLocalSchoolDistrictNote1
NameofExpensestobePresentedCapitalOutlaybyType
Description 2017 2018 2019 2020 2021 2022 2023%Change %Change %Change %Change %Change %Changefrom2017 from2018 from2019 from2020 from2021 from2022
610‐Land%Changefromprioryear 0.0% 0.0% 0.0% 0.0% 0.0% 0.0% 0.0%
620‐Buildings%Changefromprioryear 0.0% 0.0% 0.0% 0.0% 0.0% 0.0% 0.0%
630‐Non‐BuildingImprovemen 0 5,000 5,000 5,000 5,000 5,000%Changefromprioryear 0.0% 0.0% 0.0% 0.0% 0.0% 0.0% 0.0%
640&645‐Equipment 267,971 421,071 625,208 643,964 663,283 683,182 703,677%Changefromprioryear ‐53.2% 57.1% 48.5% 3.0% 3.0% 3.0% 3.0%
644‐Technology 175,963 245,874 188,700 192,474 196,323 200,250 200,250%Changefromprioryear ‐4.8% 39.7% ‐23.3% 2.0% 2.0% 2.0% 0.0%
650‐Vehicles 149,780 76,346 150,000 150,000 150,000 150,000 150,000%Changefromprioryear ‐53.8% ‐49.0% 96.5% 0.0% 0.0% 0.0% 0.0%
660‐SchoolBuses 597,966 166,302 168,797 171,328 173,898 176,507 179,154%Changefromprioryear ‐37472.9% ‐72.2% 1.5% 1.5% 1.5% 1.5% 1.5%
680‐699Other/Livestock%Changefromprioryear 0.0% 0.0% 0.0% 0.0% 0.0% 0.0% 0.0%
TotalCapitalOutlay 1,191,679 909,592 1,137,704 1,162,766 1,188,504 1,214,937 1,238,080TotalCapitalOutlaybyType 1,191,679 909,593 1,137,705 1,162,767 1,188,505 1,214,938 1,238,082TotalforDetailedNote1 ‐282,086 228,112 25,062 25,738 26,433 23,143
TotalCapitalOutlaybyType 100% 100% 100% 100% 100% 100%CapitalOutlaybyTypeasa%ofTotalCapitalOut 100% 100% 100% 100% 100% 100%AnnualChangeinCapitalOutlaybyType
100%
100%100%
100%
100% 100%
100%
100%
100%
100%
100%
100%
2018 2019 2020 2021 2022 2023
Capital OutlaybyTypeas a% ofTotal Capital Outlay
TotalCapitalOutlay TotalCapitalOutlaybyType
‐400,000
‐300,000
‐200,000
‐100,000
0
100,000
200,000
300,000
2018 2019 2020 2021 2022 2023
Annual Change inCapital Outlay byType
CapitalOutlaybyType
0
200,000
400,000
600,000
800,000
1,000,000
1,200,000
1,400,000
2017 2018 2019 2020 2021 2022 2023
Capital OutlaybyType
610‐Land 620‐Buildings 630‐Non‐BuildingImprovements 640&645‐Equipment 644‐Technology 650‐Vehicles 660‐SchoolBuses 680‐699Other/Livestock
Exhibit 12B—Detailed Look at Equipment by Capital Outlay type

52
LINE 4.300--Other Objects. Accounting for about 1.3% of general fund expenses, this line contains miscellaneous expenditure categories, and is primarily based on historical trends. The major expenditures in this line include county auditor and treasurer fees, and State Foundation deductions for the Fairfield County Educational Service Center. A more detailed look at Other Object Expenditures follows in Exhibits 13A—13B:
Rest of Page Left Intentionally Blank
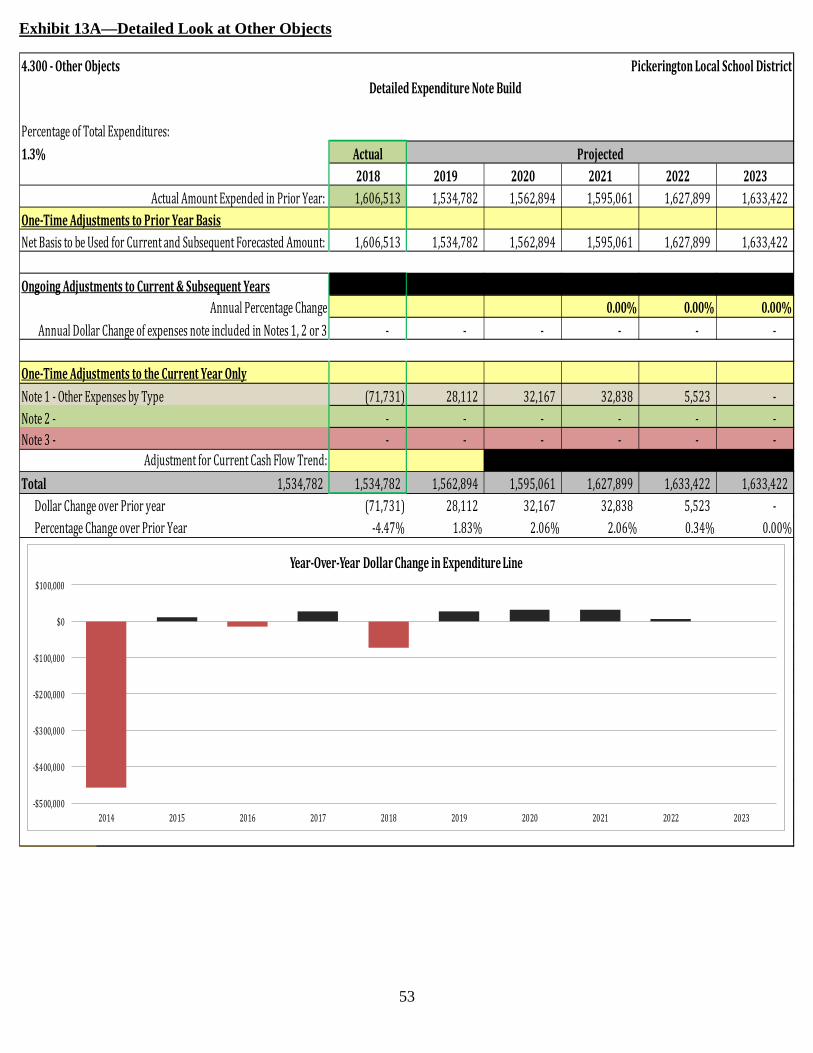
53
4.300‐OtherObjects PickeringtonLocalSchoolDistrictDetailedExpenditureNoteBuild
PercentageofTotalExpenditures:1.3% Actual Projected
2018 2019 2020 2021 2022 2023ActualAmountExpendedinPriorYear: 1,606,513 1,534,782 1,562,894 1,595,061 1,627,899 1,633,422
One‐TimeAdjustmentstoPriorYearBasisNetBasistobeUsedforCurrentandSubsequentForecastedAmount: 1,606,513 1,534,782 1,562,894 1,595,061 1,627,899 1,633,422
OngoingAdjustmentstoCurrent&SubsequentYearsAnnualPercentageChange 0.00% 0.00% 0.00%
AnnualDollarChangeofexpensesnoteincludedinNotes1,2or3 ‐ ‐ ‐ ‐ ‐ ‐
One‐TimeAdjustmentstotheCurrentYearOnlyNote1‐OtherExpensesbyType (71,731) 28,112 32,167 32,838 5,523 ‐Note2‐ ‐ ‐ ‐ ‐ ‐ ‐Note3‐ ‐ ‐ ‐ ‐ ‐ ‐
AdjustmentforCurrentCashFlowTrend:Total 1,534,782 1,534,782 1,562,894 1,595,061 1,627,899 1,633,422 1,633,422
DollarChangeoverPrioryear (71,731) 28,112 32,167 32,838 5,523 ‐PercentageChangeoverPriorYear ‐4.47% 1.83% 2.06% 2.06% 0.34% 0.00%
2013 2,041,4652014 1,583,126 (458,339) ‐22.45%2015 1,594,254 11,128 0.70%2016 1,580,003 (14,251) ‐0.89%2017 1,606,513 26,510 1.68%2018 1,534,782 (71,731) ‐4.47%2019 1,562,894 28,112 1.83%2020 1,595,061 32,167 2.06%2021 1,627,899 32,838 2.06%2022 1,633,422 5,523 0.34%2023 1,633,422 ‐ 0.00%
‐$500,000
‐$400,000
‐$300,000
‐$200,000
‐$100,000
$0
$100,000
2014 2015 2016 2017 2018 2019 2020 2021 2022 2023
Year‐Over‐YearDollarChangeinExpenditureLine
Exhibit 13A—Detailed Look at Other Objects
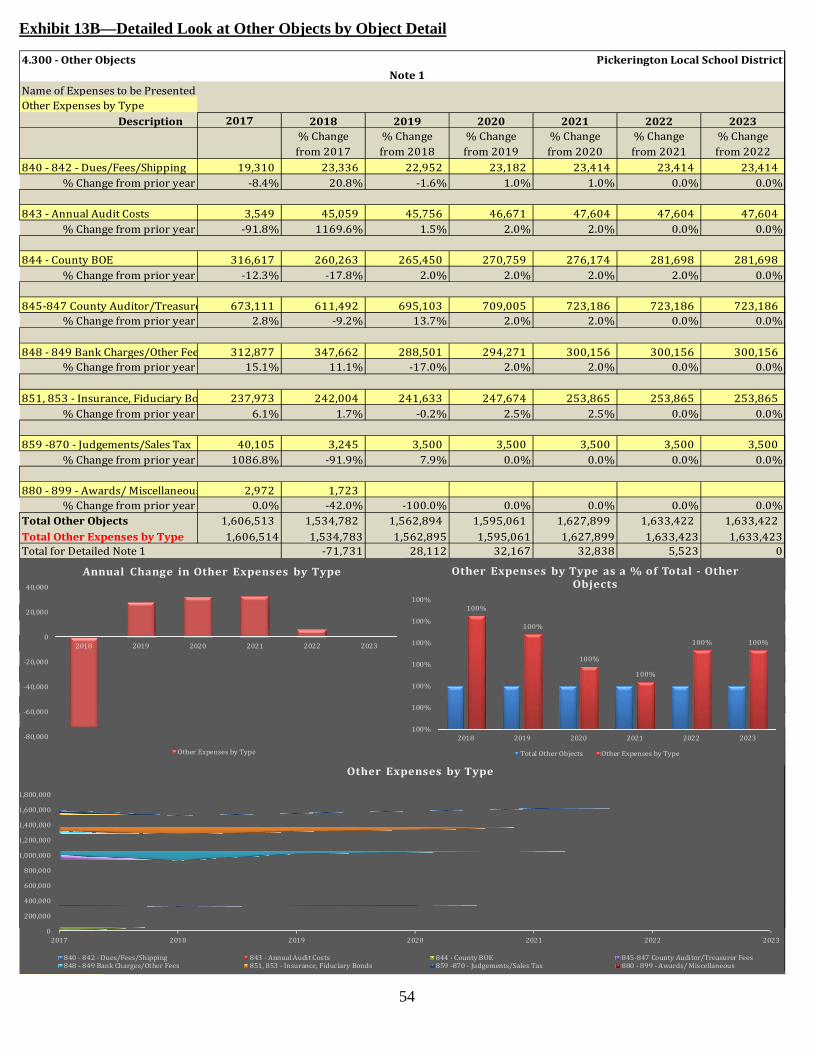
54
4.300‐OtherObjects PickeringtonLocalSchoolDistrictNote1
NameofExpensestobePresentedOtherExpensesbyType
Description 2017 2018 2019 2020 2021 2022 2023%Change %Change %Change %Change %Change %Changefrom2017 from2018 from2019 from2020 from2021 from2022
840‐842‐Dues/Fees/Shipping 19,310 23,336 22,952 23,182 23,414 23,414 23,414%Changefromprioryear ‐8.4% 20.8% ‐1.6% 1.0% 1.0% 0.0% 0.0%
843‐AnnualAuditCosts 3,549 45,059 45,756 46,671 47,604 47,604 47,604%Changefromprioryear ‐91.8% 1169.6% 1.5% 2.0% 2.0% 0.0% 0.0%
844‐CountyBOE 316,617 260,263 265,450 270,759 276,174 281,698 281,698%Changefromprioryear ‐12.3% ‐17.8% 2.0% 2.0% 2.0% 2.0% 0.0%
845‐847CountyAuditor/Treasure 673,111 611,492 695,103 709,005 723,186 723,186 723,186%Changefromprioryear 2.8% ‐9.2% 13.7% 2.0% 2.0% 0.0% 0.0%
848‐849BankCharges/OtherFee 312,877 347,662 288,501 294,271 300,156 300,156 300,156%Changefromprioryear 15.1% 11.1% ‐17.0% 2.0% 2.0% 0.0% 0.0%
851,853‐Insurance,FiduciaryBo 237,973 242,004 241,633 247,674 253,865 253,865 253,865%Changefromprioryear 6.1% 1.7% ‐0.2% 2.5% 2.5% 0.0% 0.0%
859‐870‐Judgements/SalesTax 40,105 3,245 3,500 3,500 3,500 3,500 3,500%Changefromprioryear 1086.8% ‐91.9% 7.9% 0.0% 0.0% 0.0% 0.0%
880‐899‐Awards/Miscellaneous 2,972 1,723%Changefromprioryear 0.0% ‐42.0% ‐100.0% 0.0% 0.0% 0.0% 0.0%
TotalOtherObjects 1,606,513 1,534,782 1,562,894 1,595,061 1,627,899 1,633,422 1,633,422TotalOtherExpensesbyType 1,606,514 1,534,783 1,562,895 1,595,061 1,627,899 1,633,423 1,633,423TotalforDetailedNote1 ‐71,731 28,112 32,167 32,838 5,523 0
TotalOtherExpensesbyType 100% 100% 100% 100% 100% 100%OtherExpensesbyTypeasa%ofTotal‐OtherObje 100% 100% 100% 100% 100% 100%AnnualChangeinOtherExpensesbyType
100%
100%
100%
100%
100% 100%
100%
100%
100%
100%
100%
100%
100%
2018 2019 2020 2021 2022 2023
OtherExpensesbyTypeas a% ofTotal ‐ OtherObjects
TotalOtherObjects OtherExpensesbyType
‐80,000
‐60,000
‐40,000
‐20,000
0
20,000
40,000
2018 2019 2020 2021 2022 2023
Annual Change inOtherExpenses byType
OtherExpensesbyType
0
200,000
400,000
600,000
800,000
1,000,000
1,200,000
1,400,000
1,600,000
1,800,000
2017 2018 2019 2020 2021 2022 2023
OtherExpensesbyType
840‐842‐Dues/Fees/Shipping 843‐AnnualAuditCosts 844‐CountyBOE 845‐847CountyAuditor/TreasurerFees848‐849BankCharges/OtherFees 851,853‐Insurance,FiduciaryBonds 859‐870‐Judgements/SalesTax 880‐899‐Awards/Miscellaneous
Exhibit 13B—Detailed Look at Other Objects by Object Detail

55
5.010to5.030‐OtherFinancingUses PickeringtonLocalSchoolDistrictExpenditureDetailNote
PercentageofTotalExpenditures:1.3% Actual Projected
2018 2019 2020 2021 2022 20235.010‐OperatingTransfers‐Out ProjectionsarenotBasedUponPreviousFiscalYear
TransfertoFund035toCoverTerminationBenefits 500,000 250,000 125,000TransfertoCapitalImprovementFund 1,000,000 750,000 1,000,000 500,000 500,000 500,000
Transferfrom022to001to300TransfertoSelf‐InsuranceFund
OutdoorEdfundtofund(009to001to018)LakeviewTrusttoLakeview018
PHSCKeyClub,ClubHope,RenaissanceWISETransfer 40,000 20,000 20,000 20,000 20,000 20,000
Note1 ‐ ‐ ‐ ‐ ‐ ‐Total[5.010] 1,540,000 1,540,000 770,000 1,270,000 520,000 645,000 520,000Total[5.010to5.030] 1,540,000 770,000 1,270,000 520,000 645,000 520,000
DollarChangeoverPrioryear 1,540,000 (770,000) 500,000 (750,000) 125,000 (125,000)PercentageChangeoverPriorYear 0.00% ‐50.00% 64.94% ‐59.06% 24.04% ‐19.38%
2013 3,211,5212014 2,502,365 (709,156) ‐22.08%2015 3,500,000 997,635 39.87%2016 762,019 (2,737,981) ‐78.23%2017 753,116 (8,903) ‐1.17%2018 1,540,000 786,884 104.48%2019 770,000 (770,000) ‐50.00%2020 1,270,000 500,000 64.94%2021 520,000 (750,000) ‐59.06%2022 645,000 125,000 24.04%2023 520,000 (125,000) ‐19.38%
‐$3,000,000
‐$2,500,000
‐$2,000,000
‐$1,500,000
‐$1,000,000
‐$500,000
$0
$500,000
$1,000,000
$1,500,000
2014 2015 2016 2017 2018 2019 2020 2021 2022 2023
Year‐Over‐YearDollarChangeinExpenditureLine
LINE 5.010-5.030—Operating Transfers Out, Advances Out and All Other Financing Uses For FY19-FY23, there are forecasted transfers to the Capital Improvement Fund. Those transfers are noted below, and total $3.25MM. Additionally, the District anticipates transfers of $250,000 to the 035 Termination Benefits (Severance) fund in FY20, and an additional $125,000 transfer in FY22. Exhibit 14—Detailed Look at Other Financing Uses
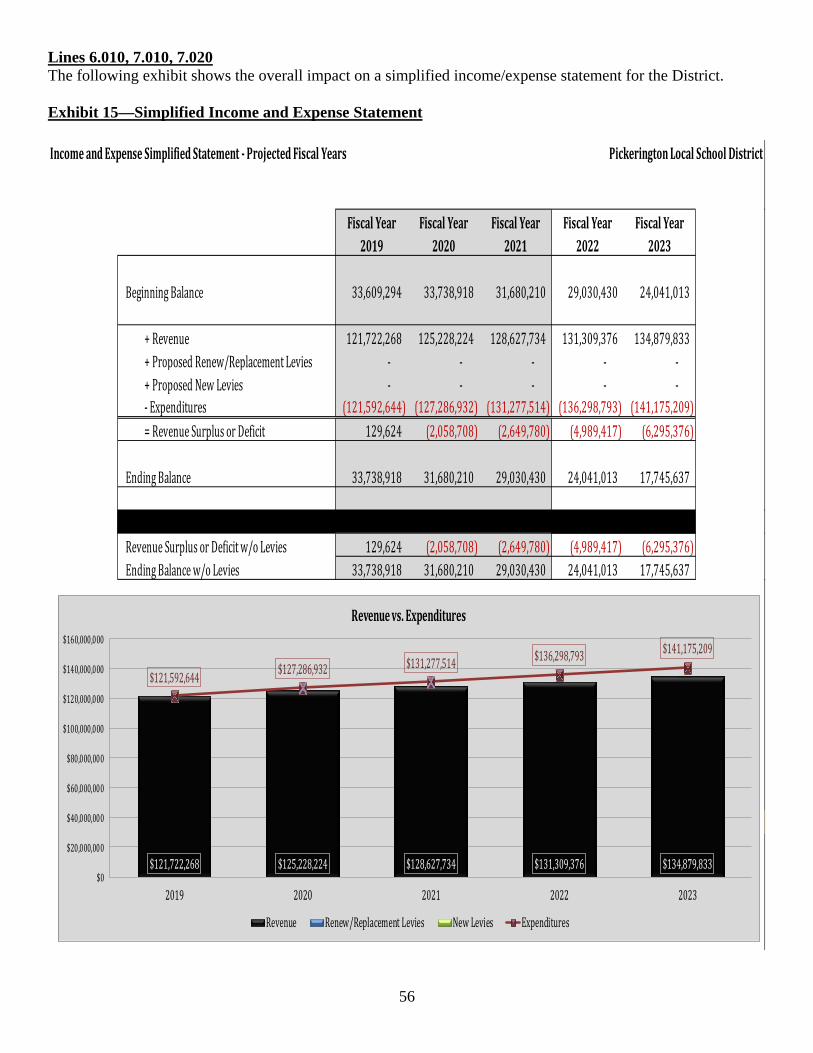
56
IncomeandExpenseSimplifiedStatement‐ProjectedFiscalYears PickeringtonLocalSchoolDistrict
FiscalYear FiscalYear FiscalYear FiscalYear FiscalYear2019 2020 2021 2022 2023
BeginningBalance 33,609,294 33,738,918 31,680,210 29,030,430 24,041,013
+Revenue 121,722,268 125,228,224 128,627,734 131,309,376 134,879,833+ProposedRenew/ReplacementLevies ‐ ‐ ‐ ‐ ‐+ProposedNewLevies ‐ ‐ ‐ ‐ ‐‐Expenditures (121,592,644) (127,286,932) (131,277,514) (136,298,793) (141,175,209)=RevenueSurplusorDeficit 129,624 (2,058,708) (2,649,780) (4,989,417) (6,295,376)
EndingBalance 33,738,918 31,680,210 29,030,430 24,041,013 17,745,637
RevenueSurplusorDeficitw/oLevies 129,624 (2,058,708) (2,649,780) (4,989,417) (6,295,376)EndingBalancew/oLevies 33,738,918 31,680,210 29,030,430 24,041,013 17,745,637
2019 2020 2021 2022 2023Revenue 121722268 125228224 128627734 131309376 134879833Renew/ReplacementLevies 0 0 0 0 0NewLevies 0 0 0 0 0Expenditures 121592644 127286932 131277514 136298793 141175209
$121,722,268 $125,228,224 $128,627,734 $131,309,376 $134,879,833
$121,592,644 $127,286,932 $131,277,514 $136,298,793 $141,175,209
$0
$20,000,000
$40,000,000
$60,000,000
$80,000,000
$100,000,000
$120,000,000
$140,000,000
$160,000,000
2019 2020 2021 2022 2023
Revenuevs.Expenditures
Revenue Renew/ReplacementLevies NewLevies Expenditures
Lines 6.010, 7.010, 7.020 The following exhibit shows the overall impact on a simplified income/expense statement for the District. Exhibit 15—Simplified Income and Expense Statement

57
ForecastCompare‐VarianceGraphs PickeringtonLocalSchoolDistrictForFiscalYear: 2019
PreviousForecastDate: 10/23/2018 CurrentForecastDate: 5/23/2019
35,529,690
1,729,618
19,089,126
56,732,264
947,058
0
4,610,695
2,264,505
35,609,515
1,813,977
19,097,264
56,573,596
1,000,454
0
4,620,385
2,663,766
1.010‐GeneralPropertyTax(RealEstate)
1.020‐PublicUtilityPersonalProperty
1.030‐IncomeTax
1.035‐UnrestrictedGrants‐in‐Aid
1.040‐RestrictedGrants‐in‐Aid
1.045‐RestrictedFederalGrants‐in‐Aid‐SFSF
1.050‐PropertyTaxAllocation
1.060‐AllOtherOperatingRevenues
CurrentFiscalYearRevenueComparisonPreviousForecasttoCurrentForecast
10/23/2018 5/23/2019
69,376,218
26,212,772
19,815,127
3,990,425
1,137,704
0
0
1,562,894
69,376,218
24,987,943
19,767,460
3,990,425
1,137,704
0
0
1,562,894
3.010‐PersonnelServices
3.020‐Employees'Retirement/InsuranceBenefits
3.030‐PurchasedServices
3.040‐SuppliesandMaterials
3.050‐CapitalOutlay
3.060‐Intergovernmental
4.010‐4.060‐Principal,Interest&FiscalCharges
4.300‐OtherObjects
CurrentFiscalYearExpenditureComparisonPreviousForecastvs.CurrentForecast
10/23/2018 5/23/2019
Freeze5‐YearforComparison
Exhibit 16—Comparison of October 2018 Submission to May 2019 Submission: FY19

58
HeadCountSummary/Analysis PickeringtonLocalSchoolDistrict
2019 2020 2021 2022 2023
PriorYearActual/EstimatedEnrollment(OctoberCount) 10,304 10,451 10,583 10,740 10,822
ProjectedChangestoPriorYearEnrollmentNetAll‐GradeLevelMobilityFactor(Change)toPriorYear 324 340 346 351 353
NewKindergartnersIn 637 650 650 650 665LossofSeniorsfromPriorYear ‐814 ‐857 ‐839 ‐918 ‐854
NetChangeinOutgoingandIncomingPupils ‐177 ‐207 ‐189 ‐268 ‐189
CurrentYearEstimatedEnrollment(SimulatedOctoberCount) 10,451 10,583 10,740 10,822 10,986DistrictHeadCount Grade
K 637 650 650 650 6651 728 747 762 762 7622 748 766 785 801 8013 718 787 806 827 8444 792 747 819 839 8615 806 817 771 846 8666 862 828 839 791 8687 831 890 854 866 8178 864 849 908 872 8859 851 892 876 938 90110 920 856 897 881 94311 837 916 852 893 87812 857 839 918 854 895
TotalCanDifferbyRounding 10,451 10,583 10,740 10,822 10,986Year‐Over‐YearPercentageChange 0.28% 1.27% 1.48% 0.77% 1.52%
200710,019
2008 2009 2010 2011 2012 2013 2014 2015 201610,229 10,453 10,545 10,625 10,281 10,203 10,185 10,190 10,1502017 2018 2019P 2020P 2021P 2022P 2023P
10,191 10,304 10,451 10,583 10,740 10,822 10,986
HistoricChange ‐0.2% 0.0% ‐0.4% 0.4% 1.1%
ProjectedChange 1.42% 1.27% 1.48% 0.77% 1.52%
0
2,000
4,000
6,000
8,000
10,000
12,000
2007 2008 2009 2010 2011 2012 2013 2014 2015 2016 2017 2018 2019P 2020P 2021P 2022P 2023P
Historicvs.ProjectedEnrollment
Exhibit 17—Enrollment Projections