physics course work
TRANSCRIPT

Quality of MeasurementCalibrating a Digital Thermometer Circuit
Lawrence JonesPhysics Coursework 2 • Peter Symonds College • 9 February 2011
Lawrence Jones • Peter Symonds College 1
V
Quality of MeasurementDIAGRAMS
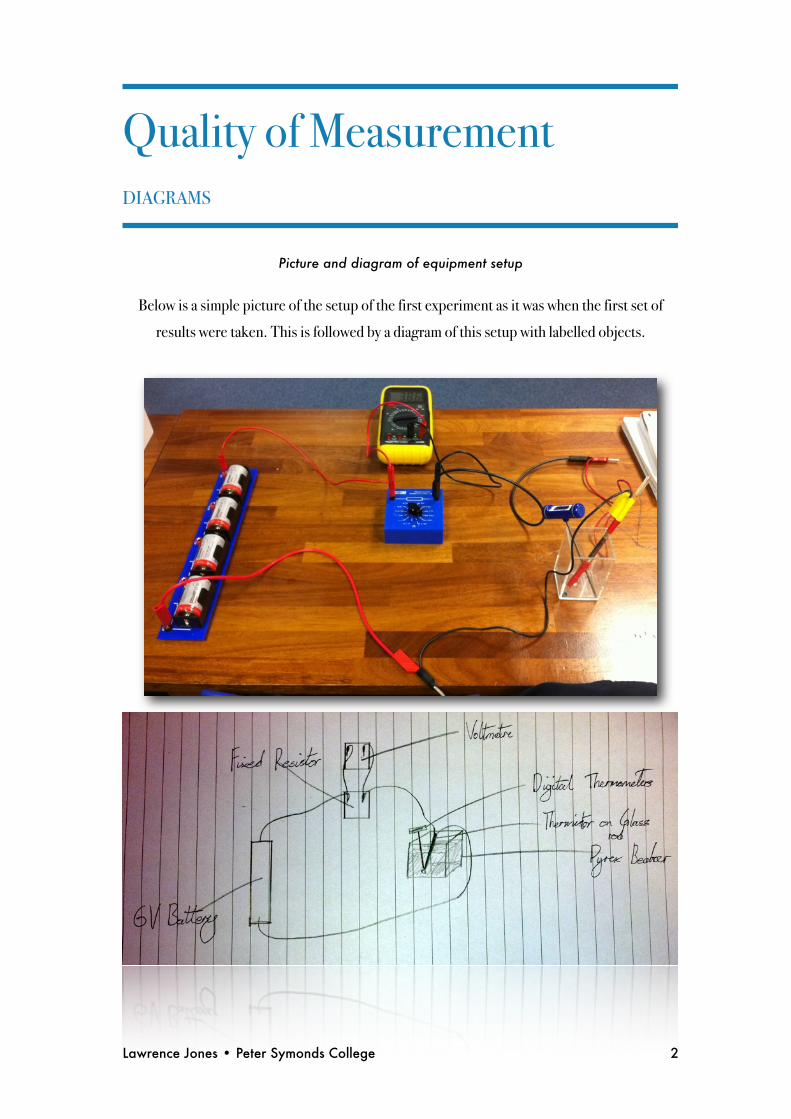
Picture and diagram of equipment setup
Below is a simple picture of the setup of the first experiment as it was when the first set of
results were taken. This is followed by a diagram of this setup with labelled objects.
Lawrence Jones • Peter Symonds College 2

Quality of MeasurementMETHOD
The method I will use on the first experiment
The first experiment I carry out will measure the voltage over the fixed resistor while
temperature changes occur over the thermistor. The voltage will be read from the fixed
resistor as opposed to the thermistor because I will be using an inverse thermistor. These
resistors experience an increase in resistance as temperature decreases, and measuring over
the fixed resistor would produce more coherent results- as temperature rises, voltage rises.
1. Measure resistance of the thermistor at the highest temperature that will be used in the
experiment and the lowest
2. Find the average of these two readings and set the fixed to resister to the nearest value
3. Link up a circuit so that from the 6V battery pack, the components in clockwise
direction go fixed resistor then thermistor then 0V terminal of battery. Hook up
voltmeter in parallel to the fixed resistor
4. Start the kettle boiling
5. Pour boiling water in a beaker along with a digital thermometer and place the
thermistor in the beaker
6. When the temperature of the water reaches 90 degrees, connect the circuit, record a
reading on the voltmeter into a table, and unplug the circuit
7. Wait for the beakers temperature to drop by 5 degrees
8. Repeat steps 6 & 7 until you get down to 20 degrees, at which point take a reading and
proceed to step 9
9. Repeat 6, 7 & 8 two more times
10. Plot readings into a graph
Quality of MeasurementSAFETY
The safety considerations of this experiment are mainly in using heated water and the kettle.
The main priority is to use gloves to prevent scalding of the hands whilst pouring water.
Another is to consider the proximity of the water to a plug point.
Gloves should be worn at all times throughout the experiment to prevent exposure to heated
elements.
Another consideration to make is short circuiting the battery. When a battery is short
circuited it not only destroys the accuracy of the measurements but the battery will heat up
rapidly, presenting a potential danger to anyone coming in contact with the pack. To avoid
this, I will just ensure that the battery is not short circuited and gloves are worn.

Quality of MeasurementPRELIM
The prelim experiment
Prior to each experiment, a preliminary is required to judge the optimum resistance for the
fixed resister. This is necessary as otherwise the sensitivity of the sensor circuit could be
severely impaired.
It is possible to complete the preliminary in two ways. You could take a reading of the voltages
at the maximum and minimum inputs, at every value possible of the fixed resistor. You would
choose the best value by the biggest range produced, as this would suggest that it would
produce a graph with the highest highs and the lowest lows. The steeper the gradient, the
more sensitive the graph would be.
However it is also possible to determine the optimum resistance mathematically using the
potential divider equation.
The greatest difference in Vout between the lower and higher resistance values will be
reached when the Z1 is going to be half the sum of the lowest and highest resistance of the
sensor.
At 90 degrees the thermistor is at 200Ohms
At 20 degrees the thermistor is at 1408Ohms
Therefore the optimum fixed resistor value will be 1608/2 = 804R and the closest fixed
resistor value for this will be 1K.
As there is only a slightly different reading for the second experiment, there is no need to
repeat the prelim.

Quality of MeasurementFIRST SET OF RESULTS
First set of results, with unregulated uncertainties
Temp (C) Voltage (V)Voltage (V)Voltage (V) Voltage Average (V)
Uncertainty (V)
20 3.33 3.30 3.24 3.290 0.04
25 3.57 3.59 3.49 3.550 0.05
30 3.76 3.70 3.73 3.730 0.03
35 4.04 4.02 3.98 4.013 0.03
40 4.26 4.29 4.17 4.240 0.06
45 4.38 4.38 4.39 4.383 0.005
50 4.59 4.64 4.69 4.640 0.05
55 4.83 4.92 4.87 4.873 0.045
60 5.01 5.04 4.97 5.007 0.035
65 5.13 5.14 5.18 5.150 0.025
70 5.28 5.32 5.27 5.290 0.025
75 5.40 5.44 5.44 5.427 0.02
80 5.47 5.40 5.43 5.433 0.035
85 5.50 5.52 5.49 5.503 0.015
90 5.61 5.59 5.58 5.593 0.015
Average uncertainty is 0.032’33’ recurring, or 0.04 to the next significant figure for the
voltage
There is constant uncertainty of the temperature of 0.1 degrees

Quality of Measurement1ST EVALUATION
Going over the experiment and choosing changes
Causes of uncertainty
After thinking over the experiment, I have determined a few causes of uncertainty.
The first, temperature fluctuations- within the beaker there are bound to be certain currents
of hotter water. As the thermometer cannot ever be in the same place as the thermistor, we
cannot ever know with one thermometer whether the thermistor is being hit by a localized
warm current. As such, the thermistor could be exposed to a different temperature than that I
will be taking the reading as. This would cause uncertainty in the results.
The second, the calibration of the thermometer. When I finished the experiment, I put three
more thermometers in the same beaker of water. All four thermometers read different
temperatures, with a range of 1.3degrees between them. This is obviously quite a serious issue
when it comes to taking an accurate reading of the temperature, and could cause serious
systematic error.
The third is the drainage of the battery. As I take each reading, some more of the batteries
power will be depleted. Eventually, the reduction in EMF will start to affect the readings
taken, causing uncertainties to appear.
What action to take
Out of the three above, the first two are the most important in my eyes. To combat this
problem, I will use four digital thermometers in the same beaker. The points of the sensor will
meet forming a square around the thermistor, and the voltage reading will be taken only when
the average of all four thermometers reaches the desired temperature.
This will reduce systematic error by taking the average of the readings into consideration. Any
big systematic errors should be relatively balanced out, resulting in more accurate readings. It
will also help reduce uncertainty as the temperature that the thermistor will be exposed to will
be much more accurately read- with four thermometers taking an average, this should account
for any localized differences in the water around the thermistor.

Quality of MeasurementMETHOD - AMENDED
The method I will use to account for uncertainties
This method explains how to carry out the experiment while reducing uncertainties (this
assumes prelim settings are already in place from previous experiment)
1. Link up a circuit so that from the 6V battery pack, the components in clockwise
direction go fixed resistor then thermistor then 0V terminal of battery. Hook up
voltmeter in parallel to the fixed resistor
2. Start the kettle boiling
3. Set up four digital thermometers in a beaker, all with the points of the sensors aimed at
the middle of the beaker. Use bluetack or similar adhesive to fix the thermometers in
place and then secure thermistor so that the bulb is directly in the centre of all the
thermometers
4. Pour the water from the kettle into the beaker
5. When the temperature of the water reaches 90 degrees, connect the circuit, record a
reading on the voltmeter into a table, and unplug the circuit
6. Wait for the beakers temperature to drop by 5 degrees
7. Repeat steps 6 & 7 until you get down to 20 degrees, at which point take a reading and
proceed to step 9
8. Repeat 6, 7 & 8 two more times
9. Plot readings into a graph

Quality of MeasurementSECOND SET OF RESULTS WITH 4 THERMOMETER AVERAGE
Second set of results, with regulated uncertainties
Temp (C) Voltage (V)Voltage (V)Voltage (V) Voltage Average (V)
Uncertainty (V)
20 3.29 3.27 3.24 3.267 0.02
25 3.49 3.50 3.47 3.487 0.015
30 3.72 3.72 3.69 3.710 0.015
35 3.92 3.94 3.89 3.917 0.025
40 4.16 4.17 4.17 4.167 0.005
45 4.37 4.38 4.40 4.383 0.015
50 4.65 4.63 4.62 4.633 0.015
55 4.87 4.87 4.87 4.870 0
60 4.96 4.97 4.96 4.963 0.005
65 5.16 5.16 5.17 5.163 0.005
70 5.27 5.26 5.26 5.263 0.005
75 5.38 5.37 5.37 5.373 0.005
80 5.47 5.47 5.46 5.467 0.005
85 5.57 5.58 5.56 5.570 0.01
90 5.62 5.63 5.64 5.630 0.01
Average uncertainty is 0.010’66’ recurring, or 0.02 rounded to the next significant figure
There is constant uncertainty of the temperature of 0.1 degrees
Quality of MeasurementFINAL EVALUATION
After completing both the experiments, it is clear that there is a limitation to the amount of
uncertainty I can reduce. There are flaws with the equipment used that prevent this, flaws
from me being the person to read them, and flaws in the entire setup as a whole.
One of these flaws is that a temperature of the water can never be fully gauged. A much more
reliable way of doing things would be to use a water bath in a sealed environment. As the
edges of the beaker will grow cooler faster (having been exposed to the air) this will mean
different parts of the water will be at different temperatures. A water bath kept at exactly the
same temperature for about 10 minutes will have settled, and the majority of temperature
eddies will have diminished. This would ensure a much greater chance that the thermistor
would be exposed to the correct temperature rather than just what was expected of the correct
temperature.
Another flaw is that the battery will grow weaker after a certain amount of use. If a system is
relying on the output of voltage to remain the same at a regular temperature, then the
readings are going to go very astray if the EMF of the battery drops significantly. A way of
avoiding this would be to use a constant power source, supplied from the mains but converted
to DC current and run through a capacitor. The capacitor would even out the fluctuations
from the power plant, and therefore the supply would be steady and without risk of running
out or decreasing in power. This would be the ideal situation, but obviously is much too in
depth for this experiment. Another idea is to put the resistance in the circuit ridiculously
high, and this reduces the amount of power required for the circuit to operate. However this is
only delaying the problem of the batteries EMF running down, not removing it entirely.
Another concern that was present with the second experiment is that it did not account for the
differences in the digital temperature readings totally. Whilst an average was much preferable
to a single reading, it still isn't a guarantee that the actual temperature is even within that
range. To fix this we would need to find a thermometer that registered a zero reading just as
water started freezing and a 100 degree reading just as water started boiling. The we would’ve
got a thermometer that would really work.