physics 4a chapter 2: kinematics in one...
TRANSCRIPT

Physics 4A Chapter 2: Kinematics in One Dimension

Conceptual Questions and Example Problems from Chapter 2 Conceptual Question 2.4 The figure to the right shows a position-versus-time graph for the motion of objects A and B as they move along the same axis. (a) At the instant t = 1 s, is the speed of A greater than, less than, or equal to the speed of B? Explain. (b) Do objects A and B ever have the same speed? If so, at what time or times? Explain. 2.4. (a) At 1 s,t = the slope of the line for object A is greater than that for object B. Therefore, object A’s speed is greater. (Both are positive slopes.) (b) No, the speeds are never the same. Each has a constant speed (constant slope) and A’s speed is always greater. Conceptual Question 2.6 The figure below shows the position-versus-time graph for a moving object. At which letter point or points: (a) Is the object moving the slowest? (b) Is the object moving the fastest? (c) Is the object at rest? (d) Is the object moving to the left? 2.6. (a) B. The object is still moving, but the magnitude of the slope of the position-versus-time curve is smaller than at D. (b) D. The slope is greatest at D. (c) At points A, C, and E the slope of the curve is zero, so the object is not moving. (d) At point B the slope is negative, so the object is moving to the left. Problem 2.1 Alan leaves Los Angeles at 8:00 AM to drive to San Francisco, 400 mi away. He travels at a steady 50 mph. Beth leaves Los Angeles at 9:00 AM and drives a steady 60 mph. (a) Who gets to San Francisco first? (b) How long does the first to arrive have to wait for the second? 2.1. Model: Cars will be treated by the particle model. Visualize:

Solve: Beth and Alan are moving at a constant speed, so we can calculate the time of arrival as follows:
1 0 1 01 0
1 0
x x x x xv t tt t t v
∆ − −= = ⇒ = +
∆ − Using the known values identified in the pictorial representation, we find:
Alan 1 Alan 0Alan 1 Alan 0
Beth 1 Beth 0Beth 1 Beth 0
400 mile8:00 AM 8:00 AM 8 hr 4:00 PM50 miles/hour400 mile9:00 AM 9:00 AM 6.67 hr 3:40 PM
60 miles/hour
x xt tv
x xt tv
−= + = + = + =
−= + = + = + =
(a) Beth arrives first. (b) Beth has to wait Alan 1 Beth 1 20 minutest t− = for Alan. Assess: Times of the order of 7 or 8 hours are reasonable in the present problem. Problem 2.4 The figure to the right is the position-versus-time graph of a jogger. What is the jogger’s velocity at t = 10 s, at t = 25 s, and at t = 35 s? 2.4. Model: The jogger is a particle. Solve: The slope of the position-versus-time graph at every point gives the velocity at that point. The slope at 10 st = is
50 m 25 m 1.25 m/s20 s
svt
∆ −= = =
∆ The slope at 25 st = is
50 m 50 m 0.0 m/s10 s
v −= =
The slope at 35 st = is
0 m 50 m 5.0 m/s10 s
v −= = −
Problem 2.6 A particle starts from x0 = 10 m at t0 = 0 s and moves with the velocity graph shown to the right. (a) Does this particle have a turning point? If so, at what time? (b) What is the object’s position at t = 2s and 4 s? 2.6. Visualize: Please refer to Figure EX2.6 in the text. The particle starts at 0 10 mx = at 0 0.t = Its velocity is initially in the –x direction. The speed decreases as time increases during the first second, is zero at 1 s,t = and then increases after the particle reverses direction. Solve: (a) The particle reverses direction at 1 s,t = when xv changes sign. (b) Using the equation f 0x x= + area of the velocity graph between 1t and f ,t
2s
4s 2s
10 m (area of triangle between 0 s and 1 s) (area of triangle between 1 s and 2 s)1 110 m (4 m/s)(1 s) (4 m/s)(1 s) 10 m2 2
area between 2 s and 4 s110 m (4 m/s 12 m/s)(2 s) 26 m2
x
x x
= − +
= − + =
= +
= + + =

Problem 2.7 and 2.10 The figure to the right is a somewhat idealized graph of the velocity of blood in the ascending aorta during one beat of the heart. Approximately how far, in cm, does the blood move during one beat? (a) Approximately how far, in cm, did the blood travel during this time interval? (b) What is the blood’s acceleration during each phase of the motion, speeding up and slowing down? 2.7. Model: The graph shows the assumption that the blood isn’t moving for the first 0.1 s nor at the end of the beat. Visualize: The graph is a graph of velocity vs. time, so the displacement is the area under the graph—that is, the area of the triangle. The velocity of the blood increases quickly and decreases a bit more slowly.
Solve: Call the distance traveled .y∆ The area of a triangle is 12 .BH
1 1 (0.20 s)(0.80 m/s) 8.0 cm2 2
y BH∆ = = =
Assess: This distance seems reasonable for one beat. 2.10. Visualize: The graph is a graph of velocity vs. time, so the acceleration is the slope of the graph. Solve: When the blood is speeding up the acceleration is
2 m/s m/s0.05 s
yya
tυ∆ 0.80
= = =16∆
When the blood is slowing down the acceleration is 20.80 m/s 5.3 m/s
0.15 sy
yat
υ∆ −= = = −
∆ Assess:
216 m/s is an impressive but reasonable acceleration. Problem 2.11 The figure below shows the velocity graph of a particle moving along the x-axis. Its initial position is x0 = 2.0 m at t0 = 0 s. At t = 2.0 s, what are the particle’s (a) position, (b) velocity, and (c) acceleration? 2.11. Solve: (a) At 2 0 s,t = . the position of the particle is
2 s 2.0 m area under velocity graph from 0 s to 2.0 s12.0 m (4.0 m/s)(2.0 s) 2.0 m 8.0 m2
x t t= + = =
= + + =
(b) From the graph itself at 2 0 s,t = . 2 m/sv = . (c) The acceleration is
2f i 0.0 m/s 6.0 m/s 2.0 m/s3 s
x x xx
v v vat t
∆ − −= = = = −
∆ ∆ Problem 2.18 A Porsche challenges a Honda to a 400 m race. Because the Porsche’s acceleration is 3.50 m/s2 is larger than the Honda’s 3.00 m/s2, the Honda gets a 1.00 s head start. Who wins? By how many seconds? 2.18. Model: We are assuming both cars are particles.

Visualize:
Solve: The Porsche’s time to finish the race is determined from the position equation
2P1 P0 P0 P1 P0 P P1 P0
2 2P1 P1
1( ) ( )2
1400 m 0 m 0 m (3.5 m/s )( 0 s) 15.12 s2
x x v t t a t t
t t
= + − + −
⇒ = + + − ⇒ =
The Honda’s time to finish the race is obtained from Honda’s position equation as 2
H1 H0 H0 H1 H0 H0 H1 H0
2 2H1 H1
1( ) ( )2
1400 m 0 m 0 m (3.0 m/s )( 1 s) 15.33 s2
x x v t t a t t
t t
= + − + −
= + + + ⇒ =
So, the Porsche wins by 0.21 s. Assess: The numbers are contrived for the Porsche to win, but the time to go 400 m seems reasonable. Problem 2.21 A student standing on the ground throws a ball straight up. The ball leaves the student’s hand with a speed of 15 m/s when the hand is 2.0 m above the ground. How long is the ball in the air before it hits the ground. (The student moves out of the way.) 2.21. Model: We model the ball as a particle. Visualize:

Solve: Once the ball leaves the student’s hand, the ball is in free fall and its acceleration is equal to the free-fall acceleration g that always acts vertically downward toward the center of the earth. According to the constant-acceleration kinematic equations of motion
21 0 0
12
y y v t a t = + ∆ + ∆
Substituting the known values 2 2
1 12 m 0 m (15 m/s) (1/2)( 9.8 m/s )t t− = + + − One solution of this quadratic equation is 1 3.2 s.t = The other root of this equation yields a negative value for 1,t which is not valid for this problem. Assess: A time of 3.2 s is reasonable. Problem 2.30 A small child gives a plastic frog a big push at the bottom of a slippery 2.0-m-long, 1.0-m-high ramp, starting it with a speed of 5.0 m/s. What is the frog’s speed as it flies off the top of the ramp? 2.30. Model: The frog is a particle moving under constant-acceleration kinematic equations. The ramp is frictionless. Visualize: Note that our x-axis is positioned along the incline.
Solve: Using the following kinematic equation,
2 2 2 21 0 1 2 1
12 ( ) (5.0 m/s) 2( 9.8 m/s ) (2.0 m 0 m) 2.3 m/s2
v v a x x v = + − = + − − ⇒ =
Assess: We knew the speed at the top of the ramp would be smaller than the beginning speed at the bottom. Problem 2.32 The figure below shows the acceleration graph for a particle that starts from rest at t = 0 s. What is the particle’s velocity at t = 6 s?

2.32. Visualize:
Solve: We will determine the object’s velocity using graphical methods first and then using calculus. Graphically, 0( )v t v= + area under the acceleration curve from 0 to t. In this case,
0 0 m/sv = . The area at the time requested is a triangle. 16 s ( 6 s) (6 s)(10 m/s) 30 m/s2
t v t= = = =
Let us now use calculus. The acceleration function a(t) consists of three pieces and can be written:
2.5 0 s 4 s( ) 30 4 s 6 s
0 6 s 8 s
t ta t t t
t
≤ ≤= −5 + ≤ ≤ ≤ ≤
These were determined by the slope and the y-intercept of each of the segments of the graph. The velocity function is found by integration as follows: For 0 4 s,t≤ ≤
22
00
( ) ( 0 s) ( ) 0 2.5 1.252
tt tv t v t a t dt t= = + = + =∫
This gives
4 s ( 4 s) 20 m/st v t= = = For 4 s 6 s,t≤ ≤
22
44
5( ) ( 4 s) ( ) 20 m/s 30 2.5 30 602
tt tv t v t a t dt t t t
−= = + = + + = − + −
∫
This gives:
6 s ( 6 s) 30 m/st v t= = = Assess: The same velocities are found using calculus and graphs, but the graphical method is easier for simple graphs. Problem 2.45 and 2.46 The figures below show a set of kinematics graphs for a ball rolling on a track. All segments of the track are straight lines. Draw a picture of the track and also indicate the ball’s initial condition.

2.45. Visualize: Please refer to Figure P2.45. Solve:
2.46. Visualize: Please refer to Figure P2.46. Solve:
Problem 2.51 You are playing miniature golf at the golf course shown in the figure below. Due to the fake plastic grass, the ball decelerates at 1.0 m/s2 when rolling horizontally and at 6.0 m/s2 on the slope. What is the slowest speed with which the ball can leave your golf club if you wish to make a hole in one? 2.51. Model: We will use the particle model and the constant-acceleration kinematic equations. Visualize: The ball can have zero velocity right as it gets to the hole.
Solve: Use the kinematic equations at each stage. 2 23 2 2 3 22 22 1 1 2 12 21 0 0 1 0
2 ( )
2 ( )
2 ( )
v v a x x
v v a x x
v v a x x
= + −
= + −
= + − Solve the last equation for
20v and substitute in from the other equations.
2 2 20 1 0 1 0 2 1 2 1 0 1 0
23 2 3 2 1 2 1 0 1 0
2 2 2
2 ( ) 2 ( ) 2 ( )
2 ( ) 2 ( ) 2 ( )
0 2( 1.0 m/s )(1.0 m) 2( 6.0 m/s )(2.0 m) 2( 1.0 m/s )(3.0 m)5.7 m/s
v v a x x v a x x a x x
v a x x a x x a x x
= − − = − − − − = − − − − − −
= − − − − − −=
Assess: This seems like a swift putt, but in the reasonable range.

Problem 2.57 A lead ball is dropped into a lake from a diving board 5.00 m above the water. After entering the water, it sinks to the bottom with a constant velocity equal to the velocity with which it hit the water. The ball reaches the bottom 3.00 s after it is released. How deep is the lake? 2.57. Model: We will model the lead ball as a particle and use the constant-acceleration kinematic equations. Visualize:
Note that the particle undergoes free fall until it hits the water surface.
Solve: The kinematic equation 21
1 0 0 1 0 0 1 02( ) ( )y y v t t a t t= + − + − becomes 2 2
1 115.0 m 0 m 0 m ( 9.8 m/s )( 0) 1.01 s2
t t− = + + − − ⇒ =
Now, once again, 2
2 1 1 2 1 1 2 1
2 1 1 1
1( ) ( )2
(3.0 s 1.01 s) 0 m/s 1.99
y y v t t a t t
y y v v
= + − + −
⇒ − = − + = 1v is easy to determine since the time 1t has been found. Using 1 0 0 1 0( ),v v a t t= + − we get
21 0 m/s (9.8 m/s )(1.01 s 0 s) 9.898 m/sv = − − = −
With this value for 1,v we go back to: 2 1 11.99 (1.99)( 9.898 m/s) 19.7 my y v− = = − = −
2 1y y− is the displacement of the lead ball in the lake and thus corresponds to the depth of the lake, which is 19.7 m. The negative sign shows the direction of the displacement vector. Assess: A depth of about 60 ft for a lake is not unusual. Problem 2.68 Davis is driving at a steady 30 m/s when he passes Tina, who is sitting in her car at rest. Tina begins to accelerate at a steady 2.0 m/s2 at the instant when David passes. (a) How far does Tina drive before passing David? (b) What is her speed as she passes him? 2.68. Model: Both cars are particles that move according to the constant-acceleration kinematic equations. Visualize:

Solve: (a) David’s and Tina’s motions are given by the following equations:
2D1 D0 D0 D1 D0 D D1 D0 D0 D1
2 2T1 T0 T0 T1 T0 T T1 T0 T T1
1( ) ( )2
1 1( ) ( ) 0 m 0 m2 2
x x v t t a t t v t
x x v t t a t t a t
= + − + − =
= + − + − = + +
When Tina passes David the distances are equal and D1 T1,t t= so we get 2 D0
D1 T1 D0 D1 T T1 D0 T T1 T1 2T
1 1 2 2(30 m/s) 30 s2 2 2.0 m/s
vx x v t a t v a t ta
= ⇒ = ⇒ = ⇒ = = =
Using Tina’s position equation, 2 2 2
T1 T T11 1 (2.0 m/s )(30 s) 900 m2 2
x a t= = =
(b) Tina’s speed T1v can be obtained from 2
T1 T0 T T1 T0( ) (0 m/s) (2.0 m/s )(30 s 0 s) 60 m/sv v a t t= + − = + − = Assess: This is a high speed for Tina (~134 mph) and so is David’s velocity (~67 mph). Thus the large distance for Tina to catch up with David (~0.6 miles) is reasonable. Problem 2.71 I was driving along at 20 m/s, trying to change a CD and not watching where I was going. When I looked up, I found myself 45 m from a railroad crossing. And wouldn’t you know it, a train moving at 30 m/s was only 60 m from the crossing. In a split second, I realized that the train was going to beat me to the crossing and that I didn’t have enough distance to stop. My only hope was to accelerate enough to cross the tracks before the train arrived. If my reaction time before starting to accelerate was 0.50 s, what minimum acceleration did my car need for me to be here today writing these words? 2.71. Model: Treat the car and train in the particle model and use the constant-acceleration kinematic equations. Visualize:

Solve: In the particle model the car and train have no physical size, so the car has to reach the crossing at an infinitesimally sooner time than the train. Crossing at the same time corresponds to the minimum 1a necessary to avoid a collision. So the problem is to find 1a such that 2 45x = m when 2 60y = m. The time it takes the train to reach the intersection can be found by considering its known constant velocity.
2 00 2 2
2 0 2
60 m30 m/s 2 0 sy yy yv v tt t t
−= = = = ⇒ = .
− Now find the distance traveled by the car during the reaction time of the driver.
1 0 0 1 0( ) 0 (20 m/s)(0.50 s) 10 mxx x v t t= + − = + = The kinematic equation for the final position at the intersection can be solved for the minimum acceleration 1a .
22 1 1 2 1 1 2 1
21
21
145 m ( ) ( )2110 m (20 m/s)(1.5 s) (1.5 s)2
4.4 m/s
xx x v t t a t t
a
a
= = + − + −
= + +
⇒ = Assess: The acceleration of 4.4 2m/s = 2.0 miles/h/s is reasonable for an automobile to achieve. However, you should not try this yourself! Always pay attention when you drive! Train crossings are dangerous locations, and many people lose their lives at one each year.
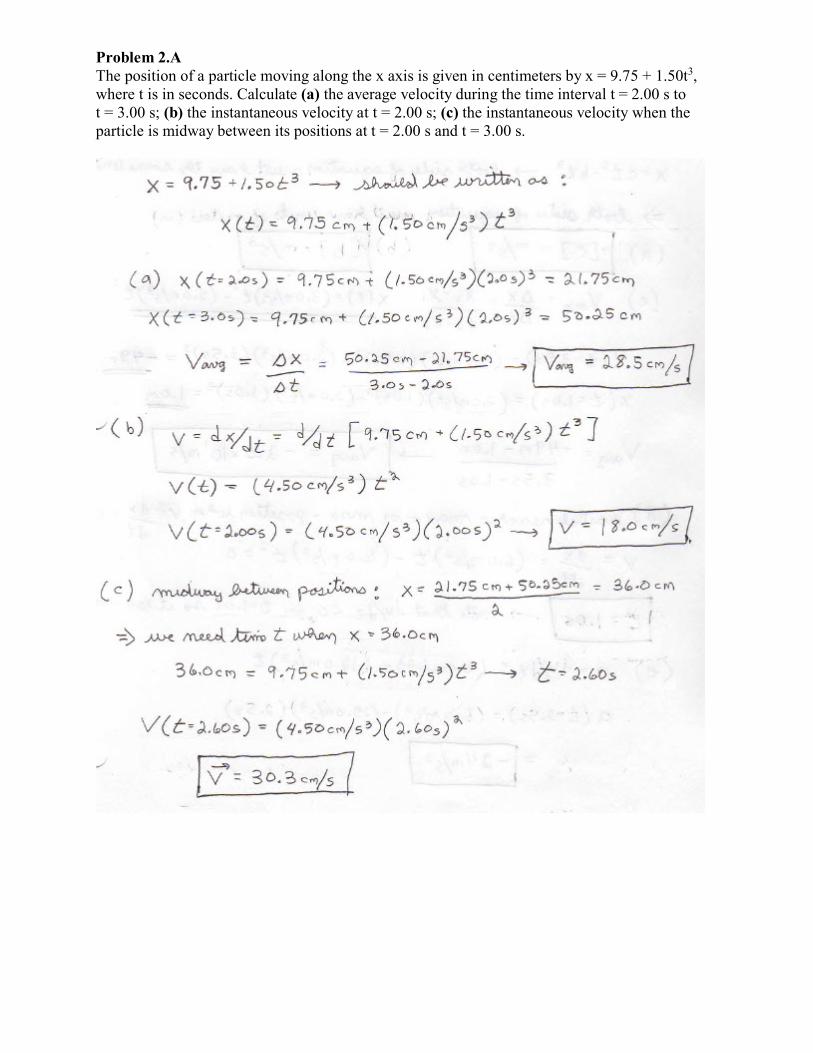
Problem 2.A The position of a particle moving along the x axis is given in centimeters by x = 9.75 + 1.50t3, where t is in seconds. Calculate (a) the average velocity during the time interval t = 2.00 s to t = 3.00 s; (b) the instantaneous velocity at t = 2.00 s; (c) the instantaneous velocity when the particle is midway between its positions at t = 2.00 s and t = 3.00 s.

Problem 2.B The position of a particle moving along the x axis depends on the time according to the equation x = ct2 – bt3, where x is in meters and t in seconds. What are the units of (a) constant c and (b) constant b? Let their numerical values be 3.0 and 2.0, respectively. (c) What is the particle’s average velocity between t = 1.0 s and t = 3.5 s? (d) At what time does the particle reach its maximum positive x position? (e) What is the particle’s acceleration at t = 2.50 s?

Problem 2.C A model rocket fired vertically from the ground ascends with a constant vertical acceleration of 4.00 m/s2 for 6.00 s. Its fuel is then exhausted, so it continues upward as a free-fall particle and then falls back down. (a) What is the maximum altitude reached? (b) What is the total time elapsed from takeoff until the rocket strikes the ground?