kinematics: motion in one dimension
DESCRIPTION
Kinematics: Motion in One Dimension. 2.1 Displacement & Velocity Learning Objectives. Describe motion in terms of displacement, time, and velocity Calculate the displacement of an object traveling at a known velocity for a specific time interval - PowerPoint PPT PresentationTRANSCRIPT

Kinematics:Motion in One Dimension

2.1 Displacement & VelocityLearning Objectives
• Describe motion in terms of displacement, time, and velocity
• Calculate the displacement of an object traveling at a known velocity for a specific time interval
• Construct and interpret graphs of position versus time

Essential Concepts
• Frames of reference• Vector vs. scalar quantities• Displacement• Velocity
– Average velocity– Instantaneous velocity
• Acceleration• Graphical representation of motion

Reference Frames
• Motion is relative
• When we say an object is moving, we mean it is moving relative to something else (reference frame)

Scalar Quantities & Vector Quantities
• Scalar quantities have magnitude
• Example: speed 15 m/s
• Vector quantities have magnitude and direction
• Example: velocity 15 m/s North

Displacement
• Displacement is a vector quantity • Indicates change in location (position) of a
body
∆x = xf - xi
• It is specified by a magnitude and a direction.
• Is independent of the path traveled by an object.

Displacement is change in position
www.cnx.org

Displacement vs. Distance
• Distance is the length of the path that an object travels
• Displacement is the change in position of an object

Describing MotionDescribing motion requires a frame of reference
http://www.sfu.ca/phys/100/lectures/lecture5/lecture5.html

Determining DisplacementIn these examples, position is determined with respect to the origin, displacement wrt x1
http://www.sfu.ca/phys/100/lectures/lecture5/lecture5.html

Indicating Direction of Displacement
When sign is used, it follows the conventions of a standard graph
Positive Right Up
Negative Left Down
Direction can be indicated by sign, degrees, or geographical directions.

Displacement
• Linear change in position of an object• Is not the same as distance
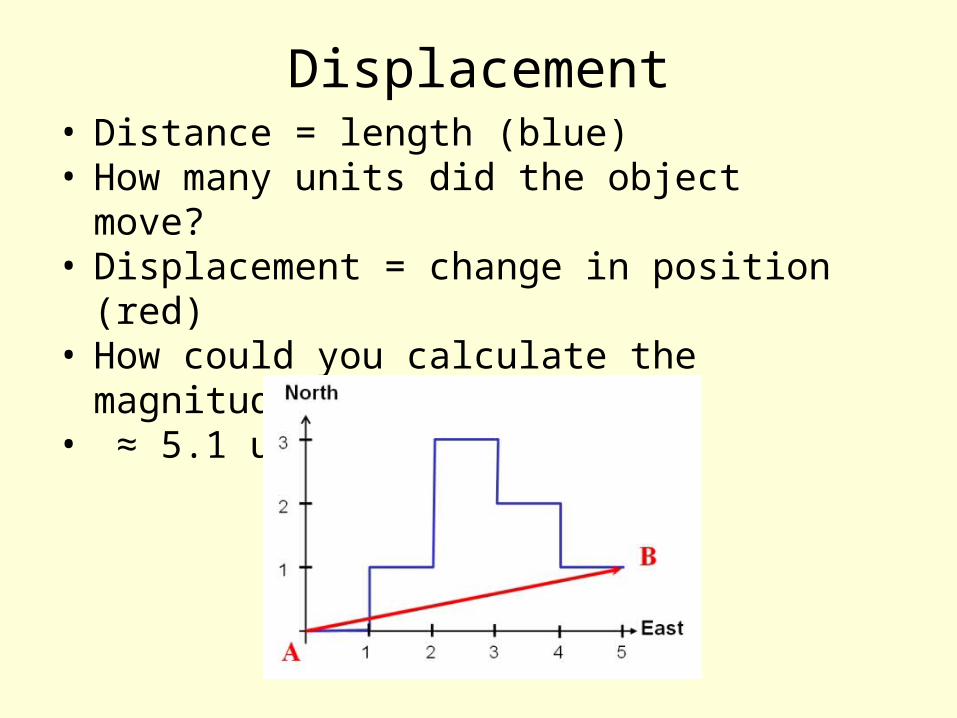
Displacement• Distance = length (blue)• How many units did the object move?• Displacement = change in position (red)• How could you calculate the magnitude of line
AB?• ≈ 5.1 units, NE
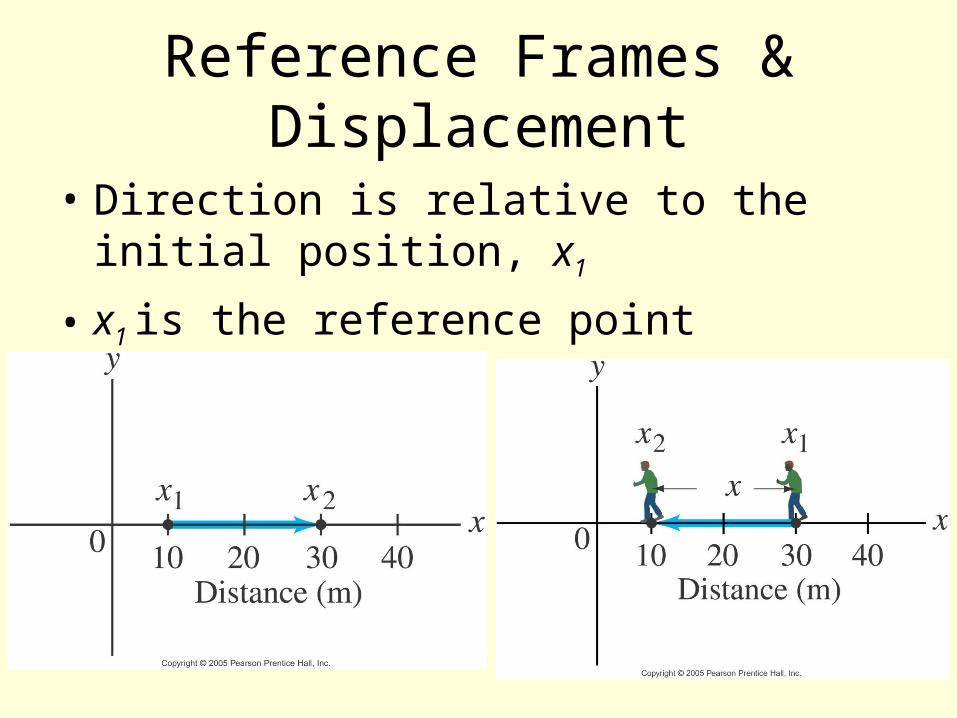
Reference Frames & Displacement
• Direction is relative to the initial position, x1
• x1 is the reference point

Average Velocity
Speed: how far an object travels in a given time interval
Velocity includes directional information:

Average Velocity

Velocity• Example
• A squirrel runs in a straight line, westerly direction from one tree to another, covering 55 meters in 32 seconds. Calculate the squirrel’s average velocity
• vavg = ∆x / ∆t
• vavg = 55 m / 32 s
• vavg = 1.7 m/s west
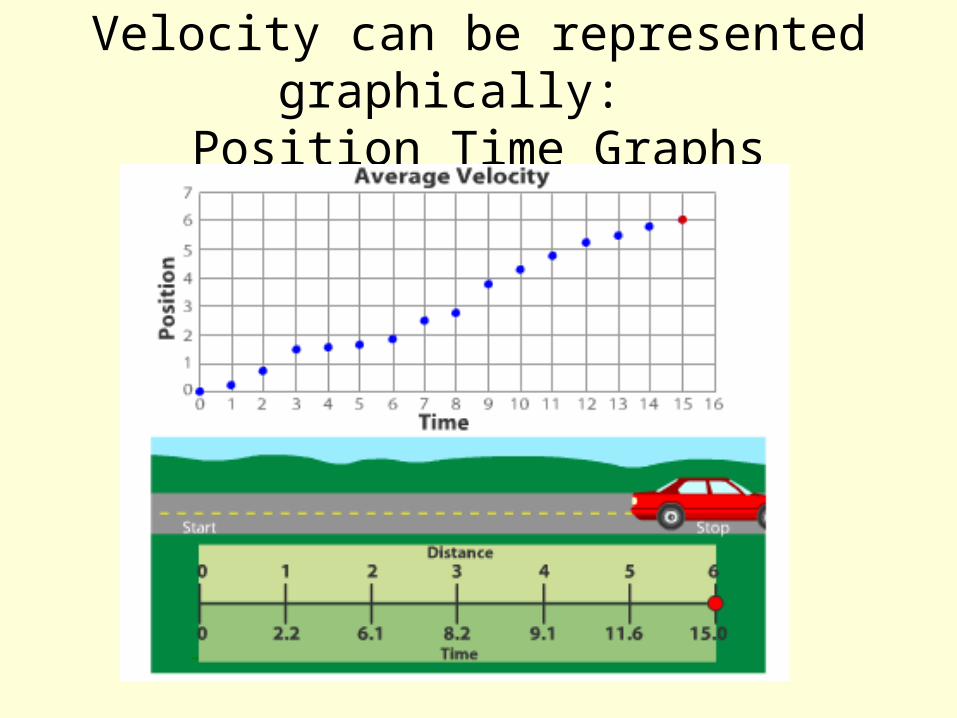
Velocity can be represented graphically:
Position Time Graphs

Velocity can be interpreted graphically: Position Time Graphs
Find the average velocity between t = 3 min to t = 8 min

Calculate the average velocity for the entire trip
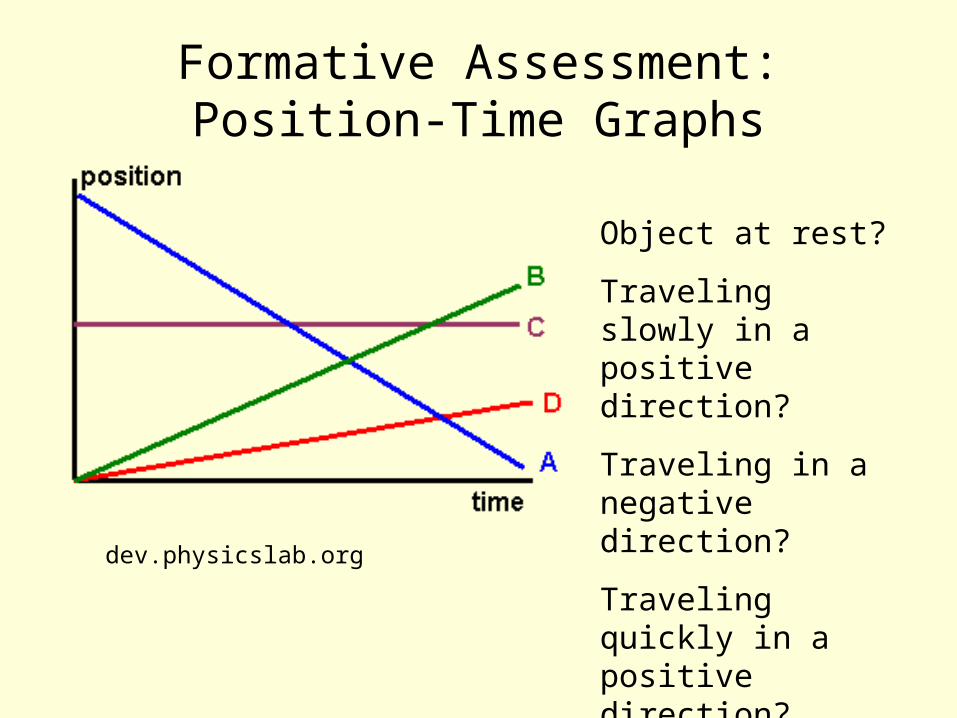
Formative Assessment:Position-Time Graphs
dev.physicslab.org
Object at rest?
Traveling slowly in a positive direction?
Traveling in a negative direction?
Traveling quickly in a positive direction?

Average vs. Instantaneous Velocity
• Velocity at any given moment in time or at a specific point in the object’s path

Position-time when velocity is not constant

Average velocity compared to instantaneous velocity
Instantaneous velocity is the slope of the tangent line at any particular point in time.
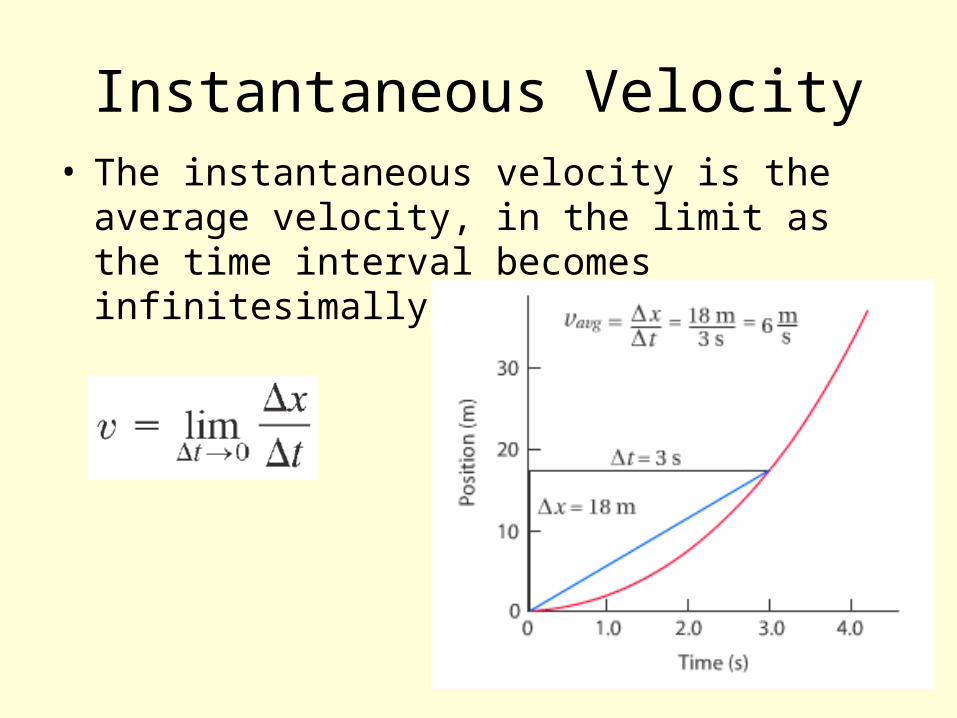
Instantaneous Velocity• The instantaneous velocity is the average
velocity, in the limit as the time interval becomes infinitesimally short.

2.2 Acceleration

2.2 AccelerationLearning Objectives
• Describe motion in terms of changing velocity
• Compare graphical representations of accelerated and non-accelerated motions
• Apply kinematic equations to calculate distance, time, or velocity under conditions of constant acceleration
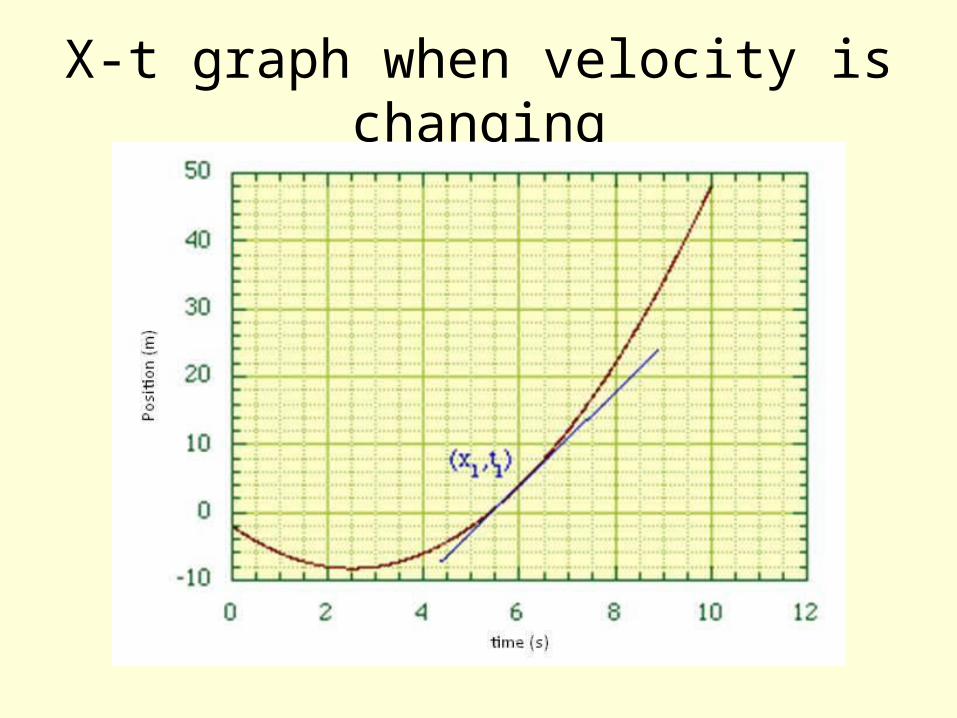
X-t graph when velocity is changing

AccelerationAcceleration is the rate of change of velocity.

Acceleration: Change in Velocity• Acceleration is the rate of change of
velocity
• a = ∆v/∆t
• a = (vf – vi) / (tf – ti)
• Since velocity is a vector quantity, velocity can change in magnitude or direction
• Acceleration occurs whenever there is a change in magnitude or direction of movement.

Acceleration
Because acceleration is a vector, it must have direction
Here is an example of negative acceleration:

Customary Dimensions of Acceleration
• a = ∆v/∆t
• = m/s/s
• = m/s2
• Sample problems 2BA bus traveling at 9.0 m/s slows down with an average acceleration of -1.8 m/s. How long does it take to come to a stop?

Negative Acceleration
• Both velocity & acceleration can have (+) and (-) values
• Negative acceleration does not always mean an object is slowing down

Is an object speeding up or slowing down?
• Depends upon the signs of both velocity and acceleration
• Construct statement summarizing this table.
Velocity Accel Motion
+ + Speeding up in + dir
- - Speeding up in - dir
+ - Slowing down in + dir
- + Slowing down in - dir

www.gcsescience.com
Velocity-Time Graphs• Is this object accelerating?• How do you know?• What can you say about its motion?

www.gcsescience.com
Velocity-Time Graph• Is this object accelerating?• How do you know?• What can you say about its motion?• What feature of the graph represents acceleration?

dev.physicslab.org
Velocity-Time Graph

Displacement with Constant Acceleration (C)
tvvx
tvv
x
vv
t
x
vv
vvv
t
xv
fi
fi
fi
avgavg
fiavgavg
2
1 Or
2
Thus
2 Then
Since2
and

Displacement on v-t GraphsHow can you find displacement on the v-t graph?
tvxt
xv
so ,

Displacement on v-t Graphs
tvx Displacement is the area under the line!

Graphical Representation of Displacement during Constant
Acceleration

Displacement on a Non-linear v-t graph
• If displacement is the area under the v-t graph, how would you determine this area?

tavvThent
vvaand
t
vaSince
if
if
Final velocity of an accelerating object

2Δ2
1ΔΔ
ΔΔ22
1Δ
ΔΔ2
1Δ
:equation above theinto ngSubstituti
Δ :know We
Δ2
1Δ :know We
tatvx
tt a v x
tt a vv x
v
t a v v
tvv x
i
i
ii
f
if
fi
Displacement During Constant Acceleration (D)

Graphical Representation

Derivation of the Equation

Final velocity after any displacement (E)
xavv if 222
A baby sitter pushes a stroller from rest, accelerating at 0.500 m/s2. Find the velocity after the stroller travels 4.75m. (p. 57)
Identify the variables.Solve for the unknown.Substitute and solve.
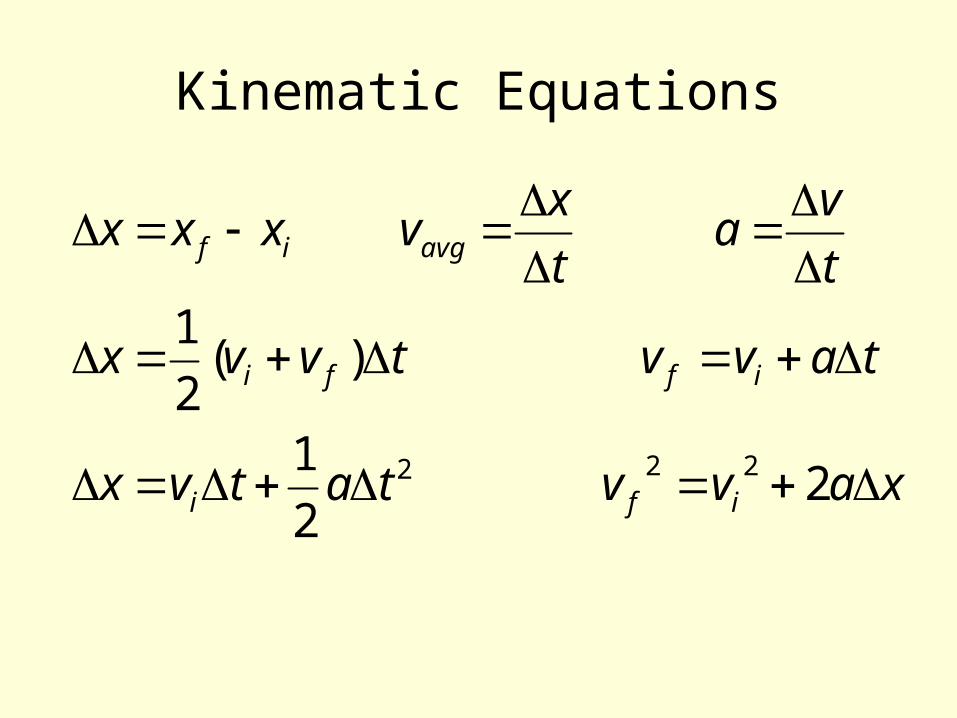
Kinematic Equations
xavvtatvx
tavvtvvx
t
va
t
xvxxx
ifi
iffi
avgif
2 2
1
)(2
1
222

2.3 Falling Objects
Objectives
1. Relate the motion of a freely falling body to motion with constant acceleration.
2. Calculate displacement, velocity, and time at various points in the motion of a freely falling object.
3. Compare the motions of different objects in free fall.

Motion Graphs of Free FallWhat do motion graphs of an object in free fall look like?

Motion Graphs of Free Fall
x-t graph v-t graph
What do motion graphs of an object in free fall look like?

Do you think a heavier object falls faster than a lighter one?
Why or why not?
Yes because …. No, because ….

Free Fall
• In the absence of air resistance, all objects fall to earth with a constant acceleration
• The rate of fall is independent of mass
• In a vacuum, heavy objects and light objects fall at the same rate.
• The acceleration of a free-falling object is the acceleration of gravity, g
• g = 9.81m/s2 memorize this value!

• Free fall is the motion of a body when only the force due to gravity is acting on the body.
• The acceleration on an object in free fall is called the acceleration due to gravity, or free-fall acceleration.
• Free-fall acceleration is denoted with by ag (generally) or g (on Earth’s surface).
Free Fall

• Free-fall acceleration is the same for all objects, regardless of mass.
• This book will use the value g = 9.81 m/s2.• Free-fall acceleration on Earth’s surface is –
9.81 m/s2 at all points in the object’s motion. • Consider a ball thrown up into the air.
– Moving upward: velocity is decreasing, acceleration is –9.81 m/s2
– Top of path: velocity is zero, acceleration is –9.81 m/s2
– Moving downward: velocity is increasing, acceleration is –9.81 m/s2
Free Fall Acceleration
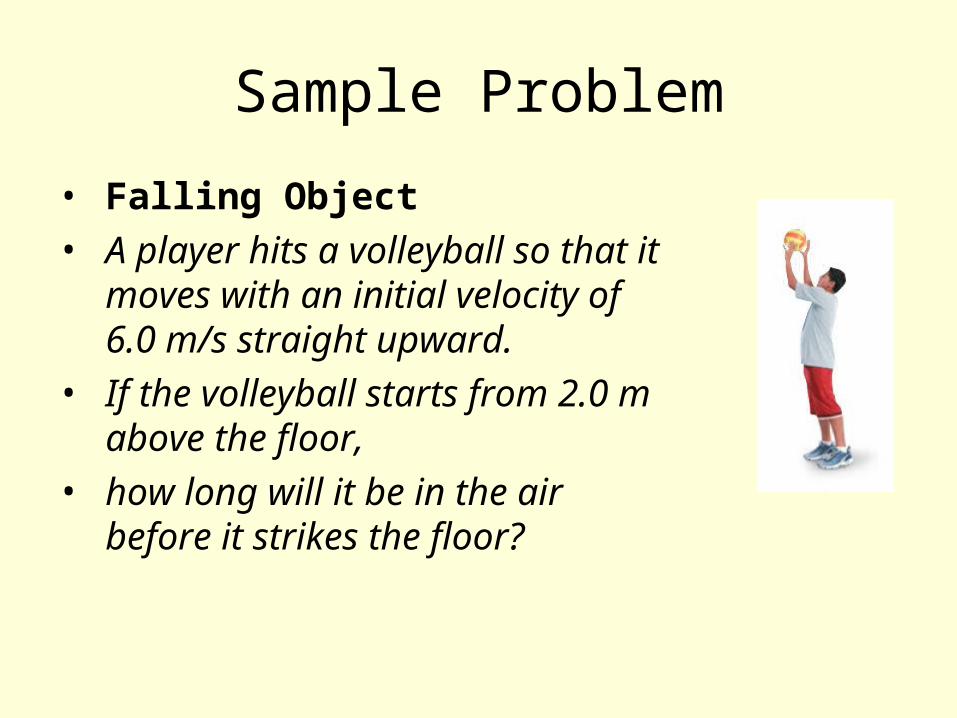
Sample Problem
• Falling Object• A player hits a volleyball so that it
moves with an initial velocity of 6.0 m/s straight upward.
• If the volleyball starts from 2.0 m above the floor,
• how long will it be in the air before it strikes the floor?

Sample Problem, continued
1. DefineGiven: Unknown:
vi = +6.0 m/s Δt = ?
a = –g = –9.81 m/s2 Δ y = –2.0 m
Diagram: Place the origin at the Starting point of the ball
(yi = 0 at ti = 0).

2. Plan Choose an equation or situation:
Both ∆t and vf are unknown.
We can determine ∆t if we know vf
Solve for vf then substitute & solve for ∆t 3. Calculate Rearrange the equation to isolate the unknowns:
yavv if 222 tavv if
yavv if 22a
vvt if
vf = - 8.7 m/s Δt = 1.50 s

Summary of Graphical Analysis of Linear Motion
This is a graph of x vs. t for an object moving with constant velocity. The velocity is the slope of the x-t curve.

Comparison of v-t and x-t Curves
On the left we have a graph of velocity vs. time for an object with varying velocity; on the right we have the resulting x vs. t curve. The instantaneous velocity is tangent to the curve at each point.

Displacement an v-t Curves
The displacement, x, is the area beneath the v vs. t curve.