physical metallurgy lab - iitk.ac.in
TRANSCRIPT
1
MSE 311
Physical Metallurgy Lab 2015-2016
Instructor Dr. Kallol Mondal Dr. Vivek Verma Materials Science & Engineering Materials Science & Engineering Office: Western Lab 113 Phone 6156 Faculty Building 418 Ph. 6527
Email: [email protected] [email protected] Lab: Monday, Tuesday, Thursday 14:00 to 16:50 (Venue- Physical Metallurgy Lab WL-201)
Lab In-charge: Mr. G P Bajpai
Materials Science & Engineering Ph. 7933/7862; Email: gpbajpai@ Cell: 9415511491
TAs: Day TAs email
Monday (Group A to D)
1 Mr. Ram Pyar Singh 2 Mr. Mukul Raju Bhagia 3 Mr. Pankaj Kumar
singhrp@ mukulb@ pnkj@
Tuesday (Group E to H)
1 Mr. Surinder Punia 2 Mr. Nitin Tandekar 3 Mr. Rajesh Kumar
surender@ nitintnd@ rajeshkr@
Thursday (Group I to L)
1 Mr. Sanu Kumar Gupta 2 Mr. Randhir K Parashar 3 Mr. Prabhat Kumar Rai
sanugupt@ randhirp@ pkraj
Table of Contents: Sr Description Page Number
1 General Information for the MSE 311 1 to 3
2 Introduction of Metallographic Sample preparation. 3 to 7
3 Optical microscopy of ferrous samples.(Mild Steel , High Carbon Steel, Cast Iron, Stainless Steel,
8 to 10
4 Optical Microscopy of Non –Ferrous Samples. (Cu, Zink Brass, Pb-Sn) 11 to 13
5 Quantitative Metallography and image analysis 14 to 15
6 X-ray powder diffraction in materials analysis 16
7 Streographic Projections
8 Etching Agents 17
9 Time Table and Group/Day distribution 18
10 Reading Materials 19-
2
General Information
Total Laboratory Turns: 12 [6 experiments in first session (before midsem) and 6 experiments in next session (after midsem) Lab Exam/Lab Viva/Lab Quiz will be either after both sets of experiments or after each set of experiment. Each day, viva will be taken on the experiment.
Marks Distribution of Lab:
Laboratory (Total 100 %) a) Daily Lab Report 10% b) Daily Lab Viva 10% c) Assignment 15% d) Project 25% e) Final Lab Exam/ Lab Viva 40%
SAFETY:
To avoid injury, the students must take the permission of the laboratory staffs before handling any machine. Careless handling of machines may result in serious injury.
Students must ensure that their work areas are clean. At the end of each experiment, students must clear off all tools and materials from
the work area.
RULES: Follow the lab timing and come in proper attire. There will be two attendances:
Initial attendance (at sharp 2 PM) to be taken by TAs at the beginning of lab session and final one after the experiments over. Late comers will not be allowed to enter.
Do not use cell phone inside the lab during lab timing. Students must come to the laboratory wearing trousers and shoes. Half pants, loosely
hanging garments and slippers are strictly prohibited.
Every student should obtain a copy of Laboratory Manual. You are requested to bring
your lab manual on the day of experiment.
The Lab report should contain: (1) Title of the experiment, (ii) Three to four lines
stating the objectives, (iii) Name of all equipments/tools used along with a one line
description of their use, and (iv) Observations and (v) Answer to questions
specifically asked in the section “to report” The report should be short and nicely
prepared.
RECOMMENDED READING: The Principles of Metallographic Laboratory Practice by George L. Khel Physical Metallurgy by V. Raghvan
Engineering Physical Metallurgy by Yu. Lakhtin
Material Science by S P Gupta

3
Experiment 1
Introduction of Metallographic Specimen Preparation
Objective:
1. Metallographic Sample Preparation.
2. To study the importance of the various steps in sample preparation.
3. To understand the need of mounting, polishing and etching.
Introduction:
Metallography is the study of the microstructure of metals and alloys by means of
microscopy. It is an art and science of preparing, interpreting, and analyzing microstructures
in materials, to better understand materials behavior and performance. The method is
used for the evaluation of metallic materials in the various industries, including the
aerospace industry, the automotive industry and parts of the construction industry. It is also
used for process control including the examination of defects that appear in finished or
partly finished products, as well as the studies of parts that have failed during service. It is
an important branch of the Metallurgical Engineering.
A well prepared metallographic specimen is:
a. A representative sample
b. Sectioned, ground and polished so as to minimize disturbed or flowed surface metal
caused by mechanical deformation, and thus to allow the true microstructure to be
revealed by etching.
c. Free from polishing scratches and pits and liquid staining
d. Flat enough to permit examination by optical microscope or SEM
Various steps involved in the specimen preparation, and the significance of each step:
Many steps in the preparation of metallographic specimens described here are also
applicable in other types of metallographic studies, such as electron microscopy, micro
hardness testing, quantitative measurement of constituents of structures, and electron
microprobe analysis. Preparation of metallographic specimens generally requires five
major operations:
a. Sectioning
b. Mounting (which is necessary when the sample cannot be held properly due to its
shape and/or size, while polishing)
c. Grinding
d. Polishing
e. Etching
These operations are listed below in the order they are performed
Sectioning
Separate test pieces or coupons attached to castings or forgings should be designed so that
a minimum of sectioning is required for producing metallographic specimens. Sectioning
4
becomes necessary when studying parts that have failed in service where specimen has to
be taken from a large block of material. Therefore, metallographic studies of such
samples often involve more than one sectioning operation.
Many metallographic studies require more than one specimen. For example, a study of
deformation in wrought metals usually requires two sections- one perpendicular to, and
the other parallel to, the major axis of the direction of deformation. Failed parts may best
be studied by selecting a specimen that intersects the origin of the failure, if the origin can
be identified on the surface. Depending on the type of failure, it may be necessary to take
several specimens from the area of failure and from adjacent areas.
Mounting of Specimens
The primary purpose of mounting is to make it convincement to handle specimens of
arbitrary shape and/or small sizes during various steps of metallographic sample
preparation and examination. A secondary purpose is to protect and preserve extreme
edges or surface defects during metallographic preparation. Specimens may also require
mounting to accommodate various types of automatic devices used in metallographic
laboratories or to facilitate placement on the microscope stage. An additional benefit of
mounting is the identification of the sample (name, alloy number or laboratory code
number) without damaging the specimen.
Compression mounting: It is most common mounting method, which involves molding
around the metallographic specimen by heat and pressure using the molding materials such
as Bakelite, Diallyl Phthalate resins, and acrylic resins. Bakelite and Diallyl phthalate are
thermosetting, and acrylic resins are thermoplastic.
Not all materials or specimens can be mounted in thermosetting or thermoplastic mounting.
The heating cycle may cause changes in the microstructure, or the pressure may cause
delicate specimens to collapse or deform. The size of the selected specimen may be too large
to be accepted by the available mold sizes. These difficulties are usually overcome by cold
mounting.
Cold Mounting requires no pressure and little heat, and is a mean of mounting large
numbers of specimens more rapidly than possible by compression mounting. Epoxy resins
are most widely used cold mounting materials. They are hard, and adhere tenaciously to
most metallurgical, mineral and ceramic specimens.
Grinding
Grinding is a most important operation in specimen preparation. During grinding, the
operator has the opportunity of minimizing mechanical surface damage, that can be removed
by subsequent polishing operations. Even if sectioning is done in a careless manner resulting
into a severely damaged surface, the damage can be eliminated by prolonged grinding.
However, prolonged grinding should be avoided since it might lead to excess heating or
surface damage.
5
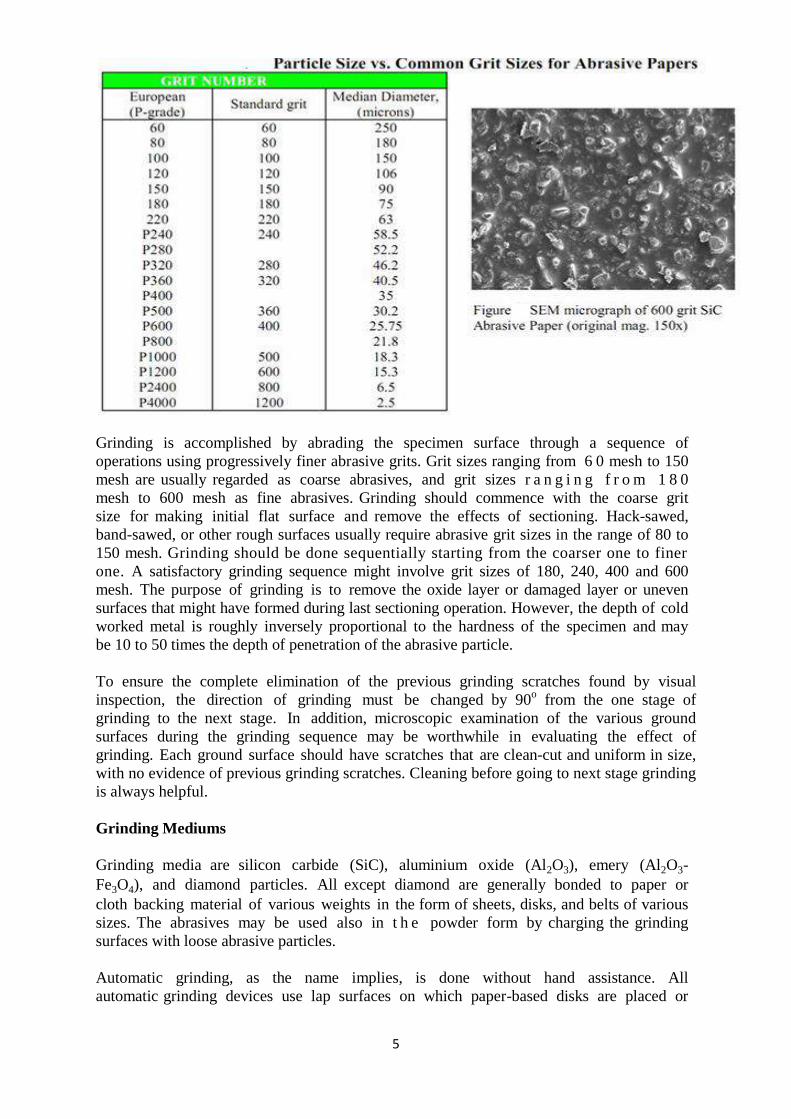
Grinding is accomplished by abrading the specimen surface through a sequence of
operations using progressively finer abrasive grits. Grit sizes ranging from 6 0 mesh to 150
mesh are usually regarded as coarse abrasives, and grit sizes r a n g i n g f r o m 1 8 0
mesh to 600 mesh as fine abrasives. Grinding should commence with the coarse grit
size for making initial flat surface and remove the effects of sectioning. Hack-sawed,
band-sawed, or other rough surfaces usually require abrasive grit sizes in the range of 80 to
150 mesh. Grinding should be done sequentially starting from the coarser one to finer
one. A satisfactory grinding sequence might involve grit sizes of 180, 240, 400 and 600
mesh. The purpose of grinding is to remove the oxide layer or damaged layer or uneven
surfaces that might have formed during last sectioning operation. However, the depth of cold
worked metal is roughly inversely proportional to the hardness of the specimen and may
be 10 to 50 times the depth of penetration of the abrasive particle.
To ensure the complete elimination of the previous grinding scratches found by visual
inspection, the direction of grinding must be changed by 90o from the one stage of
grinding to the next stage. In addition, microscopic examination of the various ground
surfaces during the grinding sequence may be worthwhile in evaluating the effect of
grinding. Each ground surface should have scratches that are clean-cut and uniform in size,
with no evidence of previous grinding scratches. Cleaning before going to next stage grinding
is always helpful.
Grinding Mediums
Grinding media are silicon carbide (SiC), aluminium oxide (Al2O3), emery (Al2O3-
Fe3O4), and diamond particles. All except diamond are generally bonded to paper or
cloth backing material of various weights in the form of sheets, disks, and belts of various
sizes. The abrasives may be used also in t h e powder form by charging the grinding
surfaces with loose abrasive particles.
Automatic grinding, as the name implies, is done without hand assistance. All
automatic grinding devices use lap surfaces on which paper-based disks are placed or
6
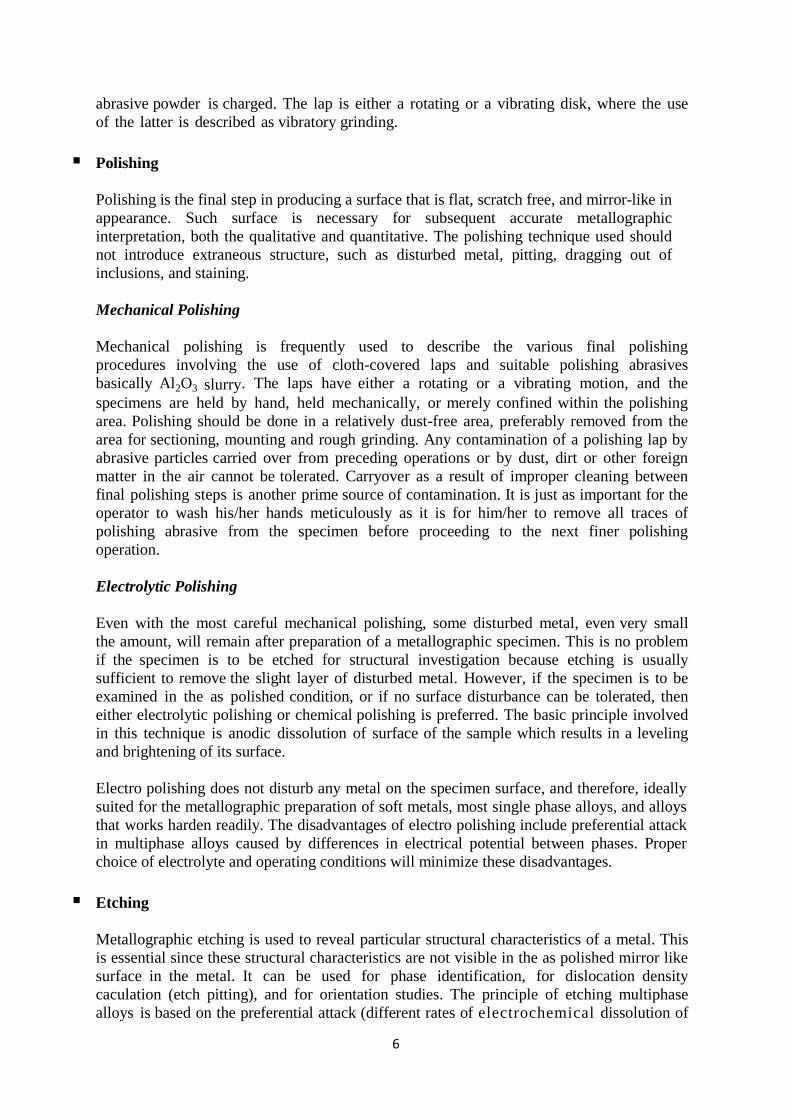
abrasive powder is charged. The lap is either a rotating or a vibrating disk, where the use
of the latter is described as vibratory grinding.
Polishing
Polishing is the final step in producing a surface that is flat, scratch free, and mirror-like in
appearance. Such surface is necessary for subsequent accurate metallographic
interpretation, both the qualitative and quantitative. The polishing technique used should
not introduce extraneous structure, such as disturbed metal, pitting, dragging out of
inclusions, and staining.
Mechanical Polishing
Mechanical polishing is frequently used to describe the various final polishing
procedures involving the use of cloth-covered laps and suitable polishing abrasives
basically Al2O3 slurry. The laps have either a rotating or a vibrating motion, and the
specimens are held by hand, held mechanically, or merely confined within the polishing
area. Polishing should be done in a relatively dust-free area, preferably removed from the
area for sectioning, mounting and rough grinding. Any contamination of a polishing lap by
abrasive particles carried over from preceding operations or by dust, dirt or other foreign
matter in the air cannot be tolerated. Carryover as a result of improper cleaning between
final polishing steps is another prime source of contamination. It is just as important for the
operator to wash his/her hands meticulously as it is for him/her to remove all traces of
polishing abrasive from the specimen before proceeding to the next finer polishing
operation.
Electrolytic Polishing
Even with the most careful mechanical polishing, some disturbed metal, even very small
the amount, will remain after preparation of a metallographic specimen. This is no problem
if the specimen is to be etched for structural investigation because etching is usually
sufficient to remove the slight layer of disturbed metal. However, if the specimen is to be
examined in the as polished condition, or if no surface disturbance can be tolerated, then
either electrolytic polishing or chemical polishing is preferred. The basic principle involved
in this technique is anodic dissolution of surface of the sample which results in a leveling
and brightening of its surface.
Electro polishing does not disturb any metal on the specimen surface, and therefore, ideally
suited for the metallographic preparation of soft metals, most single phase alloys, and alloys
that works harden readily. The disadvantages of electro polishing include preferential attack
in multiphase alloys caused by differences in electrical potential between phases. Proper
choice of electrolyte and operating conditions will minimize these disadvantages.
Etching
Metallographic etching is used to reveal particular structural characteristics of a metal. This
is essential since these structural characteristics are not visible in the as polished mirror like
surface in the metal. It can be used for phase identification, for dislocation density
caculation (etch pitting), and for orientation studies. The principle of etching multiphase
alloys is based on the preferential attack (different rates of electrochemical dissolution of
7
phases in the etchant) or preferential staining of one or more phases, because of
differences in chemical composition and, because of differences in grain-orientation.
Before being etched, a specimen should be inspected for polishing defects, such as
scratches, pits, relief polish, comet tails, pulled out inclusions, and voids.
Chemical Etching
Chemical etching is accomplished by immersing the specimen in (or swabbing it with)
a suitable etchant until the required structure is revealed. Etching is done in Petri-dishes
or in other suitable containers with loose covers to prevent excessive evaporation of the
solvent, particularly alcohol solutions. Glass containers can be used for all etchants except
hydrofluoric acid solutions, where the container should be made of polyethylene or other
suitable material. By the use of tongs or other convenient handling device, the surface of
the specimen is immersed in the etchant with some agitation to ensure that fresh etchant is
in contact with the specimen all the times. During etching, most metals lose their bright
appearance, indicating that etching is taking place. With practice, one can ascertain the
completion of etching by the degree of dullness of the surface. If the etching procedure
calls for swabbing, the surface of the specimen can be swabbed with cotton saturated
with the etchant, or the specimen can be immersed and swabbed while in the solution. When
etching is complete, the specimen is rinsed in running water and then in alcohol, followed
by drying in a stream of warm air (hand dryer). After etching the specimen surface is
observed under the optical-microscope for studying its microstructure. Care should be
taken while etching so that the hand is not affected by the etching.
To report:
1. What is mounting?
2. Differentiate between hot and cold mounting?
3. Define terms polishing, grinding, and mesh size?
4. Explain the importance of etchant?
5. Which types of materials are basically polished by electrolytic polishing?
6. What are the effects you have observed on changing etchant time?
7. HF should not be kept in glass bottle. Why?
8. Which type of precaution should be taken care of before etching?
8
EXPERIMENT 2
Optical Microscopy of ferrous samples
Objective
Optical Microscopy of different ferrous samples of Steel (Mild steel, Stainless Steel) and Cast
Irons
Methodology
• Follow all the steps for making the specimen for etching (as per first day lab)
• Etch with the proper etchant (list of etchants is given in the Appendix)
• See the microstructure with appropriate magnification.
• Draw the microstructure and label.
Brief description about iron carbon diagram:
Read: The Principles of Metallographic Laboratory Practice by George L. Khel
Physical Metallurgy by V. Raghvan and Engineering
Physical Metallurgy by Yu. Lakhtin
We shall now consider alloys of Iron and Carbon in our experiment. We will look at the
microstrucrures of Fe–C alloys, which undergo solid state transformations, such as eutectoid
transformations, martensitic transformations, etc. Fe-C alloys with C content less than 2 wt
%C are known as plain carbon steels. There are many reasons for studying the microstructure
of plain carbon steels. Carbon steels by far find the maximum use in industries and daily life.
With the variation of different phases, the processing, properties and use of the Fe-C alloys
also vary. Hence, Fe-C phase diagram and the microstructure in carbon steels are to be
studied so extensively.
Let us first look at the Fe rich portion of classical Fe-C phase diagram (Figure 2). Cementite
is an intermetallic compounds orthorhombic crystal structure. This phase diagram depicts a
number of invariant points. If we consider an alloy with 0.8wt% C and heat it to 9500C
(1223K), it forms single phase austenite having FCC crystal structure. Austenite has high
solubility of carbon (max. 2.11wt% at about 11500C) On cooling such an alloy below 723
0C
, the alloy undergoes eutectoid transformation forming two phases, ferrite(α) and cementite,
simultaneously. This structure is known as pearlite, which consists of alternate lamellae of α
and Fe3C. Steels having composition less than 0.8 wt% C (known as hypoeutectoid steels)
has primary α and pearlite in the microstructure because on cooling such a steel from γ
region, it forms α first until the composition of the remaining γ reaches 0.8 wt% at
temperature of 7230C, and this austenite undergoes eutectoid transformation. Therefore,
microstructure of hypoeutectoid steels consists of proeutectoid α with lamellar pearlite in
varying proportions depending on the alloy composition. Similarly, Fe-C alloy compositions
more than 0.8 wt% C are termed as hypereutectoid steels. The microstructure of such steels
consists of pro eutectoid Fe3C with lamellar pearlite.
The microstructure of steels depends on heat treatment conditions. If we heat a steel with
0.7wt% C to 950 0
C and suddenly quench the steel in water (or brine solution), the steel
becomes very hard. Quenching of steel is the rapid cooling from a suitably elevated
temperature. This is because, γ transforms to a new phase called martensite, which is a

9
metastable phase with body center tetragonal crystal structure. Martensite has lath shaped
morphology, which are internally twinned. The microstructures shows twin laths in different
orientations. The most important alloy steel is stainless steel. Stainless steels are stainless as
they have minimum 11.5wt% Cr, which forms very thin, protective, adherent and stable
oxide (preferably Cr2O3) film on the surface. This film is continuous, impervious and passive
to stop further reaction between steels and atmosphere. Stainless steels can be of different
types depending on the microstructure: ferrite, austenitic, martensitic, duplex types. We will
study 18 wt% Cr and 8 wt% Ni, famously known as 18-8 austentic stainless steel. The
microstructure shows grains of austenite.
Figure 2: Phase diagram of Fe-C system
Cast Irons
Gray Cast iron: When a cast iron is solidified slowly, the tendency of carbon to separate out
as graphite increases. In gray cast iron the graphite precipitates as irregular, elongated, curved
and interconnected plates. Although the flakes appear as if separated in the two dimensional
microstructure, they are interconnected in three dimensional structures. The large graphite
flakes not only interrupt the continuity of the matrix but also act as stress risers. As a result,
the strength and ductility of the gray cast iron decreases. However, the presence of flake
graphite provides good wear and thermal properties along with good damping capacity. Gray
cast iron is widely used for gear and pump housings, machines beds, brake drums, motor
frames and electrical equipment.
White cast iron: White cast irons are very brittle and contain eutectic mixture of austenite
and cementite (known as leduburite) upon cooling. A typical microstructure of white cast iron
10
consists of dendrites of transformed austenite (later to pearlite) in white interdendritic
network of cementite. Cementite is a hard, brittle interstitial compound. Since white cast iron
contains relatively large amounts of cementite in the form of continuous interdentritic
network, it makes the white cast iron “hard” and “wear resistant”. However, it is extremely
brittle and difficult to machine. White cast irons have limited in engineering applications,
because of inherent brittleness and lack of machinability. They are used where wear
resistance is most important, and service condition does not require ductility such as liners for
cement mixtures, ball mills, certain type of drawing dies and extrusion nozzles.
Nodular/ Spheroidal cast iron: In the nodular cast iron the graphite is present as tiny balls or
nodules. Nodular iron is produced by the addition of one or more elements, such as as Mg,
Ce, Ca, Li, Na, and Ba to the molten metal. Mg plays an important role in the formation of
graphite nodules. The spheroids result in higher strength and toughness compared to gray cast
iron. Some typical application of nodular iron includes crank shafts, pistons, cylinder heads,
fly wheels, work rolls, lever, etc.
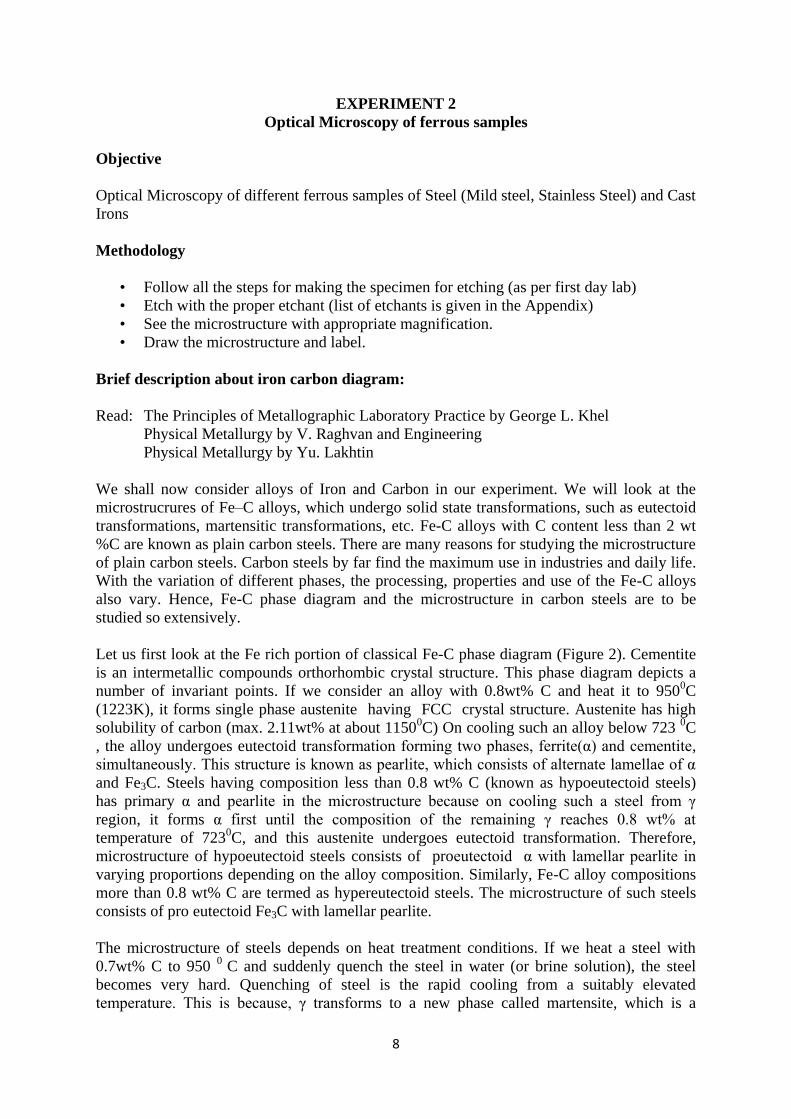
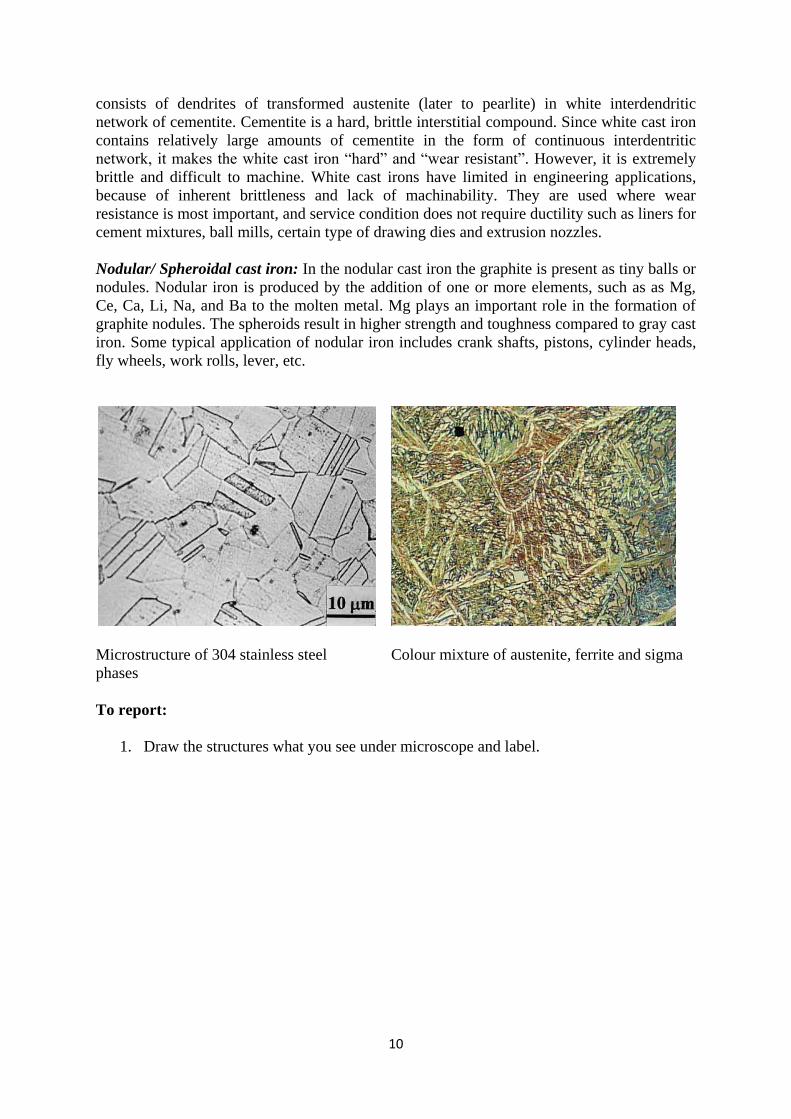
Microstructure of 304 stainless steel Colour mixture of austenite, ferrite and sigma
phases
To report:
1. Draw the structures what you see under microscope and label.
11
EXPERIMENT 3
Optical Microscopy of Non Ferrous Sample
Objective:
Optical Microscopy of different non ferrous samples (Lead-Tin alloy, Copper, Zinc, Brass)
Methology
• Follow all the steps for making the specimen for etching (as per first day lab)
• Etch with the proper solutions (list of etchant is given at the end of the document)
• See the microstructure with appropriate magnification.
• Draw the microstructure and label.
Brief description about eutectic alloys.
Read: The Principles of Metallographic Laboratory Practice by George L. Khel
Physical Metallurgy by V. Raghvan and
Engineering Physical Metallurgy by Yu. Lakhtin
The metallography of non-ferrous metals are little tricky since they are soft and some of the
cases, special reagents are required for etching.
Copper (Cu):
Copper is a face centered cubic (FCC metal) with very high ductility, electrical and thermal
conductivity. This is very soft too. It is used in electrical applications, industrial machinery,
hearth for arc furnaces. In the alloyed form, it also finds enormous importance. One such
application is duralumin (Al-4.5% Cu), which is common material for airplane body material.
When it is alloyed with Zn, it is called brass. 70:30 brass is very common in making pipe
lines for water.
Zinc (Zn):
Zinc is hexagonal closed packed structure with limited ductility. However, when formed
alloys with Cu, it forms one of the exciting engineering alloy, called Brass. Zinc finds some
crucial engineering applications, like galvanization of steel (for corrosion protection),
sacrificial anode for protecting underground metallic structures (cathodic protection), etc.
Brass:
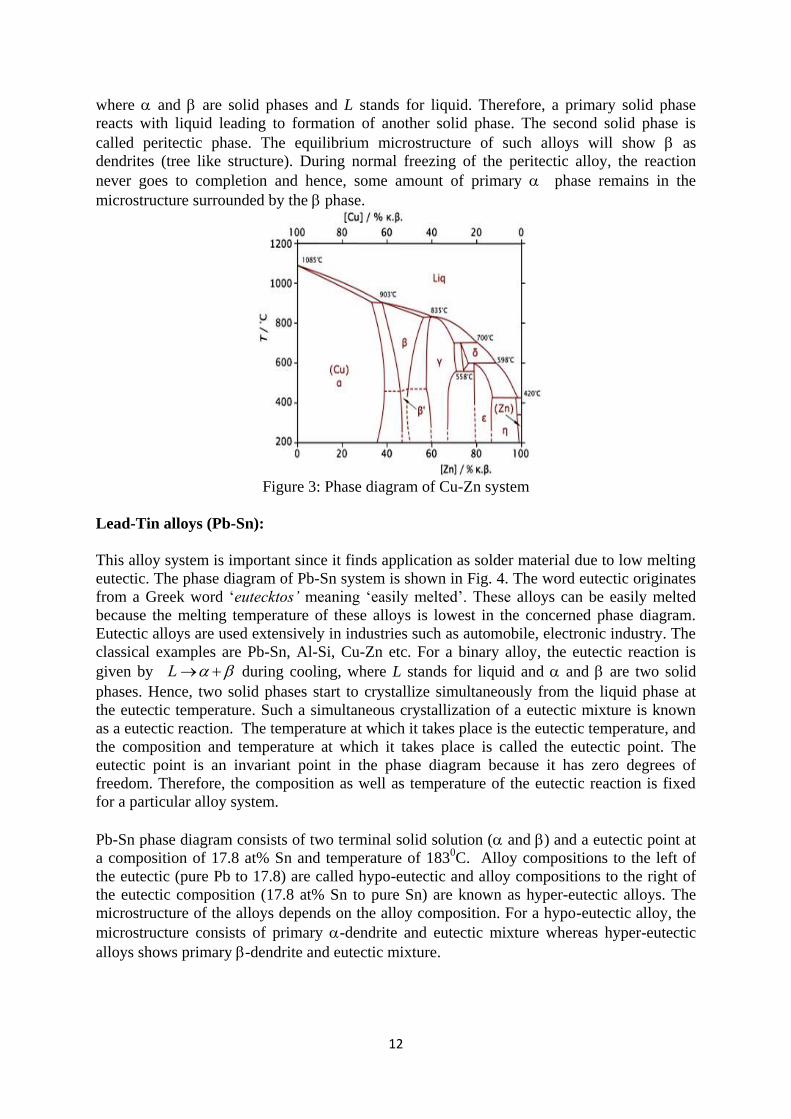
Figure 4 shows the Cu-Zn phase diagram with different phases. Cu-rich portion of the phase
diagram reveals a cascade of peritectic reactions. The peritectic reactions corresponding to
+ brass is marked. In the laboratory exercise, you will study the microstructure of
composition of alloy Cu:Zn =60:40. The microstructure will reveal presence of both the
and phases because of incomplete peritectic reaction. Apart from Brass, many other
technically important alloy systems such as steels, CuSn (Bronze), rare earth permanent
magnets (Nd-Fe-B) and high Tc superconductors (Yb-B-Cu-O) display peritectic reactions,
where phase and microstructure selection plays an important role for the processing and the
properties of the material. The peritectic reaction can be written as
a L on cooling,
12
where and are solid phases and L stands for liquid. Therefore, a primary solid phase
reacts with liquid leading to formation of another solid phase. The second solid phase is
called peritectic phase. The equilibrium microstructure of such alloys will show as
dendrites (tree like structure). During normal freezing of the peritectic alloy, the reaction
never goes to completion and hence, some amount of primary phase remains in the
microstructure surrounded by the phase.
Figure 3: Phase diagram of Cu-Zn system
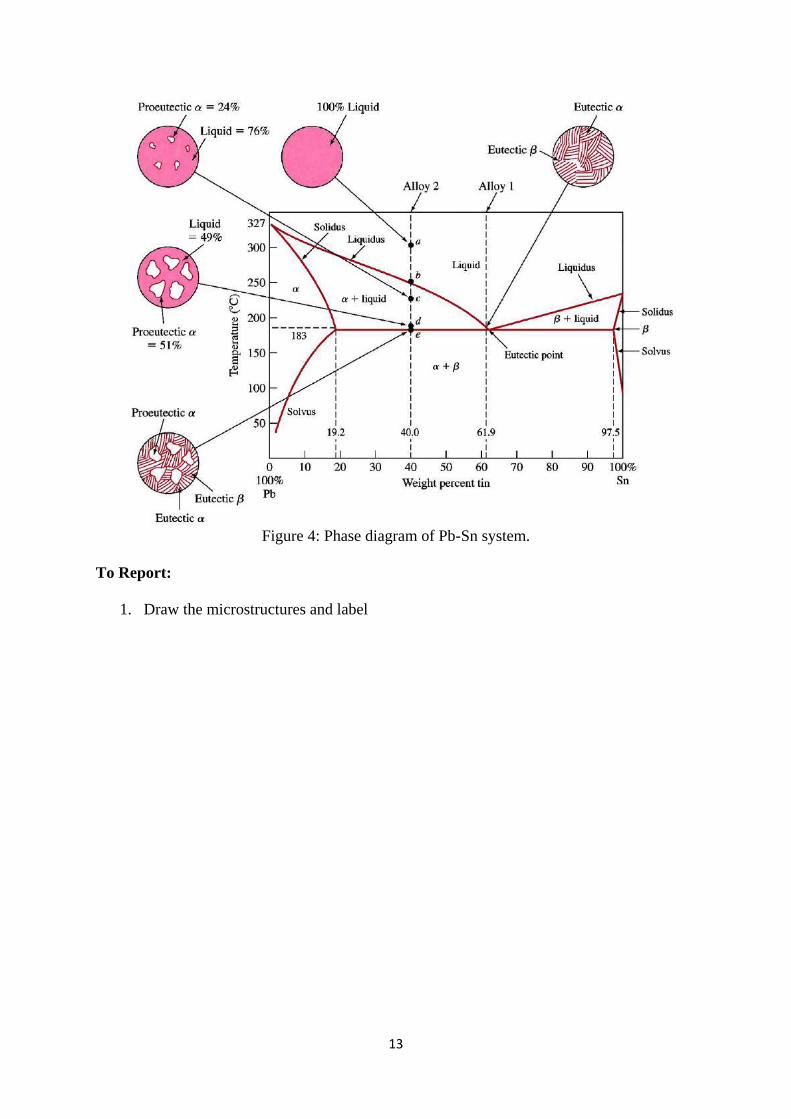
Lead-Tin alloys (Pb-Sn):
This alloy system is important since it finds application as solder material due to low melting
eutectic. The phase diagram of Pb-Sn system is shown in Fig. 4. The word eutectic originates
from a Greek word ‘eutecktos’ meaning ‘easily melted’. These alloys can be easily melted
because the melting temperature of these alloys is lowest in the concerned phase diagram.
Eutectic alloys are used extensively in industries such as automobile, electronic industry. The
classical examples are Pb-Sn, Al-Si, Cu-Zn etc. For a binary alloy, the eutectic reaction is
given by
L during cooling, where L stands for liquid and and are two solid
phases. Hence, two solid phases start to crystallize simultaneously from the liquid phase at
the eutectic temperature. Such a simultaneous crystallization of a eutectic mixture is known
as a eutectic reaction. The temperature at which it takes place is the eutectic temperature, and
the composition and temperature at which it takes place is called the eutectic point. The
eutectic point is an invariant point in the phase diagram because it has zero degrees of
freedom. Therefore, the composition as well as temperature of the eutectic reaction is fixed
for a particular alloy system.
Pb-Sn phase diagram consists of two terminal solid solution ( and ) and a eutectic point at
a composition of 17.8 at% Sn and temperature of 1830C. Alloy compositions to the left of
the eutectic (pure Pb to 17.8) are called hypo-eutectic and alloy compositions to the right of
the eutectic composition (17.8 at% Sn to pure Sn) are known as hyper-eutectic alloys. The
microstructure of the alloys depends on the alloy composition. For a hypo-eutectic alloy, the
microstructure consists of primary -dendrite and eutectic mixture whereas hyper-eutectic
alloys shows primary -dendrite and eutectic mixture.
13
Figure 4: Phase diagram of Pb-Sn system.
To Report:
1. Draw the microstructures and label
14
EXPERIMENT 4
Quantitative Metallography
Objective
1) To analyze the microstructure of a specimen quantitatively.
2) To verify the basic stereological equations Vv=AA=LL=PP.
3) To measure the volume fraction of a phase in a polycrystalline material.
4) The whole process requires proper metallographic sample preparation and use of image
analyzer.
Background:
The quantitative analysis of a microstructure is performed on a two dimensional plane (also
called plane of polish) which is cut through the three dimensional structure of the material.
This technique is known as stereology. The basic measurements which are done in this
technique are grain size measurement and the determination of volume fraction of a phase or
constituent in polycrystalline materials. The following methods are used for this purpose:
Grain size measurement:
1) Jefferies method:
This method involves the counting of number of grains which lie in a rectangular or circular
area marked on the microstructure. The grains, which are partly inside the marked area, are
counted as half. From this, number of grains per unit area (NA) is determined and the grain
diameter is calculated from average grain area (A) using the formula:
d= (A)1/2 = 1/(NA)1/2
The grain size is often computed from an ASTM grain size number as:
N=2n-1
Where n is ASTM number and N is number of grains per square inch at 100X.
2) Mean Intercept length Method:
In this method, the polycrystalline microstructure is superimposed by a grid of parallel lines
and the number of intercepts per unit length (PL) is obtained. The mean intercept length is
given by:
L=1/PL
And the grain size N, is related with L as:
N = - 6.6457 ln L – 3.298 (L in mm)
Volume Fraction Determination:
1) Point Counting Method:
In this method, a set of points is overlaid on a microstructural field and the number of points
contained in the phase of intercept is counted. The PP is calculated by dividing the number of
test points in the phase of intercept by the total number of test points. The average value of

15
PP is equal to the volume fraction (VV).
VV = <PP>
This method is called systematic point counting, when a regular array of points is used and is
called random point counting, when random test points are used.
2) Lineal Analysis:
In this method, the test length of randomly placed lines within the phase of intercept Lα is
calculated and is divided by the total line length (LT)
LL= Lα /LT
And also
VV =< LL >
3) Areal Analysis:
This method involves measurement of the fraction of the area of representative
metallographic planes AA occupied by the phase of intercept. The average value of this area
fraction is equal to the volume fraction.
VV =< AA >
Observations You Need to Make:
Take readings individually for quantification
Counting of changes as you select regions ‘randomly’ (unbiased observation).
Comparing the lineal, areal and volume fraction.
To Report:
1. What do you mean by quantitative measurement?
2. What is stereology?
3. Define volume fraction?
4. How you will calculate grain diameter with the help of Jefferies method?
16
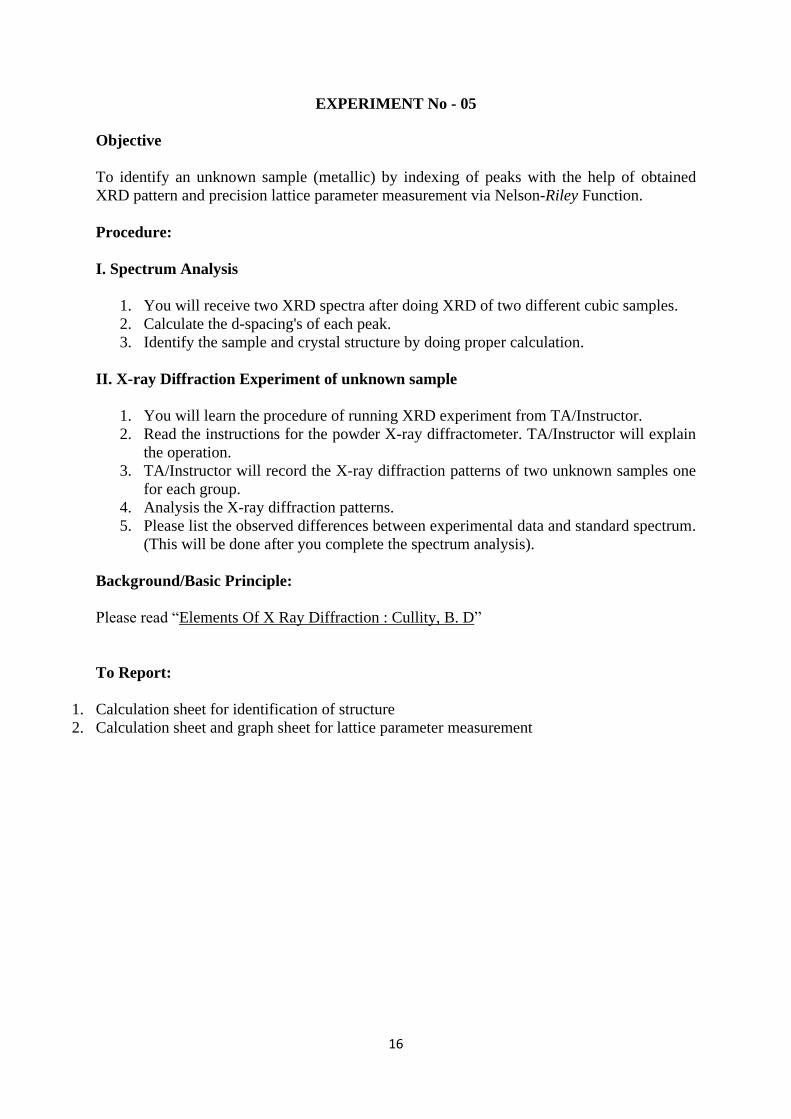
EXPERIMENT No - 05
Objective
To identify an unknown sample (metallic) by indexing of peaks with the help of obtained
XRD pattern and precision lattice parameter measurement via Nelson-Riley Function.
Procedure:
I. Spectrum Analysis
1. You will receive two XRD spectra after doing XRD of two different cubic samples.
2. Calculate the d-spacing's of each peak.
3. Identify the sample and crystal structure by doing proper calculation.
II. X-ray Diffraction Experiment of unknown sample
1. You will learn the procedure of running XRD experiment from TA/Instructor.
2. Read the instructions for the powder X-ray diffractometer. TA/Instructor will explain
the operation.
3. TA/Instructor will record the X-ray diffraction patterns of two unknown samples one
for each group.
4. Analysis the X-ray diffraction patterns.
5. Please list the observed differences between experimental data and standard spectrum.
(This will be done after you complete the spectrum analysis).
Background/Basic Principle:
Please read “Elements Of X Ray Diffraction : Cullity, B. D”
To Report:
1. Calculation sheet for identification of structure
2. Calculation sheet and graph sheet for lattice parameter measurement
17
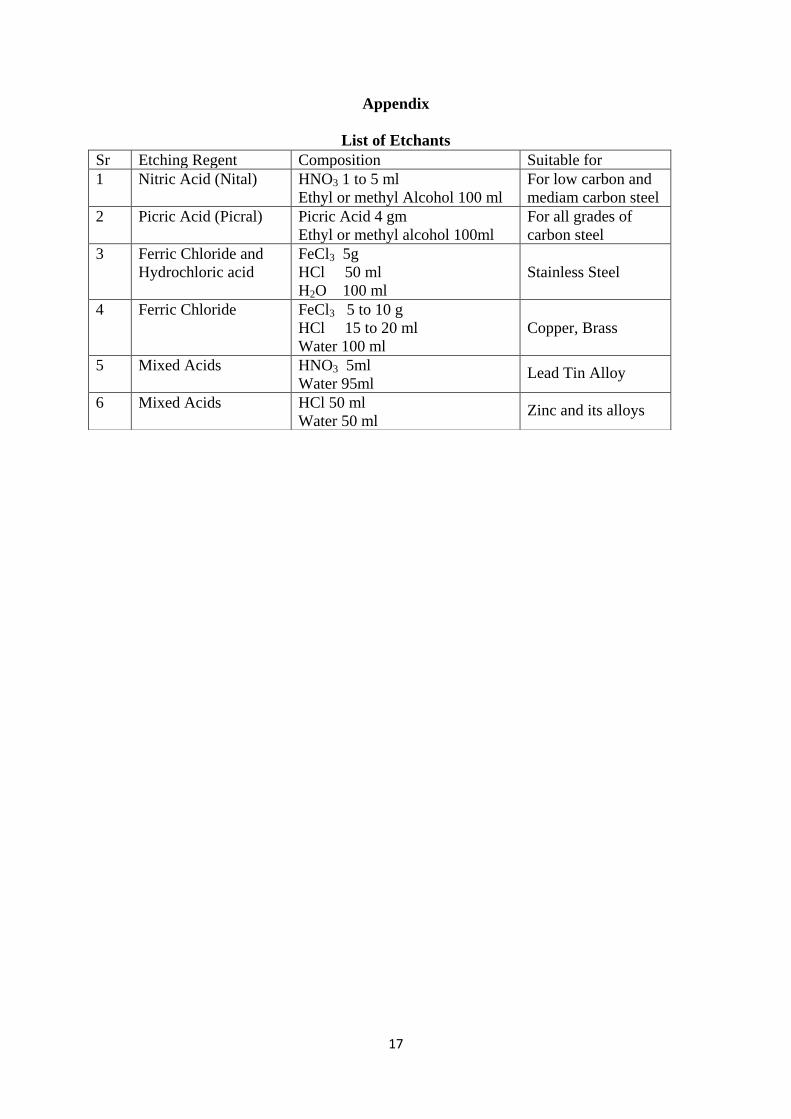
Appendix
List of Etchants
Sr Etching Regent Composition Suitable for
1 Nitric Acid (Nital) HNO3 1 to 5 ml
Ethyl or methyl Alcohol 100 ml
For low carbon and
mediam carbon steel
2 Picric Acid (Picral) Picric Acid 4 gm
Ethyl or methyl alcohol 100ml
For all grades of
carbon steel
3 Ferric Chloride and
Hydrochloric acid
FeCl3 5g
HCl 50 ml
H2O 100 ml
Stainless Steel
4 Ferric Chloride FeCl3 5 to 10 g
HCl 15 to 20 ml
Water 100 ml
Copper, Brass
5 Mixed Acids HNO3 5ml
Water 95ml
Lead Tin Alloy
6 Mixed Acids HCl 50 ml
Water 50 ml
Zinc and its alloys
18
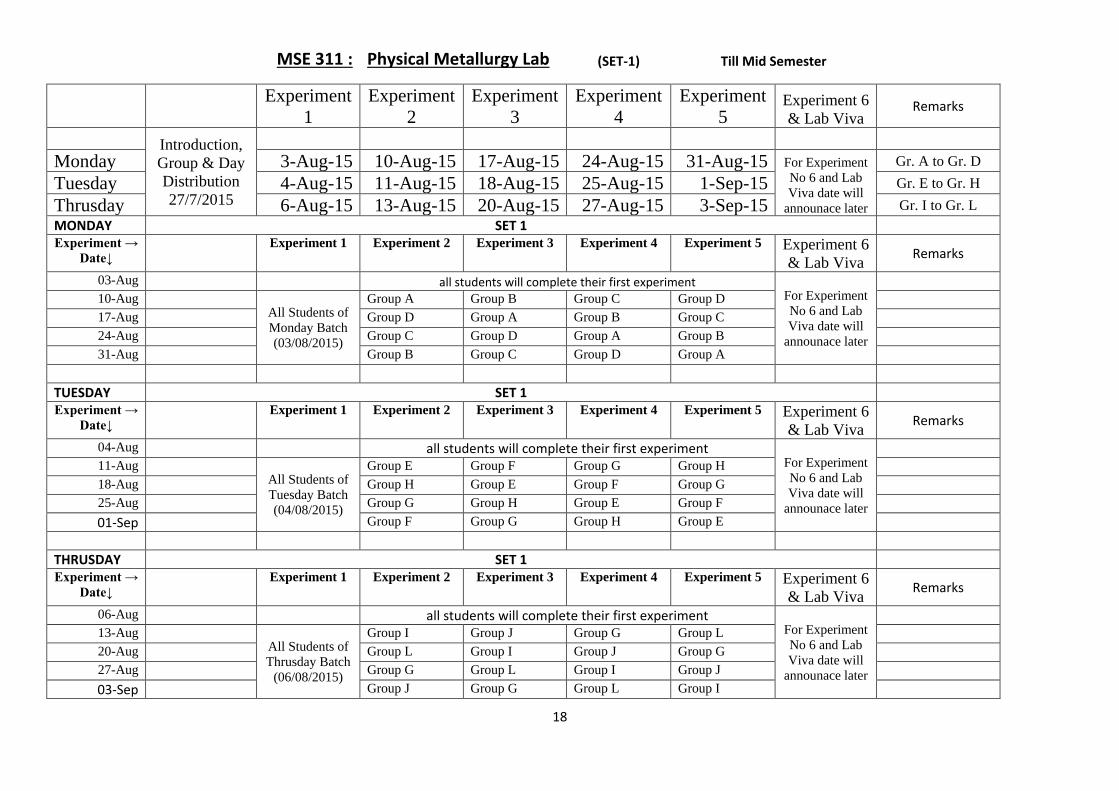
MSE 311 : Physical Metallurgy Lab (SET-1) Till Mid Semester
Experiment
1
Experiment
2
Experiment
3
Experiment
4
Experiment
5 Experiment 6
& Lab Viva Remarks
Introduction,
Group & Day
Distribution
27/7/2015
Monday 3-Aug-15 10-Aug-15 17-Aug-15 24-Aug-15 31-Aug-15 For Experiment
No 6 and Lab
Viva date will
announace later
Gr. A to Gr. D
Tuesday 4-Aug-15 11-Aug-15 18-Aug-15 25-Aug-15 1-Sep-15 Gr. E to Gr. H
Thrusday 6-Aug-15 13-Aug-15 20-Aug-15 27-Aug-15 3-Sep-15 Gr. I to Gr. L
MONDAY SET 1 Experiment →
Date↓
Experiment 1 Experiment 2 Experiment 3 Experiment 4 Experiment 5 Experiment 6
& Lab Viva Remarks
03-Aug all students will complete their first experiment For Experiment
No 6 and Lab
Viva date will
announace later
10-Aug
All Students of
Monday Batch
(03/08/2015)
Group A Group B Group C Group D 17-Aug Group D Group A Group B Group C 24-Aug Group C Group D Group A Group B 31-Aug Group B Group C Group D Group A
TUESDAY SET 1 Experiment →
Date↓
Experiment 1 Experiment 2 Experiment 3 Experiment 4 Experiment 5 Experiment 6
& Lab Viva Remarks
04-Aug all students will complete their first experiment For Experiment
No 6 and Lab
Viva date will
announace later
11-Aug
All Students of
Tuesday Batch
(04/08/2015)
Group E Group F Group G Group H 18-Aug Group H Group E Group F Group G 25-Aug Group G Group H Group E Group F
01-Sep Group F Group G Group H Group E
THRUSDAY SET 1 Experiment →
Date↓
Experiment 1 Experiment 2 Experiment 3 Experiment 4 Experiment 5 Experiment 6
& Lab Viva Remarks
06-Aug all students will complete their first experiment For Experiment
No 6 and Lab
Viva date will
announace later
13-Aug
All Students of
Thrusday Batch
(06/08/2015)
Group I Group J Group G Group L 20-Aug Group L Group I Group J Group G 27-Aug Group G Group L Group I Group J
03-Sep Group J Group G Group L Group I

19