physical interaction by pointing with a mobile device · physical interaction by pointing with a...
TRANSCRIPT

Physical Interaction by Pointing with a Mobile Device
J O H A N P E R S S O N
Master of Science Thesis Stockholm, Sweden 2010
Physical Interaction by Pointing with a Mobile Device
J O H A N P E R S S O N
Master’s Thesis in Computer Science (30 ECTS credits) at the School of Engineering Physics Royal Institute of Technology year 2010 Supervisor at CSC was Alex Olwal Examiner was Lars Kjelldahl TRITA-CSC-E 2010:068 ISRN-KTH/CSC/E--10/068--SE ISSN-1653-5715 Royal Institute of Technology School of Computer Science and Communication KTH CSC SE-100 44 Stockholm, Sweden URL: www.kth.se/csc

Abstract
Today almost all objects and persons around us have somerepresentation on the Internet. This creates a digital worldparallel to the physical world we live in. Recent devel-opment of mobile phone hardware has made new ways ofinteraction that bridge these two worlds possible.
The main goal of this degree project was to investigate howthis bridging could be done, especially when using a GPS-receiver, accelerometer and magnetometer. Other goalswere to determine what applications would benefit fromsuch a way of interaction and if users would prefer it overmore traditional alternatives.
During the project, the idea of pointing at objects of in-terest to interact with them has been taken from idea topart of a fully working application. The application en-ables users to see timetables for public transportation bypointing with the mobile phone towards a stop point.
A novel and patent pending method for determining whatobject the mobile phone is pointing at, was created. Thismethod compensates for errors in position and direction es-timations. It also allows points of interest to have geometricshapes other than points.
Two additional prototypes implementing alternative inter-action techniques were developed. In user evaluations, theseprototypes were compared to the main application to de-termine what interaction technique users prefer.
The conclusion of this degree project is that it is possibleto use interaction by pointing to bridge the physical anddigital worlds. There are problems and limitations whichneed to be handled, but there are also possibilities to createa better user experience.
Referat
Fysisk interaktion genom att peka med enhandhållen enhet
Idag finns nästan alla föremål och personer omkring oss rep-resenterade på Internet, vilket skapar en digital värld paral-lell till den fysisk värld vi lever i. Senaste tidens utvecklingav mobiltelefonernas hårdvara har möjliggjort nya sätt attinteragera på som kopplar samman dessa två världar.
Det huvudsakliga målet för det här examensarbetet var attutreda hur en sådan sammankoppling kan göras, särskiltmed hjälp av en GPS-mottagare, accelerometer och mag-netometer. Andra mål var att utröna vilken typ av app-likationer som skulle vinna på ett sådant interaktionssättoch om användare skulle föredra det över mer traditionellaalternativ.
Under examensarbetet har idén om att interagera med ob-jekt genom att peka på dem tagits från idé till att vara endel av en fullt fungerande applikation. Applikationen låteranvändare ta del av tidtabeller för kollektivtrafik genom attpeka med mobiltelefonen på en hållplats.
En ny och patentsökt metod för att beräkna vad mobiltele-fonen pekar på togs fram. Metoden kompenserar för fel ipositions- och riktningsuppskattningarna. Den tillåter ock-så att intressepunkter representeras av geometriska figureroch inte enbart av punkter.
Ytterligare två prototyper som använder alternativa inter-aktionstekniker utvecklades. Dessa prototyper jämfördes medhuvudapplikationen under användningstester för att utrönavilken interaktionsteknik som användare föredrar.
Slutsatsen av det här examensarbetet är att det, med hjälpav interaktion genom att peka, är möjligt att överbryggaklyftan mellan den fysiska och digitala världen. Det finnsproblem och begränsningar som behöver hanteras, men ock-så möjligheter till att skapa en bättre användarupplevelse.

Contents
1 Introduction 11.1 Background . . . . . . . . . . . . . . . . . . . . . . . . . . . . . . . . 11.2 Problem Definition . . . . . . . . . . . . . . . . . . . . . . . . . . . . 21.3 Goals . . . . . . . . . . . . . . . . . . . . . . . . . . . . . . . . . . . 31.4 Limitations . . . . . . . . . . . . . . . . . . . . . . . . . . . . . . . . 31.5 Report Summary . . . . . . . . . . . . . . . . . . . . . . . . . . . . . 41.6 Chapter Overview . . . . . . . . . . . . . . . . . . . . . . . . . . . . 5
2 Research Overview 72.1 Interaction Paradigms . . . . . . . . . . . . . . . . . . . . . . . . . . 7
2.1.1 Touching . . . . . . . . . . . . . . . . . . . . . . . . . . . . . 72.1.2 Pointing . . . . . . . . . . . . . . . . . . . . . . . . . . . . . . 82.1.3 Scanning . . . . . . . . . . . . . . . . . . . . . . . . . . . . . 8
2.2 Sensors . . . . . . . . . . . . . . . . . . . . . . . . . . . . . . . . . . 82.2.1 Accelerometer . . . . . . . . . . . . . . . . . . . . . . . . . . . 82.2.2 Computer Vision . . . . . . . . . . . . . . . . . . . . . . . . . 92.2.3 GPS . . . . . . . . . . . . . . . . . . . . . . . . . . . . . . . . 112.2.4 IR-light . . . . . . . . . . . . . . . . . . . . . . . . . . . . . . 122.2.5 Magnetometer . . . . . . . . . . . . . . . . . . . . . . . . . . 122.2.6 RFID . . . . . . . . . . . . . . . . . . . . . . . . . . . . . . . 13
2.3 Related Work . . . . . . . . . . . . . . . . . . . . . . . . . . . . . . . 142.3.1 Spatially Aware Handhelds . . . . . . . . . . . . . . . . . . . 142.3.2 Mobile Augmented Reality . . . . . . . . . . . . . . . . . . . 152.3.3 Geo-Wands . . . . . . . . . . . . . . . . . . . . . . . . . . . . 16
3 Interaction Prototype 193.1 Interaction Choices . . . . . . . . . . . . . . . . . . . . . . . . . . . . 193.2 Prototype Requirements . . . . . . . . . . . . . . . . . . . . . . . . . 203.3 Intersection Calculations . . . . . . . . . . . . . . . . . . . . . . . . . 20
3.3.1 Ray Tracing . . . . . . . . . . . . . . . . . . . . . . . . . . . . 203.3.2 Barycentric Coordinates . . . . . . . . . . . . . . . . . . . . . 213.3.3 Ray-Triangle Combination . . . . . . . . . . . . . . . . . . . . 233.3.4 Monte Carlo Sampling - an Alternative Method . . . . . . . . 24
3.4 Implementation . . . . . . . . . . . . . . . . . . . . . . . . . . . . . . 253.5 Prototype Results . . . . . . . . . . . . . . . . . . . . . . . . . . . . 26
4 Application Prototype 294.1 Concept Development . . . . . . . . . . . . . . . . . . . . . . . . . . 29
4.1.1 Hypothesis . . . . . . . . . . . . . . . . . . . . . . . . . . . . 294.1.2 Four Concept Candidates . . . . . . . . . . . . . . . . . . . . 304.1.3 Final Concept . . . . . . . . . . . . . . . . . . . . . . . . . . . 31
4.2 Resulting Application - Time2Go . . . . . . . . . . . . . . . . . . . . 324.2.1 Welcome Screen . . . . . . . . . . . . . . . . . . . . . . . . . 324.2.2 Bus Data . . . . . . . . . . . . . . . . . . . . . . . . . . . . . 324.2.3 Interacting . . . . . . . . . . . . . . . . . . . . . . . . . . . . 334.2.4 Result View . . . . . . . . . . . . . . . . . . . . . . . . . . . . 344.2.5 Detailed View . . . . . . . . . . . . . . . . . . . . . . . . . . . 35
4.3 Design Decisions . . . . . . . . . . . . . . . . . . . . . . . . . . . . . 354.3.1 The Map . . . . . . . . . . . . . . . . . . . . . . . . . . . . . 364.3.2 Precision . . . . . . . . . . . . . . . . . . . . . . . . . . . . . 374.3.3 Interaction Trigger . . . . . . . . . . . . . . . . . . . . . . . . 374.3.4 List of Results . . . . . . . . . . . . . . . . . . . . . . . . . . 374.3.5 Detailed View . . . . . . . . . . . . . . . . . . . . . . . . . . . 38
4.4 User Evaluation . . . . . . . . . . . . . . . . . . . . . . . . . . . . . . 384.4.1 Alternative Applications . . . . . . . . . . . . . . . . . . . . . 394.4.2 The Uppsala Test . . . . . . . . . . . . . . . . . . . . . . . . 414.4.3 Heuristic Expert Evaluation . . . . . . . . . . . . . . . . . . . 424.4.4 The KTH Test . . . . . . . . . . . . . . . . . . . . . . . . . . 424.4.5 Results of the User Evaluations . . . . . . . . . . . . . . . . . 44
5 Conclusions, Discussion and Future Work 475.1 Conclusions . . . . . . . . . . . . . . . . . . . . . . . . . . . . . . . . 47
5.1.1 Interaction Conclusions . . . . . . . . . . . . . . . . . . . . . 475.1.2 Conclusions About the Hypothesis . . . . . . . . . . . . . . . 495.1.3 Concept Conclusions . . . . . . . . . . . . . . . . . . . . . . . 49
5.2 Discussion . . . . . . . . . . . . . . . . . . . . . . . . . . . . . . . . . 505.2.1 Interaction Prototype . . . . . . . . . . . . . . . . . . . . . . 505.2.2 Concept Development . . . . . . . . . . . . . . . . . . . . . . 515.2.3 User Evaluation . . . . . . . . . . . . . . . . . . . . . . . . . 52
5.3 Future Work . . . . . . . . . . . . . . . . . . . . . . . . . . . . . . . 525.3.1 Error Prediction for Sensors . . . . . . . . . . . . . . . . . . . 525.3.2 Evaluation of the Hypothesis . . . . . . . . . . . . . . . . . . 525.3.3 Other Concepts . . . . . . . . . . . . . . . . . . . . . . . . . . 535.3.4 Radar2Go and Touch2Go Combined . . . . . . . . . . . . . . 535.3.5 Extend Time2Go . . . . . . . . . . . . . . . . . . . . . . . . . 535.3.6 Interaction Paradigms in an Outdoor Environment . . . . . . 545.3.7 Pointing as a Complementary Interaction Technique . . . . . 54

Bibliography 55
Appendices 59
A Business Models 61

Chapter 1
Introduction
This chapter starts by introducing the reader to the problem and its backgroundand limitations. Thereafter a résumé of the whole report can be found in theReport Summary section. This section can be read to gain an overview of the workperformed in this degree project and its most important results and conclusions,without reading the whole report. The Chapter Overview section outlines the restof the chapters in the report.
1.1 Background
The development of the Internet has introduced a new and digital world, parallel toour own physical one. People publish personal homepages, create Facebook profiles,enter information about famous places in Wikipedia and almost every companyand product has its own website. Since much of the content on the Internet has aconnection to real world objects, researchers started to investigate how to bridgethese two worlds to let users access digital information about physical objects intheir vicinity by interacting directly with them, instead of having to enter textinto a web browser. Once limited to purpose built research prototypes, recentdevelopment of mobile phone hardware has turned mobile phones into enablers ofthis sort of bridging, making it possible to introduce it to consumers.
Ericsson Research is, within its service layer research area, doing research on tech-nologies, solutions and enablers for next generation of end-user services. One ex-ample of research within this area is location based map services, which are servicesaimed at helping users find information about specific geographic locations. Thisset of services was born when it became possible to geographically locate mobilephones through the use of cell tower triangulation, and let applications provideusers with information and services relevant to their geographical position. Today,
1
CHAPTER 1. INTRODUCTION
the latest generations of mobile phones include GPS-receivers, magnetometers andaccelerometers. These additional sensors enable applications to recover both theposition of the user and the direction in which he or she is holding their phone,making it possible to create so called spatially aware mobile services. This degreeproject sprang from the introduction of these new sensors, as Ericsson Researchwanted to know what could be achieved by combining them and what possible newapplications such a combination could enable.
Parallel to the work described in this report, another degree project on the samesubject was performed by Josefin Löfström. The two projects were performed inconjunction at Ericsson Research. To distinguish the two degree projects, the onedescribed by this report was more focused on techincal aspects while the projectperformed by Löfström was more focused on human-computer interaction aspects.Löfström’s work can be found in [13]. Both projects were supervised by RichardCarlsson and Hjalmar Olsson at Ericsson Research.
1.2 Problem Definition
The mobile phone is one of the most ubiquitous devices available today, with almostevery one of us carrying one around in our pocket. With the integration of newsensors, the mobile phone also becomes increasingly aware of its surrounding, mak-ing it a superb platform for bridging the physical and digital world. While manyof these sensors have been available for a long time to both users and researchers,it is only recently that they have become an integrated part of mobile phones andthus start to become widespread.
The introduction of these new sensors has opened up new areas of possible applica-tions and ways of interaction. The problem that companies like Ericsson now faceis how to utilize them in order to bring new experiences to their consumers. Thisincludes to look at
• what conclusions, design guidelines and results researchers have reached
• how technical problems can be solved
• what the limitations are
• what applications benefit from the new ways of interaction
• what the users’ preferences are.
2
1.3. GOALS
1.3 Goals
The goal of this master degree project is to investigate how digital and physicalreality can be bridged by using a mobile phone equipped with different sensors.In particular, the combination of a GPS-receiver, magnetometer and accelerometerwill be focused upon; as these are sensors found in the latest generation of mobilephones and can in conjunction provide spatially aware mobile services. EricssonResearch is not only looking to gain insight into how this bridging can be done, butalso what opportunities these new sensors present in terms of possible new services.To be specific, this degree project will try to provide the answer to the followingquestions:
• What research has been done in the field of mobile spatial interaction?
• How can this interaction be implemented on an off-the-shelf mobile phone?
• What applications benefit from this type of interaction?
• Is it useful to interact in this manner, or do users prefer more traditional waysof interacting?
1.4 Limitations
In order to prevent the project from becoming too broad to be viable, restrictionswere needed. Focusing on mobile phones restricts it in some ways, but the numberof possible scenarios where a mobile phone could be used to bridge physical anddigital is still high. Pointing your phone in the direction of your music player couldfor example present you with a list of your digital music archive, and after selectinga track you could point towards the speakers in the kitchen to enjoy some musicwhile cooking. Or a factory worker could look at a machine through the camera feedof his phone to see operational information such as current temperature, forces, etc.in connection to certain parts of the machine. These are two very different scenariosthat have different requirements in terms of sensors and user requirements, amongother things.
In order to narrow down the number of possible scenarios, Ericsson added morerestrictions to the project. The end result was to contain some sort of map, andwe were to specifically investigate the combination of GPS, magnetometer and ac-celerometer. The reason for the first restriction was that Ericsson Research wasdeveloping a map API for mobile phones and wanted an application that demon-strates their API in use. The second restriction was due to the fact that Ericssonhad specific interests in researching this pointing type of interaction using the above
3
CHAPTER 1. INTRODUCTION
mentioned sensors and wanted to investigate if they could be used to enable newend-user services.
1.5 Report Summary
This section describes the main work performed during the degree project andprovides a summary of the most important results and conclusions. It can be readto avoid reading the whole report while still gaining an insight into the key partsof the project, or as an introductory overview before reading the rest of the report.For more details, discussions and motivations, please read the whole report.
Work Performed
In this degree project, we have taken an interaction concept from idea throughprototypes to a working mobile application. An interaction prototype was created inorder to test how well interaction by pointing with the mobile phone in hand worked.In order to determine what the user was pointing at, three different techniques forcalculating intersection were created and tested in the prototype. This prototypeformed the basis for later applications and concepts.
The brainstorming resulted in a hypothesis of what situations would benefit frominteraction by pointing. Through focus groups, more information was collected onwhen potential users would find themselves in situations such as the one describedin the hypothesis. Four concepts on a final application were developed from thisinformation, and one of the concepts was chosen to be developed further.
From this final concept, a fully functional application was built, which enablesusers to point at a bus stop to see timetables. The application works with anymobile phone that runs the Android mobile phone operating system and has abuilt-in GPS-receiver, magnetometer and accelerometer. Timetables and bus stopdata were provided by Upplands Länstrafik, UL, and the application downloadedthis information interactively when needed. This currently limits the use of theapplication to areas where there is public transportation operated by UL.
In the end, user evaluations were performed using the final application and two ad-ditional applications. The two additional applications were created for comparisonand featured different ways of interacting. Users described the final application asfun, quick and intuitive to use when in sight of the bus stop they wanted to interactwith, but seemed to prefer the other two applications when this was not the case.
4

1.6. CHAPTER OVERVIEW
Result Summary
Our work mainly resulted in three different things: three different ways of calcu-lating intersections; a hypothesis of scenarios where interaction by pointing witha mobile device in hand to select an object is useful; and a fully functional mo-bile phone application. The three ways of calculating intersections are simple yetseemed to perform sufficiently well if the requirements on precision were not toohigh. The user evaluations conducted did not contradict the hypothesis, but moretesting is needed before more certain conclusions can be drawn. Participants of theuser evaluation also liked the developed mobile phone application when used in theintended scenario, but since this scenario is narrow, many participants requestedadditional functionality to support more use cases.
Conclusion Summary
The conclusion which can be drawn from the work performed is that it is possi-ble to bridge the physical and virtual world using an off-the-shelf mobile phonewith GPS-receiver, magnetometer and accelerometer. These sensors are not veryaccurate, which is something that developers need to account for when designingapplications. Applications that seem to benefit from the pointing type of interactionexplored during this work are applications that are used in scenarios where usersfind themselves in need of information they associate with a certain object and atthe same time find themselves within sight of this object. Note however that moreresearch is needed to be able to really conclude this. For scenarios other than theone described, users seemed to prefer other ways of interacting.
1.6 Chapter Overview
This section describes the disposition of the rest of this report.
2. Research Overview
This chapter provides an overview of relevant research, in order to help the readerto understand and judge the work performed during the degree project. The readerwill be introduced to interaction paradigms, interesting sensors and related work.This will form the theoretical foundation of the rest of the work.
5
CHAPTER 1. INTRODUCTION
3. Interaction Prototype
This chapter describes the prototype that was created in order to test the technicalaspects of interacting by pointing. First some design decisions and requirements arepresented, followed by a description of four methods to calculate what the user waspointing at. In the end of the chapter, the results of the prototype can be found.
4. Application Prototype
After the interaction prototype was created, the work continued with the creationof an application prototype. Chapter 4 provides the details of the process to createthis application prototype. The concept creation phase is described, followed by awalkthrough of the resulting application. Some of the design decisions are discussed,giving insight to why the application ended up looking as it does. Finally, the userevaluations performed are presented along with their results.
5. Conclusions, Discussion and Future Work
In the final chapter, conclusions are drawn about the work performed and the resultobtained. Some of the details of the project are discussed in greater detail. Possibletopics for other researchers to look into are presented in the Future Work sectionof the chapter.
6
Chapter 2
Research Overview
This chapter introduces the reader to research related to the work performed duringthe degree project. Common interaction paradigms are introduced and an overviewof relevant sensors used in mobile phones today is presented. Finally, related workperformed by other researchers is reviewed.
2.1 Interaction Paradigms
In [33], Välkkynen et al. present three different paradigms for physical mobileinteraction: touching, pointing and scanning. This section presents these paradigmsalong with the findings about them in Rukzio et al. in [24].
2.1.1 Touching
When using the touching paradigm, users physically touch their mobile device toobjects they wish to interact with. Some sensor is used to register when the useris touching their device to or holding it close to an object that has the ability tointeract. According to Rukzio et al. [24] it is seen as “an error resistant, verysecure, very quick, intuitive and non-ambiguous selection process which can requirephysical effort” but it requires the user to be close enough to touch the object he orshe is interested in interacting with. If this is not the case, Rukzio et al. state thatthe benefits of using touch interaction need to be large enough to motivate the userto walk over to the object of interest.
7

CHAPTER 2. RESEARCH OVERVIEW
2.1.2 Pointing
Pointing is a natural human gesture, often used in everyday life to indicate thingsand point out what we mean. The idea of the pointing paradigm is to enable usersto do the same with their mobile devices. When the user points the device towardsthe object that he or she wants to interact with, the device determines what objectthe user meant and executes a certain task or display the intended information.Rukzio et al. in [24] describe the pointing paradigm as “an intuitive and quicktechnique” which “makes most sense because it combines intuitive interaction withless physical effort” but “requires some cognitive effort to point at the smart deviceand needs line of sight”.
2.1.3 Scanning
When using the scanning paradigm, the user is presented with a list of all objectsin the vicinity that he or she can interact with. The user’s mobile device scans thesurroundings for objects and the user interact with an object by selecting it in a liston the device itself. Rukzio et al. state that “scanning is seen as a very technicalinteraction technique which is more complex to use because of its indirectness” [24].The conclusions of their user studies were also that users try to avoid scanning ifpossible and use the other two paradigms if there is a line of sight to the object ofinterest.
2.2 Sensors
This section provides a technical overview of different sensors commonly used inresearch to create a link between the digital and physical world using mobile phones.The idea is to give the reader insight into what sort of information they can provide,how they are being used in research applications and what their strengths andweaknesses are.
2.2.1 Accelerometer
Perhaps the most popular use of accelerometers is in gesture recognition, where theaccelerometer measures the relative motion of a device. An example of this sortof use is Nintendo’s Wii gaming platform, where the controllers have integratedaccelerometers which, in combination with other techniques, are used to recognizeusers’ movement. Another use of the accelerometer is to find out the orientation of adevice. The accelerometer will in addition to sensing relative movements also sense
8
2.2. SENSORS
the gravity field of the earth and can thus provide a cue to the current orientationof the device relative to the earth’s surface.
Cameras and mobile phones also increasingly contain accelerometers, where theyare used to measure if a user is using the device in landscape, portrait or horizontalmode. The device can then adapt the content of the screen to the way the user isholding the device. The ability to measure the gravity field of the earth can be usedto improve the bearing reported by a magnetometer [5]. Another use is to sense thetilt of the device. In [23] for example, users could tilt a mobile device to indicate apoint of interest. The amount of tilt corresponded to how far away from the userthe point was.
One of the problems with using an accelerometer is that it measures relative motion.This might lead to drifting problems if one performs consecutive measurements tokeep track of movement. Also, if the user for example is travelling in a car or iswalking while trying to perform some gesture that an application is normally ableto understand, the added relative motion of the car or walking might make theapplication unable to recognize the gesture.
2.2.2 Computer Vision
Today most mobile phones include digital cameras and the quality is ever increasing.As the processing power of the mobile phones increase, new uses of the integratedcamera begin to see the day and nowadays the camera is not only used to takepictures for keeping.
Barcodes and Fiducial Markers
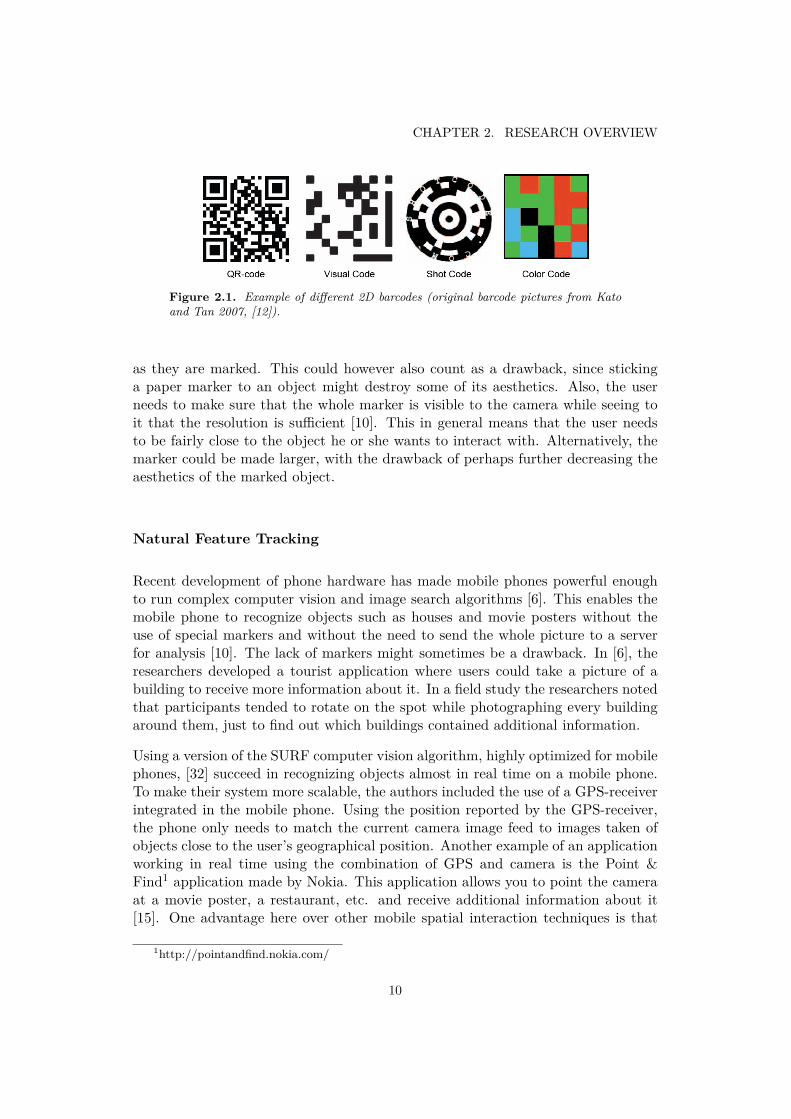
This technique is used in augmented reality and sensor-fusion applications to recog-nize objects by putting some sort of identifying marker on them. Image recognitionalgorithms are used to recognize the markers and their location and orientationrelative to the camera [21]. Applications can then react to this information, forexample by displaying a 3D-model hovering over the marker or by displaying in-formative text about the object that hosts the marker. Several different types ofmarkers and codes exist, with different appearances and attributes. Figure 2.1 showexample of such codes. For a more thorough review of different 2D barcodes andfiducial markers, see for example Kato and Tan’s work in [12].
The main advantages of these markers are that they are relatively easy to recognizeusing algorithms that do not require a lot of processing power, they are cheap toproduce and can be put on almost any object that is big enough to house the marker.Another advantage is that the user knows which objects he or she can interact with,
9
CHAPTER 2. RESEARCH OVERVIEW
Figure 2.1. Example of different 2D barcodes (original barcode pictures from Katoand Tan 2007, [12]).
as they are marked. This could however also count as a drawback, since stickinga paper marker to an object might destroy some of its aesthetics. Also, the userneeds to make sure that the whole marker is visible to the camera while seeing toit that the resolution is sufficient [10]. This in general means that the user needsto be fairly close to the object he or she wants to interact with. Alternatively, themarker could be made larger, with the drawback of perhaps further decreasing theaesthetics of the marked object.
Natural Feature Tracking
Recent development of phone hardware has made mobile phones powerful enoughto run complex computer vision and image search algorithms [6]. This enables themobile phone to recognize objects such as houses and movie posters without theuse of special markers and without the need to send the whole picture to a serverfor analysis [10]. The lack of markers might sometimes be a drawback. In [6], theresearchers developed a tourist application where users could take a picture of abuilding to receive more information about it. In a field study the researchers notedthat participants tended to rotate on the spot while photographing every buildingaround them, just to find out which buildings contained additional information.
Using a version of the SURF computer vision algorithm, highly optimized for mobilephones, [32] succeed in recognizing objects almost in real time on a mobile phone.To make their system more scalable, the authors included the use of a GPS-receiverintegrated in the mobile phone. Using the position reported by the GPS-receiver,the phone only needs to match the current camera image feed to images taken ofobjects close to the user’s geographical position. Another example of an applicationworking in real time using the combination of GPS and camera is the Point &Find1 application made by Nokia. This application allows you to point the cameraat a movie poster, a restaurant, etc. and receive additional information about it[15]. One advantage here over other mobile spatial interaction techniques is that
1http://pointandfind.nokia.com/
10

2.2. SENSORS
the uncertainty of the GPS does not affect the performance of the application a lot,as the GPS-position is only used to narrow down the set of possible matches.
Computer vision can also be used to simulate other type of sensors. Wang etal. in [36] and Adams et al. in [1] used the camera of a mobile phone togetherwith a computer vision algorithm to achieve functionality similar to that of anaccelerometer. Another possibility could perhaps be to match a photo from a cameraphone with a database with position tagged photos to simulate GPS functionality.If the image from the phone matches some image in the database, the position ofthe camera could be calculated.
2.2.3 GPS
GPS, or Global Positioning System, is a system commonly used to estimate thegeographical position of a device equipped with a GPS-receiver. This sensor is usedto provide an application with awareness of the geographical location of where it isbeing used. Increasingly popular are so called location based services, LBS, whichprovide the user with data or services relevant in the current location. Possibleapplications could be to provide the user with information about sales in the imme-diate surroundings, or to let the user view Twitter status updates her friends madefrom the surroundings.
The main advantage of GPS is that it in general provides higher accuracy thanother positioning methods available to mobile phones. Cell tower positioning canprovide a general estimation of the user’s position, but the accuracy depends onthe amount of cell towers that the mobile phone is connected to and the distancebetween these cell towers. Other positioning methods exist, for example throughthe use of wifi access points [25], but these methods are not generally available andare not commonly used.
Even thought the accuracy of the GPS position is usually better than the oneobtained through for example cell tower triangulation, it depends a lot on the sur-roundings. In [27], the authors test the accuracy of the GPS in a few different typesof urban outdoor environment. According to these tests, the position estimationerror varied from under 10 meters in low-density urban environment2 to at least 30to 40 meters in urban environment3. Such errors can prove to be problematic toapplications that are in need of good accuracy, as they are hard to predict and tomeasure in real time. Also, the HDOP-value commonly reported by GPS-receivers,which is supposed to indicate the quality of the GPS signal, prove not to be a goodmeasurement of the error in the estimated position [27].
2Classified as environments with a large percentage of clear sky, such as city areas with lowbuildings (2-3 floor) or city areas with higher buildings but with broad streets in between them.
3Classified as environments with a low percentage of clear sky, such as city areas with higherbuildings (up to 6 floors) and narrow streets or alleyways.
11
CHAPTER 2. RESEARCH OVERVIEW
Another big drawback of GPS is that it does not work indoors. Research effort isbeing put into developing positioning systems for use indoors as well. Nokia, forexample, is trialling an indoor positioning system[16] using wifi access points[14] toestimate users locations in a shopping centre in Helsinki.
2.2.4 IR-light
IR-light, or infrared light, is electromagnetic radiation with a wavelength betweenapproximately 750 nm and 100 µm and is invisible to the human eye. Perhapsthe most well known use of IR is the remote control, where an IR LED is used tosend instructions to some device. IR-light has also been used as a way of send-ing information to and from computers and mobile phones. One of the problemswith IR light is that a clear line of sight is needed between the two devices thatare to be connected. Perhaps it is due to this limitation that techniques like wifiand Bluetooth seem more popular today when it comes to communication betweendevices.
Nevertheless, IR-light has been used in some interesting sensor-fusion applications.[31], [2] and [34] all used IR-light to implement applications where users could pointat an object with an IR-equipped mobile phone or hand held computer, to establisha connection. The IR light hits an IR-sensitive marker of some sort and a connectionis established through IR, wifi or Bluetooth.
Apart from needing a clear line of sight, another downside of using IR-light to targetobjects is the need to attach an IR-beacon to all objects that should be possible totarget. This beacon might affect the looks of a device in the same manner as thefiducial markers mentioned in the section about digital cameras. In addition, theyalso need to be fed with power, which might not always be convenient.
2.2.5 Magnetometer
Magnetometers measure the magnetic field of the earth and can be used to calculatein which direction relative to the North Pole a device is pointing. In general, justknowing in what direction a user is looking, without knowing the location, mightnot be that useful. But coupled with a GPS-receiver, the magnetometer can enabledevices to display information relevant to where the user is looking or enable usersto point out an object in front of them to interact with in some manner. Earlyvisions of applications that use such a combination were provided by Egenhofer in[7]. For example he envisioned a Geo-Wand, which could be used to receive moreinformation about objects in the environment around simply by pointing. Anotherof Egenhofer’s visions was Smart Horizons. Smart Horizons were applications thatwould allow users to see enhanced versions of their current horizon, letting them for
12
2.2. SENSORS
example see additional information such as approaching weather fronts or enablingsailors to find landing with a road close by.
As mentioned in section 2.2.1, the addition of an accelerometer can enhance theperformance of the magnetometer [5]. In [29], the authors test the performanceof a magnetometer-accelerometer combination. When the sensor is stationary andundisturbed (i.e. the device was placed on a stationary item), a standard deviationof 0.67◦ was observed, and when users were asked to, while stationary, point attargets at different distances, the standard deviation was a little more than 2◦.The explanation to why this last value is higher is probably that users are notable to hold the device perfectly still, thus introducing errors in the accelerometersestimation of the orientation of the device relative to the earth. While 2◦ might notseem too grave, the deviation quickly becomes much larger if the user is moving,reaching almost 10◦ when users walk slowly and more than 27◦ when users walk fast.The authors of [29] propose that it might be possible to reduce the deviation whenwalking by using appropriate filtering of the accelerometer data to compensate forthe disturbance introduced by the steps.
There are not many alternatives to magnetometers available to mobile phones asof today. In fact, magnetometers seem to just have begun appearing as integratedparts in mobile phones, opening up new possibilities of interaction. Today, the onlyalternative available for finding out where a user is looking is the use of computervision algorithms as mentioned in section about digital cameras. These algorithmscould provide additional information such as exactly what object the user is lookingat, but in turn they are harder to implement and require more computational power.
2.2.6 RFID
Radio-Frequency Identification, RFID, is another tag-based technique to identifyobjects. A RFID-reader is used to read the contents of RFID-tags, which can bepassive or active [2]. Active tags incorporate some sort of power source and con-stantly emit the content of the tag, which can then be read by the RFID-reader.Passive tags on the other hand require no power source, instead power is trans-mitted to the tag from the reader using induction. When enough power has beentransmitted, the tag in turn transmits its content. The RFID-reader can typicallyread the contents of the tag from several tens of centimeters away down to a distanceof a few millimeters [2].
Even though techniques exist to extend the operation range of RFID [4], when itcomes to mobile phone interaction RFID is usually used in situations where the useris close enough to touch what he or she wants to interact with. One advantage withRFID-tags is that they do not need to be visible and can thus be embedded intodifferent objects. In [37] and [19] for example, the authors demonstrated prototypes
13
CHAPTER 2. RESEARCH OVERVIEW
which could be used to read RFID-tags hidden in the bindings of a book or in abusiness card. Linked to the tags was additional information, such as the latestversion of a technical manual or a webpage.
2.3 Related Work
Section 2.2 provided a per sensor overview of technical aspects and previous workrelated to each sensor. This section will instead give you an insight into what is beingdone in the area of mobile spatial interaction, where the GPS-position is coupledwith some technique to find out the orientation of the user. The joint information isthen used to provide the user with direction and position specific information. Themost common combination of sensors is GPS, accelerometer and magnetometer,although there are solutions that utilize a combination of GPS, digital camera andcomputer vision to achieve similar effects.
2.3.1 Spatially Aware Handhelds
Spatially aware handheld is a term used for mobile devices that are able to sensetheir position and orientation relative to the environment in which the device isbeing used. The device is “aware” of its surroundings. The area of spatially awarehandhelds was pioneered by Fitzmaurice [8] and Rekimoto et al. [22] in the be-ginning of the 1990’s. Fitzmaurice developed a proof-of-concept prototype calledChameleon. This prototype used a small handheld display which was attached toa camera filming a computer screen. The handheld display was tracked using a sixdegree of freedom tracking device and the content of the screen changed accordingto the orientation and position of the screen itself. Fitzmaurice also envisioned var-ious applications, such as a computer-augmented paper map. The spatially awarehandheld would let users view more detailed digital maps of an area by directingthe handheld to the area of interest on the paper map.
Rekimoto et al. developed the NaviCam prototype, which was based on a hand-held screen with a camera attached to its back. The screen display the feed of thecamera, annotated with additional information. Computer vision algorithms con-tinuously checked the camera feed for special markers which were attached to realworld objects. The markers were associated with information in a database andwhen a marker was recognized, the related information was displayed on the imagein connection to the object. By this recognition, the handheld device became awareof its surroundings. Rekimoto et al. demonstrated applications that displayed addi-tional information in connection to famous paintings or a video messages recordedby the occupier of an office when the camera was pointed at the painting or officedoor.
14
2.3. RELATED WORK
Today the area of spatially aware handhelds has grown and researchers do not onlylook at how additional information can be displayed about real world objects. Newresearch include for example how spatially aware handhelds can be used to manip-ulate and interact with information spaces [38] or how they can be used in collabo-rative environments [17]. Researchers have demonstrated a variety of applications,ranging from handheld devices that are aware of where above an interactive tablethey are being held to handheld devices that are aware of where they are relativeto the surface of the earth. The next two sections will in more detail describe twoareas of spatially aware handhelds that are related to the work performed duringthis degree project.
2.3.2 Mobile Augmented Reality
One of the areas of research that sprang from Fitzmaurice and Rekimoto et al.’swork is the area of mobile Augmented Reality, mobile AR. Augmented reality refersto augmenting our own reality with digital information or artefacts. By Azuma’sdefinition of augmented reality in [3], an AR-system needs to combine real andvirtual interactively in real time with registration in three dimensions. Registrationin three dimensions means that the information or artefact needs to be connected tosome point in the real world and that this connection is three dimensional. In otherwords, the information or artefact should not only move left/right or up/down whenthe AR-system is moved to correspondingly, but it should also increase or decreaseits size when the system is moved back and forth4.
By mobile AR, one usually mean an AR-system that is portable and can be movedaround. Examples range from portable computers where the user sees the worldthrough a head-mounted display5 to systems where a mobile phone or some otherhand held device is used and the user can see the world through the screen of thedevice. For the purpose of this project, the latter is the most interesting categoryof mobile AR.
While Fitzmaurice and Rekimoto et al. pioneered the area of mobile AR, their pro-totypes were not useable outside of the laboratory environment. Since then, muchresearch effort has been spent on realising their visions outside of these controlledenvironments. As mentioned in section 2.2.2, it has become possible to use naturalfeature tracking to recognize objects and to calculate from what relative angle theyare being viewed. Before this was possible, markers and barcodes were used for thesame purpose. With the introduction of cell tower triangulation and the GPS, itbecame possible to position a mobile device anywhere on the surface of the earth, as
4It could also be that the world, and thus the registration point, is moving relative to theAR-system.
5See for example Sutherland’s pioneering head mounted AR-system from 1968 [30] or Piekarskiand Thomas’ ARQuake [18].
15
CHAPTER 2. RESEARCH OVERVIEW
long as there were sufficient cell towers or a strong enough GPS-signal. Combiningthe position with awareness of direction through the use of digital compasses hasbecome yet another way of estimating what the user is looking at.
Using the techniques mentioned above, mobile AR has gradually become more andmore reality. In 2003, Wagner et al. presented a system that guides users through anunknown building by using a handheld device that recognize markers and overlayingguiding arrows and a wire frame of the building on the camera feed [35]. Kähäriand Murphy in 2006 used a GPS-receiver and digital compass in combination toannotate the image from the camera of a mobile phone with information aboutbuildings and persons [11]. In 2008, Takacs et al. successfully implemented naturalfeature tracking on a mobile phone and used it to enable mobile AR on a consumermobile phone [32].
These advances in research has lead to the introduction of commercial systemsas well. Layar6 and Wikitude7 are two examples of commercial applications thathave received a lot of attention and publicity. They take publicly available andgeographically tagged information from sources such as Wikipedia, Twitter andQype and use it to allow users to view Wikipedia articles about objects aroundthem, view Twitter updates from people in their surroundings or to find reviews ofrestaurants near them. The information is overlaid on the video feed in real time,letting users rotate to explore their surroundings.
2.3.3 Geo-Wands
Geo-wands are a group of applications first envisioned by Egenhofer in [7]. By hisdefinition, a Geo-Wand is “an intelligent geographic pointer, which allows usersto identify remote geographic objects by pointing to them”. As an example, hementions a hiker that points with his Geo-Wand to a mountain top to see its nameand to receive information about its altitude and the distance to it. Building onEgenhofer’s definition, it is easy to envision a number of applications. Once a userhas identified an object with the Geo-Wand, he or she could for example receive orleave information about it, mark it so that a friend could find it or send a commandto it.
Since Egenhofer presented his vision in 1999, parts of it have been realized in differ-ent research and commercial projects. In [28], Simon et al. presented their versionof a Geo-Wand, fittingly named GeoWand. Through the use of a standard, of-the-shelf, mobile phone enhanced with external GPS-receiver, accelerometer andmagnetometer, they demonstrated a prototype Geo-Wand application which letusers point at restaurants to receive more information about them. In [23], another
6http://layar.eu/7http://www.wikitude.org/
16
2.3. RELATED WORK
implementation of a Geo-Wand was demonstrated. Users were equipped with a mo-bile device connected to a GPS-receiver and a sensor box, containing accelerometersand magnetometers. This device could then be used to mark points the user foundinteresting when out walking in the city. The points could later be retrieved andviewed on a map using a computer.
Common for these two applications is that they both use computers to process thedata captured by the sensors. In the first case, the sensor data registered by themobile phone was sent to a server that computes which points of interests that canbe viewed and the result is then sent back to the phone [26]. In the second case,all points of interests that the user marked were saved on the mobile device andwere retrieved later for processing and visualization on a computer. An additionalexample of a similar Geo-Wand can be found in [29].
Nokia has with its Point & Find application [15] demonstrated an application thatin part works as a Geo-Wand. Instead of using magnetometers and accelerometers,their application is based on computer vision algorithms that are analyzing, in realtime, the video taken by the camera of the mobile phone. The GPS-position of theuser is used to retrieve images of points of interest in the users surrounding andthen this set of images is matched to the video. If a point of interest is recognizedin the video, the user has the ability to click on it to receive additional information.Google Goggles is a similar application that features both usage of computer visionand the combination of GPS-receiver and digital compass [9].
17

Chapter 3
Interaction Prototype
This chapter contains a description of the first, basic prototype that was created.The prototype was created as a means of exploring different techniques of doingintersection calculations and to get a feel for the limitations that the sensors im-pose. The goal was to create a fully functional implementation of all the technicalaspects of the intersection calculations, which could then be used in more advancedapplications. This way, we would not have to worry about this part when design-ing our final application prototype, and could focus entirely on finding areas wherethis type of interaction felt natural. This chapter also describes the technique ofdetermining what the user is pointing at, which is patent pending.
3.1 Interaction Choices
As seen in section 2.1, there are three popular interaction paradigms that are com-monly used in mobile spatial interaction: touching, pointing and scanning. Thelimitations dictated by Ericsson said that the GPS, magnetometer and accelerome-ter were to be used. Since the functionality of a GPS-receiver is limited indoors, theinteraction had to take place outdoors. The number of possible points of interestwas therefore limited to things you normally find interesting to interact with whenyou are outdoors.
In most situations outdoors you find yourself quite some distance from the objectthat you are interested in interacting with. This ruled out the touching paradigm,since Rukzio et al. in [24] suggest that users are more prone to use pointing insteadof touching when they are out of reach of the object they wish to interact with. Thescanning paradigm on the other hand would be plausible or maybe even preferredin an outdoor environment in some situations, but since Ericsson had restricted theproject to use a pointing type of interaction, we did not investigate this paradigm
19
CHAPTER 3. INTERACTION PROTOTYPE
further. However, scanning was later used as a means of comparison, see section 4.4for more details. Due to these circumstances, the pointing paradigm was choosenas the base for the interaction.
3.2 Prototype Requirements
A few requirements were established for the prototype. The first was that the calcu-lations should be possible to perform in real time. This would allow for applicationswhere the view is updated in real time, which in turn meant that the phone wouldhave to do the calculations itself, since the bandwidth of a mobile phone is limited.This would also be an advantage, as less server structure and hardware would beneeded.
As seen in section 2.2, the sensors report far from perfect values, so another require-ment was that the prototype would let us try the effects of the sensor uncertainty.The goal was to come up with some way to address them or to compensate for theireffect.
The last requirement was that the final code for doing the intersection calculationsshould be as standalone as possible, since Ericsson wanted to be able to include theintersection calculation functionality in an API they were working on and since wewanted to be able to reuse this code in our later development.
3.3 Intersection Calculations
When a user points at some point of interest in the real world, calculations areneeded in order to determine which point the user meant. The data from thesensors needs to be combined and matched against a collection of points of inter-est, so that the correct information or action the user requested can be displayedor performed. In general, researchers seem to seldom describe their methods forcalculating intersections when using combination of GPS, magnetometer and ac-celerometer. In this section, we will therefore first describe three methods we havedeveloped and in the end, for comparison, present a fourth method described inanother paper. The three methods developed by us during this project have notbeen described elsewhere and a patent application for them has been filed.
3.3.1 Ray Tracing
The first method we developed is based on a computer graphics method called raytracing. The principle of ray tracing is to create a ray that starts in some point and
20

3.3. INTERSECTION CALCULATIONS
travels in some direction. This ray is traced through the world, and what objects itintersects on its way is calculated. The GPS-position provides a starting point andthe accelerometer and magnetometer in conjunction provide a direction. Togetherthey form a ray, which can then be traced in some model of the world where pointsof interest has been marked.
In the computer graphics version of ray tracing, it is most common to use trianglesto represent the model or scene that is to be rendered, but other geometrical figuresare possible as well. As long as it is possible to calculate the intersection betweenthe figure and a ray, any geometrical figure can be used. The dimensionality of thealgorithm can also be adopted, as the original algorithm operate in three dimensionsbut can easily be converted to two dimensions as well.
For example, to find out if a ray has intersected a circle in two dimensions, start byfinding the point on the ray that is closest to the centre of the circle. This point isdefined by the fact that a line passing through this point and centre of the circle isperpendicular to the ray itself. The point can thus be found by solving the equationsystem formed by the parametric form of the two lines and the fact that the scalarproduct between two perpendicular lines is zero. If the distance between the rayand the circle centre is less than the radius, the ray intersects the circle.
This method is straight forward, easy to implement, and depending on the waypoints of interest are represented, does not require a lot of computational power.The down side of this method however, is that it is very sensible to errors in sensordata. If the GPS-receiver report a position that is some ten meters off, or if thedirection is a few degrees off, the target representation need to be relatively largefor the ray to hit it. One solution to this problem is to estimate the errors and thento simply send more rays to cover all possible combinations of position and pointingdirection. This will of course require more computational power.
3.3.2 Barycentric Coordinates
Another method we developed to calculate what point of interest a user might havepointed at, is to use triangles. The idea is to compensate for the uncertainty inposition and bearing by first estimating their magnitude. The estimation is thenused to construct a triangle that represents all the possible directions a user couldhave been pointing in, from every position the user could have had. After thistriangle has been calculated, the points of interests are tested against the triangleto determine if they lay inside it or not. The test is performed using Barycentriccoordinates. In the Barycentric coordinate system, the two coordinate axis coincidewith two of the sides of the triangle. The normal coordinates of a point of interestis converted into Barycentric coordinates, and depending on the value of thesecoordinates, it is possible to determine where the point is relative to the triangle.
21
CHAPTER 3. INTERACTION PROTOTYPE
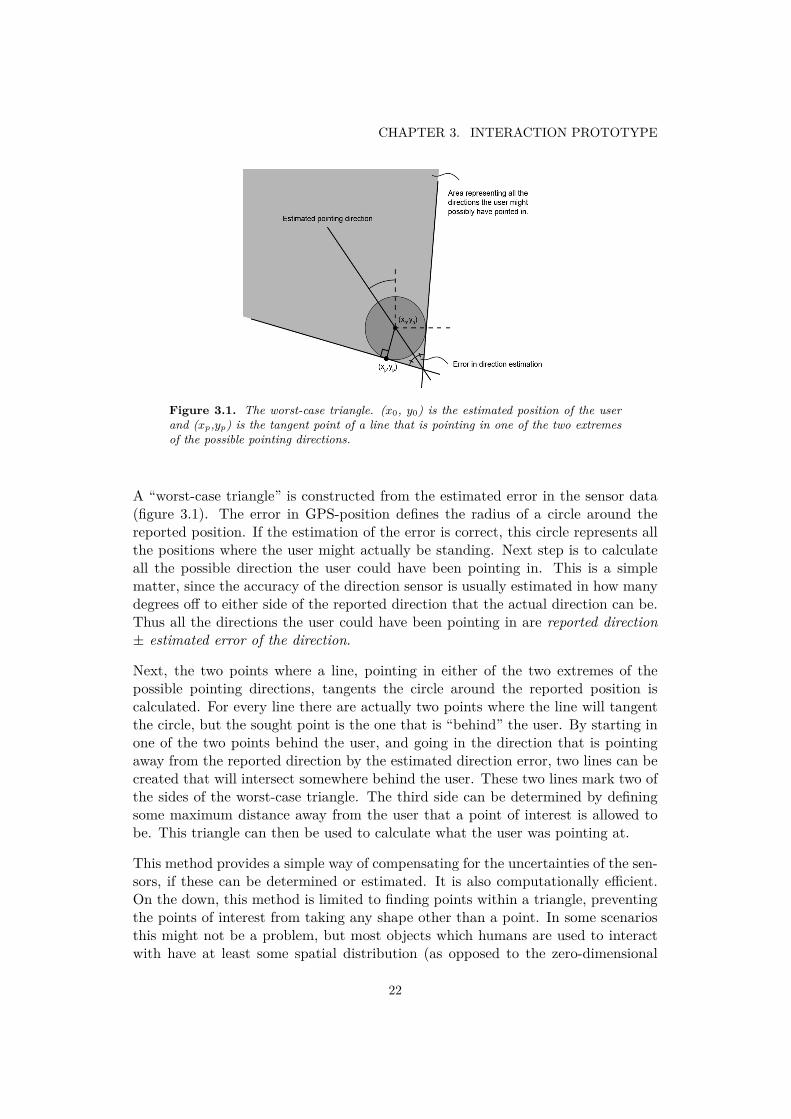
Figure 3.1. The worst-case triangle. (x0, y0) is the estimated position of the userand (xp,yp) is the tangent point of a line that is pointing in one of the two extremesof the possible pointing directions.
A “worst-case triangle” is constructed from the estimated error in the sensor data(figure 3.1). The error in GPS-position defines the radius of a circle around thereported position. If the estimation of the error is correct, this circle represents allthe positions where the user might actually be standing. Next step is to calculateall the possible direction the user could have been pointing in. This is a simplematter, since the accuracy of the direction sensor is usually estimated in how manydegrees off to either side of the reported direction that the actual direction can be.Thus all the directions the user could have been pointing in are reported direction± estimated error of the direction.
Next, the two points where a line, pointing in either of the two extremes of thepossible pointing directions, tangents the circle around the reported position iscalculated. For every line there are actually two points where the line will tangentthe circle, but the sought point is the one that is “behind” the user. By starting inone of the two points behind the user, and going in the direction that is pointingaway from the reported direction by the estimated direction error, two lines can becreated that will intersect somewhere behind the user. These two lines mark two ofthe sides of the worst-case triangle. The third side can be determined by definingsome maximum distance away from the user that a point of interest is allowed tobe. This triangle can then be used to calculate what the user was pointing at.
This method provides a simple way of compensating for the uncertainties of the sen-sors, if these can be determined or estimated. It is also computationally efficient.On the down, this method is limited to finding points within a triangle, preventingthe points of interest from taking any shape other than a point. In some scenariosthis might not be a problem, but most objects which humans are used to interactwith have at least some spatial distribution (as opposed to the zero-dimensional
22
3.3. INTERSECTION CALCULATIONS
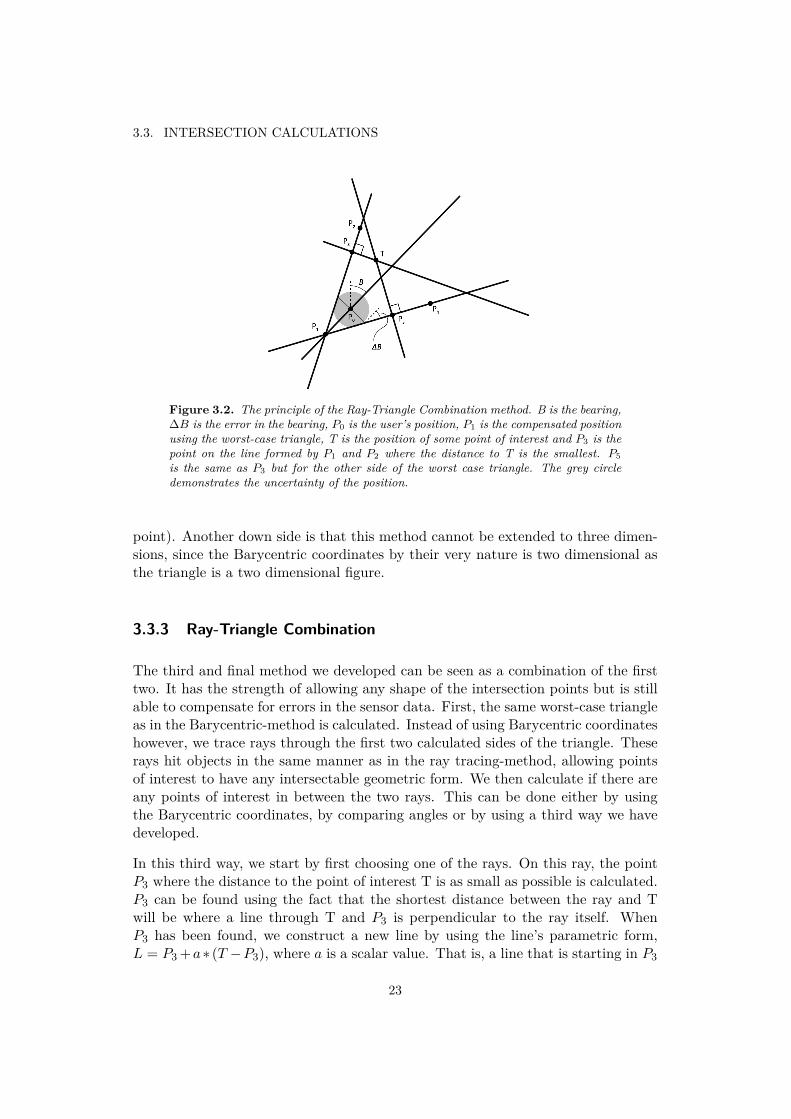
Figure 3.2. The principle of the Ray-Triangle Combination method. B is the bearing,∆B is the error in the bearing, P0 is the user’s position, P1 is the compensated positionusing the worst-case triangle, T is the position of some point of interest and P3 is thepoint on the line formed by P1 and P2 where the distance to T is the smallest. P5is the same as P3 but for the other side of the worst case triangle. The grey circledemonstrates the uncertainty of the position.
point). Another down side is that this method cannot be extended to three dimen-sions, since the Barycentric coordinates by their very nature is two dimensional asthe triangle is a two dimensional figure.
3.3.3 Ray-Triangle Combination
The third and final method we developed can be seen as a combination of the firsttwo. It has the strength of allowing any shape of the intersection points but is stillable to compensate for errors in the sensor data. First, the same worst-case triangleas in the Barycentric-method is calculated. Instead of using Barycentric coordinateshowever, we trace rays through the first two calculated sides of the triangle. Theserays hit objects in the same manner as in the ray tracing-method, allowing pointsof interest to have any intersectable geometric form. We then calculate if there areany points of interest in between the two rays. This can be done either by usingthe Barycentric coordinates, by comparing angles or by using a third way we havedeveloped.
In this third way, we start by first choosing one of the rays. On this ray, the pointP3 where the distance to the point of interest T is as small as possible is calculated.P3 can be found using the fact that the shortest distance between the ray and Twill be where a line through T and P3 is perpendicular to the ray itself. WhenP3 has been found, we construct a new line by using the line’s parametric form,L = P3 +a∗ (T −P3), where a is a scalar value. That is, a line that is starting in P3
23

CHAPTER 3. INTERACTION PROTOTYPE
Figure 3.3. The three different cases for T’s position in the Ray-Triangle Com-bination method. The arrow shows where a = 1 is on the line formed by P3 andT.
and that has positive a for points that lay in the direction of T. After this line hasbeen found, we calculate the value of a for the point where L intersect the secondray. The value of a gives us information about where T is relative to the two rays.If a has a value that is larger than one, T can be found between the rays, otherwiseT lies outside of the triangle. A picture showing the method can be found in figure3.2. Figure 3.3 shows the three different cases of values a can have.
This method has the advantages of the both previous methods, but still has a mod-erate complexity. As with the Barycentric-method, this algorithm is bound to twodimensions. A patent application has been made for this method in combinationwith the “worst-case triangle” mentioned in the section about Barycentric coordi-nates.
3.3.4 Monte Carlo Sampling - an Alternative Method
In [29], Strachan and Murray-Smith present an alternative method to estimate whatthe user wants to interact with. They take a probabilistic approach, using MonteCarlo sampling to evaluate a probability distribution of possible future positions.Monte Carlo sampling is a method to estimate a distribution. Instead of evaluatingthe distribution explicitly, a number of random samples are drawn from the distri-bution as a mean of approximating it. It can be shown that if enough samples aredrawn, the Monte Carlo sampling solution converges to the real solution.
In the method proposed by Strachan and Murray-Smith, a number of samples aredrawn from the distribution that describes the sensor uncertainty around an initialposition. Each one of these samples represents a possible real location of the user,since the location reported by the GPS-receiver might not be entirely correct. Eachone of these samples is then propagated forward in the direction reported by the
24
3.4. IMPLEMENTATION
digital compass. The propagated samples represent possible locations of the userin the future. By sending this “cloud” of possible positions forward, the user canwalk forward virtually and obtain digital information from places he or she mightphysically visit in the future.
The propagation of the samples is based on the direction in which the user is point-ing the mobile device, but also on a precalculated noise map and a precalculatedlikelihood map. The noise map is an estimate of the sensor noise for every possibleposition a sample may visit and the likelihood map gives an estimation of how likelyit is that a sample is in a certain position at a certain time. It is for example notvery likely for a sample to be inside a wall, since this is not a very likely positionfor the user in the future. The result is that the samples seem to flow forward alongthe pointing direction of the user, avoiding buildings and other positions that it isunlikely the user will visit in the future.
The strength of this method is that it compensates for uncertainties in the sensorreadings, however at the price of the increased complexity of generating the likeli-hood map and noise map. This method is also bound to two dimensions and couldnot be used to detect a user pointing at a shop on the second floor. It is also worthnoting that this method does not try to determine what the user is pointing at.Instead it calculates likely positions of the user in the future.
3.4 Implementation
Of the four methods presented in the previous chapter, the first three were im-plemented. The reason for not implementing the forth method was that we didnot have the necessary information to construct likelihood and noise maps. Themethods were implemented using the Java programming language version that isused by the Android mobile phone operating system and tested on the developerphone released by Google, called G1 (manufactured by HTC Corporation). Thisphone contained all the necessary hardware and was chosen because it was the onlyprogrammable phone that was available to us at the time.
All three methods were implemented in a small static class coupled with an interfaceto define the points of interest. During ray tracing, the points of interest have thegeometric form of a circle, defined by a point in space and a radius. To compensatefor the fact that the coordinate system used by GPS devices has axes of differentscale, a compensation factor was used to convert units from one of the axis to theunits of the other axis. A conversion factor was also used to convert from meterunits to units of the chosen axis of the GPS coordinate system, to let users givedifferent measurements in the more intuitive meter system instead of in GPS-units.
The Android system provides classes that reports the readings of the GPS-receiver,
25
CHAPTER 3. INTERACTION PROTOTYPE
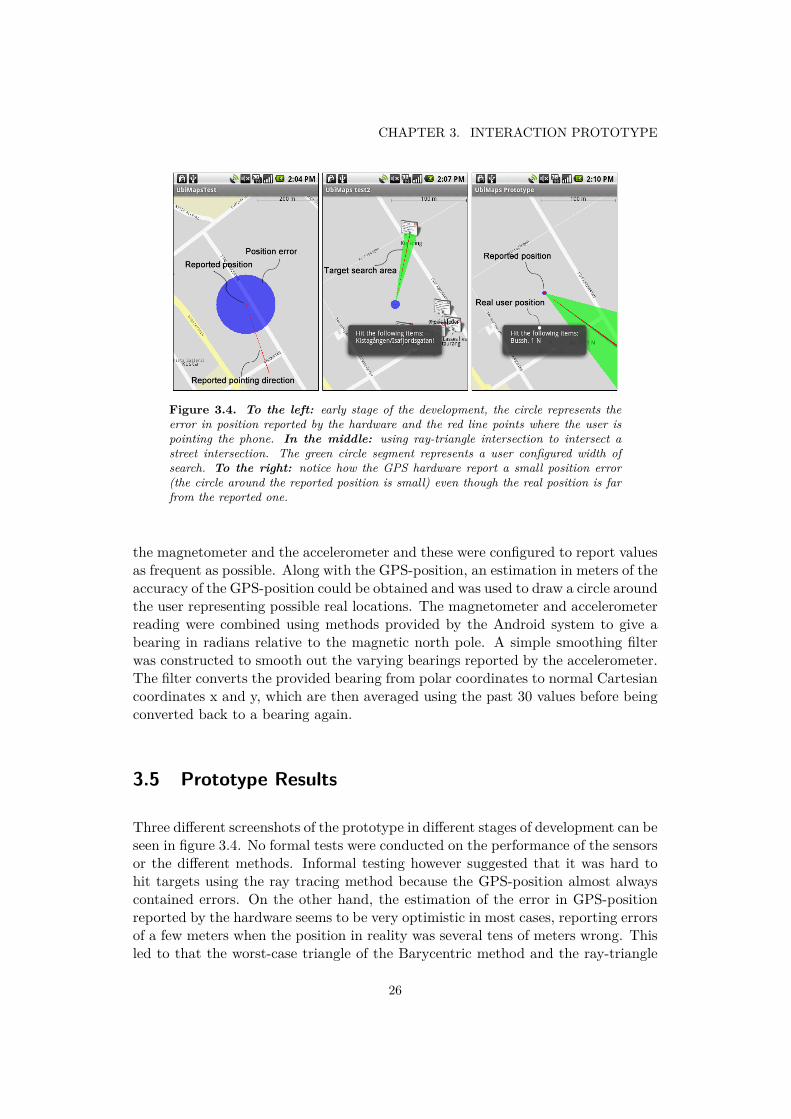
Figure 3.4. To the left: early stage of the development, the circle represents theerror in position reported by the hardware and the red line points where the user ispointing the phone. In the middle: using ray-triangle intersection to intersect astreet intersection. The green circle segment represents a user configured width ofsearch. To the right: notice how the GPS hardware report a small position error(the circle around the reported position is small) even though the real position is farfrom the reported one.
the magnetometer and the accelerometer and these were configured to report valuesas frequent as possible. Along with the GPS-position, an estimation in meters of theaccuracy of the GPS-position could be obtained and was used to draw a circle aroundthe user representing possible real locations. The magnetometer and accelerometerreading were combined using methods provided by the Android system to give abearing in radians relative to the magnetic north pole. A simple smoothing filterwas constructed to smooth out the varying bearings reported by the accelerometer.The filter converts the provided bearing from polar coordinates to normal Cartesiancoordinates x and y, which are then averaged using the past 30 values before beingconverted back to a bearing again.
3.5 Prototype Results
Three different screenshots of the prototype in different stages of development can beseen in figure 3.4. No formal tests were conducted on the performance of the sensorsor the different methods. Informal testing however suggested that it was hard tohit targets using the ray tracing method because the GPS-position almost alwayscontained errors. On the other hand, the estimation of the error in GPS-positionreported by the hardware seems to be very optimistic in most cases, reporting errorsof a few meters when the position in reality was several tens of meters wrong. Thisled to that the worst-case triangle of the Barycentric method and the ray-triangle
26

3.5. PROTOTYPE RESULTS
method did not really make a difference. We tried to come up with other ways ofestimating the error in the GPS-position, but none was found.
To compensate for the difficulties in estimating the error in GPS-position, we intro-duced a user defined angle around the reported bearing, which was used to createthe triangle needed by the Barycentric and ray-triangle methods. Instead of con-structing the worst-case triangle, we simply constructed a triangle with one of itscorners in the reported position. The two legs meeting in this corner were pointingin the bearing plus or minus the user defined angle. The motivation for this changewas that if a broad enough triangle was used, the user would at least hit the targethe or she intended, at the price of possibly having to select it in a list if other targetsthat were hit as well.
Using this new user defined angle to construct the needed triangle, we soon dis-covered a design problem with using the Barycentric approach. To mark points ofinterest in the map API an icon provided by the Android system was used. The iconwas centered at the GPS-coordinates of the point of interest, which in turn meantthat using the Barycentric method, the selection triangle had to contain the centreof the icon to register the point of interest as hit. This lead to situations whereit look like you had hit the target, as the triangle intersected a part of the icon,but since the triangle did not contain the centre of the icon, no hit was reported.Using instead the ray-triangle method, we could set an appropriate radius aroundthe centre of the icon, making all parts of the icon possible to hit. Because of this,the ray-triangle method was selected as the method to be used in the rest of ourwork if we were to work with two dimensional data, otherwise we would use the raytracing method.
A simple test was conducted to see how well the ray tracing and ray-triangle meth-ods performed in the aspect of computational time. Using a thousand randomlygenerated points of interest in the vicinity, both methods took around 40 millisec-onds in average to test all points for intersection, without the use of any special datastructure. This performance was deemed sufficient, as it would enable an applica-tion with 1000 available points of interest to run in 25 frames per second. If moreperformance is needed, data structures such as kd-trees, quad-trees or a binary treecould be used to decrease the number of points of interest that need to be testedfor intersection.
27


Chapter 4
Application Prototype
After the initial prototype had been completed, the work began to create a realapplication that would demonstrate the pointing interaction in use in a real usagescenario. This chapter will provide insight into the design process of this application,from concept development and design decisions via the resulting application to userevaluation.
4.1 Concept Development
The goal of the whole concept development was to come up with a few different al-ternative concepts of applications that would utilize the type of interaction that wasimplemented in the interaction prototype (see chapter 3 for details), and finally tochoose one of them to be implemented. This application would serve the purpose ofdemonstrating a scenario where it would feel natural to interact in this way. Parallelto the work with the interaction prototype, the application concept developmentstarted with different brainstorming sessions between me and my co-worker JosefinLöfström. We studied different available applications such as Layar, NRU, NokiaPoint&Find and Wikitude.
4.1.1 Hypothesis
After a few brainstorming sessions and after doing analyses and evaluations of othercompanies’ applications, a hypothesis began to take form about when the interactionsupported by the interaction prototype would be useful. Our hypothesis was:
“The pointing interaction of the interaction prototype is useful in sit-
29
CHAPTER 4. APPLICATION PROTOTYPE
uations where you are within viewing distance of an object that youassociate with a certain type of information, which you frequently findyourself in need of.”
This hypothesis formed the basis for the concept development, where we sought todevelop concepts which included such situations, objects and information.
4.1.2 Four Concept Candidates
To investigate when people find themselves in situations similar to the one in thehypothesis, two focus groups were held at the Royal Institute of Technology, KTH,in Stockholm. The focus groups were based on discussions around a set of slides andthe participants got to try the interaction prototype as well as Layar and Wikitude.The result of the focus groups, together with some brainstorming, resulted in thedevelopment of four different application concepts.
Cinema & Restaurant
Many people mentioned during the focus groups that they sometimes found them-selves out walking in town, looking for a restaurant or cafe and that they used anormal computer to sometimes look for new restaurants to go to or to see if a par-ticular restaurant had received good reviews. This resulted in a concept of a mobileapplication that could help people answer questions such as “what’s on the menu?”and “is this really a good place?”, without the need for a desktop computer. Latercinemas were added to the concept, to let users easily find out which movies theycould see in a closeby movie theatre.
Nightclub
Another concept was built around the world of clubbing. Many of the participantsof the focus group regularly visited the night life of Stockholm and the need for aclub guide was identified. In Stockholm there are nightclubs with different dresscodes, music themes and age limits. To add to the confusion, some premises hostdifferent nightclubs during different weekdays. When out looking for a good club, itwould be handy to have a mobile application which could tell you all these things,without you having to spend 20 minutes in a queue to find out.
30
4.1. CONCEPT DEVELOPMENT
Public Transportation
Most of the participants of the focus groups were travelling by public transportation.Being frequent travellers, they often found themselves in need of consulting thetimetables for buses, subway and commuter trains. The only real alternative if theywere not by a computer or at the bus stop itself, were to use the web browser of theirmobile phone, a slow process that often leave a lot to desire. A mobile applicationto solve the above problem therefore became a concept.
Photo Exploration
The last concept we developed was based on photos. GPS-receivers have not onlystarted to appear in mobile phones, but also in cameras. Since almost every mobilephone also includes a camera, a new possibility has opened up to tag photos withthe exact location where they were taken. The ability to explore this increasingpool of images on site could provide possibilities to for example do time travellingto another year or season, or to view a famous building from inside, even duringhours when the building is closed.
4.1.3 Final Concept
After consulting with our supervisors at Ericsson, two of the concepts were keptas final candidates, the nightclub and bus timetable concept. Both the photo ex-ploration and cinema & restaurant concept were deemed too commonly found inalready available mobile applications. There are plenty of mobile applications avail-able that let you view photos taken at a certain position or that will guide you toa nearby restaurant with good reviews. The other two however felt unexplored andcould both present usage situations where pointing interaction would feel natural.
In the end, the final decision became developing the public transportation concept.The reason for this was mainly that it was far easier to get hold of real data in thecase of public transportation, since Ericsson was already cooperating with UpplandsLänstrafik, UL, which operate the public transportation in the city of Uppsala andin its surroundings. In the case of the nightclub concept, we would have needed tospend time trying to pursue a similar cooperation with some company that owneddata about nightclubs in Stockholm or some other larger city in Sweden and thiswas time we judged we did not have.
After improving on the public transportation concept, and narrowing it down a bit,the final goal became to develop a small but fully functional application to supportthe following use case:
31

CHAPTER 4. APPLICATION PROTOTYPE
“You have just finished for the day and are heading home. As usualyou want to take the bus from the nearby bus stop. It is a foul weatheroutside, so you do not want to miss the bus. Unfortunately, since youhave not learned the timetable by memory, you do not know if you needto run to catch the bus. Therefore you take out your mobile phone andpoint it towards the bus stop. By pushing a button you immediately seethat the bus arrive in 2 minutes, so you will need to hurry.”
4.2 Resulting Application - Time2Go
The development finally resulted in an application called Time2Go. The applicationcovers the scenario mentioned in 4.1.3 and can be divided into three views. Firt awelcome screen is first shown. After the user has pointed towards a bus stop andpressed the menu-button, a second screen appears, displaying a list of what the userhit. If nothing was hit, a suggestion is shown instead. The third and last screen isa detailed view of different departures for a certain bus, which appears if the userselects a bus from the list of results in the result view.
4.2.1 Welcome Screen
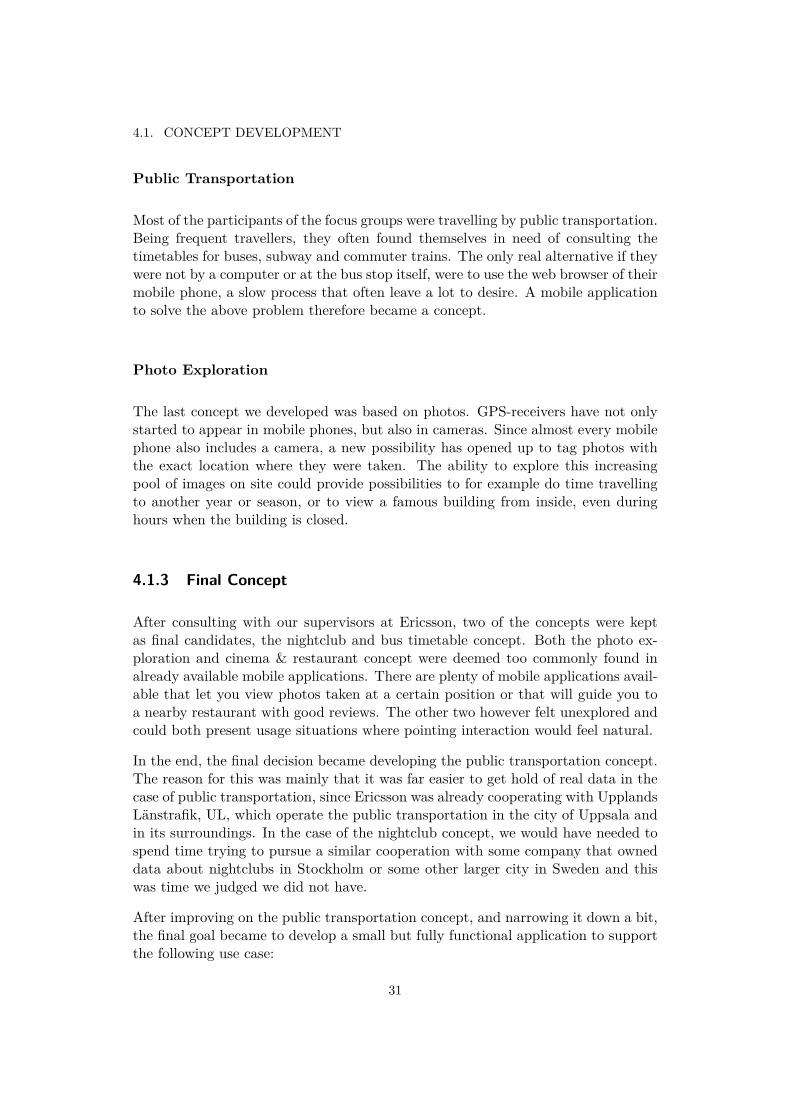
When the user starts Time2Go, the application begins by searching for a GPS-signaland then proceeds to download data about nearby bus stops from UL’s servers.Without this initial data, the application is not able to perform any work, so thesefirst steps are forced and obligatory to perform. In figure 4.1, the screenshot tothe left and in the middle show the popup screen when waiting for GPS-signal anddownloading data respectively. On the right is the welcome screen shown after thepopup screens has disappeared, indicating that the application is ready for use.
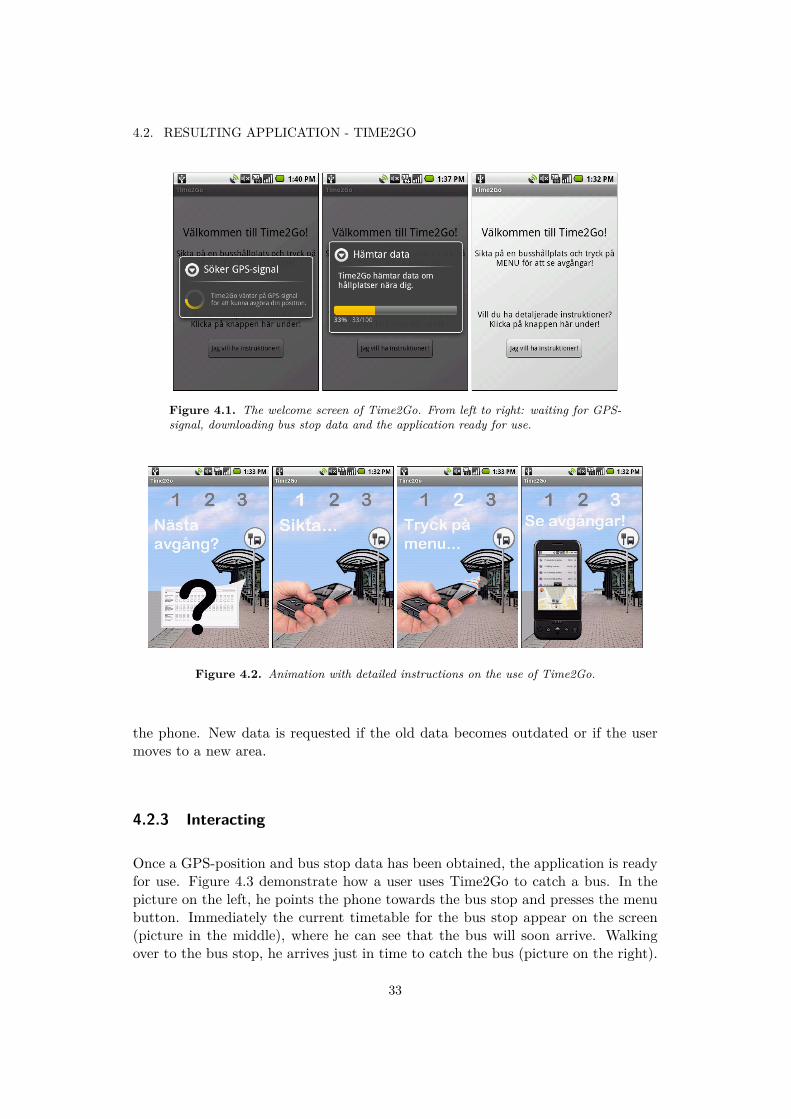
The text of the welcome screen instructs users to aim at a bus stop and pressthe menu button to see departures for that bus stop, or to press the “Jag vill hainstruktioner!”-button for more detailed instructions. Pressing this button will showa small animation (the key frames of the animation can be found in figure 4.2). Oncethe animation completes, the welcome screen is shown again.
4.2.2 Bus Data
The data is downloaded from a system provided by UL. A query is sent to this systemabout bus stops in the area surrounding the user, and then data is requested foreach one of these bus stops in terms of departures. The data is requested throughthe use of a mobile or wifi network connection, depending on what is available to
32
4.2. RESULTING APPLICATION - TIME2GO
Figure 4.1. The welcome screen of Time2Go. From left to right: waiting for GPS-signal, downloading bus stop data and the application ready for use.
Figure 4.2. Animation with detailed instructions on the use of Time2Go.
the phone. New data is requested if the old data becomes outdated or if the usermoves to a new area.
4.2.3 Interacting
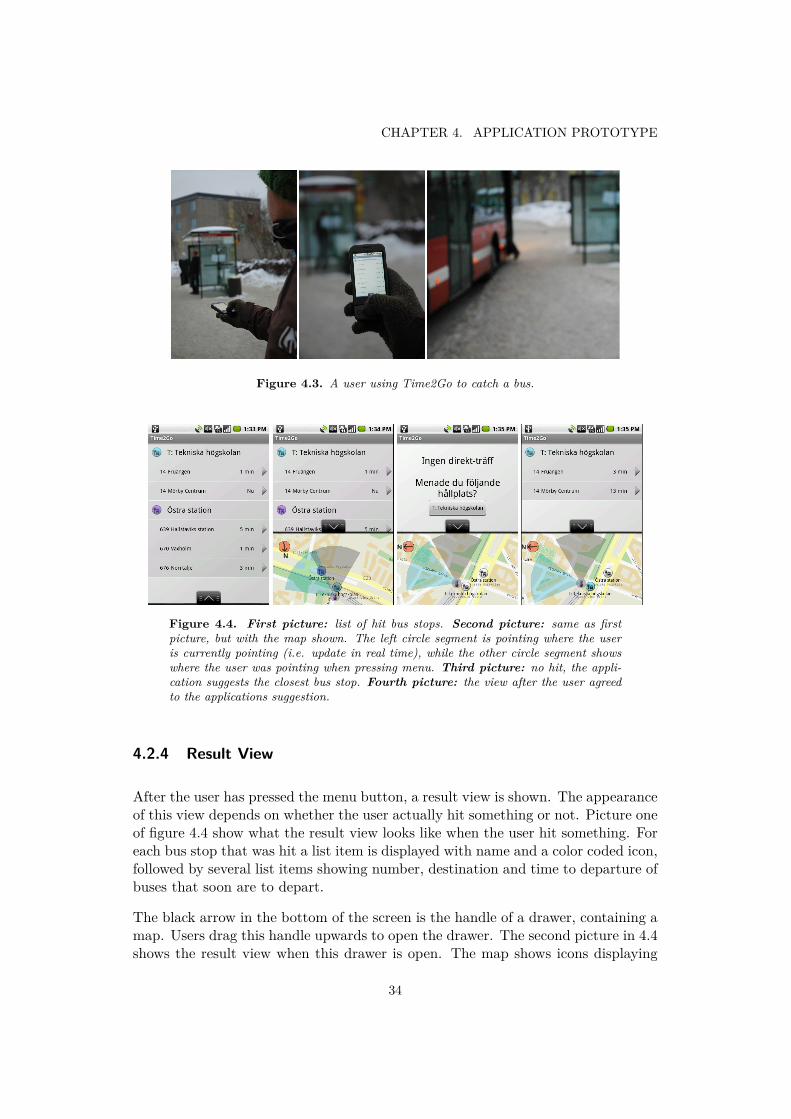
Once a GPS-position and bus stop data has been obtained, the application is readyfor use. Figure 4.3 demonstrate how a user uses Time2Go to catch a bus. In thepicture on the left, he points the phone towards the bus stop and presses the menubutton. Immediately the current timetable for the bus stop appear on the screen(picture in the middle), where he can see that the bus will soon arrive. Walkingover to the bus stop, he arrives just in time to catch the bus (picture on the right).
33
CHAPTER 4. APPLICATION PROTOTYPE
Figure 4.3. A user using Time2Go to catch a bus.
Figure 4.4. First picture: list of hit bus stops. Second picture: same as firstpicture, but with the map shown. The left circle segment is pointing where the useris currently pointing (i.e. update in real time), while the other circle segment showswhere the user was pointing when pressing menu. Third picture: no hit, the appli-cation suggests the closest bus stop. Fourth picture: the view after the user agreedto the applications suggestion.
4.2.4 Result View
After the user has pressed the menu button, a result view is shown. The appearanceof this view depends on whether the user actually hit something or not. Picture oneof figure 4.4 show what the result view looks like when the user hit something. Foreach bus stop that was hit a list item is displayed with name and a color coded icon,followed by several list items showing number, destination and time to departure ofbuses that soon are to depart.
The black arrow in the bottom of the screen is the handle of a drawer, containing amap. Users drag this handle upwards to open the drawer. The second picture in 4.4shows the result view when this drawer is open. The map shows icons displaying
34
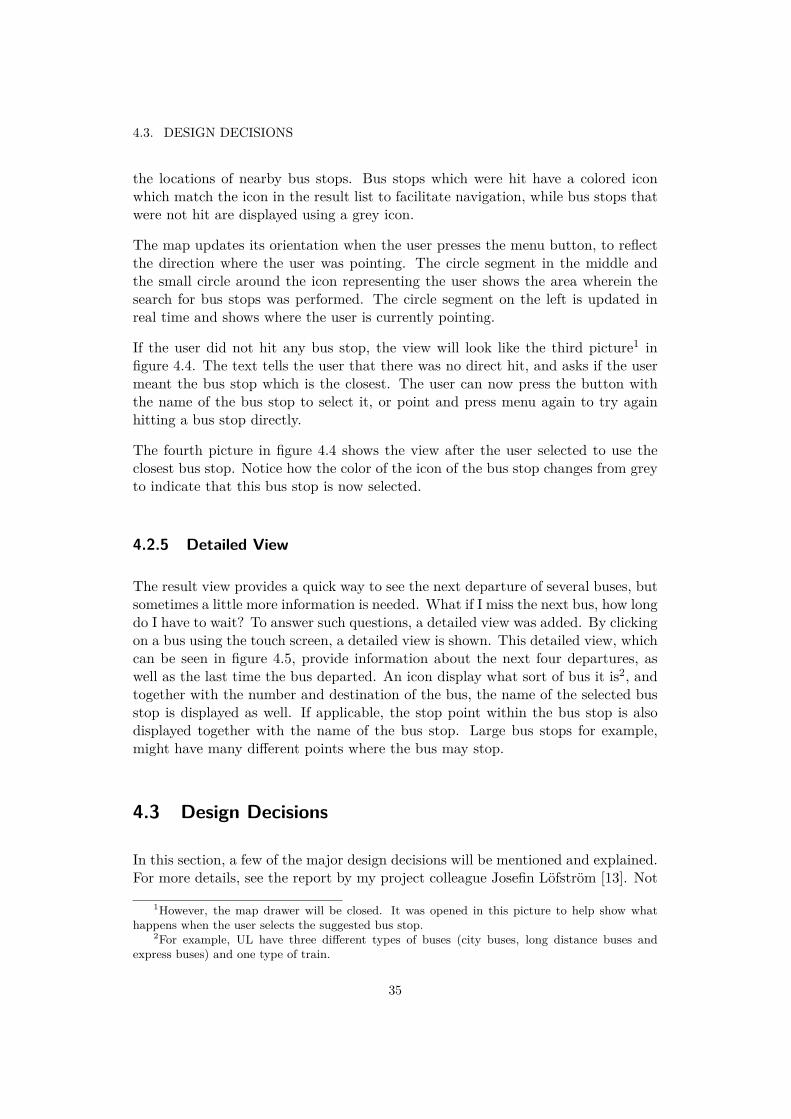
4.3. DESIGN DECISIONS
the locations of nearby bus stops. Bus stops which were hit have a colored iconwhich match the icon in the result list to facilitate navigation, while bus stops thatwere not hit are displayed using a grey icon.
The map updates its orientation when the user presses the menu button, to reflectthe direction where the user was pointing. The circle segment in the middle andthe small circle around the icon representing the user shows the area wherein thesearch for bus stops was performed. The circle segment on the left is updated inreal time and shows where the user is currently pointing.
If the user did not hit any bus stop, the view will look like the third picture1 infigure 4.4. The text tells the user that there was no direct hit, and asks if the usermeant the bus stop which is the closest. The user can now press the button withthe name of the bus stop to select it, or point and press menu again to try againhitting a bus stop directly.
The fourth picture in figure 4.4 shows the view after the user selected to use theclosest bus stop. Notice how the color of the icon of the bus stop changes from greyto indicate that this bus stop is now selected.
4.2.5 Detailed View
The result view provides a quick way to see the next departure of several buses, butsometimes a little more information is needed. What if I miss the next bus, how longdo I have to wait? To answer such questions, a detailed view was added. By clickingon a bus using the touch screen, a detailed view is shown. This detailed view, whichcan be seen in figure 4.5, provide information about the next four departures, aswell as the last time the bus departed. An icon display what sort of bus it is2, andtogether with the number and destination of the bus, the name of the selected busstop is displayed as well. If applicable, the stop point within the bus stop is alsodisplayed together with the name of the bus stop. Large bus stops for example,might have many different points where the bus may stop.
4.3 Design Decisions
In this section, a few of the major design decisions will be mentioned and explained.For more details, see the report by my project colleague Josefin Löfström [13]. Not
1However, the map drawer will be closed. It was opened in this picture to help show whathappens when the user selects the suggested bus stop.
2For example, UL have three different types of buses (city buses, long distance buses andexpress buses) and one type of train.
35
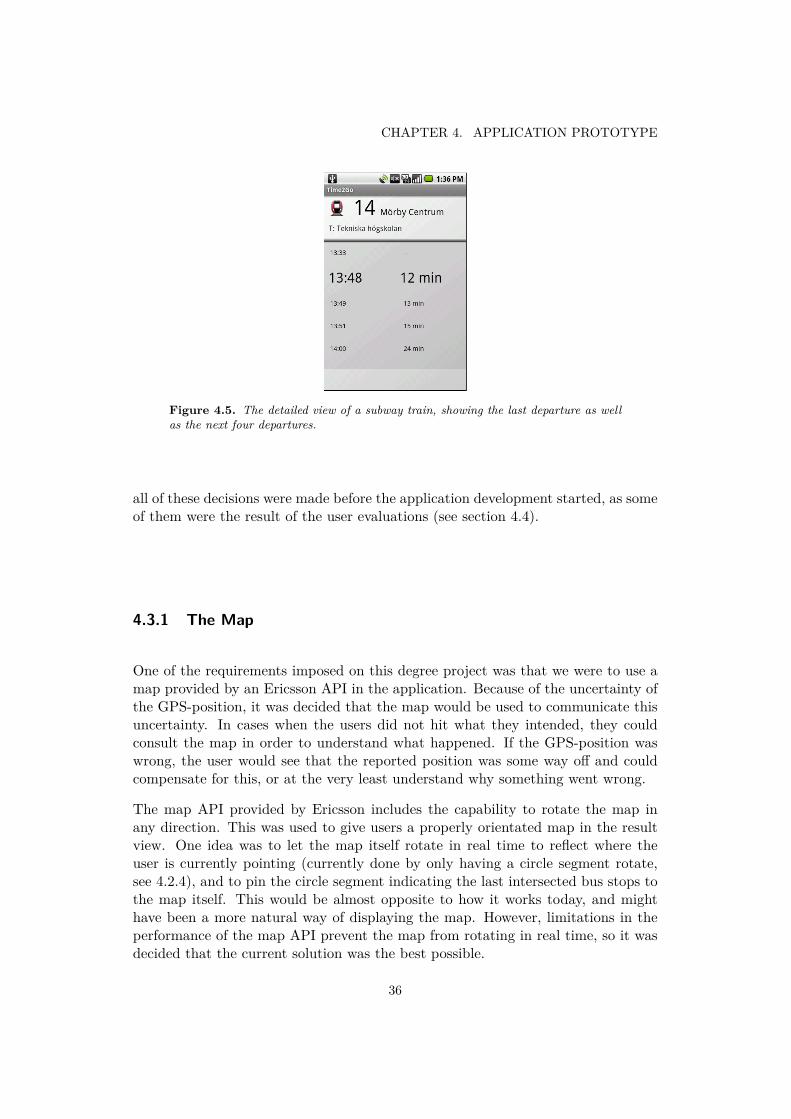
CHAPTER 4. APPLICATION PROTOTYPE
Figure 4.5. The detailed view of a subway train, showing the last departure as wellas the next four departures.
all of these decisions were made before the application development started, as someof them were the result of the user evaluations (see section 4.4).
4.3.1 The Map
One of the requirements imposed on this degree project was that we were to use amap provided by an Ericsson API in the application. Because of the uncertainty ofthe GPS-position, it was decided that the map would be used to communicate thisuncertainty. In cases when the users did not hit what they intended, they couldconsult the map in order to understand what happened. If the GPS-position waswrong, the user would see that the reported position was some way off and couldcompensate for this, or at the very least understand why something went wrong.
The map API provided by Ericsson includes the capability to rotate the map inany direction. This was used to give users a properly orientated map in the resultview. One idea was to let the map itself rotate in real time to reflect where theuser is currently pointing (currently done by only having a circle segment rotate,see 4.2.4), and to pin the circle segment indicating the last intersected bus stops tothe map itself. This would be almost opposite to how it works today, and mighthave been a more natural way of displaying the map. However, limitations in theperformance of the map API prevent the map from rotating in real time, so it wasdecided that the current solution was the best possible.
36
4.3. DESIGN DECISIONS
4.3.2 Precision
To prevent users from losing faith in the application, a certain success rate of thepointing interaction is needed. Because of this, a goal was set for the application. Ifpossible, the bus stop the user pointed at should be included in a list of possibly hitbus stops at the user’s first interaction attempt. If the application fails to do this,a second try should result in the proper bus stop being included in the list. Nevershould the user have to try three times to succeed. In terms of design decisions,this lead to that the circle segment which capture bus stops were made larger tocapture more bus stops, in order to increase the chance of capturing the point ofinterest that the user intended.
4.3.3 Interaction Trigger
As mentioned in 4.2.3, the user press the menu-button to trigger the interaction.This button was chosen simply because it was comfortable to press with the thumbon our G1 mobile phone, while at the same time pointing towards a bus stop. It maybe discussed if it was a wise decision to use a button that was so clearly intended tobe used for a special purpose (to display a menu in this case). Especially since thisbutton is placed in a different location on other Android mobile phones, a locationwhere it is a lot harder to reach comfortably while pointing. Better alternativesmight have been to use the trackball that all Android phones feature, or to place atouch screen button in the bottom of the screen. The down side of the last approachis that this would require use of precious screen space.
4.3.4 List of Results
Using a larger circle segment when selecting bus stop meant the possibility of morebus stops being included in the result list. The results were represented in a listwhere bus stops appear sorted according to distance from the user, with the closestone at the top. For every bus stop hit by the user, a list entry was made with thename of the bus stop and an icon. After each bus stop list entry followed one listentry for every bus departing from this bus stop, including number, destination andtime to next departure. When all buses departing from the bus stop had been listed,a new list entry with a new bus stop was made. It was deemed most likely thatthe closest of the hit bus stop would be the one the user intended, since situationswhere a user points over one visible bus stop towards another would probably notbe as common as situations where the user could only see one bus stop3.
3Note that the system used by UL treated two bus stops on opposite sides of a road as the oneand same bus stop and not two separate stops.
37
CHAPTER 4. APPLICATION PROTOTYPE
This way a user would hopefully find the bus stop he or she was looking for amongthe first few in the list. Next step for the user would then be to locate the correctbus in the list of buses departing from that bus stop. To aid the user in doingthis, the buses were sorted using their number, since we noted that people tend torefer to buses by their number rather than their destination. It would have beenpossible to sort the list according to departure time, but this would mean that thelist would suddenly change every time a bus departed. According to Ailisto et al.in [2], the interaction with the mobile phone might not be the primary action ofthe user. For example the primary action could be to walk down the street whileavoiding to collide with someone and the attention the user pays to the phone istherefore fragmented. It might be confusing to the user if the screen of the phoneis not the same when he or she returns to it after focusing on the primary action.
Technically it would have been possible to support user sorting, but to avoid intro-ducing elements into the interface that were not of interest during the user evalua-tion, we decided not to include such a feature.
4.3.5 Detailed View
A detailed view for each bus was created to allow users to see more than just thenext departure. To access this view, a user would simply click the bus of interest,and the view would appear showing when the bus departed the last time and thenext four departures. It would also show the destination, the bus stop for which thedeparture times were valid and, if applicable, from what part of the bus stop thebus would depart. Using this view, users could see the next few departures, shouldthey miss the current one. Five departures were included in total. The reasonfor this was that the most frequently departing buses in Uppsala departed in fiveminute intervals. With the list showing one previous departure and four comingdepartures, this leads to the user being able to see a minimum of 15 minutes intothe future, if the next departure is in a few seconds.
Because the intended use case was that the user is already on his or her way tothe bus stop and could see it, we believe seeing 15 minutes of future departuresshould be sufficient for the user to be able to plan ahead. To support more usecases however, the option to see later departures should be added.
4.4 User Evaluation
During the development of the Time2Go application, user evaluations were regu-larly performed. The first few tests were informal tests, conducted with Ericssonemployees in Kista using mocked up data. The result was mainly small changes to
38
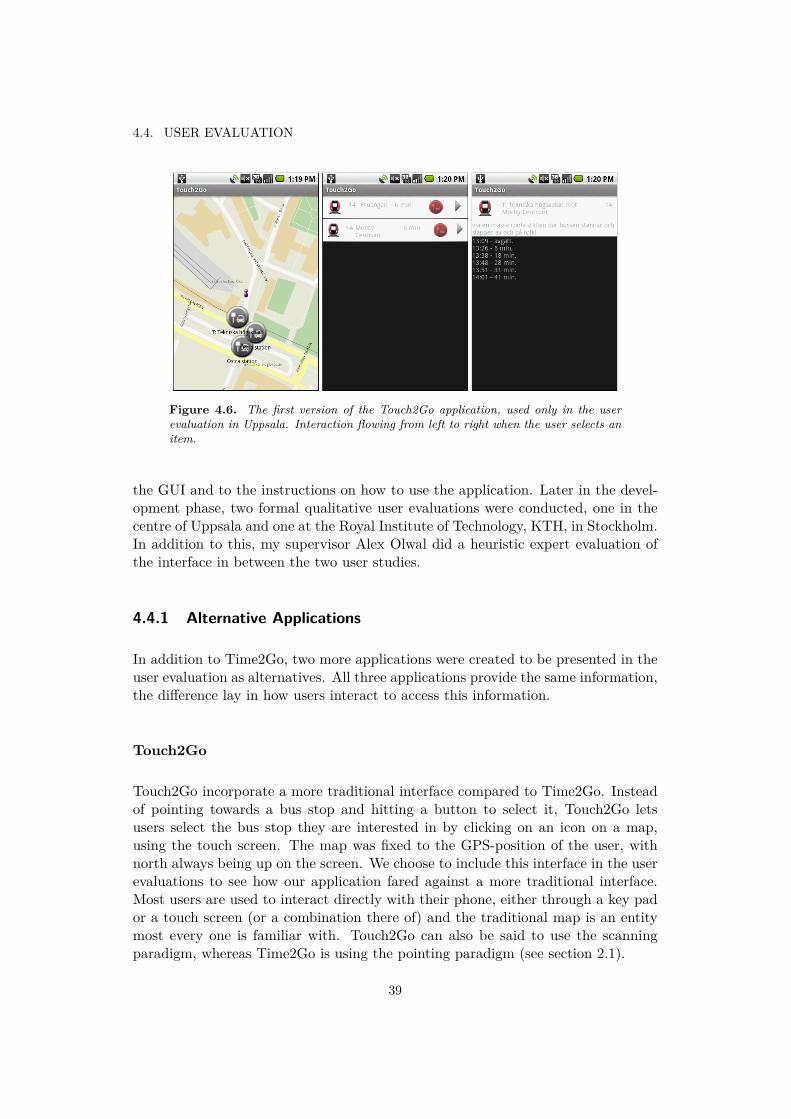
4.4. USER EVALUATION
Figure 4.6. The first version of the Touch2Go application, used only in the userevaluation in Uppsala. Interaction flowing from left to right when the user selects anitem.
the GUI and to the instructions on how to use the application. Later in the devel-opment phase, two formal qualitative user evaluations were conducted, one in thecentre of Uppsala and one at the Royal Institute of Technology, KTH, in Stockholm.In addition to this, my supervisor Alex Olwal did a heuristic expert evaluation ofthe interface in between the two user studies.
4.4.1 Alternative Applications
In addition to Time2Go, two more applications were created to be presented in theuser evaluation as alternatives. All three applications provide the same information,the difference lay in how users interact to access this information.
Touch2Go
Touch2Go incorporate a more traditional interface compared to Time2Go. Insteadof pointing towards a bus stop and hitting a button to select it, Touch2Go letsusers select the bus stop they are interested in by clicking on an icon on a map,using the touch screen. The map was fixed to the GPS-position of the user, withnorth always being up on the screen. We choose to include this interface in the userevaluations to see how our application fared against a more traditional interface.Most users are used to interact directly with their phone, either through a key pador a touch screen (or a combination there of) and the traditional map is an entitymost every one is familiar with. Touch2Go can also be said to use the scanningparadigm, whereas Time2Go is using the pointing paradigm (see section 2.1).
39
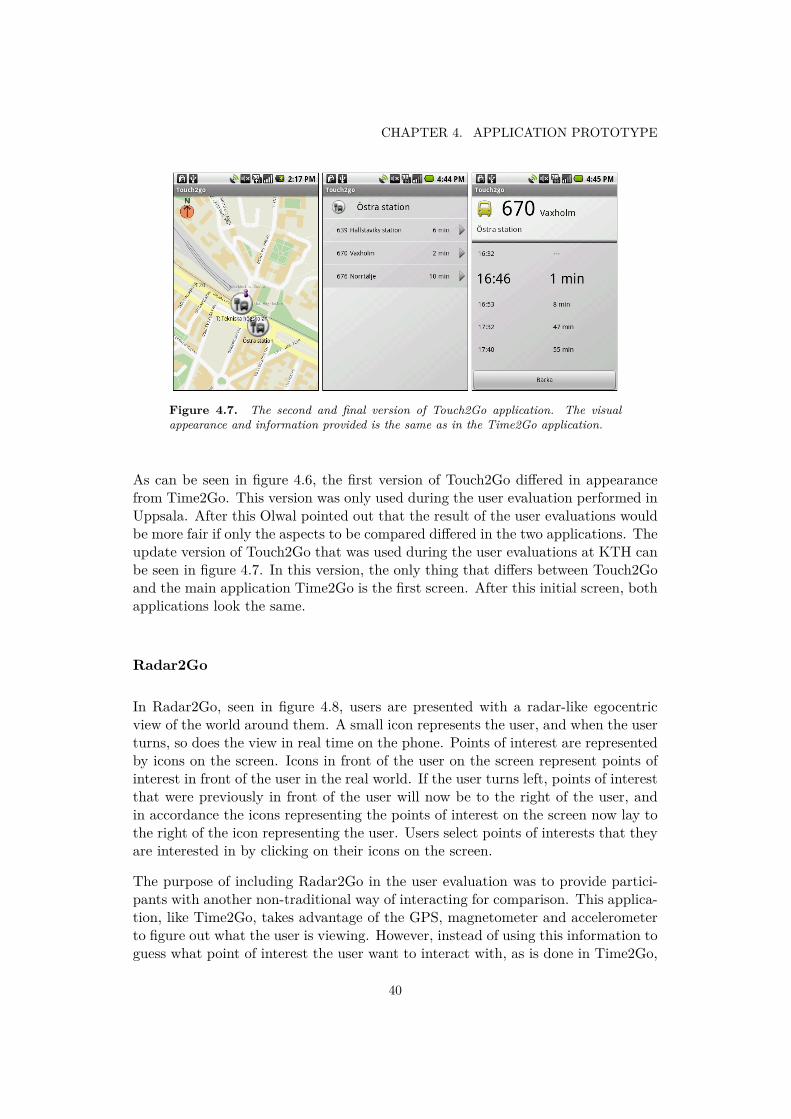
CHAPTER 4. APPLICATION PROTOTYPE
Figure 4.7. The second and final version of Touch2Go application. The visualappearance and information provided is the same as in the Time2Go application.
As can be seen in figure 4.6, the first version of Touch2Go differed in appearancefrom Time2Go. This version was only used during the user evaluation performed inUppsala. After this Olwal pointed out that the result of the user evaluations wouldbe more fair if only the aspects to be compared differed in the two applications. Theupdate version of Touch2Go that was used during the user evaluations at KTH canbe seen in figure 4.7. In this version, the only thing that differs between Touch2Goand the main application Time2Go is the first screen. After this initial screen, bothapplications look the same.
Radar2Go
In Radar2Go, seen in figure 4.8, users are presented with a radar-like egocentricview of the world around them. A small icon represents the user, and when the userturns, so does the view in real time on the phone. Points of interest are representedby icons on the screen. Icons in front of the user on the screen represent points ofinterest in front of the user in the real world. If the user turns left, points of interestthat were previously in front of the user will now be to the right of the user, andin accordance the icons representing the points of interest on the screen now lay tothe right of the icon representing the user. Users select points of interests that theyare interested in by clicking on their icons on the screen.
The purpose of including Radar2Go in the user evaluation was to provide partici-pants with another non-traditional way of interacting for comparison. This applica-tion, like Time2Go, takes advantage of the GPS, magnetometer and accelerometerto figure out what the user is viewing. However, instead of using this information toguess what point of interest the user want to interact with, as is done in Time2Go,
40

4.4. USER EVALUATION
Figure 4.8. The Radar2Go application. To the left: the radar view showing thereare two bus stops to the right of the user. In the middle: the screen shown afterthe user has selected one of the bus stops. To the right: detailed view of one of thebuses.
the information is simply displayed on the screen where the user can indicate ex-actly which point of interest to interact with. This way we hoped to be able to drawconclusions about the added value of not interacting on the screen.
4.4.2 The Uppsala Test
A pilot study was performed in Uppsala, Sweden, with 6 participants. The partici-pants were divided into groups that were tested separately. The first group consistedof three persons, the second of two and the last of one. The groups were gatheredsome distance away from the bus stop Stora torget in the centre of Uppsala andthe usage scenario was presented (see 4.1.3 for details). The task given was to findout the next few departures of a certain bus to see if there would be time for ashort stop in a shop without having to wait too long for the next departure. Eachgroup first got to try out the Time2Go application, followed by Touch2Go. At thetime, Radar2Go was not available for testing. After testing each application, theparticipants were asked what they thought of it, what aspects were good and whatwere bad. In the end, the participants got to compare the two applications to eachother and had to choose which one they liked the best.
This study was the first we made, and there were a couple of things that we couldhave done a lot better. One of the problems was that the bus stop the participantswere told they were heading towards was not visible from the spot where the evalua-tion was performed. Since Stora torget was a bus stop that none of the participantsused frequently, it was hard for the participants to stay with the scenario. An-other problem was that the order in which the applications were tested was always
41
CHAPTER 4. APPLICATION PROTOTYPE
the same, which might have made the results biased. Also, the Touch2Go appli-cation looked far less developed compared to the Time2Go application (see 4.4.1),something that may have affected the results as well.
Taking all this into account, we chose to see this user evaluation a pilot study. Somesmall changes were made to the interface of Time2Go, but no conclusions of a moregeneral kind by comparing the two applications were drawn. Instead we tried tolearn from our mistakes and made a second user evaluation to obtain more reliableresults.
4.4.3 Heuristic Expert Evaluation
Between the first and second user evaluation, my supervisor Alex Olwal performeda heuristic expert evaluation of the interface of Time2Go and Touch2Go. As usualwhen doing a heuristic expert evaluation, Olwal walk through the interface screenby screen and his opinions and suggestions were recorded. This evaluation lead toa list of changes to the applications and he also suggested to add an applicationwith a radar-like first screen, which became the Radar2Go application. Examplesof changes made were: to include a welcome screen where the instruction animationdid not start automatically, as was the case before; to give a suggestion of a busstop when the user did not hit anything; to give some sort of live feedback of wherethe user is pointing (now included in the map view) and to make Time2Go andTouch2Go look as similar as possible to make sure people react to the difference ininteraction and not to interface differences.
4.4.4 The KTH Test
A second user evaluation was performed at the Royal Institute of Technology, KTH,in Stockholm. This test was performed with the pilot study in Uppsala in mind,trying to fix the problems that were identified.
Method
This test was performed as a field study. According to Preece et al. in [20], afield study is typically used when studying a product or prototype being used inits intended environment. The point is to find out how the product work in itsintended environment, rather than in a controlled environment. The latter is thecase when doing usability testing. We were more interested in what users thoughtabout the different applications when used in their intended environment, since thiswould be a mayor factor for Ericsson when deciding what interaction technique touse in future products. Pure performance statistics on how users perform when
42
4.4. USER EVALUATION
using the different types of interaction would not be of use if users do not enjoy theways of interacting in the first place.
Interviews and observations were used to gather data together with a qualitativeapproach to data analysis. In [20], Preece et al. state that in field studies, inter-views and observations are primarily used, and that qualitative analysis of data“focuses on the nature of something”. By focusing on the nature of the partici-pants’ thoughts and opinions, we hoped to uncover the underlying reasons for whythe participants thought as they did. These reasons could point to areas wherefurther and more thorough studies could be performed. One could argue that acombination of qualitative and quantitative data analysis would have given a moresolid result and that other data gathering methods could have been used. Giventhe small amount of participants in the evaluation, we judged that the additionalinformation a quantitative analysis could provide would not be of interest, since itcould not be generalized to account for the whole population of users. Preece etal. also suggest that interviews and direct observations in the field are good waysto explore issues of a product and to gain insight into the context of user activity.Therefore we choose to use these two methods.
Test Design
The test performed at KTH was designed to provide the answer to the questionfollowing question:
Which selection paradigm do users prefer in the scenario presented in section 4.1.3and why?
The three different selection paradigms of Time2Go, Touch2Go and Radar2Go werecompared using a comparison test. The only thing that differed between the appli-cations was the selection paradigm, thus this was the independent test variable. Thereactions and comments of the participants constitutes the dependent test variable.Several qualitative usability factors were identified from the users reactions, whatthey said and the discussions around their opinions of the different applications.
Participants
A total of eight persons participated in the user evaluation. Two of the participantsdid the evaluation alone and the rest in pairs. By doing the test in pairs, we hopedto inspire discussions between the two participants about the tested applicationsand their strengths and weaknesses. The average age of the participants was 23,with the oldest being 26 and the youngest 20. Two of the participants were female,the rest were male. All participants were master students at KTH. Two users
43
CHAPTER 4. APPLICATION PROTOTYPE
had experience using smartphones, while the rest were mainly using their phone toschedule things in the calendar, to make calls and occasionally to surf the Internetthrough WAP.
Test Procedure
The evaluation was performed close to Infocenter at KTH, from a spot about 100meters away from the entrance to a subway station and a bus stop. The subwayentrance and bus stops were clearly visible and participants knew well their loca-tions. Each participant began by writing down some information about himself orherself (age, occupation and how they were using their mobile phone). One of thetest leaders then introduced the participants to the usage scenario:
“You have just finished for the day and are heading home. As usualyou want to take the bus from the nearby bus stop. It is a foul weatheroutside, so you do not want to miss the bus. Unfortunately, since youhave not learned the timetable by memory, you do not know if you needto run to catch the bus. Therefore you take out your mobile phone andpoint it towards the bus stop. By pushing a button you immediately seethat the bus arrive in 2 minutes, so you will need to hurry if you do notwant to miss it.”
Each of the participants got to try out all three different applications: Time2Go,Touch2Go and Radar2Go. The order of testing was shifted between each group, sothat no group tested the applications in the same order as another group. Aftertesting each application, the participants were asked about thoughts and opinionsabout the application they just tested, and if there was something they thoughtwas bad, strange, good or that they would like to change. Opinions were recordedusing pen and paper. When all the applications had been tested, participants wereasked to compare the applications and to motivate which application they thoughtwere the easiest, fastest and most fun to use respectively and in the end whichapplication they preferred and why.
4.4.5 Results of the User Evaluations
Since the test in Uppsala had some flaws, the results from that user evaluation willnot be included here because their correctness cannot be guaranteed. Due to theseflaws, most of the results were small changes to the user interface and no conclusionswere drawn about the interaction or the hypothesis from this evaluation. Thereforethe rest of the results presented in this section will be based on the second userevaluation.
44
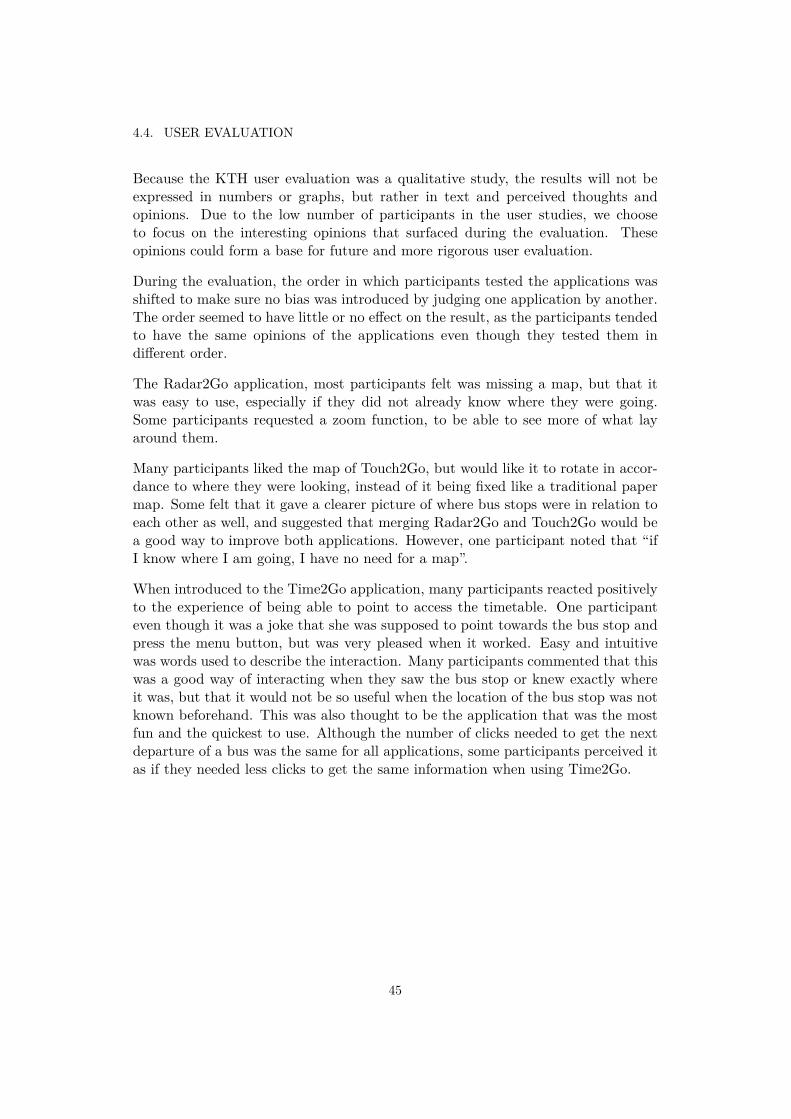
4.4. USER EVALUATION
Because the KTH user evaluation was a qualitative study, the results will not beexpressed in numbers or graphs, but rather in text and perceived thoughts andopinions. Due to the low number of participants in the user studies, we chooseto focus on the interesting opinions that surfaced during the evaluation. Theseopinions could form a base for future and more rigorous user evaluation.
During the evaluation, the order in which participants tested the applications wasshifted to make sure no bias was introduced by judging one application by another.The order seemed to have little or no effect on the result, as the participants tendedto have the same opinions of the applications even though they tested them indifferent order.
The Radar2Go application, most participants felt was missing a map, but that itwas easy to use, especially if they did not already know where they were going.Some participants requested a zoom function, to be able to see more of what layaround them.
Many participants liked the map of Touch2Go, but would like it to rotate in accor-dance to where they were looking, instead of it being fixed like a traditional papermap. Some felt that it gave a clearer picture of where bus stops were in relation toeach other as well, and suggested that merging Radar2Go and Touch2Go would bea good way to improve both applications. However, one participant noted that “ifI know where I am going, I have no need for a map”.
When introduced to the Time2Go application, many participants reacted positivelyto the experience of being able to point to access the timetable. One participanteven though it was a joke that she was supposed to point towards the bus stop andpress the menu button, but was very pleased when it worked. Easy and intuitivewas words used to describe the interaction. Many participants commented that thiswas a good way of interacting when they saw the bus stop or knew exactly whereit was, but that it would not be so useful when the location of the bus stop was notknown beforehand. This was also thought to be the application that was the mostfun and the quickest to use. Although the number of clicks needed to get the nextdeparture of a bus was the same for all applications, some participants perceived itas if they needed less clicks to get the same information when using Time2Go.
45


Chapter 5
Conclusions, Discussion and FutureWork
In this final chapter, the conclusions of the results will be presented along with adiscussion of different aspects of the work as a whole. The chapter is ended withsuggestions on future work to be performed or aspects of our work that would beinteresting to investigate further.
5.1 Conclusions
Since our user evaluations were qualitative studies, the conclusions drawn here arebased on our interpretations of comments and thoughts expressed by the partic-ipants of the user evaluation. As with any qualitative study, it is important toremember that the conclusions have been filtered by us as researchers and that ourpresence and questions might have affected the result. These conclusions are meantas a base for discussions and further research, and should not be seen as provedfacts.
5.1.1 Interaction Conclusions
No direct evaluation of the accuracy of the interaction technique was made, butduring the user evaluations, no user complained that they did not hit what theywanted. Neither have we experienced any difficulties while using nor testing thevarious prototypes created during the course of our work. While this is positive andmight suggest that the performance is not entirely bad, it is not possible to say if
47
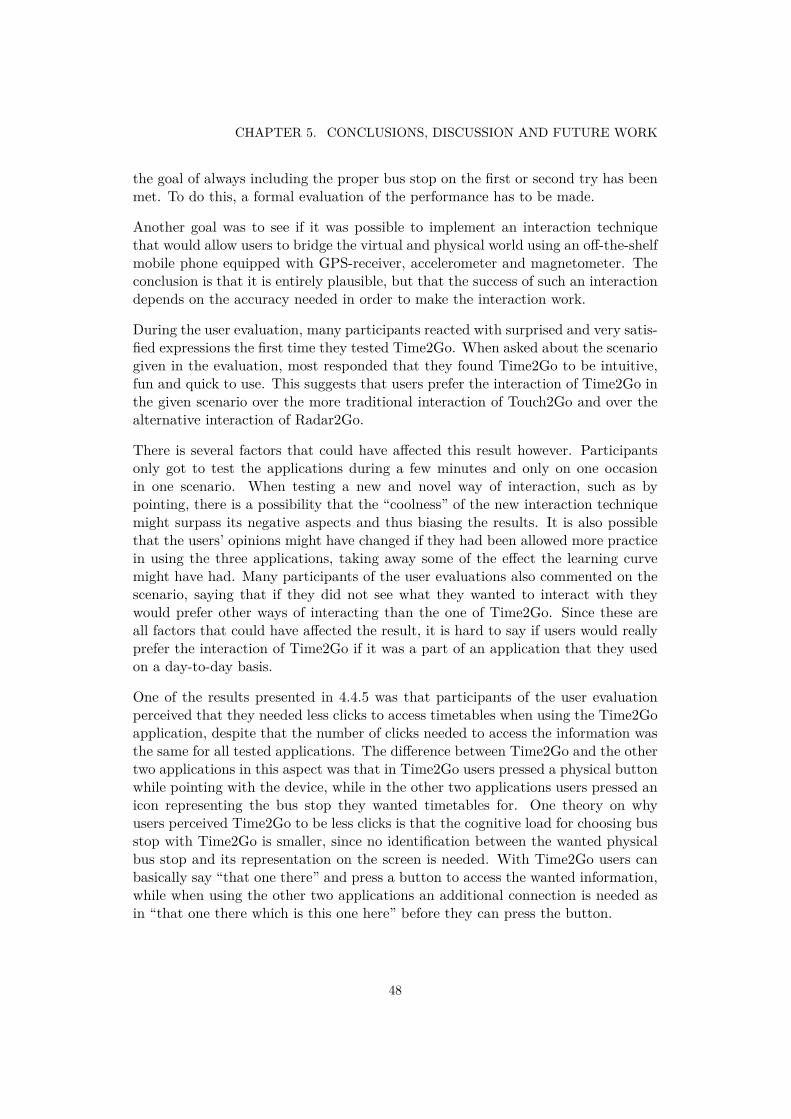
CHAPTER 5. CONCLUSIONS, DISCUSSION AND FUTURE WORK
the goal of always including the proper bus stop on the first or second try has beenmet. To do this, a formal evaluation of the performance has to be made.
Another goal was to see if it was possible to implement an interaction techniquethat would allow users to bridge the virtual and physical world using an off-the-shelfmobile phone equipped with GPS-receiver, accelerometer and magnetometer. Theconclusion is that it is entirely plausible, but that the success of such an interactiondepends on the accuracy needed in order to make the interaction work.
During the user evaluation, many participants reacted with surprised and very satis-fied expressions the first time they tested Time2Go. When asked about the scenariogiven in the evaluation, most responded that they found Time2Go to be intuitive,fun and quick to use. This suggests that users prefer the interaction of Time2Go inthe given scenario over the more traditional interaction of Touch2Go and over thealternative interaction of Radar2Go.
There is several factors that could have affected this result however. Participantsonly got to test the applications during a few minutes and only on one occasionin one scenario. When testing a new and novel way of interaction, such as bypointing, there is a possibility that the “coolness” of the new interaction techniquemight surpass its negative aspects and thus biasing the results. It is also possiblethat the users’ opinions might have changed if they had been allowed more practicein using the three applications, taking away some of the effect the learning curvemight have had. Many participants of the user evaluations also commented on thescenario, saying that if they did not see what they wanted to interact with theywould prefer other ways of interacting than the one of Time2Go. Since these areall factors that could have affected the result, it is hard to say if users would reallyprefer the interaction of Time2Go if it was a part of an application that they usedon a day-to-day basis.
One of the results presented in 4.4.5 was that participants of the user evaluationperceived that they needed less clicks to access timetables when using the Time2Goapplication, despite that the number of clicks needed to access the information wasthe same for all tested applications. The difference between Time2Go and the othertwo applications in this aspect was that in Time2Go users pressed a physical buttonwhile pointing with the device, while in the other two applications users pressed anicon representing the bus stop they wanted timetables for. One theory on whyusers perceived Time2Go to be less clicks is that the cognitive load for choosing busstop with Time2Go is smaller, since no identification between the wanted physicalbus stop and its representation on the screen is needed. With Time2Go users canbasically say “that one there” and press a button to access the wanted information,while when using the other two applications an additional connection is needed asin “that one there which is this one here” before they can press the button.
48
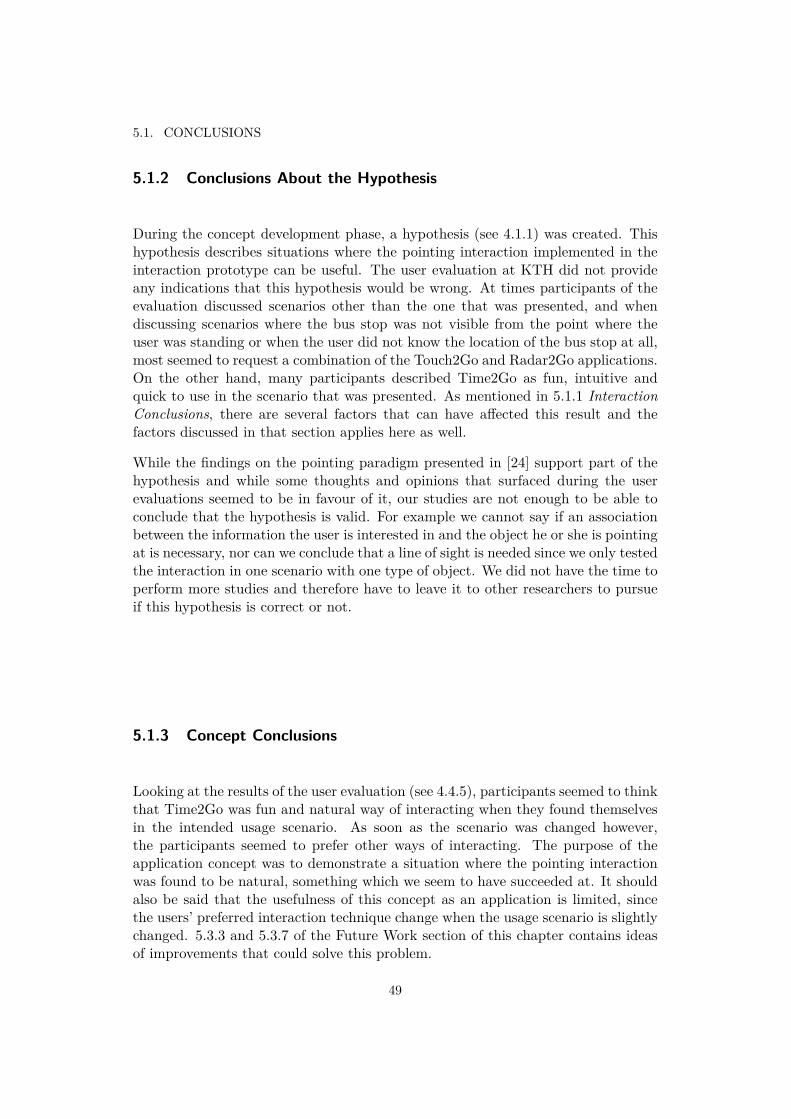
5.1. CONCLUSIONS
5.1.2 Conclusions About the Hypothesis
During the concept development phase, a hypothesis (see 4.1.1) was created. Thishypothesis describes situations where the pointing interaction implemented in theinteraction prototype can be useful. The user evaluation at KTH did not provideany indications that this hypothesis would be wrong. At times participants of theevaluation discussed scenarios other than the one that was presented, and whendiscussing scenarios where the bus stop was not visible from the point where theuser was standing or when the user did not know the location of the bus stop at all,most seemed to request a combination of the Touch2Go and Radar2Go applications.On the other hand, many participants described Time2Go as fun, intuitive andquick to use in the scenario that was presented. As mentioned in 5.1.1 InteractionConclusions, there are several factors that can have affected this result and thefactors discussed in that section applies here as well.
While the findings on the pointing paradigm presented in [24] support part of thehypothesis and while some thoughts and opinions that surfaced during the userevaluations seemed to be in favour of it, our studies are not enough to be able toconclude that the hypothesis is valid. For example we cannot say if an associationbetween the information the user is interested in and the object he or she is pointingat is necessary, nor can we conclude that a line of sight is needed since we only testedthe interaction in one scenario with one type of object. We did not have the time toperform more studies and therefore have to leave it to other researchers to pursueif this hypothesis is correct or not.
5.1.3 Concept Conclusions
Looking at the results of the user evaluation (see 4.4.5), participants seemed to thinkthat Time2Go was fun and natural way of interacting when they found themselvesin the intended usage scenario. As soon as the scenario was changed however,the participants seemed to prefer other ways of interacting. The purpose of theapplication concept was to demonstrate a situation where the pointing interactionwas found to be natural, something which we seem to have succeeded at. It shouldalso be said that the usefulness of this concept as an application is limited, sincethe users’ preferred interaction technique change when the usage scenario is slightlychanged. 5.3.3 and 5.3.7 of the Future Work section of this chapter contains ideasof improvements that could solve this problem.
49
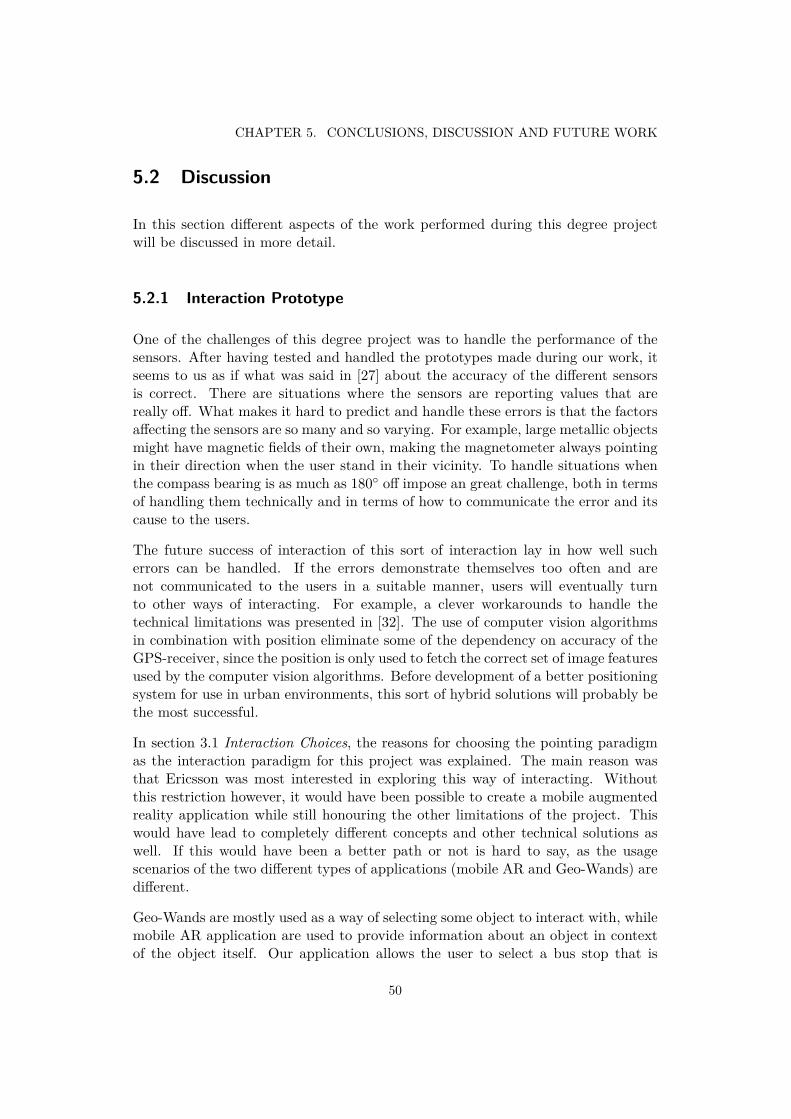
CHAPTER 5. CONCLUSIONS, DISCUSSION AND FUTURE WORK
5.2 Discussion
In this section different aspects of the work performed during this degree projectwill be discussed in more detail.
5.2.1 Interaction Prototype
One of the challenges of this degree project was to handle the performance of thesensors. After having tested and handled the prototypes made during our work, itseems to us as if what was said in [27] about the accuracy of the different sensorsis correct. There are situations where the sensors are reporting values that arereally off. What makes it hard to predict and handle these errors is that the factorsaffecting the sensors are so many and so varying. For example, large metallic objectsmight have magnetic fields of their own, making the magnetometer always pointingin their direction when the user stand in their vicinity. To handle situations whenthe compass bearing is as much as 180◦ off impose an great challenge, both in termsof handling them technically and in terms of how to communicate the error and itscause to the users.
The future success of interaction of this sort of interaction lay in how well sucherrors can be handled. If the errors demonstrate themselves too often and arenot communicated to the users in a suitable manner, users will eventually turnto other ways of interacting. For example, a clever workarounds to handle thetechnical limitations was presented in [32]. The use of computer vision algorithmsin combination with position eliminate some of the dependency on accuracy of theGPS-receiver, since the position is only used to fetch the correct set of image featuresused by the computer vision algorithms. Before development of a better positioningsystem for use in urban environments, this sort of hybrid solutions will probably bethe most successful.
In section 3.1 Interaction Choices, the reasons for choosing the pointing paradigmas the interaction paradigm for this project was explained. The main reason wasthat Ericsson was most interested in exploring this way of interacting. Withoutthis restriction however, it would have been possible to create a mobile augmentedreality application while still honouring the other limitations of the project. Thiswould have lead to completely different concepts and other technical solutions aswell. If this would have been a better path or not is hard to say, as the usagescenarios of the two different types of applications (mobile AR and Geo-Wands) aredifferent.
Geo-Wands are mostly used as a way of selecting some object to interact with, whilemobile AR application are used to provide information about an object in contextof the object itself. Our application allows the user to select a bus stop that is
50

5.2. DISCUSSION
of interest, while an AR-version of the same concept would provide information ofinterest in connection to the image of the bus stop in the camera feed on the phonesscreen. In this scenario, the difference lay in where the user is keeping his or herfocus. With the Geo-Wand, the focus is on the real world, while with a mobile ARapplication the focus would be on the screen of the phone1. A problem with using amobile AR application would also be how to show the necessary information on thecamera feed in connection to the bus stop. Larger bus stops in Uppsala have severaltens of buses departing from them, and showing them all on the screen would notbe feasible.
5.2.2 Concept Development
Seen from a Human-Computer Interaction (HCI) point of view, the process of con-cept development in this project was in some ways backwards. In HCI, it is muchmore common to start with users, usage scenarios or a product to improve andcreate a product or improvement from there by observing or talking to users. Inthis project, we were given a technique and were asked to find situations and usersthat would benefit from it. To me, this way of working when developing productsfor the end user market seems a bit wrong. It is great to have another type ofinteraction to use as a tool for solving HCI problems, but it seems better to startfrom the users point of view and find the right tool for them, rather than trying tofind the right users or situation for the tool. By starting with the solution in somesense, you have to work to find a problem that you believe, but cannot know forsure, users have. I believe that working in this manner, it is much harder to finda good match between users and technique which makes interaction flow natural.When working with the user in focus, it is possible to identify problems users reallyhave and then work to solve these in the best possible way.
Partially due to this, the final concept and application that became the result ofthe concept development would most likely not on itself be a useful application.The problem solved by the application is a small one, one that users might notexperience that often. If this is the case, it could partially explain why some partic-ipants had a hard time staying with the scenarios presented in the user evaluations.They could not identify themselves with the problem the application solved, sinceit was a problem that they seldom or never had encountered themselves. The wholeapplication is built to solve a very specific problem, to give users information aboutdeparture times when they are within viewing distance from the bus stop, and thususers naturally suggest improvements to the application that would make it moreuseful to them. In this sense, maybe the nightclub concept would have been moresuccessful, as its usage scenario might be one that users are more familiar with andexperience more often.
1Using a head-mounted display was not an alternative during this project.
51
CHAPTER 5. CONCLUSIONS, DISCUSSION AND FUTURE WORK
5.2.3 User Evaluation
Even though some conclusions and improvements could be made from the userevaluations, there is plenty of room for improvements in this part of our work.Our inexperience in designing and executing user evaluations resulted in evaluationswhere it was not entirely clear what had been tested, especially during the evaluationin Uppsala. The results obtained mostly consisted of our interpretations of whatthe participants said and from this it is hard to draw any valid conclusions on howthe interaction really performed. Of course time constraints were also a factor here,as doing user evaluations were only a small portion of the total work performed.Despite this, I think this part of the project could be improved with better planningand more thought through user evaluations.
5.3 Future Work
In this section we will present a few different directions we would have liked toexplore or that we would have pursued if we were to continue working on thisproject.
5.3.1 Error Prediction for Sensors
Two of the methods for intersection calculations developed during this project in-cluded a mechanism to compensate for errors in sensor values. This mechanism wasnot tested in this project. It would be interesting to perform some testing on howwell it works. The problem was, as it turned out, that it is hard to estimate theerrors in the sensor values in a good way. Future work could be to find better waysof estimating these errors, especially for the error in GPS-position which seemed tohave the largest negative impact on the application performance.
5.3.2 Evaluation of the Hypothesis
In section 5.1.2, conclusions about the hypothesis were presented. The main findingwas that the evaluations performed during the project were not enough to be ableto conclude anything about the hypothesis. Nothing was found that contradictedthe hypothesis, but the evaluations performed were not carefully enough planed toextensively test it. Performing a carefully planed evaluation of this hypothesis couldprovide valuable insight into its validity. If proved to be correct, it could providegreat help when deciding whether to use the pointing interaction or not in a serviceor application.
52

5.3. FUTURE WORK
5.3.3 Other Concepts
In the concept development phase of the project, four different concepts were devel-oped, but only one made it into a real application. After developing and evaluatingthe public transportation concept, we found out that this might not be the best ap-plication area for this type of interaction. Because of the lack of time we could notexplore the other concept ideas further, but we believe that especially the nightclubidea might have a potential to be a concept which users will find more useful. Bynot restricting the concept development process to only include concepts that aretechnically possible to implement today and to applications which should be readyto be used right after they have been downloaded, new and maybe more innovativeuses of this interaction technique might be found.
5.3.4 Radar2Go and Touch2Go Combined
Many participants in the user evaluation at KTH suggested that they would haveliked to combine Radar2Go and Touch2Go. They liked that the orientation ofRadar2Go always showed what they were looking at, but missed the map of theTouch2Go application. A future study on how Time2Go fair against such a systemcould be an interesting comparison. Researching this might also provide useful guidelines that could be used when developing applications that implement a scanning-like way of interaction for interacting with objects connected to a geographicalposition. Due to technical limitations in the map used in this project, it was notpossible to test such a combination.
5.3.5 Extend Time2Go
As mentioned in the discussion about concept development (see section 5.2.2), theTime2Go application solve a small problem that users might not experience thatoften. To extend Time2Go and turn it into a complete travel planer could be aninteresting way to continue the work performed in this degree project. In such anextension, the current functionality of Time2Go could be one of several alternativesto plan a journey, where the user could select the start or end point of a journeyby pointing towards the intended bus stop. Extended functionality could includethe ability to plan a whole journey, being able to save destinations or departuresas favourites and to see information about traffic disturbances and cancelled de-partures. Combining Time2Go, Radar2Go and Touch2Go together might even bean alternative, to let users choose the way of interaction that they prefer and tosupport more usage scenarios. Minor improvements to Time2Go could be to allowusers to sort the list of buses and bus stops to their liking or to see more departuresin the detailed view.
53

CHAPTER 5. CONCLUSIONS, DISCUSSION AND FUTURE WORK
5.3.6 Interaction Paradigms in an Outdoor Environment
In [24], Rukzio et al. tested the touching, pointing and scanning paradigms inan indoor smart environment and suggested that the pointing paradigm would bemost successful when users see the object they want to interact with but are notclose enough to touch it. They also concluded that users try to avoid the scanningparadigm if possible in this context, but the result from our user evaluations indi-cated that for an outdoor environment, this might not always be the case. Userseemed to request a scanning-like interface when they did not know beforehandwhere they were going, or if they did not have a line of sight to the object. Fur-ther studies to evaluate the three paradigms in an outdoor environment would beinteresting to see.
5.3.7 Pointing as a Complementary Interaction Technique
During the concept development phase of the project we tried to find concepts wherepointing interaction would be the main way of interacting. Although we found a fewconcept where this could be true, we also believe that these concepts would benefiteven more from a mix of interaction techniques. Having more than one interactiontechnique available, users could choose the technique they feel is the most naturaland best suited to the present situation. Such a mix of interaction technique couldprove to be more powerful than the individual interaction techniques and we thinkpointing interaction would constitute a good alternative interaction technique to beused in special situations. Possible future work could be to evaluate the pointinginteraction as a complementary interaction technique, instead of trying to use it asthe main interaction technique, which was the case in this project.
54
Bibliography
[1] Adams, A. Gelfand, N. and Pulli, K. 2007. Viewfinder Align-ment. Computer Graphics Forum, 27 (2), pp. 597-606. DOI=http://dx.doi.org/10.1111/j.1467-8659.2008.01157.x
[2] Ailisto, H., Pohjanheimo, L., Välkkynen, P., Strömmer, E.,Tuomisto, T., and Korhonen, I. 2006. Bridging the physicaland virtual worlds by local connectivity-based physical selection.Personal and Ubiquitous Computing 10 (6), pp. 333-344. DOI=http://dx.doi.org/10.1007/s00779-005-0057-0
[3] Azuma, R. T. 1997. A survey of augmented reality. In Presence: Tele-operators and Virtual Environments, 6 (4), pp. 355-385.
[4] Buettner, M. and Wetherall, D. 2008. An empirical studyof UHF RFID performance. In Proceedings of the 14th ACMinternational Conference on Mobile Computing and Network-ing (San Francisco, California, USA, September 14 - 19,2008). MobiCom ’08. ACM, New York, NY, 223-234. DOI=http://doi.acm.org/10.1145/1409944.1409970
[5] Caruso M.J. 2000. Applications of Magnetic Sensors for Low CostCompass Systems. In Proceedings of IEEE Positioning, Location,and Navigation Symposium (San-Diego, USA, March 13-16, 2000).PLANS. pp 177-184.
[6] Cuellar, G., Eckles, D., and Spasojevic, M. 2008. Photos forinformation: a field study of cameraphone computer vision in-teractions in tourism. In CHI ’08 Extended Abstracts on Hu-man Factors in Computing Systems (Florence, Italy, April 05- 10, 2008). CHI ’08. ACM, New York, NY, 3243-3248. DOI=http://doi.acm.org/10.1145/1358628.1358838
[7] Egenhofer, M. J. Spatial Information Appliances: A Next Genera-tion of Geographic Information Systems. 1st Brazilian Workshop onGeoInformatics, 1999.
55
BIBLIOGRAPHY
[8] Fitzmaurice, G. W. 1993. Situated information spaces and spatiallyaware palmtop computers. Commun. ACM 36, 7 (Jul. 1993), 39-49.DOI= http://doi.acm.org/10.1145/159544.159566
[9] Google Corporation, 2010. Google Goggles for Andriod. [Online]Available at: http://www.google.com/mobile/goggles/[Accessed 22 March 2010].
[10] Henze, N., Reiners, R., Righetti, X., Rukzio, E., and Boll,S. 2008. Services surround you: Physical-virtual linkage withcontextual bookmarks. The Visual Computer: InternationalJournal of Computer Graphics 24 (7), pp. 847-855. DOI=http://dx.doi.org/10.1007/s00371-008-0266-4
[11] Kähäri, M., Murphy, D. J. 2006. MARA - Sensor Based AugmentedReality System for Mobile Imaging Device. Demonstrated during In-ternational Symposium on Mixed and Augmented Reality Demonsta-tion (Santa Barbara, USA, October 22 - 25, 2006). ISMAR06.
[12] Kato, H. and Tan, K. T. 2007. Pervasive 2D Barcodes for CameraPhone Applications. IEEE Pervasive Computing 6, 4 (Oct. 2007),76-85. DOI= http://dx.doi.org/10.1109/MPRV.2007.80
[13] Löfström, J. (In press). Physical Mobile Interaction Design forSpatially-Aware Pointing. Master Thesis in Human Computer Inter-action at the School of Computer Science and Engineering. RoyalInstitute of Technology in Stockholm, Sweden.
[14] Nokia Corporation, 2009. Nokia Indoor Positioning. [Online]Available at: http://www.nokia.com/technology/upcoming-innovations/indoor-positioning[Accessed 18 September 2009].
[15] Nokia Corporation, 2010. Nokia Point & Find. [Online]Available at: http://pointandfind.nokia.com/[Accessed 22 March 2010].
[16] Nokia Corporation, 2009. Nokia Press Bulletin Board - MobileIndoor Positioning trial launched at Kamppi Shopping Centre inHelsinki. [Online] (Published June 4, 2009)Available at: http://pressbulletinboard.nokia.com/2009/06/04/mobile-indoor-positioning-trial-launched-at-kamppi-shopping-center-in-helsinki/[Accessed 18 September 2009].
[17] Olwal, A. 2009. Augmenting Surface Interaction through Context-Sensitive Mobile Devices. In Proceedings of the 12th IFIP TC 13
56
BIBLIOGRAPHY
International Conference on Human-Computer Interaction: Part II(INTERACT ’09), Tom Gross, Jan Gulliksen, Paula Kotz, LarsOestreicher, Philippe Palanque, Raquel Oliveira Prates, and MarcoWinckler (Eds.). Springer-Verlag, Berlin, Heidelberg, 336-339. DOI=http://dx.doi.org/10.1007/978-3-642-03658-3_39
[18] Piekarski, W. and Thomas, B. 2002. ARQuake: the outdoor aug-mented reality gaming system. Commun. ACM 45, 1 (Jan. 2002),36-38. DOI= http://doi.acm.org/10.1145/502269.502291
[19] Pohjanheimo, L., Keränen, H., and Ailisto, H. 2005. Imple-menting touchme paradigm with a mobile phone. In Proceed-ings of the 2005 Joint Conference on Smart Objects and Am-bient intelligence: innovative Context-Aware Services: Usagesand Technologies (Grenoble, France, October 12 - 14, 2005).sOc-EUSAI ’05, vol. 121. ACM, New York, NY, 87-92. DOI=http://doi.acm.org/10.1145/1107548.1107576
[20] Sharp, H., Rogers, Y., and Preece, J. 2007 Interaction Design: Be-yond Human Computer Interaction. John Wiley & Sons.
[21] Rekimoto, J. 1998. Matrix: A Realtime Object Identification andRegistration Method for Augmented Reality. In Proceedings of theThird Asian Pacific Computer and Human interaction (July 15 - 17,1998). APCHI. IEEE Computer Society, Washington, DC, 63. DOI=http://doi.ieeecomputersociety.org/10.1109/APCHI.1998.704151
[22] Rekimoto, J. and Nagao, K. 1995. The world through the computer:computer augmented interaction with real world environments. InProceedings of the 8th Annual ACM Symposium on User interfaceand Software Technology (Pittsburgh, Pennsylvania, United States,November 15 - 17, 1995). UIST ’95. ACM, New York, NY, 29-36.DOI= http://doi.acm.org/10.1145/215585.215639
[23] Robinson, S., Eslambolchilar, P., and Jones, M. 2008. Point-to-GeoBlog: gestures and sensors to support user generated con-tent creation. In Proceedings of the 10th international Confer-ence on Human Computer interaction with Mobile Devices andServices (Amsterdam, The Netherlands, September 02 - 05,2008). MobileHCI ’08. ACM, New York, NY, 197-206. DOI=http://doi.acm.org/10.1145/1409240.1409262
[24] Rukzio, E. Leichtenstern, K. Callaghan, V. Holleis, P. Schmidt, A.and Chin, J. 2006. An Experimental Comparison of Physical MobileInteraction Techniques: Touching, Pointing and Scanning. In Pro-ceedings of the 8th International Conference on Ubiquitous Comput-ing (Orange County, CA, USA, September 17-21, 2006). I. Smith,
57

BIBLIOGRAPHY
M. Y. Chen, F. Vahid, A. LaMarca, S. Benford, S. N. Patel, S.Consolvo, G. D. Abowd, J. Hightower and T. Sohn, Eds. Ubi-Comp 2006, vol. 4206. Springer Berlin / Heidelberg, 87-104. DOI=http://dx.doi.org/10.1007/11853565_6
[25] Schuler, R. P., Laws, N., Bajaj, S., Grandhi, S. A., andJones, Q. 2007. Finding your way with CampusWiki: a location-aware wiki. In CHI ’07 Extended Abstracts on Human Factorsin Computing Systems (San Jose, CA, USA, April 28 - May03, 2007). CHI ’07. ACM, New York, NY, 2639-2644. DOI=http://doi.acm.org/10.1145/1240866.1241055
[26] Simon, R. and Fröhlich, P. 2007. A mobile application frameworkfor the geospatial web. In Proceedings of the 16th internationalConference on World Wide Web (Banff, Alberta, Canada, May 08- 12, 2007). WWW ’07. ACM, New York, NY, 381-390. DOI=http://doi.acm.org/10.1145/1242572.1242624
[27] Simon, R. and Fröhlich, P. 2008. GeoPointing: Evaluating the Perfor-mance of an Orientation Aware Location Based Service under Real-World Conditions. Journal of Location Based Services, 2 (1), pp. 24-40. DOI= http://dx.doi.org/10.1080/17489720802347986
[28] Simon, R. Fröhlich, P. Obernberger, G. and Wittowetz, E. 2007. ThePoint to Discover GeoWand. In Proceedings of the 9th InternationalConference on Ubiquitous Computing (Innsbruck, Austria, September16 - 19, 2007). UbiComp ’07. Springer LNCS.
[29] Strachan, S. and Murray-Smith, R. 2008. Bearing-Based Selection inMobile Spatial Interaction. Personal and Ubiquitous Computing, 13(4), pp. 265-280. DOI= http://dx.doi.org/10.1007/s00779-008-0205-4
[30] Sutherland, I. E. 1968. A head-mounted three dimensional display.In Proceedings of the December 9-11, 1968, Fall Joint ComputerConference, Part I (San Francisco, California, December 09 - 11,1968). AFIPS ’68 (Fall, part I). ACM, New York, NY, 757-764. DOI=http://doi.acm.org/10.1145/1476589.1476686
[31] Swindells, C., Inkpen, K. M., Dill, J. C., and Tory, M. 2002. That onethere! Pointing to establish device identity. In Proceedings of the 15thAnnual ACM Symposium on User interface Software and Technology(Paris, France, October 27 - 30, 2002). UIST ’02. ACM, New York,NY, 151-160. DOI= http://doi.acm.org/10.1145/571985.572007
[32] Takacs, G., Chandrasekhar, V., Gelfand, N., Xiong, Y., Chen, W.,Bismpigiannis, T., Grzeszczuk, R., Pulli, K., and Girod, B. 2008.
58

BIBLIOGRAPHY
Outdoors augmented reality on mobile phone using loxel-based vi-sual feature organization. In Proceeding of the 1st ACM internationalConference on Multimedia information Retrieval (Vancouver, BritishColumbia, Canada, October 30 - 31, 2008). MIR ’08. ACM, New York,NY, 427-434. DOI= http://doi.acm.org/10.1145/1460096.1460165
[33] Välkkynen, P. Korhonen, I. Plomp, J. Tuomisto, T. Cluitmans, L.Ailisto, H. Seppä, H. 2003. A User Interaction Paradigm fro PhysicalBrowsing and Near-Object Control Based on Tags. In Proceedings ofPhysical Interaction Workshop on Realworld User Interfaces (Udine,Italy, September 2003).
[34] Välkkynen, P., Niemelä, M., and Tuomisto, T. 2006. Evaluatingtouching and pointing with a mobile terminal for physical browsing.In Proceedings of the 4th Nordic Conference on Human-Computerinteraction: Changing Roles (Oslo, Norway, October 14 - 18, 2006).A. Mørch, K. Morgan, T. Bratteteig, G. Ghosh, and D. Svanaes,Eds. NordiCHI ’06, vol. 189. ACM, New York, NY, 28-37. DOI=http://doi.acm.org/10.1145/1182475.1182479
[35] Wagner, D. and Schmalstieg, D. 2003. First Steps Towards Hand-held Augmented Reality. In Proceedings of the 7th IEEE inter-national Symposium on Wearable Computers (October 21 - 23,2003). ISWC. IEEE Computer Society, Washington, DC, 127. DOI=http://doi.ieeecomputersociety.org/10.1109/ISWC.2003.1241402
[36] Wang, J., Zhai, S., and Canny, J. 2006. Camera phone based motionsensing: interaction techniques, applications and performance study.In Proceedings of the 19th Annual ACM Symposium on User interfaceSoftware and Technology (Montreux, Switzerland, October 15 - 18,2006). UIST ’06. ACM, New York, NY, 101-110.DOI= http://doi.acm.org/10.1145/1166253.1166270
[37] Want, R., Fishkin, K. P., Gujar, A., and Harrison, B. L. 1999. Bridg-ing physical and virtual worlds with electronic tags. In Proceedings ofthe SIGCHI Conference on Human Factors in Computing Systems:the CHI Is the Limit (Pittsburgh, Pennsylvania, United States, May15 - 20, 1999). CHI ’99. ACM, New York, NY, 370-377.DOI= http://doi.acm.org/10.1145/302979.303111
[38] Ka-Ping Yee. 2003. Peephole displays: pen interaction on spatiallyaware handheld computers. In Proceedings of the SIGCHI conferenceon Human factors in computing systems (CHI ’03). ACM, New York,NY, USA, 1-8. DOI= http://doi.acm.org/10.1145/642611.642613
59

Appendix A
Business Models
This appendix will provide the interested reader with a short and entirely unscientificlook at the business models currently used by available commercial applications. Thissection does not contain any information critical to understanding the rest of thereport and can easily be skipped.
None of the companies developing AR browsers or Geo-Wands today seem to wantto charge users directly. Instead, they will be charging content providers for lettingthem use their platforms to reach customers or to appear in beneficial spots in theapplications themselves. One of the founders of Layar, Maarten Lens-FitzGerald,suggested in an interview1 that Layar could charge developers an administration feeand that developers eventually would pay to get a spot in the “featured layer” sectionof Layar when the amount of layers available to users is large enough. Building onthe idea of administration fees, Nokia has in their Point & Find application createda management portal to which content providers can subscribe for a fee. Using thisportal, they can add and edit content that then users of the program can access.
Another possible business model is to offer other companies tailor made applicationsthat utilize the powers of Geo-Wands and AR browsers. These applications couldbe offered as a way of exploring the companies’ products, or as part of a broaderadvertisement campaign to advertise for example a new movie of product.
1http://www.fastcompany.com/blog/kit-eaton/technomix/layar-web-browser-reality-coming-soon-iphone
61

TRITA-CSC-E 2010:068 ISRN-KTH/CSC/E--10/068--SE
ISSN-1653-5715
www.kth.se