augmented force feedback to facilitate target acquisition in human-computer interaction ·...
TRANSCRIPT

Augmented force feedback to facilitate target acquisitionin human-computer interactionKeuning - van Oirschot, H.
DOI:10.6100/IR570878
Published: 01/01/2003
Document VersionPublisher’s PDF, also known as Version of Record (includes final page, issue and volume numbers)
Please check the document version of this publication:
• A submitted manuscript is the author's version of the article upon submission and before peer-review. There can be important differencesbetween the submitted version and the official published version of record. People interested in the research are advised to contact theauthor for the final version of the publication, or visit the DOI to the publisher's website.• The final author version and the galley proof are versions of the publication after peer review.• The final published version features the final layout of the paper including the volume, issue and page numbers.
Link to publication
Citation for published version (APA):Keuning - van Oirschot, H. (2003). Augmented force feedback to facilitate target acquisition in human-computerinteraction Eindhoven: Technische Universiteit Eindhoven DOI: 10.6100/IR570878
General rightsCopyright and moral rights for the publications made accessible in the public portal are retained by the authors and/or other copyright ownersand it is a condition of accessing publications that users recognise and abide by the legal requirements associated with these rights.
• Users may download and print one copy of any publication from the public portal for the purpose of private study or research. • You may not further distribute the material or use it for any profit-making activity or commercial gain • You may freely distribute the URL identifying the publication in the public portal ?
Take down policyIf you believe that this document breaches copyright please contact us providing details, and we will remove access to the work immediatelyand investigate your claim.
Download date: 20. Jun. 2018

Augmented force feedback tofacilitate target acquisition in
Human-Computer Interaction

The work described in this thesis has been carried out under the auspices ofthe J. F. Schouten School for User-System Interaction Research.
c�
2003 Hilde Keuning - Eindhoven - The Netherlands.
CIP-DATA LIBRARY TECHNISCHE UNIVERSITEIT EINDHOVEN
Keuning, H.
Augmented force feedback to facilitate target acquisition in Human-ComputerInteraction / by Hilde Keuning. — Eindhoven: Technische Universiteit Eindhoven,2003. — Proefschrift. —ISBN 90-386-1698-8NUR 770Keywords: Human-computer interaction / force feedback / target acquisition /pointing device / motor control
Printing: Universiteitsdrukkerij Technische Universiteit Eindhoven.

Augmented force feedback tofacilitate target acquisition in
Human-Computer Interaction
PROEFSCHRIFT
ter verkrijging van de graad van doctor aan deTechnische Universiteit Eindhoven, op gezag van deRector Magnificus, prof.dr. R.A. van Santen, voor een
commissie aangewezen door het College voorPromoties in het openbaar te verdedigen
op woensdag 22 oktober 2003 om 16.00 uur
door
Hilde Keuning
geboren te Eindhoven

Dit proefschrift is goedgekeurd door de promotoren:
prof.dr A.J.M. Houtsmaenprof.dr. G.P. van Galen

Contents
1 Introduction 1
1.1 Feedback in Human-Computer Interaction . . . . . . . . . . . . . 2
1.2 Pointing . . . . . . . . . . . . . . . . . . . . . . . . . . . . . . . . . 3
1.2.1 Input devices . . . . . . . . . . . . . . . . . . . . . . . . . . 4
1.2.2 Movement kinematics and the use of feedback in a target-acquisition task . . . . . . . . . . . . . . . . . . . . . . . . . 4
1.3 Touch . . . . . . . . . . . . . . . . . . . . . . . . . . . . . . . . . . . 7
1.4 Haptic feedback in HCI . . . . . . . . . . . . . . . . . . . . . . . . . 9
1.4.1 The force-feedback trackball . . . . . . . . . . . . . . . . . . 11
1.5 Plan of this thesis . . . . . . . . . . . . . . . . . . . . . . . . . . . . 12
2 Predictability of direction and distance of mouse versus trackball-controlled cursor movements 15
2.1 Introduction . . . . . . . . . . . . . . . . . . . . . . . . . . . . . . . 16
2.1.1 Predicting path direction . . . . . . . . . . . . . . . . . . . . 16
2.1.2 Predicting path length . . . . . . . . . . . . . . . . . . . . . 17
2.2 Experiment 1 . . . . . . . . . . . . . . . . . . . . . . . . . . . . . . . 19
2.2.1 Method . . . . . . . . . . . . . . . . . . . . . . . . . . . . . . 19
2.2.2 Results . . . . . . . . . . . . . . . . . . . . . . . . . . . . . . 22
2.2.3 Discussion . . . . . . . . . . . . . . . . . . . . . . . . . . . . 24
2.3 Experiment 2 . . . . . . . . . . . . . . . . . . . . . . . . . . . . . . . 27
v

Contents
2.3.1 Method . . . . . . . . . . . . . . . . . . . . . . . . . . . . . . 27
2.3.2 Results . . . . . . . . . . . . . . . . . . . . . . . . . . . . . . 28
2.3.3 Discussion . . . . . . . . . . . . . . . . . . . . . . . . . . . . 33
2.4 Conclusion . . . . . . . . . . . . . . . . . . . . . . . . . . . . . . . . 34
3 The shape of augmented force-feedback fields and the efficiency andsatisfaction in target acquisition 37
3.1 Introduction . . . . . . . . . . . . . . . . . . . . . . . . . . . . . . . 38
3.1.1 The set of force fields to be compared . . . . . . . . . . . . . 40
3.2 The experiment . . . . . . . . . . . . . . . . . . . . . . . . . . . . . 43
3.2.1 Method . . . . . . . . . . . . . . . . . . . . . . . . . . . . . . 43
3.2.2 Results . . . . . . . . . . . . . . . . . . . . . . . . . . . . . . 46
3.2.3 Discussion . . . . . . . . . . . . . . . . . . . . . . . . . . . . 49
3.3 Conclusion . . . . . . . . . . . . . . . . . . . . . . . . . . . . . . . . 53
3.A Appendix: Written instructions . . . . . . . . . . . . . . . . . . . . 55
4 The role of size of an augmented force field in computer-aided target-acquisition tasks 57
4.1 Introduction . . . . . . . . . . . . . . . . . . . . . . . . . . . . . . . 58
4.2 Experiment 1 . . . . . . . . . . . . . . . . . . . . . . . . . . . . . . . 60
4.2.1 Method . . . . . . . . . . . . . . . . . . . . . . . . . . . . . . 60
4.2.2 Results . . . . . . . . . . . . . . . . . . . . . . . . . . . . . . 63
4.2.3 Discussion and conclusion . . . . . . . . . . . . . . . . . . . 64
4.3 Experiment 2 . . . . . . . . . . . . . . . . . . . . . . . . . . . . . . . 65
4.3.1 Method . . . . . . . . . . . . . . . . . . . . . . . . . . . . . . 65
4.3.2 Results . . . . . . . . . . . . . . . . . . . . . . . . . . . . . . 68
4.3.3 Discussion and conclusion . . . . . . . . . . . . . . . . . . . 70
vi

Contents
5 Profits and costs of augmented force feedback via an iterative predic-tion procedure 73
5.1 Introduction . . . . . . . . . . . . . . . . . . . . . . . . . . . . . . . 74
5.2 Experiment . . . . . . . . . . . . . . . . . . . . . . . . . . . . . . . . 75
5.2.1 Method . . . . . . . . . . . . . . . . . . . . . . . . . . . . . . 75
5.2.2 Results . . . . . . . . . . . . . . . . . . . . . . . . . . . . . . 78
5.2.3 Discussion and conclusion . . . . . . . . . . . . . . . . . . . 81
6 General discussion 83
Bibliography 89
Summary 95
Samenvatting 97
Dankwoord 100
Curriculum Vitae 101
vii

Contents
viii

1Introduction

1 Introduction
1.1 Feedback in Human-Computer Interaction
Evolution allowed people to survive on this earth by equipping them with fivesenses to directly pick up information about the external and internal environ-ment they (inter)act in and with. Each action directly changes a person’s relationwith the environment. This also means that people need to receive direct feed-back concerning their actions. For example, when you cross a street then youpick up visual feedback about the remaining distance, the correctness of your di-rection and the presence of obstacles, you receive auditory feedback about someobjects in your neighborhood (e.g. cars, dogs), you get proprioceptive feedbackabout the movements of your body and whether it is in balance or not and youmay even receive olfactory feedback about some objects (e.g. exhaust fumesfrom busses). Technology gave people computers. This technological environ-ment of Human-Computer Interaction (HCI) is developing to take in more andmore of the five human senses to give information about the system’s state, bothquantitatively and qualitatively. The first computers were command driven andshowed only text on a plain background. A command, representing an action,had to be run and after a while feedback was available via text. So, there was noone-to-one mapping of action and feedback. Only expert users who knew theinternal working of the machine could understand how to work with those ma-chines. When the production of computers became faster and cheaper, and thegeneral public started to use them for daily work, usability became an importantissue. Especially the introduction of Graphical User Interfaces (GUIs), togetherwith the mouse, made computers rapidly more accessible to everyone. The in-ternal working of the machine is, or should be, of no concern to the averagecomputer user nowadays (Preece, 1994). What is important, is that an action di-rectly leads to feedback, preferably the feedback the user is expecting. The lattermeans that it should be clear to the user what action will lead to what state of thesystem. This is related to the distance between the cognitive model of the worldof action that the user uses and the actual world of action in HCI. Decreasingthis distance increases the feeling of directness (Hutchins, Hollan, & Norman,1986). The feeling of directness concerns the input and output of informationand is twofold: semantic and articulatory. Semantic directness on the input siderequires that it is clear what action has to be performed to reach a goal. On theoutput side it requires that it becomes clear whether or not, or to what extent,a goal has been reached. Articulatory directness has to do with how an actionhas to be performed and how a system communicates its state. These require-ments have been worked out by presenting icons, representing objects, which
2

1.2 Pointing
can be manipulated by controlling a cursor with a mouse. This was termed ’di-rect manipulation’ by Shneiderman (1983). For example, double clicking whenthe cursor is on an icon representing an application, makes the application startrunning. The articulatory directness increases when the visual feedback is ex-tended with other kinds of feedback. For example, a sound can be given whena program can not be started.Another sense that is of increasing interest in HCI is the sense of touch. Inte-grating touch in a computer interface can be achieved by applying forces to thehand and fingers via the input device (for an overview of such devices see Vo-gels, 1999). Input or pointing devices that can stimulate the sense of touch arealso called force-feedback, haptic, tactile or tactual devices. In section 1.4 thedifferent meanings of these terms will be explained. Until then all touch stim-ulating devices will be referred to as haptic devices. Haptic feedback is nowavailable for limited applications like games, medical training, several virtualreality systems and computer use for the blind. But haptic feedback could alsobe used in everyday computer use for the sighted, not only to feel objects thatare already visible on the screen, but also to point at objects more efficiently.
1.2 Pointing
Pointing is a way of communicating one’s focus of attention (Douglas & Mithal,1997). The precision of the act of pointing depends on the amount of attentionwanted, the size of the object or the discernibility of the object. Often a textis added to help a listener to focus and to communicate a wish. For example:”Could you please open that black box for me?”, helps the listener to find thebox of interest and tells him that the speaker wants him to do something withit. In this sense it is somewhat peculiar that computer input devices, like mouse,joystick and trackball, have become known as pointing devices. In this thesis Iprefer to use the term ’input device’. Their function is not only to point, but alsoto communicate a command. Commands are given by pressing a button on theinput device when the cursor is situated on the object of interest. How long andhow often the button is pressed determines the command given to the computer.On most systems the default setting to open an application is to double-click onthe object representing it. On some systems a single click is appropriate. Wewill refer to the combination of moving the point of the cursor towards the areaof a visual object on the computer screen and activating it by clicking once as a’target-acquisition task’.
3

1 Introduction
1.2.1 Input devices
Input devices differ in the way in which cursor movement can be controlled.This can be achieved by moving the hand (mouse), rotating the wrist (joystick)or moving one or more fingers (trackball). In addition, movement of the cur-sor can be related to the position of the device or to the force applied to thedevice. Devices that map device displacement to cursor displacement, such asa default mouse, are called zero-order devices. Devices that map the force ap-plied to the device to cursor velocity, such as an isometric joystick, are calledfirst-order devices (Frost, 1972). A transfer function defines the relation betweendevice control and cursor movement. In many device drivers this function canbe set by the user. The function can be linear as well as non-linear; in the lattera displacement or an increase in force results in a disproportional increase incursor movement. The relation between device control and cursor movement iscommonly referred to as ’gain’. What gain is the most efficient is hard to say.People appear to adapt successfully to a wide range of gains, but also, the idealgain and the ideal input device tend to be somewhat task dependent (Wickens,Gordon, & Liu, 1998).As regards pointing, research on different input devices shows that the mouseis ’best’ compared to the trackball, different kind of joysticks and touch pad(e.g. Card, English, & Burr, 1978; Douglas & Mithal, 1997; English, Engle-bart, & Berman, 1967; Epps, 1986; MacKenzie & Buxton, 1991; Walker, Meyer,& Smelcer, 1993). In most of these studies ’best’ is tested by using Fitts’ Law(Fitts, 1954) (Card et al., 1978; Douglas & Mithal, 1997; Epps, 1986; MacKenzie &Buxton, 1991). This law states that movement time in an aiming task is logarith-mically related to task difficulty, expressed by target width and target distance.It holds for a wide variety of circumstances and for varying limbs (MacKenzie,1992). Two direct position devices (touch screen and light pen) are shown to befaster than the mouse, but these devices are less accurate (Card et al., 1978). Thissuggests that the mouse is superior to those input devices.
1.2.2 Movement kinematics and the use of feedback in a target-acquisition task
To apply haptic feedback in an efficient and pleasant way, it is worthwhile toexplore earlier research on the use of feedback during a target-acquisition taskand its influence on the movement kinematics. Woodworth (1899) already rec-ognized that voluntary arm movements consisted of two phases: the ”distancecovering” or ”initial adjustment phase” and the ”homing-in” or ”current control
4

1.2 Pointing
phase”. In the first phase the action is initiated by visual information about thedistance and direction of the target (position) and proprioceptive informationabout the current position of the arm. Later the idea arose that the higher levelsof the central nervous system create a neuromotor program (Lasley as cited inGlenross & Barrett, 1989). This program consists of a set of muscle commandsand is executed by the appropriate muscles. For an aiming movement such aprogram uses the direction and the distance to be covered, in that order (Baber,1997). Thus, the movement is ’open loop’; no feedback information is used.Feedback comes into play in the second phase, the homing in phase. Either theperson sees that the target will not be reached (visual feedback) or feels, by themovement of the arm, that the target will not be reached (kinesthetic feedback).Then the movement is corrected so that, eventually, the target is reached.Following Woodworth a lot of research has been done on aiming movementsand, with that, the idea of two phases has not been falsified, but certainlyrefined. A debate is still going on about the importance of different kinds offeedback and their temporal availability. For a detailed overview see Eliott,Chua, and Helsen (2001). If a target is easy to aim at, if it is big and near,the program can be executed without further adaptations, meaning that themovement consists of only the first phase. This type of aiming movementsis termed ’ballistic’. Ballistic movements can be recognized by their velocityprofile, which is bell-shaped. The movement starts, reaches a maximum velocityand ends again.Most of the time, however, movements need some adaptation to be accurateenough. The velocity profiles of such movements show more than a single ve-locity peak (e.g. Carson, Goodman, Chua, & Elliott, 1993; Jagacinski, Repperger,Moran, Ward, & Glass, 1980) or a longer lasting deceleration than acceleration.In the latter case feedback is apparently processed during the movement.Together with visual and kinesthetic feedback, touch feedback is available toowhen the limb arrives at a physical target. This not only confirms the arrival,but also helps to stop the movement. The importance of impact force was firstrecognized by Teasdale and Schmidt (1991). Adam et al. (1997) investigatedthe effect of impact forces on the kinematic structure of aiming movements andfound that, compared to movements without impact forces, movements withimpact forces were more like ballistic movements, that is, the acceleration lastedrelatively longer, velocity peaks were higher and deceleration was shorter.In HCI, mostly, the final part of the action, the clicking itself, is similar topushing a button in real life and is felt in the same way. This is because a realknob on the input device has to be pushed. However, novice users in HCI often
5

1 Introduction
exhibit problems keeping the cursor in place while clicking. Haptic feedbackabout the cursor’s position might help to prevent this.
Neuromotor noiseFrom the previous section it is clear that without feedback the amount of missesis much larger than with feedback. But even when feedback is available, eachhit differs from every other hit (Bernstein, 1967). Following Fitts, this spread isgenerally explained by the co-occurrence of noise within motor action. In Fitts’information processing model the human operator is equal to an electronic in-formation processor with limited channel capacity contaminated by white noise.In electronic, discrete information processing, more difficult tasks use more ex-tended codes to prevent errors by noise. So, more information has to be pro-cessed and processing time increases.Similarly, in a spatially constrained pointing task, a task in which a target mustbe hit, movement time increases as accuracy demands, or task difficulty, in-creases. Thus, when the targets get smaller and/or are further away, move-ment time increases, to prevent misses caused by noise. On the other hand, itwas already known to Woodworth that in a time-constrained pointing task, thespread of the misses and hits is highly correlated with allowed movement time.Schmidt, Zelaznik, and Hawkins (1979) and later Newell and Carlton (1985) re-lated this spatial spread to applied muscle force. When applied force increases,e.g. when the distance to be covered within a certain time increases, spatialspread also increases. Only in 1988, Meyer, Abrams, Kornblum, Wright, andSmith (1988) reintroduced the concept of noise to explain this phenomenon andcalled it neuromotor noise.Van Galen, Van Doorn, and Schomaker (1990) and Van Galen and Schomaker(1992) developed a theory in which they stated that humans exploit anatomi-cal and physical degrees of freedom to control endpoint accuracy of movement.Generally there are two ways to do this: by increasing the phasic stiffness ofthe limb system or by increasing the tonic stiffness of the muscles. Phasic stiff-ness can be increased by moving faster. Fast movements are smoother, but theirend point accuracy is less than the end point accuracy of slow movements. So,this strategy is not always applicable. Tonic stiffness can be increased by in-creasing the friction with surface, or increasing the tonus of the muscles as inco-contraction. The effect of this physical process is that the movement signalis low-pass filtered. For example, in learning to write, children press the point
6

1.3 Touch
of the pen onto the paper (Van Galen & De Jong, 1995). In HCI an increase inco-contraction is found by measuring grip force on a mouse (Vande Ven, 2002).Increased muscle stiffness is an important factor in the occurrence of RepetitiveStrain Injury (RSI) (Van Galen, Muller, Meulenbroek, & Van Gemmert, 2002).The extent to which people actively filter neuromotor noise depends on threefactors (Blommaert, Keuning, Fischer, & Vogels, 2003): One factor is the task;a task can be constrained by time available, by the space (e.g. the size of tar-get objects) or by both time and space. Another factor is a person’s mental andphysical state; e.g. one can be tired or fit, or happy or sad. The last factor are thepersonal goals and characteristics; e.g. one can want to be fast or accurate (seeAdam, 1992) or one can be sensitive to stress (Van Galen & Van Huygevoort,2000). These factors set the amount of energy people are able and willing tospend on task-related mental effort (Waterink, 1997) and to what extent this en-ergy is spent on being fast or on being accurate. In a target acquisition task lesstotal energy should be necessary if the user would be helped to reach a target.In this thesis the use of ’augmented force fields’ for this purpose is investigated.Such a force field is directed to the user’s target and helps to control the move-ment. Ideally, then, accuracy and time requirements are met without extra forceor co-contraction.
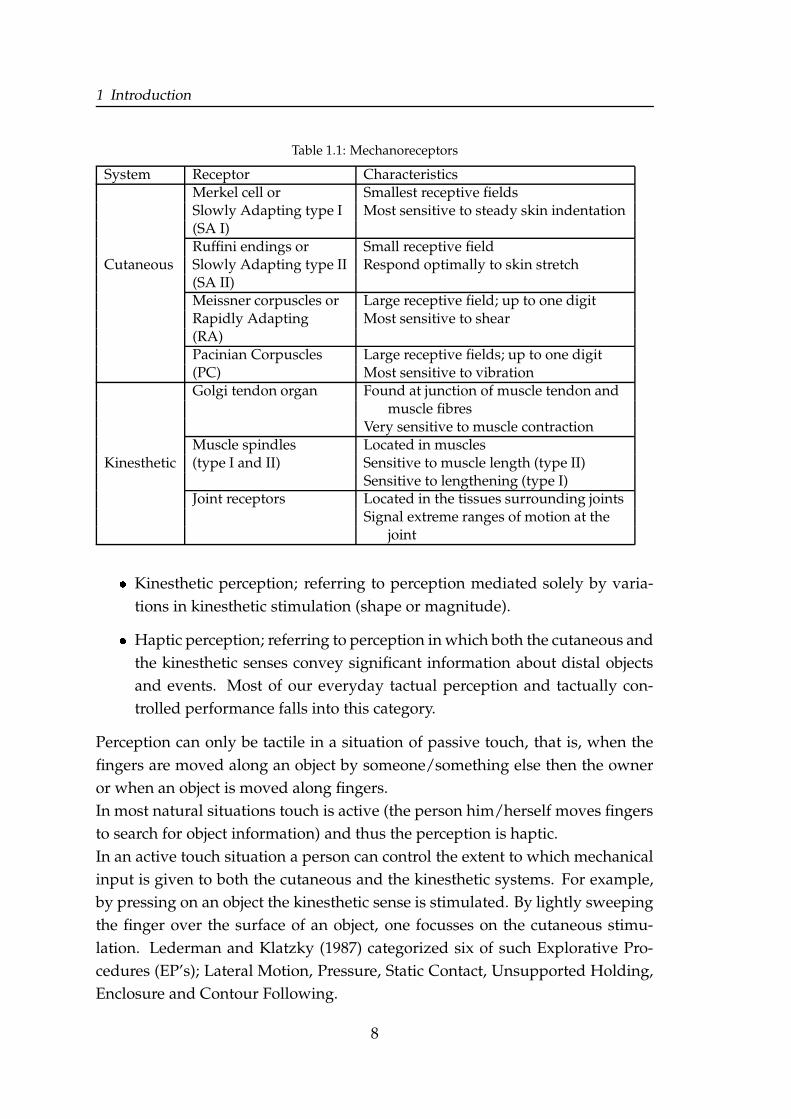
1.3 TouchThe perception of touch or tactual perception helps us to gain detailed informa-tion about objects and the positions of our body parts. An example of the formerfunctionality is picking up a piece of fruit and feeling whether it is ripe enoughto eat, instead of just looking at its color.Tactual perception is the result of mechanical input; forces acting on the sur-face of the body and forces acting from inside the body. These forces activatetwo separate neural systems: the cutaneous system and the kinesthetic system.Receptors of the cutaneous system are embedded in the skin. Receptors of thekinesthetic system are embedded in muscles tendons and joints (Loomis & Le-dermann, 1986). An overview of the receptors in both systems is given in Table1.1.Tactual perception is mediated by either separate or combined activation of bothsystems. The resulting perceptions are specifically referred to as follows:
� Tactile perception; referring to perception mediated solely by variations incutaneous stimulation (texture, curvature).
7
1 Introduction
Table 1.1: Mechanoreceptors
System Receptor CharacteristicsMerkel cell or Smallest receptive fieldsSlowly Adapting type I Most sensitive to steady skin indentation(SA I)Ruffini endings or Small receptive field
Cutaneous Slowly Adapting type II Respond optimally to skin stretch(SA II)Meissner corpuscles or Large receptive field; up to one digitRapidly Adapting Most sensitive to shear(RA)Pacinian Corpuscles Large receptive fields; up to one digit(PC) Most sensitive to vibrationGolgi tendon organ Found at junction of muscle tendon and
muscle fibresVery sensitive to muscle contraction
Muscle spindles Located in musclesKinesthetic (type I and II) Sensitive to muscle length (type II)
Sensitive to lengthening (type I)Joint receptors Located in the tissues surrounding joints
Signal extreme ranges of motion at thejoint
� Kinesthetic perception; referring to perception mediated solely by varia-tions in kinesthetic stimulation (shape or magnitude).
� Haptic perception; referring to perception in which both the cutaneous andthe kinesthetic senses convey significant information about distal objectsand events. Most of our everyday tactual perception and tactually con-trolled performance falls into this category.
Perception can only be tactile in a situation of passive touch, that is, when thefingers are moved along an object by someone/something else then the owneror when an object is moved along fingers.In most natural situations touch is active (the person him/herself moves fingersto search for object information) and thus the perception is haptic.In an active touch situation a person can control the extent to which mechanicalinput is given to both the cutaneous and the kinesthetic systems. For example,by pressing on an object the kinesthetic sense is stimulated. By lightly sweepingthe finger over the surface of an object, one focusses on the cutaneous stimu-lation. Lederman and Klatzky (1987) categorized six of such Explorative Pro-cedures (EP’s); Lateral Motion, Pressure, Static Contact, Unsupported Holding,Enclosure and Contour Following.
8

1.4 Haptic feedback in HCI
For most simple tasks involving active touch, only tactile or kinesthetic infor-mation is fundamental, while the other is supplementary (Srinivasan, 1995). Forexample, to discriminate the lengths of objects kinesthetic information is funda-mental. To discriminate textures tactile information is fundamental. In the per-ception of curvature tactile information is found to be fundamental (Pont, 1997).Yet, an interaction exists between both sources of information. On the one hand,limbs are perceived to be moving when vibration is imposed on muscles andtendons (Goodwin as cited in Srinivasan, 1995). This is called the kinesthetic il-lusion. On the other hand, a ’tactile illusion’ is described by Robles-De-La-Torreand Hayward (2001) in which forces can overrule geometric aspects. This indi-cates that a curved surface is perceived as flat or even as curved the other waywhen a force is added to the moving limb.
1.4 Haptic feedback in HCI
Most developments of tactual devices have focused on their medical use or gameapplications, but not on everyday human-computer interaction. Tactual feed-back devices are devices that are not only used by the user to give informationto the computer, but which are also used by the computer to give (tactual) infor-mation to the user. The user gives information by exerting forces on the device,and in turn the device gives information by releasing forces to the user’s con-tact area. In fact one must speak of tactual interfaces. In some sense a standardmouse and keyboard are tactual interfaces, because the user gets informationabout cursor position by moving a limb and about cursor action by breakdownforces when a button/key is pressed. ’Real’ tactual interfaces, however, activelyaddress the tactual sense. A distinction between existing tactual interfaces canbe made on the criterium which of the two sense-contributing systems (tactileand kinesthetic) is fundamentally activated. Tactile displays stimulate the tactilesense. Force displays stimulate the kinesthetic sense. Currently, available tactiledisplays use single or multiple stimulators composed of shape-memory alloys,pneumatic actuators, vibrotactile or electrotactile elements (Srinivasan & Basdo-gan, 1997). These devices do not help to direct the cursor, but only give infor-mation about an object’s presence or texture. Force displays are equipped withmotors or other actuators that can make the device move in a certain directionor increase its friction. For an overview of haptic devices see Vogels (1999). Inthis thesis some experiments will be described in which we use a force-feedbacktrackball. A short description of this trackball will be given in the next section.
9

1 Introduction
In this thesis, we focus on tactual feedback in a two-dimensional desktop envi-ronment to enhance the efficiency of a target-acquisition task. In other words,we want to investigate fundamental and applied aspects of haptic feedback de-vices to help the user to reach a target faster and more accurately.Experiments already have shown that haptic feedback in HCI can enhancethe speed, or reduce the movement time, of a target-acquisition task by 12 to20% (Akamatsu & MacKenzie, 1996; Akamatsu & Sato, 1994; Gobel, Luczak,Springer, Hedicke, & Rotting, 1995; Leenders, 1994Keyson, 1996;); the resultsdiffer per haptic device. Akamatsu and Sato (1994) used a mouse with a pinthat popped up when a target was entered. They found an average reductionof 8.4% in response time with this mouse as compared to a mouse without tac-tile feedback. The authors ascribed their result to the higher stimulus-responsecompatibility between the tactile and the motor system than between the vi-sual and the motor system. Keyson (1996) and Leenders (1994) used a trackballwith force feedback (described later). They found reductions in movement timeof respectively 12% and 8.3% when compared to using the trackball with theforce feedback disabled. Their results can be ascribed to the allowance of im-pact forces on the target. Permitting these forces allows the movement to beexecuted in a more ballistic way. Indeed, the authors state that subjects tend tomake a more sweeping movement when force feedback is added.Further reduction of the movement time can be accomplished by enhancing thetarget or bringing it closer to the cursor. By adding augmented force fields infact both issues are covered. An augmented force field is a force field whosearea is bigger than the area of the target. Haptically the user perceives the targetas bigger and nearer. Visually and physically this is not true, because the dis-tance to be covered still is equal. What might be true is that a force field allowspeople to postpone the deceleration of a movement because less accurate finetuning is needed. Goossens (1992) and Hasser, Goldenberg, Martin, and Rosen-berg (1998) found movement time to decrease up to 63% when using augmentedforce fields.The experience of the user when entering an augmented force field is a kind oftactile illusion. When a force is directed to the user’s target, it feels like rollinginto a hole, when the force is directed in opposite direction it feels like rollingup a hill.
10

1.4 Haptic feedback in HCI
1.4.1 The force-feedback trackball
The device used in this thesis to test the efficiency of and satisfaction with forcefeedback, is a force-feedback trackball. A short technical description of that de-vice is given here. For more extensive technical information about the force-feedback trackball see Engel, Haakma, and Van Ittegem (1990).The mechanical construction of the force-feedback trackball is shown in Figure1.1. The ball rests on a single ball bearing and is kept in position by two motorsand two free rolling support wheels. An optical position sensor with a reso-lution of 1060 dots per revolution is attached to the end of each motor. Tworubber-rimmed wheels provide the necessary friction between the motor axesand the ball. Each support wheel has a fine-tuning system with which the con-tact forces on the ball can be adjusted. As a result of the position of the motorsand the support wheels, ball rotations around the X and Y directions can be con-trolled separately. Furthermore, a selection button is located next to the ball. Theball has a diameter of 57 mm and weighs 115 g.
X-direction
Y-d
irection
Motor
Sensor
Supporting wheel
Figure 1.1: Mechanical construction of the force-feedback trackball
A Dell Optiplex Pentium 100 PC controls the trackball motors using two I/Ocards (an analog-digital converter and a digital-analog converter) and two am-plifiers to enable communication between the computer and the trackball. Aschematic layout of the electronic hardware configuration is presented in Figure1.2. The torques produced by the motors depend on the voltages generated bythe independent amplifiers.The trackball was calibrated before the experiments were conducted to deter-mine the relationship between the software output values and the actual forcesproduced by the trackball.
11

1 Introduction
Sensor(x)
Sensor(y)
QuadratureI/O card
PC control
I/O card
Amplifier(X)
Amplifier(Y)
Motor(X)
Motor(Y)
Tacho
Tacho
Trackball
Analog signal
Digital signal
Figure 1.2: Schematic layout of the electronic hardware configuration.
1.5 Plan of this thesis
In this thesis the development of an efficient and satisfying augmented forcefield is described. This is a force field whose area is larger than the area of theobject it overlaps and thus guides the user towards this object. As this is a veryspecified research area some important concepts, such as pointing, tactile andhaptic feedback and force feedback in HCI are defined in this first chapter. Inaddition, an overview is given of what is known about the pointing movementalready and how force feedback could be helpful in an every-day computer en-vironment.One can imagine that in most HCI environments it is not very effective to createaugmented force fields around every object on a computer screen. This is likelyto cause problems like force field interference. To prevent these kind of prob-lems and nevertheless to use augmented force fields, the first goal in this thesisis to make a prediction of the user’s intended target. In Chapter 2 an experimentis described in which characteristics of cursor movements are explored. The aimof this experiment was to find out how the initial phase of a cursor movementcould be used to predict its final direction and distance.The next aim is to surround a single target with the most efficient and satisfyingforce field, both regarding the shape and size of the force field. This can not onlyhelp to make a target-acquisition task more efficient and pleasant, but also toprevent RSI. The fine tuning of the cursor, for which most of the muscle forceis needed, is taken over by the computer. Imagine that you have to park yourcar with the wheels in an exact position. It is pleasant to feel that they are in the
12

1.5 Plan of this thesis
right place by feeling them falling into holes.Chapter 3 describes an experiment in which different shapes of force fields arecompared for efficiency and satisfaction in a target-acquisition task. In Chapter4 an experiment is described in which three force-field sizes were tested.As the predictions by the algorithm developed in Chapter 2 will not always becorrect this might bias the efficiency and satisfaction, especially when the field islarge. In the final experiment the performance of the prediction algorithm wasoptimized by using on-line information to update the prediction. An experi-ment with this iterative procedure is described in Chapter 5.Finally, in Chapter 6 the results are discussed from the perspective of the pri-mary aim of this thesis.
13

1 Introduction
14

2Predictability of direction and distanceof mouse versus trackball-controlled
cursor movements
AbstractThe primary aim of this study is to investigate the spatial and temporal characteristics of
cursor movements in a target-acquisition task. A further goal is to use this information
to develop an algorithm to predict the user’s target. Later on this algorithm will be used
to effectively add augmented force feedback in human-computer interaction. Two ex-
periments are reported in which subjects had to make cursor movements with different
pointing devices towards targets that lay in horizontal, vertical and diagonal directions.
In the first experiment we studied differences between the trajectories produced with a
mechanical mouse, an optical mouse, and an optical trackball and the influence of tar-
get direction on path curvature and on path variability around the mean path. In the
second experiment a mechanical mouse, an optical trackball and a mechanical trackball
were used to investigate the influence of target distance on the point of peak velocity
by extending the experimental layout to targets at three distances. The results show
that curvature does exist, but is low and unstable in direction and height. Variability of
paths around the mean path is highest in the diagonal direction. Furthermore, the vari-
ability differs considerably between the devices; paths with the mechanical mouse vary
the least. An implication of these results is that paths can be treated as straight lines in
a prediction algorithm. The point of peak velocity has a very high standard deviation
and therefore it is concluded that this variable can not be used as a reliable predictor of
the target distance.
0This chapter is based on Keuning, H. and Houtsma, A.J.M. (2000). Cursor trajectory analysis.Proceedings of the First international symposium on haptic human-computer interaction, Glasgow, p69-72.

2 Predictability of direction and distance
2.1 IntroductionThe introduction of Graphical User Interfaces (GUI’s), together with the mouse,made it possible to manipulate visual objects directly (Shneiderman, 1983).This has made computers rapidly more accessible to everyone. Further effortshave been focused on tools to enhance the user’s ability to directly manipulateobjects. One very common ’direct manipulation’ is target acquisition. Thatinvolves, moving the cursor onto an object on the screen and then clicking abutton on the mouse. Efforts to enhance the purposefulness of this type ofdirect manipulation have been made by visually augmenting the target (e.g.McGuffin & Balakrishnan, 2002 or Mensvoort, 2002), by adding haptic feedback(e.g. Akamatsu & Sato, 1994; Hasser et al., 1998; Keyson, 1997) or by changingthe software transfer function for input devices (e.g. Rutledge & Selker, 1990).Visually augmenting the target means that the target becomes bigger when thecursor gets closer to it. The addition of haptic feedback can be done at differenttimes during the target-acquisition task. It can be added at the moment thetarget is entered or earlier, during the movement. In the latter case the hapticfeedback consists of a force field in which the user feels a force guiding himtowards the target. In fact the target is haptically augmented. Changing thetransfer function means changing the relation between the amount of move-ment of the device and the amount of movement of the cursor on the screen.In the case of augmenting the target (visually or haptically) target acquisitioncan be further improved by predicting the user’s intended target. If the targetis known, the augmentation can be applied to this object alone, maximizingthe augmentation and making the user profit maximal. Our ultimate goal is tocreate an algorithm that can predict the user’s intended target using the initialpart of a cursor movement. To create such an algorithm we need knowledgeabout the characteristics of unsupported cursor movements toward targets atvarying distances and directions. An exploratory study is reported here thathelps determine such characteristics.
2.1.1 Predicting path direction
The direction of a movement can be assessed by fitting the (spatial) shape of themovement trajectory. This spatial shape is called the movement ’path’ (Holler-bach, 1990). Our key question is how to assess the general degree of path curva-ture, and whether this curvature occurs within the boundaries of path variabilityor not. The measure of path curvature is introduced in Figure 5.2. If path curva-
16

2.1 Introduction
ture is more than its variability, target prediction should be based on a curvedextrapolation of the initial path. If the variability is larger than the mean curva-ture, simple straight-line fits could be used.The degree of variability defines the reliability of the prediction of the direction.The more the paths vary, the less certainty can be given about the final direction.Previous research showed that aiming movements roughly follow a straight linefrom the start to the end point (Morasso, 1981), but if a closer look is taken, themovements often turn out to be slightly curved (Wolpert, Ghahramani, & Jor-dan, 1994).It is known that variability is related to the orientation of a movement in terms ofthe primary axes of the work field. Meulenbroek and Thomassen (1992) foundthat, in pen drawings, people operate best in the horizontal and vertical direc-tions and worst in diagonal directions. Boessenkool (1999) had people makeaiming movements and found most deviation in the horizontal direction. Thesemovements, however, were 25 cm in distance, which requires other anatomi-cal structures (e.g. movement around the shoulder joint) than smaller mousemovements do.
2.1.2 Predicting path length
Besides an initial path direction, a certain distance has to be travelled to reachthe target. To predict this distance, the general shape and the variability of thevelocity profile are important. Target acquisition is typically an aiming task.Since Woodworth (1899) we know that people make a trade-off between thespeed and the accuracy of their movement in these tasks. In general, this trade-off is reached by splitting the movements into two phases; the initial-impulsephase followed by the current-control phase. In the first, ballistic phase themovement is controlled by feed forward. This phase brings the cursor intothe vicinity of the target. In the second phase fine-tuning submovements aregenerated by the use of visual feedback (Woodworth, 1899).The first phase can be recognized by a primary peak in the velocity profile. Thesecond phase is expressed by one or more additional velocity peak(s). In thecase of more than one peak in the velocity profile, each secondary peak repre-sents a corrective submovement. These secondary peaks are generally smallerthan the first peak, because a shorter distance is left to be covered (Crossman &Goodeve, 1983). Submovements do not always lead to velocity peaks. Visualfeedback can be processed in a continuous manner, so that submovements aremerged (Eliott et al., 2001). In that case the deceleration of the movement lasts
17

2 Predictability of direction and distance
longer than the acceleration. The more submovements are merged, the longerthe deceleration phase will be. In fact one can not speak of ’submovements’then, because this term implies a reversion of the velocity. Another possibilityis that no submovements are needed, as Meyer et al. (1988) describe in theiroptimized initial impulse model. The target is hit by the first ballistic movement.In those cases the velocity profile is bell-shaped and symmetrical (e.g. Morasso,1981). This only occurs if an aiming task is overlearned or accuracy has lowimportance.If the shape of the velocity profile is rather invariant across movements, oneother point on the profile is needed besides the starting point to know thedistance of the end point. The most obvious point to choose for this purpose isthe (relative) location at which maximum velocity is reached. For example, ifthe profile is symmetric, half of the total distance has been travelled at the pointof maximum velocity.The number of (merged) submovements clearly influences the relative locationof the point of maximum velocity. If more submovements occur, decelerationlasts longer and maximum velocity is reached relatively earlier during themovement, both temporally and spatially. The invariance of the location of thepoint of maximum velocity thus depends on the invariance in the number ofsubmovements.Besides this, the magnitude of the velocity influences the variability of thelocation of the point of maximum velocity. To reach a higher velocity, a largerforce is needed. Schmidt (1982) found that generating larger forces led to morevariability in force. If, with a higher force, the variability in the force increases,so does the variability in the velocity and so does the variability in the distancecovered and of the location of the the point of maximum velocity.In our study we tried to determine the location of maximum velocity in cursormovements towards spatial targets and to examine whether this location issufficiently invariant to serve as a distance predictor.
In the remainder of this chapter we describe two experiments in whichwe explored cursor movements to targets at varying locations. In the firstexperiment we studied the influence of target direction on path curvature andpath variability. Subjects made movements to targets, all at the same distance,in horizontal, vertical and diagonal directions. In the second experiment weinvestigated the influence of target distance on characteristics of the velocityprofile by extending the experimental layout to targets in the same eightdirections and at three different distances.
18

2.2 Experiment 1
Four different devices were used. A mechanical mouse, an optical mouse andan optical trackball were used in the first experiment. In the second experimenta mechanical trackball was used instead of an optical mouse.
2.2 Experiment 1
2.2.1 Method
SubjectsSubjects were ten academicallty trained employees of the Center for User-System Interaction(IPO), seven male, three female, all of whom write with theirright hand. Their mean age was about 30. All of them had experience with amechanical mouse, but not with an optical mouse nor with an optical trackball.
Experimental setupAn interface was created with Visual Basic 5.0 on a screen with a resolution of1024 by 768 pixels. Because all distances are programmed in pixels we will calcu-late and analyze all data in pixels. We will give an approximation in centimetersor millimeters if practical. In the middle of the screen a start button was shown.At a distance of 250 pixels (which is about 7 cm on the screen) from the center ofthis button, a target could appear, consisting of a black circle, 30 pixels (almost 1cm) in diameter. A target could be located in horizontal, vertical or diagonal di-rection from the start area (see Figure 2.1). Moving towards the left on the screenwas defined as a path of zero degrees, with the angle accumulating clockwise.During each trial, the X- and Y-coordinates of the cursor and the system timewere sampled (in pixels) with a frequency of 50 Hz. This frequency was chosenbecause the input devices read its state with a default frequency of 50Hz. Eachsubject did the experiment with three different devices; a (standard) mechanicalmouse, an optical mouse and an optical trackball. We have chosen these devicesfor the following reasons: A mechanical mouse is most used, so movements withthis device are well-learned. This provides us with some basic insight into well-learned cursor movements. However, a mechanical mouse is equipped withtrack wheels, which can influence the movement. Therefore, we included theoptical mouse in the experiment as well. This device is similar in use to themechanical mouse, but has no track wheels. We further included an opticaltrackball, because in the future we want to do force-feedback experiments using
19

2 Predictability of direction and distance
this device and its prediction algorithm. The anatomy necessary for handlinga trackball, which is rolled by the fingers, is different from that in handling amouse, which needs, at least, the wrist to contribute to the movement. Becausenone of our subject had experience with trackballs it is difficult to compare theresults of the mice and the trackball. In doing so we must always keep the dif-ference in skill in mind!For each device the gain was set at medium level, exactly in the middle of mini-mum and maximum gain. These gains, expressed as the ratio of amount of dis-placement of device and the amount of displacement of the cursor on the screen,turned out to be 0.23 for the mechanical mouse, 0.35 for the optical mouse and0.39 for the optical trackball. The smaller the number, the less the device had tobe moved to move the cursor over the screen.
0o
90o
180o
270o
Figure 2.1: Position of all possible targets. The square in the center is the start button. The blackcircles are the targets.
ProcedureSubjects were seated at a table on which a computer screen and one of the threecontrol devices were present. Distance from the eyes to the screen was approxi-mately one meter. Subjects were instructed to adjust their chair so that the mid-dle of the screen was at eye height.In the middle of the screen a ’start’ button was shown. The cursor was pre-sented as a haircross. After pressing the space bar with the left hand while thecursor was on the start button, one of the eight targets randomly appeared and
20

2.2 Experiment 1
å=
=n
i
i
n
d)dm e a n (
1
n
+
_
di
i
Figure 2.2: Calculation of path curvature
the button disappeared. Meanwhile the cursor was repositioned to specified co-ordinates, so that each trial started exactly at the same position on the screen.Subjects were asked to move the cursor from the start button to the target. Theycould do this with a self-defined speed-accuracy trade-off and could start when-ever they were ready for it. When the target was reached subjects had to wait200 ms until the target disappeared and the ’start’ button re-appeared. Then thecursor could be moved to the start button again. Just before pressing the spacebar, the participants were allowed to re-arrange the input device if movementpositions were not comfortable any more. After pressing the space bar the nexttrial started. Each subject performed ten trials per device and target.
Data analysisRaw position data were spread in regular (20 ms) time intervals. For our analy-sis, however, we wanted to have these data expressed in regular space intervalsalong the path. Therefore cursor positions were interpolated to obtain a valuefor every 1% of (total) travelled distance. With these samples the curvature ofeach path and the variability of paths towards each target were calculated.To assess the curvature, the paths were first rotated until start and end positionswere on the positive X-axis. Then, for each path, the Y-coordinates (in pixels)were averaged. Curvature was defined as this mean Y-coordinate (Boessenkool,1999). Hence, a positive curvature indicates a main bulge of the path, in a coun-terclockwise direction. The advantage of this definition of curvature insteadof maximum (absolute) Y-coordinate (Atkeson and Hollerbach, 1985) or the Y-coordinate at midpoint of the movement (e.g. Wolpert et al., 1994) is that it takesinto account the curvature along the entire path. For instance, if a path is promi-nently curved at the start or the beginning of the path, the Y-coordinate at themidpoint is relatively small and the maximum Y-coordinate does not indicatethe sign of the curvature. The sign of the curvature, however, is essential if a
21

2 Predictability of direction and distance
prediction of the movement direction is to be made. However, a disadvantageof our method is that curvature might become zero if the X-axis is crossed. Aswill be discussed below, the variability indicates whether this crossing occurs.The variability of the paths is represented by the mean standard deviation of thedistances of paths perpendicular to the mean path of the ten trajectories per-formed per subject per direction per device. This standard deviation is aver-aged to obtain a single value for ’variability’. Later MacKenzie, Kauppinen, andSilfverberg (2001) proposed a very similar measure as an accuracy measure toevaluate computer input devices. The only difference is that they do not mea-sure the perpendicular distance to the mean path, but to a straight line betweenstart and target.Repeated-measures analysis of variance (ANOVA) were calculated with ’device’and ’direction’ as within-subject factors. If significant differences are found be-tween devices we can choose to make a prediction algorithm for each deviceseparately. If significant differences are found between directions this can tellus something about the reliability of the algorithm in each direction. In the caseof significant effects a univariate ANOVA was performed, which gives us theopportunity to do a post-hoc test.
2.2.2 Results
For one subject paths for all three devices are displayed in Figure 2.3. This figureclearly shows that, for each device, the diagonal paths are most variable. It alsois apparent that use of the optical trackball leads to more variability than theother devices.
Path curvatureThe mean curvatures of all subjects per device and direction are depicted in Fig-ure 2.4. The maximum mean curvature found is 2.3 pixels (about 0.5 mm) withthe optical mouse at 270 degrees. In general, however, paths created with theoptical trackball are most curved. For each device only two or three directionsshow significantly curved paths.
Path variabilityFigure 2.5 shows the variability of paths around the mean path in each direc-tion for each device. The cross lines represent the standard deviation at each tenpercent of the path. A repeated measures ANOVA was performed with ’device’and ’direction’ as within subject factors. Both factors had a main effect on vari-
22

2.2 Experiment 1
-300 -200 -100 0 100 200 300
-300
-200
-100
0
100
200
300
y (p
ixel
s)
x (pixels)-300 -200 -100 0 100 200 300
-300
-200
-100
0
100
200
300
x (pixels)
y (p
ixel
s)
(a) (b)
-400 -300 -200 -100 0 100 200 300
-300
-200
-100
0
100
200
300
y (p
ixel
s)
x (pixels)
(c)
Figure 2.3: Example of cursor movement paths created by one user using a) mechanical mouse,b) optical mouse, c) optical trackball. The start position in the center of the screen is on pixelcoordinates (0,0).
ability with������� ������ ��� ������������ �����
for ’device’ and���! "� #%$&'����������(�������� �����
for’direction’. In addition an interaction effect between ’device’ and ’direction’ wasfound
���)�+*,� ���%#-/.0�� 1.�(����2�3� �����and an effect for subject
���4�%� 5687� �7�� ���9.0���2�8� �����.
Because no post-hoc test can be done on within-subjects factors, a post-hoc testwas done after performing an ANOVA. The results of this ANOVA are similar tothe repeated measures ANOVA, except that the within-subject factors are treatedas between-subject factors. This post-hoc test showed that the optical trackballhad significantly more variability (15.9 pixels, which is : .0�� mm) in its cursorpath than the two other devices (
�;�<� ���), which had a variability of 10.1 pixels
(the mechanical mouse) and 9.1 pixels ( : ��� � mm) for the optical mouse. This canclearly be seen in Figure 2.5 as well. The effect of direction of the paths was thatdiagonal paths were most variable, with a mean variability of 15.4 pixels, andhorizontal paths were least variable, with a mean variability of 9.8 pixels. Paths
23

2 Predictability of direction and distance
Figure 2.4: Mean curvature per direction and device
in opposite direction from each other (e.g. 0 degrees and 180 degree) did not dif-fer from each other. However, this is not true for the optical trackball. With thisdevice vertical movements are almost as variable as diagonal movement (seeFigure 2.6). This explains the interaction effect between device and direction.
2.2.3 Discussion
The objective of this study was to explore path shapes for three different inputdevices, to find invariances that can be used to predict the direction of a targetfrom an initial movement. We chose to describe path shape by a curvaturemeasure and also looked at the mean standard deviations (termed variability)of paths around the mean path.Paths turned out to be positively curved in most conditions. However, severalreasons can be given not to correct for curvature in a prediction algorithm.First, the curvature usually is very small and correcting for about 1 pixel ofcurvature would not improve the prediction significantly. This holds, becausethe variability of the paths around the mean path is much bigger than theirmean curvature.Path variability was found to be highest with the optical trackball. We thinkthat this effect is mainly due to a lack of experience with this device. Theanatomy used is different from the anatomy used when moving a mouse andprobably less well practised. This makes the movement harder to coordinate.
24

2.2 Experiment 1
-400 -300 -200 -100 0 100 200 300 400
-400
-300
-200
-100
0
100
200
300
400
x (in pixels)
y, (in p
ixels
)
-400 -300 -200 -100 0 100 200 300 400
-400
-300
-200
-100
0
100
200
300
400
x (in pixels) y,
(in
pix
els
)
(a) (b)
-400 -300 -200 -100 0 100 200 300 400
-400
-300
-200
-100
0
100
200
300
400
x (in pixels)
y, (in p
ixels
)
(c)
Figure 2.5: Mean trajectory and variability in eight directions for all three devices a) mechanicalmouse, b) optical mouse and c) optical trackball.
If movements are new and hard to coordinate people tend to increase thefriction between the moving object (the device) and the surface (Van Galen& Van Huygevoort, 2000). This strategy does not help much with the opticaltrackball, because it rolls with very low friction on three small steel balls.In our next experiment we will use another kind of trackball, a mechanicalforce-feedback trackball, without activating the force-feedback function. Ifmovements with this trackball are less variable than with the optical trackball,the argument of a failing strategy by low friction gains in strength, because bothtrackballs are used in an anatomically similar way.For all three devices the variability is higher in diagonal directions than in hori-zontal directions. This finding is in agreement with the study of Meulenbroekand Thomassen (1992). They found that horizontal and vertical movements
25

2 Predictability of direction and distance
Direction
31527022518013590450
Mea
n va
riabi
lity
(pix
els)
30
20
10
0
Device
optical mouse
mechanical mouse
optical trackball
Figure 2.6: Mean variability per direction and device
were less deviated because of a geometrical preference for these directions.This is because people are trained to work from left to right and from top tobottom. The results on curvature and variability also indicate that the presenceof trackwheels in the mechanical mouse did not make the path shapes or theirvariability differ from the paths created with the optical mouse.
Clearly, when making a prediction algorithm about the direction of theend point, an algorithm is needed for each device separately. But for eachdevice the diagonal direction limits the precision of the end point prediction.In this direction movements are most variable. If the direction between objectsdiffers less than the movements vary, the prediction algorithm can neverdifferentiate between these objects. We conclude that to predict the directionreliably, objects must be situated at a certain minimum distance from eachother. The required minimum depends on the variability of the most variablepath. Averaged over all three devices the most variable paths (diagonal) havea variability of 15.4 pixels or : .0�� mm. A reliability of 69% is reached for eachtarget (1 standard deviation) with a margin of 15.4 pixels around each object.So, the distance between objects has to be 31 pixels, almost one cm. This isas much as the diameter of the objects used in our experiment. Curvature,therefore, need not be corrected in the algorithm.
The target of a movement can not be predicted by predicting the direction alone.
26

2.3 Experiment 2
There can be more potential targets in the same direction, situated at differentdistances. So, to predict a target, direction as well as distance of the cursor move-ment need to be predicted by the algorithm. This is what we will explore in thesecond experiment.
2.3 Experiment 2In our second experiment we explored the stability of location of maximum ve-locity across movements when related to device, directions and distances. If thelocation of maximum velocity is fairly stable (or invariant) it is a useful predictorfor the distance to the user’s target.Because no performance differences were found between the two mouse devicesin the first experiment, we omitted the optical mouse in the second experiment.Instead, we included a mechanical force-feedback trackball. In future researchwe want to use this device in an application with ’force augmented’ targets.This trackball is equipped with two motors; one effective in the Y-direction andone in the X-direction. These motors can make the trackball roll more or lesseasily, depending on the rolling direction of the motors compared to the rollingdirection of the trackball. The motors were in a passive state during the presentexperiment.
2.3.1 Method
SubjectsSubjects were ten academically trained employees of IPO, six male and four fe-male. All of them were right-hand writers. The mean age was about 30. All ofthem had experience with a mechanical mouse, but little or none with an opticalor force-feedback trackball.
Experimental setupAn interface was created with Visual Basic 4.0 on a screen with a resolution of1024 by 768 pixels. The target consisted of a black circle 30 pixels in diameter. Itslocation could be at one of 24 positions on the screen, three in every 45 degrees,at a distance of 150, 250 or 350 pixels from the starting point. In centimeters thesedistances are about 4, 7 and 10 cm. Three pointing devices were used; a (stan-dard) mechanical mouse, an optical trackball and a mechanical force-feedbacktrackball.
27

2 Predictability of direction and distance
During each trial X- and Y-coordinates (in pixels) and the system time were sam-pled with a frequency of 50 Hz.
ProcedureThe procedure was the same as in Experiment 1. Subjects had to move the cursorfrom the middle of the screen to a target. Two differences in procedure were that(a) subjects did not use the space bar, but a click on the start button to initiate atrial and (b) they had to click on the target to end the trial.
Data analysisOnce again raw data were linearly interpolated to obtain an estimated pathvalue for X and Y at every 1% of the travelled path. Curvature and variabil-ity were calculated as explained in Experiment 1. The maximum velocity isexpressed in pixels per ms and the point where it is reached is expressed as apercentage of the total distance.Repeated-measures analysis of variance (ANOVA) were calculated with ’de-vice’, ’distance’ and ’direction’ as within-subject factors. This test can give us in-formation about the reliability of a prediction algorithm. If differences betweendirections or distances exist, a general algorithm is less reliable and might evennot be useful. It is possible to create separate algorithms for separate devices,but not for different directions and distances.
2.3.2 Results
CurvatureCurvature is significantly different from zero in almost every direction for al-most every device, except the vertical paths and the paths left upwards and rightdownwards (see Figure 2.7). Paths made with the mechanical force-feedbacktrackball are three to four times more curved, in the absolute sense, than pathswith the other two devices. For the mechanical mouse and the optical track-ball curvatures range from �
�to +6. The mechanical trackball shows curvatures
from -8 to +11. These values are higher than the values found in Experiment 1.A specially noticeable feature is that, with the mechanical trackball, pathsto the left (
� �) and the three downward directions (
���� � � ����� � � 7��� �) are posi-
tively curved and paths to the right (� (�� �
) and the three upward directions(. � ����� � �9� 7� �
) are negatively curved.
28

2.3 Experiment 2
0 45 90 135 180 225 270 315-10
-5
0
5
10
15
Direction (degrees)
Mea
n cu
rvat
ure
(pix
els)
optical trackballmechanical mousemechanical trackball
*
*
*
*
*
*
*
*
*
*
*
*
*
*
*
*
*
*
* = significant
Figure 2.7: Mean curvature per direction for each device; an optical trackball, a mechanicalmouse and a mechanical trackball.
VariabilityVariability outcomes in individual trials are comparable to the results of Ex-periment 1 (Figure 2.5), so we will not present them here. A repeated mea-sures ANOVA on variability, with ’device’, ’distance’ and ’direction’ as within-subjects factors, showed that there is a significant influence from ’device’
���)��� ��#6�� �� .�7�7���� � � �����
, ’distance’������� ��# 7���� . �� ���� � � �����
and ’direction’���! "� �%#
���� ���� ���� � � �����as well as an interaction effect between device and distance��� *,� $%� (������ (���� � � �����
, between device and direction���4�+*,� �%��� ��� (� 1.0��� � � �����
and between direction and distance���4�+*,� �%���; ������ ������ � � �����
. In addition, asignificant subject effect was found
���4�%� � � ����� �� ����'� � �������. A post-hoc test
showed that the variability of the paths depends on the first three factors in thefollowing way:
� Device: the overall variability is highest with the optical trackball (16.3pixels or : .0� � mm) and lowest with the mechanical mouse (9.7 pixels or: ��� � mm). These values are similar to the values found in Experiment 1,in which the optical trackball had a variability of 15.9 pixels ( : .0�� mm) andthe mechanical mouse had one of 10.1 pixels ( : ����� mm). The mechanicaltrackball had a variability of 11.9 ( : 7�� . mm).
� Distance: the nearest target results in the least variability (10.6 pixels).
� Direction: for each device the variabilities in opposite directions are equal.
29

2 Predictability of direction and distance
Movements are least variable in a horizontal direction and most variablein diagonal directions. These results are the same as in the former experi-ment.
The interaction effects that were found are caused by some differences beingsignificant and others not being significant. Trends are the same on all occasionsand as described above.
Peak velocityThe mean velocity profiles per device and distance can be seen in Figure 2.8.Averaged over all directions, distances, control devices and subjects, the peakvelocity was reached at 53% of the total distance, counted from the start. A
0 50 100 150 200 250 300 3500
0.5
1
1.5
velo
city
(pi
xels
/sam
ple)
distance (pixels)
c
a
b
Figure 2.8: Velocity profiles of a) the mechanical mouse (dashed line),b) the optical trackball(solid line) and c) the mechanical force-feedback trackball (dotted line).
repeated measures ANOVA on the location of peak velocity showed that thereis a significant influence of ’device’
���!��� ��# ��� �� � ���� � �����, ’distance’
������� ��# �������(������ � � �����
and ’direction’���! "� �%# .0������ � � � �����
. An interaction effectwas found between device and direction
���4�+*,� �%��� ��� ����( � � � �����Moreover, an
effect of subjects was found���4�%� �& (�� ��� ��������� � �����
. The ANOVA post-hoc testsshowed that the influence of the factors ’device’, ’distance’ and ’direction’ is asfollows:
� Device: with the optical trackball the peak is at 49% and with the mechan-ical force-feedback trackball the peak is at 59%.
� Distance: the further away the target is, the nearer to the start area the peak(49% for the farthest target and 58% for the nearest).
30

2.3 Experiment 2
Direction (degrees)
31527022518013590450
Me
an
re
lativ
e lo
catio
n o
f p
ea
k ve
loci
ty
0.7
0.6
0.5
0.4
Device
optical trackball
mechanical mouse
mechanical trackball
Figure 2.9: Relative location of peak velocity for the eight directions per device
� Direction: contrary to the repeated measures, the ANOVA did not resultin a significant effect of direction.
The interaction effect between device and direction can be seen in Figure 2.9 too.It shows that especially the mechanical trackball results in a peak velocity far-ther away from the start when moving to the left. The results described aboveindicate that one general prediction algorithm based on the mean location ofpeak velocity will result in systematic under- or overprediction, depending onthe condition. If one would consider making separate algorithms for each con-dition, a question would be what the standard deviation of the location of peakvelocity is for each condition. The answer can be seen in Figure 2.10. In thisfigure we plotted standard deviation of the location of peak velocity against themean peak velocity. We express this standard in pixels, because we want to cal-culate the final distance and its error in pixels by using a multiplication factor.We expressed the location of maximum velocity in percentages, because this de-fines our multiplication factor. Generally it is so, that higher velocity is linkedto higher standard deviations in end point position. Figure 2.10 shows that thesame holds for the location of the peak velocity. The standard deviation of thelocation of peak velocity clearly increases as velocity increases. One can also seethat velocity is related to distance and device. The further away the target thehigher the peak velocity and thus the greater the standard deviation. What isalso important is the overall size of the standard deviation. The lowest standard
31

2 Predictability of direction and distance
0.8 1 1.2 1.4 1.6 1.8 2 2.2 2.4 2.630
35
40
45
50
55
60
65
Mean peak velocity (pixels/ms)
St.d
ev. i
n lo
catio
n of
pea
k ve
l. (p
ixel
s) optical trackballmousemechanical trackball
Figure 2.10: Mean peak velocity against the standard deviation in location of peak velocity foreach device and distance
deviation is found for movements with the mechanical mouse to the nearesttarget (31 pixels, : � cm). This means that if we decide to use the mean relativelocation of peak velocity (53%) as a standard, the error of distance prediction canbe as much as 100/53*31=58.5 pixels( : ����� cm). For the device and distance withthe highest standard deviation (62 pixels for the optical trackball at 350 pixels)this error could be as high as 117 pixels ( : 7�� 7 cm).
SubmovementsThe (relative) location of peak velocity depends, among other things, on thenumber of submovements. The more submovements are made the earlier therelative location of peak velocity. In Figure 2.8 no submovements can be de-tected, because the profiles were averaged. In Figure 2.11 we plotted the num-ber of (unmerged) submovements (as described Chapter 1) in relation to deviceand direction (2.11a), and device and distance (2.11b). This figure shows thatmovements towards more distant targets have more submovements. A differ-ence between devices and between directions can also be seen. The repeatedmeasures ANOVA confirms the significance of these differences between de-vices
������� ��#&'����� .�(� ������'� �����, distances
���!��� ��#&'7��� �� 7��� ���� ��� �����and directions���! "� �%# <.0� ��������� � � �����
. The repeated measures ANOVA also shows an interac-tion effect of device and direction. Figure 2.11a clarifies this interaction effect.The optical trackball produces relatively fewer submovements in a horizontaldirection (0 and 180 degrees).
32

2.3 Experiment 2
(a) Direction
31527022518013590450
Mea
n nu
mbe
r of
sub
mov
emen
ts
3.5
3.0
2.5
2.0
1.5
1.0
Device
optical trackball
mechanical mouse
mechanical trackball
(b) Distance (pixels)
350 250 150
Mea
n nu
mbe
r of s
ubm
ovem
ents
3.5
3.0
2.5
2.0
1.5
1.0
.5
Device
optical trackball
mechanical mouse
mechanical trackball
Figure 2.11: Mean amount of submovements per device for each direction (a) and for each dis-tance (b).
2.3.3 Discussion
The main findings of the first experiment are replicated in this second exper-iment. Curvature usually is positive, and variability is biggest in diagonaldirections with the optical trackball resulting in the most variable paths. Wethink that the cause of this latter result is mainly the cause of the limited skillpeople have with trackballs. We can exclude the possibility that the highervariability visible in the paths created with the optical trackball compared tothe mouse devices is caused by the gain ratio, because the gain of this trackballis less than the gain of the mice.With respect to curvature, the fact that the directions in which curvature ispositive are not necessarily the same as in the former experiment indicates thatit is not a stable feature within and between devices. This lends strength toour idea that it is not useful to correct for curvature in a prediction algorithm.It is, however, worth noting that the curvature of the mechanical trackball isobviously larger than for the other two devices. We do not have an explanation
33

2 Predictability of direction and distance
for this finding. However, curvature is so small that no correction would help aprediction of the direction of the movement.A prediction of target distance by the location of peak velocity seems to bevery difficult or even impossible, because of the great variance in location ofpeak velocity between trajectories. The systematic influence of distance anddirection can not be included in an algorithm, because to correct for distancethe distance needs to be known beforehand. This, of course, is impossible. Thedifferences found in the relative location of peak velocity between devices aremost probably the result of differences in friction. The optical trackball rollsalmost frictionless over three steel balls, whereas the mechanical trackball hashigh friction because of track wheels connected to the motors. The opticaltrackball has its mean peak velocity at 49%, the mechanical trackball at 59%.Another reason for the earlier relative location of peak velocity of the opticaltrackball can be the number of submovements. Besides this systematic shift thevariable error is so large that a prediction of distance is very inaccurate (seeFigure 2.10). A variable error of 117 pixels (the optical trackball) means thatto be reliable in 69% of the cases, the objects must be situated two times 117pixels from each other. On the horizontal axis only four objects could be presentwith only three on the vertical axis. The lowest variable error is found with themouse (58.5 pixels at a distance of 150 pixels). As the mouse is most commonlyused, we suggest that this is a result of earlier training and experience.
2.4 Conclusion
From the results of both experiments we conclude that the direction of a target ispredictable by continuing the initial direction of the movement. The reliabilityof such a prediction differs per device. With the mechanical trackball the direc-tion can be predicted within a range of 23.8 pixels (11.9 * 2) with a reliability of69%. For the other two devices the ranges are 19.4 (mechanical mouse) and 32.6(optical trackball).Prediction of the target distance is much more difficult because 1) the location ofthe peak velocity differs within devices between distances and direction and 2)the standard deviation of the location of maximum velocity is too high to makea sufficiently reliable distance prediction. The first problem can not be avoidedbecause it is impossible to create algorithms that differentiate between distances.This would require distances to be known beforehand. The second problem, the
34

2.4 Conclusion
high standard deviation, drops a little when skill with the device increases. Thisis one factor in which the mouse differs from the trackballs and one factor bywhich the standard deviation found with the mouse are lower. Nevertheless,we will have to find more fine-tuned and perhaps more sophisticated ways topredict target distance. One idea is to do the prediction in an iterative way. Inother words, we want to do a prediction several times during the movement.The closer one gets to the target, the better the prediction should be. This ideawill have to be worked out and tested in future research.A last conclusion we want to draw is that, in general, too low a device frictiononly makes a target-acquisition task more difficult. Paths become more vari-able and that makes it more difficult to hit the target. More attention and moreco-contraction is needed to reach a target in a reasonably accurate and fast way.
35

2 Predictability of direction and distance
36

3The shape of augmented
force-feedback fields and theefficiency and satisfaction in target
acquisition
AbstractThe aim of this study is to investigate what shape of augmented force-feedback fields
is most satisfying and leads to the most efficient performance of a target-acquisition
task in human-computer interaction. In an experiment three different force-field shapes
and two mean force levels were compared, using a mechanical force-feedback trackball
as experimental device. Efficiency was measured with the time needed to perform the
task, satisfaction was measured with a subjective score. The results indicated that a
distinction must be made between two groups of subjects: those who prefer high mean
force levels and those who prefer low mean force levels. These groups differed with
regard to both efficiency and satisfaction. Nevertheless, within both groups, efficiency
and satisfaction are influenced by the mean force level and the shape of the force field.
A force field that starts gradually and ends abruptly was distinctly preferred over other
force-field shapes and it proved to be the most efficient shape as well.
0This chapter is based on Keuning, H. and Monne, Y.K.J. and IJsselsteijn, W.A. (in prepa-ration). The form of augmented force-feedback fields and the efficiency and satisfaction incomputer-aided pointing tasks. Invited revision by Human Factors

3 The shape of augmented force-feedback fields
3.1 Introduction
Graphical User Interfaces (GUI’s) together with the development of the mousehave made it possible to ’directly manipulate’ objects on the screen (Shnei-derman, 1983). This greatly improved the effectiveness and efficiency of, andsatisfaction with a computer task. Since then efforts have been focussed onfurther improving the directness of object manipulation. This can be done byadding other kinds of feedback to visual feedback, for example, to make theinteraction with objects more natural. One example is adding haptic feedback(e.g. Akamatsu & Sato, 1994). Especially in medical applications this has provento improve the accuracy of tasks. Another method is to augment the feedback.This may be less natural, but still more efficient. Augmented feedback refersto the situation where the area in which feedback is applied extends beyondthe area of the original visual target. McGuffin and Balakrishnan (2002), forexample, visually augmented targets by increasing the visual size of the targetsduring the movement. The effect was that movement times showed a reductionof 12%. In the present research, we want to add augmented haptic feedback toa 2-dimensional desktop environment. This is realized by creating a mechanicalforce field that surrounds the target. Within the force field the device guidesthe user towards the target. This guidance enables the user to start out movingless accurately and to rely on force feedback to home in on the target. Ourresearch goal is to find out which features of a force field enhance efficiency ina target-acquisition task. In other words, we want to investigate fundamentaland applied aspects of haptic feedback devices to help the user to get to a targetfaster and in a more pleasant way.Research on the usability of augmented force fields is rather scarce. In anexperiment by Hasser et al. (1998) subjects performed a target-acquisition taskwith a FEELit mouse. The force they provided had a gradual onset at a point30 pixels before the target to 20 pixels before the target, followed by a constantforce over the next 10 pixels and then a force that decreased linearly as afunction of distance until the subject entered the target. Movement times were61% shorter than movement times with a conventional mouse. Moreover, 26%less errors were made with the FEELit mouse.A similar force-field shape (gradual onset and offset of the force) was used byDennerlein and Yang (2001). They also used the FEELit mouse and found areduction of 25% in the movement time.When applying a similar force-field shape, augmented over a distance of 45pixels in every direction, but using an electro-mechanical force-feedback track-
38

3.1 Introduction
ball, Goossens (1992) measured a reduction of movement time by almost 22%.When this force-field shape was restricted to the target area (thus not spatiallyaugmented) the reduction of movement time was 12% (Keyson, 1996). Theselatter findings indicate that by using augmented force fields, interacting withcomputers can become even more efficient compared to using non-augmentedforce fields.All of these results show that augmented force fields increase the efficiencyof a target-acquisition task. But would the user appreciate the presence ofaugmented force fields and, if so, what kind of force field is appreciated best?Leenders (1994) performed a target-acquisition experiment with three different(non-augmented) force-field shapes, or virtual holes, using the same force-feedback trackball that Goossens (1992) and Keyson (1996) used and whichwe used in the present experiment as well. The used force-field shapes werereferred to as ‘flat’, ‘hole’ and ‘combined’ reflecting their virtual hole-shape.The force fields provided by Dennerlein and Yang (2001), Goossens (1992),Hasser et al. (1998) and Keyson (1996) can all be categorized as ’flat’. The shapesare depicted in the upper part of Figure 3.1 by means of their height-distancecurves. This figure only is a visualization of what is felt by the user, namely, theball rolling into a hole. We did not mean to depict realistic heights, thereforeno units are shown on the Y-axes. In an ideal situation, without friction, thegravitational forces in these shapes are equivalent to the real forces applied tothe trackball. These forces are shown in the force-distance curves in the lowerpart of Figure 3.1. Within each shape Leenders (1994) varied the maximum forcelevel of the field between 0, 100, 225 and 350 mN. The subjects were instructedto feel all of the targets and rate the satisfaction with each, using a five-levelscale. Leenders found that the satisfaction was highest at the 225 mN forcelevel, and the combined form was preferred most. The results also indicatedthat higher force levels lead to shorter movement times. These results suggestthat force-field shape can influence indeed both efficiency and satisfaction in atarget-acquisition task.In our present experiment we have tried to approach the question which shapeand which force level of an augmented field render the highest efficiency andsatisfaction to the user. Since a force field can have an infinite number of shapesand force levels there are some choices to be made beforehand, to limit thenumber of different force fields to be compared.
39

3 The shape of augmented force-feedback fields
Targetborder
Targetcentre
Targetborder
Targetcentre
Targetborder
Targetcentre
‘Flat’ ‘Hole’ ‘Combined’
Distance Distance Distance
Forc
eH
eig
ht
Figure 3.1: The force-distance curves (lower part) with corresponding hole shapes, shown in theheight-distance curves (upper part) used in Leenders’ experiment. The approach direction isfrom left to right.
3.1.1 The set of force fields to be compared
With regard to the evolution of the force fields over distance, we can discernthree stages (see Figure 3.2): the initial stage, the middle stage and the finalstage. To reduce the set of force fields we impose some limiting constraints onthese stages. The first constraint is that in all stages the force is directed towardsthe target. The second constraint is that in the middle stage the force is keptconstant at its maximum level. The third constraint is that in the initial and finalstage, the force is linearly related to the distance from the target, with a slope be-tween zero and infinity. With these conditions, a force field can increase (initialstage) more or less abruptly toward a maximum force level (middle stage) anddecrease (final stage) more or less abruptly.By imposing the three constraints we reduce the number of possible force-fieldshapes, but still there are numerous ways to fill in these shapes. For examplewhat mean force level (MFL) is best suited? And how abruptly can a force bestbe started and finished?In a pilot experiment with a small number of subjects (n = 6), we compared six
40
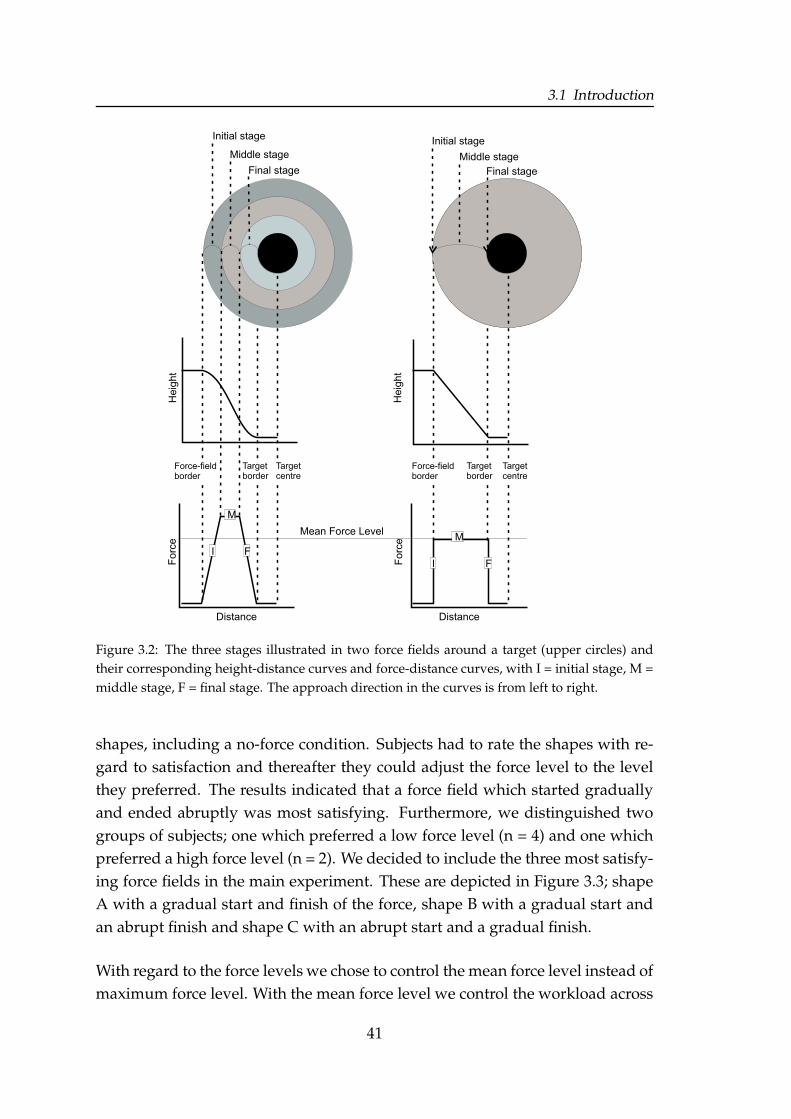
3.1 Introduction
Mean Force Level
Targetborder
Force-fieldborder
Targetcentre
Initial stage
Middle stage
Final stage
Force-fieldborder
Targetborder
Targetcentre
Initial stage
Middle stage
Final stageH
eig
ht
Heig
ht
Forc
e
Forc
e
Distance Distance
I
M
FI
M
F
Figure 3.2: The three stages illustrated in two force fields around a target (upper circles) andtheir corresponding height-distance curves and force-distance curves, with I = initial stage, M =middle stage, F = final stage. The approach direction in the curves is from left to right.
shapes, including a no-force condition. Subjects had to rate the shapes with re-gard to satisfaction and thereafter they could adjust the force level to the levelthey preferred. The results indicated that a force field which started graduallyand ended abruptly was most satisfying. Furthermore, we distinguished twogroups of subjects; one which preferred a low force level (n = 4) and one whichpreferred a high force level (n = 2). We decided to include the three most satisfy-ing force fields in the main experiment. These are depicted in Figure 3.3; shapeA with a gradual start and finish of the force, shape B with a gradual start andan abrupt finish and shape C with an abrupt start and a gradual finish.
With regard to the force levels we chose to control the mean force level instead ofmaximum force level. With the mean force level we control the workload across
41

3 The shape of augmented force-feedback fields
Mean Force Level
Targetcenter
Targetborder
Force-fieldborder
Targetcenter
Targetborder
Force-fieldborder
Targetcenter
Targetborder
Force-fieldborder
Shape A Shape B Shape C
He
igh
tF
orc
e
Distance Distance Distance
I
M
M MF
F FI I
Figure 3.3: The three force-field shapes compared in the experiment. Upper part: height-distancecurves. Lower part: force-distance curves, with I = initial stage, M = middle stage, F = final stage.The approach direction is from left to right.
shapes (the total workload [W] is computed as the force * path length). This pa-rameter must be equal across shapes to compare the efficiency (defined below)between different force-field shapes . The mean force levels to be used in theexperiment were deduced from the pilot experiment mentioned earlier, and are140 mN and 340 mN. The higher MFL was the mean of the subjects preferringhigh forces in the pilot experiment, the lower MFL was the mean of the subjectspreferring low forces. We expected shape B to lead to the most efficient and satis-fying movements. The abrupt end of this shape functions as a haptic cue to clickbecause this cue means that the target is reached. At the same time, we thoughtthat a gradual start of the force would be more satisfying than an abrupt start.An abrupt start attracts more attention than a gradual start, whereas the move-ment does not need attention at this point. For the latter reason we also thoughtthat shape A, having a gradual start, will be appreciated more than shape C,having an abrupt start.Concerning the mean force level, we expected the higher force level to be themost efficient, because this leads the user to the target faster and gives the clear-est cue. To the subjects preferring high force levels the higher MFL would be the
42

3.2 The experiment
most satisfying as well.The shapes were tested in pointing tasks, in horizontal, vertical and diagonal di-rections. In experiments described in Chapter 2, it was found that movements ina diagonal direction are more variable than movements in the other directions.Therefore the effect of force fields to movements in a diagonal direction maydiffer from the effect in other directions.
3.2 The experiment
3.2.1 Method
ParticipantsSeven women and five men, all students or employees of the Technology Man-agement faculty of Eindhoven University of Technology, participated in the ex-periment. All participants were experienced computer users, but had little orno experience with a trackball. All participants were self-reported right handedand had a vision that was normal or corrected to normal. The mean age was24, varying from 21 to 28. As agreed in advance, each subject was paid for theirparticipation after they had finished the experiment.
MaterialsA force-feedback trackball was used as a control device and for presenting hap-tic feedback to the user about the force fields. This trackball is equipped withtwo motors, one effective in the Y-direction and one in the X-direction. Thesemotors can make the trackball roll more easily or more difficultly, dependingon the rolling direction of the motors compared to the rolling direction of thetrackball. On a 19-inch (1024 x 768 pixels) Philips Brilliance computer screen,a standard Windows pointing arrow was used as a cursor. Cursor movementswere controlled by the trackball. A button on the trackball device was used toselect or click the object(s) presented on the screen. The experimental programwas written in MS Visual Basic 4.
ProcedureDuring the experiment the subjects were alone, seated at a table in a quiet room,with the trackball and the computer on it. The subjects were presented a screenwith a start button and a cursor. When the start button was clicked the button
43

3 The shape of augmented force-feedback fields
Figure 3.4: Position of all possible targets. The square in the center is the start button. The blackcircles are the targets.
disappeared and a target appeared in one of eight possible directions shown inFigure 3.4. In accordance with a compass card we will refer to the directions asN, NW, W, SW, S, SE, E and NE, where (N) corresponds with the target straightabove the start button. To limit the occurrence of premature movements, thetime between the moment the start button was clicked and the appearance ofthe target had a random delay from 0 to 1.5 seconds. Each trial, both in thetraining sessions and in the actual experiment, consisted of a target-acquisitiontask in which the participants had to click on the start button, wait for the targetto appear, move the cursor to the target area and click on the target. The targetshad a diameter of 30 pixels. A force field guided the subject to the target byapplying forces to the trackball. Every force field started at 125 pixels from thetarget center and ended at the target border. The distance between every targetcenter and the center of the start button was 250 pixels. Subjects were asked toperform the task as quickly as possible. Immediately after clicking the target atext box appeared in which the subjects had to rate their satisfaction with theforce field.
As mentioned before we used three different shapes and two MFL’s. Togetherwith eight different directions this makes a total of 48 conditions. Before theexperiment started, the participants were given a training session in which all48 conditions were presented. A text box appeared when the training sessionwas finished and the actual experiment began. In the actual experiment each
44

3.2 The experiment
condition was presented three times, resulting in a total of 144 trials that werepresented randomly.Before the start of the training sessions written instructions were given to theparticipants. When they had finished reading these, the instructions were ex-plained to the subjects verbally as well.
Data analysisEfficiency is usually operationalized by the number of errors and the time thatthe user requires to perform the task (Wickens et al., 1998), with efficiency beinggreater when the amount of time needed to reach the target is smaller. Since inour task no errors are possible, we measured the efficiency as the time betweenthe moment the target appears on the computer screen and the moment the sub-ject clicks on the target.Satisfaction with a force field is defined as the user’s preference for a force fieldin relation to other force fields. The satisfaction is measured using a preferencescale from 1 (unpleasant) to 7 (pleasant). In every trial the following data werecollected:
� (1) The condition number, which represented the direction in which thetarget was presented, the force-field shape and the mean force level.
� (2) The preference scores of the subjects, representing the satisfaction withthe force field.
� (3) The time needed to perform the task measured as the time between themoment that the target appeared and the moment it was clicked on.
� (4) The delay time between the moment the start button was clicked andthe appearance of the target.
Data that differ more than 2 times the standard deviation from the mean perfor-mance time were considered to be outliers.The effect of the within-subjects factors (MFL, shape and target direction) onboth dependent variables (satisfaction and efficiency) was tested separately bymeans of repeated measures ANOVA using SPSS. An � -level of .05 was used forall statistical tests. When interaction effects between the factors were found, aunivariate ANOVA and a Scheffe post-hoc test was performed to find out whatlevels of the factor differed from what other levels in their effect on the depen-dent variables.
45
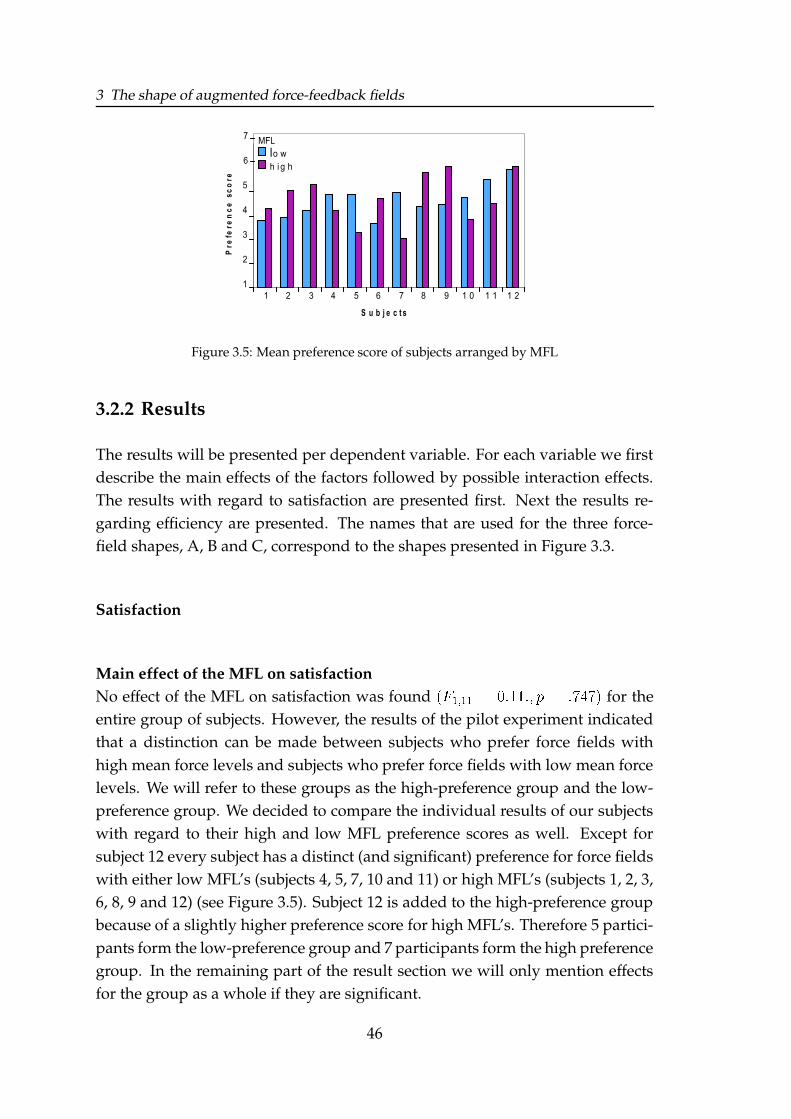
3 The shape of augmented force-feedback fields
1
2
3
4
5
6
7
1 2 3 4 5 6 7 8 9 1 0 1 1 1 2
S u b j e c t s
Pre
fere
nc
es
co
re
lo w
h i g h
MFL
Figure 3.5: Mean preference score of subjects arranged by MFL
3.2.2 Results
The results will be presented per dependent variable. For each variable we firstdescribe the main effects of the factors followed by possible interaction effects.The results with regard to satisfaction are presented first. Next the results re-garding efficiency are presented. The names that are used for the three force-field shapes, A, B and C, correspond to the shapes presented in Figure 3.3.
Satisfaction
Main effect of the MFL on satisfactionNo effect of the MFL on satisfaction was found
���4�%� �%� ��� ����� ��� ���1. ���for the
entire group of subjects. However, the results of the pilot experiment indicatedthat a distinction can be made between subjects who prefer force fields withhigh mean force levels and subjects who prefer force fields with low mean forcelevels. We will refer to these groups as the high-preference group and the low-preference group. We decided to compare the individual results of our subjectswith regard to their high and low MFL preference scores as well. Except forsubject 12 every subject has a distinct (and significant) preference for force fieldswith either low MFL’s (subjects 4, 5, 7, 10 and 11) or high MFL’s (subjects 1, 2, 3,6, 8, 9 and 12) (see Figure 3.5). Subject 12 is added to the high-preference groupbecause of a slightly higher preference score for high MFL’s. Therefore 5 partici-pants form the low-preference group and 7 participants form the high preferencegroup. In the remaining part of the result section we will only mention effectsfor the group as a whole if they are significant.
46

3.2 The experiment
1
2
3
4
5
6
7
A B C
S h a p e
Pr
efe
re
nc
es
co
re
l o w
h i g h
Preference group
Figure 3.6: Influence of shape on satisfaction. Error bars represent standard deviations.
Main effect of shape on satisfactionIn Figure 3.6 the influence of shape on satisfaction is shown for both preferencegroups. Separate tests were performed for the low and high-preference groups.No effect is found within the low-preference group
���!��� �/ � ���� ���� � ����(��.
Within the high-preference group the influence of shape on satisfaction is sig-nificant
������� ��� � 7�� .�( ����� � �������. A post-hoc test shows significant differences
between all three shapes for the high-preference group. The members of thisgroup preferred shape B most and shape C least.
Main effect of target direction on satisfactionThe effect of target direction on satisfaction is tested for the low and high-preference groups separately. Significant effects are found for both groups:low-preference group,
� "� �%� ���� ��������3 � ��7� , high-preference group,
� "� * � 7�� ��7�.0��� � �����
. In Figure 3.7 the mean preference scores are presented for eachdirection and for the low and high-preference group. The figure shows that thelow-preference group members generally prefer force fields of targets north ofthe start point (N, NE and NW) and subjects of the high-preference group gen-erally prefer force fields of targets presented in the other directions.
Interaction effectsThe repeated measures test shows no interaction effects with regard to eithercombination of shape, MFL and direction.
47

3 The shape of augmented force-feedback fields
1
2
3
4
5
6
7
N NE E SE S SW W NW
D i r e c t i o n
Pr
efe
re
nc
es
co
re
l o w
h i g h
Preference group
Figure 3.7: Influence of direction on satisfaction. Error bars represent standard deviations.
EfficiencyThe overall mean time needed to perform the task was 1438 ms. In generalthe low-preference group is slower than the high-preference group (respectively1646 ms and 1290 ms). In 2.1% of the cases outliers are found, meaning that themovement time exceeded 3231 ms. The number of outliers for shape A is 10, forshape B is 6 and for shape C is 20.
Main effect of MFL on efficiencySeparate tests were performed to determine the effects of MFL on efficiency forthe low and the high-preference groups. The tests show a significant effect ofthe MFL for the high-preference group
���4�%� # '(������ ����� � ��� ���, but no effect for
the low-preference group���4�%� * ���� �������� �� �� (��
. Figure 3.8 shows the time ofperformance for both groups per MFL.
Main effect of shape on efficiencyAn effect of shape is found for both low- and high-preference groups (low-preference group:
�!��� � (�� ��� ����� � ��� �, high-preference group:
�!��� ��� �9.0� ��.�. �� � �������
(see Figure 3.9). A post-hoc test shows that the efficiency ofshape B is significantly higher than the efficiency of the other two shapes, both inthe low-preference and the high-preference group. A difference between shapesA and C is not found in either group.
48

3.2 The experiment
1 0 0 0
1 1 0 0
1 2 0 0
1 3 0 0
1 4 0 0
1 5 0 0
1 6 0 0
Low High
M F L
Me
an
tim
e(m
se
c)
l o w
h i g h
Preference group
Figure 3.8: Influence of MFL on efficiency. Error bars represent standard deviation.
1 0 0 0
1 1 0 0
1 2 0 0
1 3 0 0
1 4 0 0
1 5 0 0
1 6 0 0
A B C
S h a p e
Me
an
tim
e(m
se
c)
low
high
Preference group
Figure 3.9: Influence of force-field shape on efficiency. Error bars represent standard deviation.
Main effect of direction on efficiency and interaction effectsNo effects of direction on efficiency are found (
� "� �%� � . ������� � (�7��, for the
low-preference group and� "� * �6���� � ������� �� ��� �
for the high-preference group).Neither are there any interaction effects between MFL, shape and direction onefficiency.
3.2.3 Discussion
Effects with regard to satisfactionWithin the low-preference group we found no preference with regard to theforce-field shape, whereas within the high-preference group the preferencescores for all shapes differed significantly. Compared to a force field with an
49

3 The shape of augmented force-feedback fields
abrupt start (shape C), a force field with a gradual start (shapes A and B) wasjudged to be more satisfying by subjects who prefer high MFL’s. The shape withthe abrupt finish (shape B) was rated highest. A possible explanation is foundin the more outspoken haptic cue of finishing abruptly, which makes the useraware of reaching the target area. Furthermore, the location of the haptic cueof shape B is right at the target border, whereas for the other shapes the forcesdiminished gradually to reach zero at that point. In a study on the perceptionof asynchrony for visual-haptic interfaces by Vogels (2001) it was found thathuman observers tolerate only small delays between visual and haptic cues.An annoying sense of delay could be experienced for shapes A and C, whereasforce field B is perceived as more coherent with the visually presented target,which leads to higher preference scores for the latter force-field shape.The low-preference group did not show a preference for any force-field shape.There are several explanations possible for this result:1. This could be effected by the dominance of the visual over the haptic system.The subjects in the low-preference group may have a different dominantmodality from the subjects in the high preference group when they performedthe targetacquisition task. According to a model proposed by Welch andWarren (1986), the degree to which two sensory modalities bias one anotheris determined by the observer’s distribution of attention. The subjects in thelow-preference group could, for example, have focused on the visual task(moving towards the target) rather than on the haptic task (exploring theforce-field shape), leaving them unaware of the differences between the shapes.2. This could be effected by the dominance of quantitative features overqualitative features (Welch & Warren, 1986). The subjects in the low-preferencegroup primarily focused on one specific aspect of the force fields, in particularthe differences between the MFL’s, causing them to remain unaware of thedifferences between the shapes.It is recommended that the reasons for the lack of shape preference of thelow-preference group will be studied in future research.
DirectionSignificant effects of direction on satisfaction were found for both groups, ei-ther group showing preference for opposing directions. The low-preferencegroup prefers force fields on targets in the N, NE and NW direction. The high-preference group prefers force fields on targets in the E, SE, S, SW and W. These
50

3.2 The experiment
direction effects can not be explained by differences in efficiency between thepreferred direction and others because there were none. Neither can this effectbe explained by a different path variability, because variabilities in opposite di-rections are equal (see Chapter 2).
Effects with regard to the efficiencyFor both groups the mean time needed to perform the task appeared to be equalfor shapes A and C. This indicates that the initial stage does not influence theefficiency of a target-acquisition task by itself. The mean time needed to per-form the task of shape B, which has an abrupt finish, was significantly shorterthan the mean time of the other two shapes. This indicates that an abrupt finishincreases the efficiency of a target-acquisition task. A possible explanation forthe influence of the abrupt finish on efficiency is that fewer errors are made dueto the signaling function that comes with the high force difference at the targetborder. In contrast with the other two shapes, shape B corrects the users directlywhen the cursor leaves the target area before the target is ’clicked’. In case ofovershooting the target the high force at the target border of shape B pushes thecursor back, providing the user with a haptic cue that indicates an overshoot ofthe target. Shapes A and C provide less outspoken haptic feedback close to thetarget border because they have a gradual finish. The relatively low number ofoutliers for shape B (i.e. 6, whereas shape A has 10, and shape C has 20) sup-ports this explanation. For future experiments it is recommended to measurethe number of times that overshoot occurs and the number of times the track-ball button is clicked when the cursor is outside the target area. These measureswill possibly provide a deeper insight into the different aspects that influenceefficiency.The faster response times of the high-preference group compared to the low-preference group could originate from differences in attention between the vi-sual and tactual modalities. According to Spence and Driver (1997) performancein one sensory modality suffers when task-relevant information is expected inanother modality. Therefore, if subjects of the low-preference group mainly fo-cused on the visual modality when performing the target-acquisition task, theywould be expected to gain less from the haptic information provided by theforce field. In combination with the fact that reaction times to tactual stim-uli are shorter compared to reaction times to visual stimuli (Gobel et al., 1995;Welch & Warren, 1986), this could explain the higher efficiency of the high-preference group. These findings seem to support the conjecture that subjects
51

3 The shape of augmented force-feedback fields
of the low-preference group mainly focus on the visual modality and subjects ofthe high-preference group mainly focus on the tactual modality when perform-ing a target-acquisition task. This would also support the second explanation re-garding the lack of shape preference of the low-preference group that was statedabove.
In conclusion, the most positive results for both the efficiency and satisfactionmeasures were found for force-field shape B.
Mean force levelIt was further observed that only within the high-preference group the efficiencyincreases significantly with a higher MFL. This could be the result of the high-preference group focussing on movement speed and the low-preference groupfocussing on movement accuracy, despite the instruction to move as quickly aspossible. It is likely that the low-preference group is less interested in changingtheir movement strategy to a faster, less accurate ’sweeping’ movement (e.g.Gobel et al., 1995; Goossens, 1992; Keyson, 1996). As a result of that, a higherMFL did not result in higher efficiency for this group.The difference in priority for speed or accuracy could also be the underlyingexplanation for the differences in focus on modality between the low and high-preference group.
DirectionThe direction from which the target is approached does not influence theefficiency of a target-acquisition task. Apparently, the effect of different pathdirections upon the variability in cursor path length, as found in Chapter 2, arenot corroborated by differences in time to perform the target-acquisition task inthe present research.
General discussionA finding which we did not point out yet, but is worth noting, is that subjectspreferring a high mean force level do apparently show a true perceptual differ-ence between the shapes. Looking at Figures 3.6, 3.7, 3.8 and 3.9 it can be seenthat in most of the ’significant’ cases the difference between the means is largerthan the (one-sided) error-bar (i.e. one standard deviation). Assuming that thestandard deviations are the same for each group, if the ratio of mean differenceand standard deviation is larger than unity, the effect is perceptually considered
52

3.3 Conclusion
to be above sensation threshold (Green & Swets, 1966). This supports the secondreasoning we made on the low-preference group showing no preference for anyforce-field shape. They just were not aware of any shape differences.1
We see an ergonomic point to which information on the most efficient and sat-isfying force field is useful. An augmented force field is directed towards theuser’s target and meant to help to control the movement. The most efficient andsatisfying force-field shape can be expected to help best. In our view the move-ment is helped by decreasing the muscle force needed to meet time requirementsand decreasing the co-contraction needed to meet accuracy requirements. Thisdecrease in force and co-contraction may help to prevent RSI (Van Galen et al.,2002).Information about an optimal force field is also useful for building applicationsto support target-acquisition tasks in a more realistic situation, and in particu-lar in situations in which objects are situated closer to each other. A necessaryimprovement of such software is to apply force fields in an iterative way. Thismeans that at given times during the movement the application will make a pre-diction of the user’s current target and, thus iteratively, activate the force fieldaround only the predicted target. This research is described in Chapter 6 of thisthesis.
3.3 ConclusionThe present research was concerned with finding the shape and the mean forcelevel of augmented force fields that makes a target-acquisition task most effi-cient and satisfying. The main conclusion that can be drawn from the experi-ment is that for subjects preferring a high mean force level (MFL) both shapeand mean force level of augmented haptic force fields influenced the efficiencyand the satisfaction in a target-acquisition task. They preferred a force field thatstarts gradually and ends abruptly over other shapes. Moreover, the preferredforce-field shape produced the most efficient movements. The preference andthe higher efficiency of this force-field shape are presumably caused by the sig-naling effect of the high force at the target border. Efficiency was further im-proved by higher MFL’s, but only for subjects of the high-preference group. Thedifferences between the high- and the low-preference group can be explainedby the assumption that subjects of the low-preference group mainly focus on thevisual modality and subjects of the high-preference group mainly focus on the
1In this reasoning we assume that the behavior of subjects within each group is equal
53

3 The shape of augmented force-feedback fields
tactual modality when performing a target-acquisition task. Another explana-tion is that subjects of the low-preference group focus more on accuracy of themovement than on speed. A higher MFL possibly makes them counteract theforce feedback to keep control of the movement’s accuracy.Because only a limited number of force-field shapes could be compared in thisexperiment, a selection had to be made. For this purpose we introduced a num-ber of constraints, resulting in a limited number of testable field forms. Onesuch constraint is that the start and finish were linearly related to the distanceto the target. It is quite possible, however, that due to this inevitable catego-rization process, some more efficient or preferred force-field shapes have beendisregarded. The results, however, do provide new theoretically and practicallyrelevant information with regard to the parameters that influence the efficiencyand satisfaction with an augmented force field.
54

3.A Appendix: Written instructions
3.A Appendix: Written instructionsOnderzoek naar de efficiency en voorkeur van krachtvelden.
Met dit onderzoek moet je steeds een aanwijstaak uitvoeren met een ”gemo-toriseerde” trackbal. Elke aanwijstaak bestaat uit drie delen:
� Druk op ”Start” (en wacht tot een Target verschijnt, een zwart rondje ophet scherm)
� Ga zo snel mogelijk met de cursor naar het Target toe
� Klik op het Target.
Rond elk Target kunnen verschillende soorten krachtvelden worden geactiveerd(die zijn niet plaatsgebonden). Je taak is om elke keer als je een aanwijstaak hebtuitgevoerd aan te geven hoe ”prettig” of ”onprettig” je het krachtveld vond. Ditdoe je door na de aanwijstaak op een getal (op een schaal van 1 tot en met 7) ophet toetsenbord te drukken. Let op: de verschillen zijn klein.
Prettig 1 2 3 4 5 6 7 Onprettig
Je krijgt van tevoren 48 oefentrials. Daarna kan je met het experiment be-ginnen door op Enter te drukken.
Belangrijk: Je bepaalt hoe je de (subtiele!) verschillen tussen de krachtveldenervaart; gebruik daarvoor, zo mogelijk, de hele breedte van de schaal.
55

3 The shape of augmented force-feedback fields
56

4The role of size of an augmented
force field in computer-aidedtarget-acquisition tasks
AbstractTwo experiments are described to test the extent to which a force field can best be aug-
mented to help a computer user, using a force-feedback trackball, towards a target in
the most efficient and satisfying way. In the first experiment four radii of a circular force
field were tested, starting after 0%, 30%, 60% or 80% of the total distance of a cursor
movement was covered. The largest force field was most efficient. With this field the
target acquisition task was performed in the shortest time. This field, however, was
the least appreciated, whereas a force field starting after 60% of the path was covered
was most appreciated. In the second experiment two or more objects were presented si-
multaneously. A prediction algorithm was included, which predicts the user’s intended
target using the initial phase of the movement. Because no prediction can be made after
0% of the distance is covered, the largest field radius was skipped in this experiment.
It turned out that a field starting after 30% of the total distance was now the least effi-
cient and least satisfying field. The no-force condition was most efficient, but was not
rated higher than the two smallest fields. This latter result suggests that if the prediction
could be improved, augmented force fields starting after 60% of the total distance are
the most promising.

4 The role of size of an augmented force field
4.1 Introduction
The introduction of Graphical User Interfaces (GUI’s) has made target acquisi-tion an important aspect of human-computer interaction. By target acquisitionwe mean moving the cursor to an object on the screen and clicking on it using acontrol device, such as a mouse. Several studies, investigating the best controldevice for this task, have shown that the mouse leads to the best trade-offbetween speed and accuracy (e.g. Card et al., 1978, Douglas & Mithal, 1997,Epps, 1986). A potential negative side effect of repeatedly using a controldevice is the occurrence of Repetitive Strain Injury (RSI). Van Galen et al.(2002) found that an important factor in the development of RSI is an increasedco-contraction of muscles during fine motor tasks, such as typing and writing.This is a normal strategy applied to have better control over the movement, butimplies a risk when sustained over prolonged periods of time. Control devicesand interfaces are being developed in which visual feedback is augmented withother types of feedback, not only to decrease RSI, but also to increase the direct-ness (Shneiderman, 1983) of object manipulation. For example, experiments byKeyson (1996) show that adding force feedback to visual feedback reduces themovement time of a target acquisition task by 12-20%.In addition to the mere presence of feedback, feedback can also be augmentedin a particular aspect, for instance an area in which it operates. This meansthat the area in which feedback is applied extends beyond the area of the(original) visual target, for instance, by visually augmenting the targets. Whenapproaching an object, it visually expands so that the cursor enters its areasooner. McGuffin and Balakrishnan (2002) found reductions of about 12% inmovement times.In the present research augmented force feedback is added to a 2-dimensionaldesktop environment. Feedback is realized by creating a force field that sur-rounds the target. Within the force field the device guides the user towards thetarget. This guidance enables the user to start out moving less accurately and torely on force feedback to home in on the target. Hasser et al. (1998) and Den-nerlein and Yang (2001) found reductions of 61% and 29% in movement timesusing augmented force feedback in a FEELit mouse. Both used a force field inwhich the force onset and offset were gradual. From Chapter 3, we learnedthat target acquisition using a force-feedback trackball was most pleasant andfastest when the force increases gradually and ends abruptly at the border ofthe target. It also seemed that two groups of subjects could be distinguished:one group preferring a low and another group preferring a high maximum
58

4.1 Introduction
force level. In this study the force always started when 50% of the total distancewas covered. Since the distance between the center of the start button and thetarget center was 250 pixels, this meant that the radius of the force field was 125pixels. Although successful, this does not mean that this is the most efficientand pleasant force-field radius to support target acquisition.This Chapter describes two experiments in which the influence of differentforce-field radii on efficiency and satisfaction is tested within a target acquisitiontask. In the first experiment efficiency and satisfaction were tested separatelyusing four different force-field radii. Only one target at a time was presented, sono interference of force fields could occur. Our ultimate goal was to develop analgorithm that could predict the user’s intended target, so that, after an initialpart of the movement, the computer could decide what object must be equippedwith a force field to avoid interfering force fields. In the second experimentthe application of a prediction of the user’s target and manipulations of theforce-field radius were combined. The prediction algorithm developed inChapter 2 was included to predict the direction of the intended target, using theinitial part of the movement path. The algorithm simply states that the straightline between the first and the last sample can be extrapolated. The object nearestto this extrapolated line is considered to be the user’s intended target. Thisprediction becomes better when the user gets closer to the target. So, a forcefield with a small radius will more often be pointed towards the correct targetthan a force field with a large radius. A small force field, however, provides lessopportunity to make use of it. For a realistic application of force fields one hasto search for a force-field radius that leads to an optimal trade-off between thesuccess of the prediction algorithm and the amount of advantage the force fieldoffers.It is expected that, by adding a target-directed force field, users will profit byhaving shorter movement times or by needing less co-contraction to be accurate.In both cases the expectation is that users evaluate the force-field condition asmore satisfying than a no-force condition. If the success rate of the prediction isso low that movement times are longer than movement time without force, orif the user experiences it as irritating, satisfaction with the force-field conditionwill be lower than without it.As the number of possible force-field radii is too large to test we decided totest a limited selection of radii. This selection is based on known movementkinematics in pointing tasks. In general, movements towards a target show twophases; a Distance Covering Phase (DCP), in which the target is approachedby a ballistic movement, and a Homing In Phase (HIP), in which the target is
59

4 The role of size of an augmented force field
reached via one or more submovements (Woodworth, 1899). Experiments withcomputer mice executed by Vande Ven (2002) show that in cursor movementsthe first, ballistic movement covers around 60-70% of the total distance. There-fore three force-field radii were chosen: one starting halfway through the DCP(after 30% of the total distance is covered), one starting at the end of the DCP(after 60% of the total distance is covered) and one starting halfway through theHIP (after 80% of the total distance is covered).The expectation is that, with the largest force-field radius, too many predictionerrors will be made to be satisfying. The smallest field is probably too small forthe user to benefit optimally. Therefore we expect that the medium force field(60% of total distance) to be rated best and that it will also lead to the shortestmovement time.We use the most preferred force-field shape, as found in Chapter 3, and the onewith the highest mean force level. This was a force field with a gradual startand an abrupt end. The maximum force in each field is the same, being 340 mN.The space between the targets was set so that a rate of 69% correct predictions ispossible. As found in Chapter 2 the distance between the target borders shouldthen be 24 pixels. Moreover, only targets are tested that are situated at equaldistances from the start position, because the prediction algorithm does notaddress target distance.
4.2 Experiment 1The first experiment consists of two parts, one part in which satisfaction is testedby ranking the different force-field radii when performing a target-acquisitiontask, and one in which the efficiency of a target-acquisition task is tested. Sat-isfaction and efficiency are tested separately, so that subjects are forced to focuson their subjective evaluation in the first part.
4.2.1 Method
SubjectsSubjects were twelve students (eight male and four female) all of whom writewith their right hand. Their mean age was about 24. All had experience with amechanical mouse, but not with a force-feedback trackball, any other trackballor force-feedback device.
60

4.2 Experiment 1
Experimental setupBoth interfaces were created with Visual Basic 4.0 on a screen with a resolutionof 1024 by 768 pixels. In the ’satisfaction’ part three start buttons, and threetargets were shown (see Figure 4.1). The targets were 30 pixels in diameter andwere situated 460 pixels above the center of the start button. Each target wassurrounded by a force field of different radius. Four different force-field radiiwere presented: 1) the largest field, starting directly at the edge of the startbutton after the start button is pressed (radius of 450 pixels), 2) a medium largefield, starting after 30-35% of the total distance is covered (radius of 330 pixels),3) a medium small field, starting after 60-70% of the total distance is covered(radius of 180 pixels) and 4) the smallest field, starting after 80-85% of the totaldistance is covered (radius of 80 pixels).
Start Start StartRanking
score : 2 1 3
Figure 4.1: Interface layout during the ’satisfaction’ part of the experiment. The black circlerepresent the targets. Each target is surrounded by a different force-field radius. The lowersquare are text boxes in which the subjects could give their ranking scores. The other squaresare the start buttons; from this position the movement to the target on top of it starts.
In the ’satisfaction’ part of the study three start buttons were shown as wellas three targets. After pressing one of the start buttons the target right aboveit became equipped with a force field. Subjects had to move to this target,which’ center was 460 pixels from the center of the start button. After movingat least five times to each target subjects had to fill in a ranking score. The fieldpreferred most got score 1, the field preferred least got score 3.In the ’efficiency’ part of the study a single start button was shown in the centerof the screen at the beginning of each trial (see Figure 4.2). After pressingthis button it disappeared and a target, 30 pixels in diameter, appeared in theupper left corner of the screen. After clicking on this target it disappeared andanother target appeared in the upper right corner. After clicking, this target wasfollowed by two more targets in the lower right and lower left corners. Thissequence was presented twice. The distance between the targets was 460 pixels.
61

4 The role of size of an augmented force field
Start
Figure 4.2: Interface layout during the ’efficiency’ part of the experiment. The black circlesrepresent the targets. Each target is surrounded by the same force-field radius. The square in thecenter of the screen is the start button; from this position the subjects start.
A force-feedback trackball was used, both as a control device and for presentingforce feedback to the user. The trackball was equipped with two servomotors,one effective in the Y-direction and one in the X-direction. These motorscan make the trackball roll with more or less apparent friction, depending onthe rolling direction of the motors relative to the rolling direction of the trackball.
ProcedureSubjects were seated at a table with a computer screen and a mechanical force-feedback trackball on it. Subjects started with four trial blocks in which force-field radii had to be ranked according to preference. The task was to click on a(self-chosen) start button and then to move to and click on the target right aboveit, which was then surrounded by a force field. Each target had to be reached atleast five times. Only then a ranking score could be filled in. In each block threefields were compared. The most preferred field was ranked 1, the least preferred3. Each field was presented three times during the four blocks, and no identicalcombinations of three radii were ever presented. Between subjects the order ofcombinations differed according to the Latin Square principle. After the fourblocks were completed, the ’efficiency’ part started. In this part, subjects startedby pressing a start button located at the center of the screen. After pressing, thisbutton disappeared and the starting position was shown in the upper left cor-ner by way of a target-like object. After moving the cursor towards this startingposition and clicking on it the object disappeared and the first target, in the up-per right corner, appeared surrounded by one of the four force-field radii. Aftermoving towards this target and clicking on it, the next target appeared in the
62
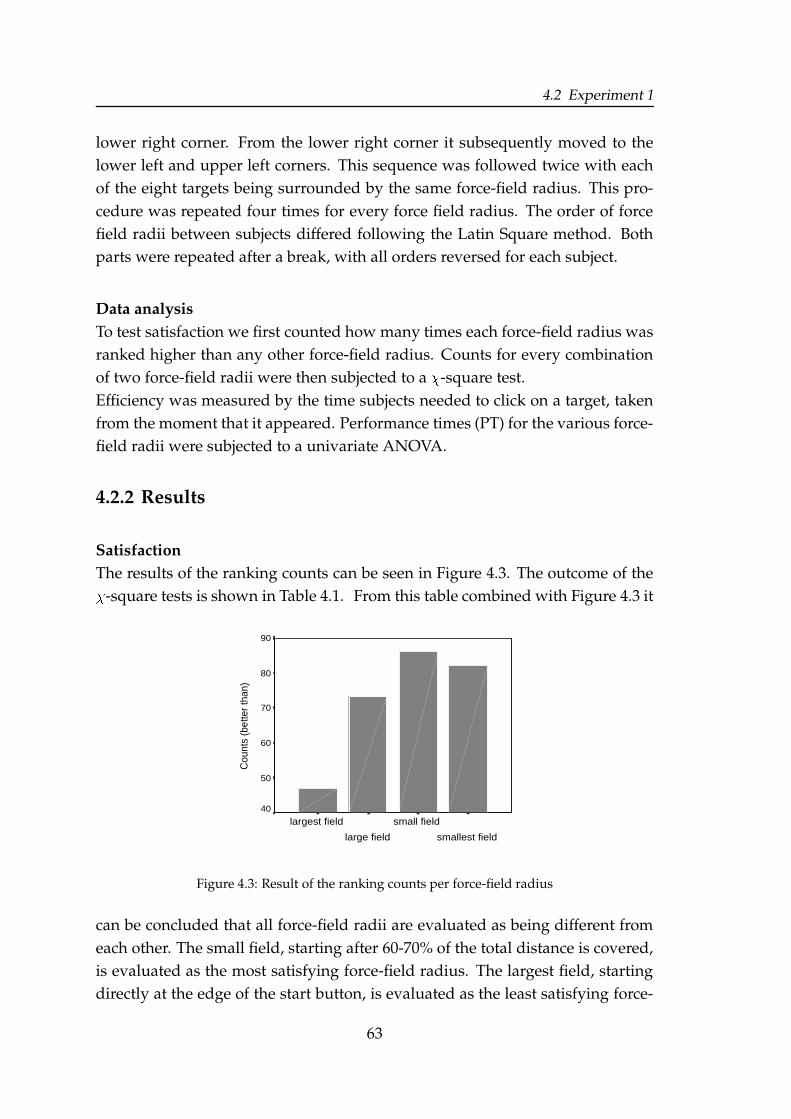
4.2 Experiment 1
lower right corner. From the lower right corner it subsequently moved to thelower left and upper left corners. This sequence was followed twice with eachof the eight targets being surrounded by the same force-field radius. This pro-cedure was repeated four times for every force field radius. The order of forcefield radii between subjects differed following the Latin Square method. Bothparts were repeated after a break, with all orders reversed for each subject.
Data analysisTo test satisfaction we first counted how many times each force-field radius wasranked higher than any other force-field radius. Counts for every combinationof two force-field radii were then subjected to a � -square test.Efficiency was measured by the time subjects needed to click on a target, takenfrom the moment that it appeared. Performance times (PT) for the various force-field radii were subjected to a univariate ANOVA.
4.2.2 Results
SatisfactionThe results of the ranking counts can be seen in Figure 4.3. The outcome of the
� -square tests is shown in Table 4.1. From this table combined with Figure 4.3 it
smallest field
small field
large field
largest field
Cou
nts
(bet
ter t
han)
90
80
70
60
50
40
Figure 4.3: Result of the ranking counts per force-field radius
can be concluded that all force-field radii are evaluated as being different fromeach other. The small field, starting after 60-70% of the total distance is covered,is evaluated as the most satisfying force-field radius. The largest field, startingdirectly at the edge of the start button, is evaluated as the least satisfying force-
63

4 The role of size of an augmented force field
Table 4.1: Results of the � -square tests of force-field radii, �������� �� � and � �������� �� � .vs large field small field smallest fieldlargest field ��������� ��� ������� ��� �����large field – �� �!��� "#����$��small field – – "#� "�$����
field radius.
EfficiencyThe PT’s per force-field radii are depicted in Figure 4.4. An ANOVA showed thatthere is a significant effect of force-field radius on PT
��� $�� #%$ �7�� 7�� ����� � � �����.
A Scheffe post-hoc test showed that the large field is significantly faster than thethree smaller fields (
�'� � ���, for all fields) and that the medium large field is
significantly faster than the two smaller fields (� �3� ���
, for both fields) as well.
largest field large field small field smallest field500
750
1000
1250
Mea
n pe
rform
ance
tim
es (m
s)
Figure 4.4: Mean performance time (ms) per force-field radius.
4.2.3 Discussion and conclusion
The first experiment shows that as the force-field radius becomes larger, the PTbecomes shorter. Subjects benefit from the force as it guides them to their targetquicker. Satisfaction, however, is lowest with the largest force field. It appearsthat subjects do not like to give up control that soon during the movement. Butsubjects do not seem unwilling to relinquish some of the movement control tothe computer. After the DCP is completed and the fine-tuning HIP starts, theyappear to like a force field better than during the actual fine tuning (smallestfield).
64

4.3 Experiment 2
In the next experiment we investigate whether this is still true when a predictionof the target is added, based on the current direction of the trajectory at severaldistances from the target. This means that a force field could also be directed toa non-target. In this experiment the largest force-field radius is not used becauseof the absence of an adequate basis for a target prediction.
4.3 Experiment 2In the second experiment the application of a prediction of the user’s target, asdeveloped in Chapter 2 of this thesis, and manipulations of the force-field ra-dius were combined. Efficiency and satisfaction were measured simultaneouslyduring a target acquisition task with more than one objects present.
4.3.1 Method
SubjectsSubjects were twelve students (five male and seven female) all of whom writewith their right hand. Their mean age was about 22. All had experience with amechanical mouse, but not with a force-feedback trackball, any other trackballor force-feedback device.
Experimental setupAn interface was created with Visual Basic 4.0 on a screen with a resolution of1024 by 768 pixels. In the center of the screen a start button was shown. Thecursor was presented as an arrow. At a distance of 250 pixels (about 7 cm onthe screen) from the center of this button, ten black circles, 30 pixels (0.8 cm) indiameter, were presented (see Figure 4.5). The distance between target borderswas 24 pixels. All of these circles, except the two at the ends, could becometargets during the experiment, which was achieved by changing their colorfrom black to yellow. The outer two circles were only there to create neighborobjects for all targets. The eight target circles covered an entire quadrant of acircle, in fact even slightly more. To the extent that movements in each quadrantare the same, the results obtained can be generalized to a whole circle (seeChapter 2).
65

4 The role of size of an augmented force field
During each trial, X- and Y-coordinates of the cursor and the system time weresampled (in pixels) with a frequency of 200 Hz.
Figure 4.5: Position of all possible targets. The square in the center is the start button. The blackcircles are the targets except for the outer two.
ProcedureSubjects were seated at a table on which a computer screen and a mechanicalforce-feedback trackball were placed. After pressing a button on the device withthe left hand while the cursor was on the start button, one of eight circles wasrandomly indicated as target by becoming yellow. At the same time the startbutton disappeared. There was a random delay of 0 to 1.5 seconds betweenthe moment the start button was clicked and the appearance of the target tolimit the occurrence of premature movements. Subjects were asked to move thecursor from the start button to the target and click. They could do this with aself-defined speed-accuracy trade-off and could start whenever they were readyfor it. When the target was clicked on it became black again and the ’start’ but-ton re-appeared. Then the cursor could be moved to the start button again tostart the next trial. Before the experiment started, the participants were given atraining session in which all force-field radii were presented four times. A textbox appeared when the training session was finished and the actual experimentbegan.
66

4.3 Experiment 2
DesignFour different block types were designed. In one block type a no-force-field con-dition was given. This block type alternates with each of the three force-fieldblocks. In these force-field blocks a prediction was made by the control systemabout which object was indicated as a target by analyzing the initial movementof the cursor. Then a force field was created around the predicted object, guidingthe subject to this object by applying forces to the trackball. The three force-fieldblocks differed in the force-field radius that was applied (175 pixels, 100 pixelsor 50 pixels). Each force-field block was presented two times, following the de-sign shown in Table 4.2. Within each block the eight targets were presented
Table 4.2: Orders of the blocks: N=no-force block, A=largest force-field block (175 pixels),B=middle large force field (100 pixels), C=smallest field (50 pixels) per six subjects
pp1 N A N B N C break N C N B N App2 N B N C N A break N A N C N Bpp3 N C N A N B break N B N A N Cpp4 N C N B N A break N A N B N Cpp5 N B N A N C break N C N A N Bpp6 N A N C N B break N B N C N A
randomly, but always four times, adding up to a total of 32 trials per block. Inthe total experiment 12 blocks were presented, resulting in a total of 384 trials.Directly after each block a text box appeared in which the subjects had to fill ina number from -3 (bad) to +3 (good), representing a preference score.
Data analysisAs a measure of efficiency we decided to use the time needed to perform thetask (PT). The shorter the PT the more efficiently the target-acquisition task wasperformed. PT was defined as the time (in milliseconds) between the momentthat the target appeared and the moment it was clicked on.We measured satisfaction by asking people to give a preference score of eachforce-field condition as compared to the no-force condition. So, a score of zeromeant that the user found the force-field condition and the no-force conditionequally satisfying. If they evaluated a force-field condition as less satisfyingthey rated it negative (minimally -3). If they evaluated a force-field condition asmore satisfying they rated it positive (maximally +3). Both PT and preferencescores were analyzed by a repeated measures ANOVA. Factors in this ANOVAwere ’order’ (before or after the break) and ’radius’ (a large, a medium or a smallfield radius).
67

4 The role of size of an augmented force field
4.3.2 Results
Success of the predictionThe success rate of the prediction can only be tested within the three force-fieldconditions and not with the no-force condition, because no prediction was donein the no-force condition. The mean success rate of the large field was 57.63%.The mean success rate of the medium and small field were 74.2% and 74.53%.
Preference scoresFigure 4.6 gives the mean preference scores.
Order
after break before break
Mea
n pr
efer
ence
sco
re
1.0
.5
0.0
-.5
-1.0
-1.5
-2.0
Field
large
medium
small
Figure 4.6: Mean preference score for each force-field radius. In the left cluster the scores beforethe break are given and in the right cluster the score after the break are given.
The repeated measures ANOVA showed a main effect for ’radius’��� ��� �%�<
(���� ��(���� � � �����, but not for ’order’
���)�%� �%� ��� ��������� ���. To test whether
the means differed significantly from each other we did a one-way ANOVAand a Scheffe post-hoc test. Because no order effect was found this ANOVAwas performed on the joint preferences scores before and after the break. TheANOVA showed a significant difference in the means for various force-fieldradii
������� #%52 � ��� ( �� ����8� � �����. The post-hoc test showed that the largest field
had a significantly lower score than the other two fields (� � � ���
, when com-pared with both fields). The two smallest field were rated similar
� � '� (��.
We also tested whether the two smallest fields were rated as significantly dif-ferent from zero, i.e. compared to the no-force condition. This test resulted int-scores �
�%$ ������ ����� � (��1., for the medium field and �
�%$ ��� .0���� � ���� for the
smallest field, so neither of them differed significantly from zero.
68

4.3 Experiment 2
Time needed to perform the taskFigure 4.7 shows the mean time necessary to perform the target-acquisition taskper force-field radius, clustered before and after the break. To test the effect
Order
after break before break
Mea
n pe
rform
ance
tim
es (m
s)
1700
1600
1500
1400
1300
1200
Field
no
large
medium
small
Figure 4.7: Mean times to perform the target-acquisition task for each force-field radius. In theleft cluster the times before the break are given and in the right cluster the times after the breakare given.
of ’radius’ and ’order’ four repeated measures ANOVAs were performed. Inthe first three the results of each force-field condition were compared with theno-force condition. In the fourth ANOVA the three force-field conditions werecompared. In the comparisons with the no-force condition all repeated measuresANOVAs depicted a significant main effect for radius (the no-force conditionhaving radius zero) and order. The no-force-field condition resulted in fasterperformances than the large force-field condition
��� �%� �%� ��������������� � � �����, the
medium force-field condition���4�%� �%� . �� ��������� � � �����
and the small force-fieldcondition
���)�%� �%� � ��� . � ����� � � �����. In all these cases the performance times af-
ter the break were shorter than the performance times before the break��� �%� �%���
� �����/� � �����. In addition, a main effect for ’radius’
���!��� �%� � ���� �������� � � �����as
well as ’order’���)�%� �%� � 7�� ���� ���� � � �����
between the force-field conditions wasfound. A Scheffe post-hoc test showed that the large field resulted in signifi-cantly slower performance times than the two smaller fields. This was the casebefore the break (
� � ��7�.for the medium field and
� � � ���for the small field)
and after the break (� '� �����
for the medium and� �3� ���
for the small field). Thetwo smallest fields did not differ from each other before the break (
� � .����) or
after it (� '����� �
). No interaction effects were found.
69

4 The role of size of an augmented force field
4.3.3 Discussion and conclusion
It is clear that extending the workspace with competing objects makes the ad-dition of a force field less beneficial. In the second experiment subjects movedslower in force conditions than in the no-force condition. The performance timesin the second experiment were highest for the largest force field, whereas thereverse was true in the first experiment. This result must be attributed to thesuccess rate of the prediction algorithm. Subjects are probably afraid of beingguided to the wrong target. To prevent this guidance they focus less on speedand more on accuracy of the movement.Despite faulty predictions and slower performance times in the second experi-ment, subjects do rate the two smallest force-field conditions as positive, and inboth the second experiment and the first experiment the largest field is rated asbeing the least satisfying. This is despite the fact that the two larger fields resultin the shortest performance times, at least in the first experiment. This meansthat it is probably more important to subjects to obtain information about the ap-proach to and arrival at the target than to be facilitated in moving towards it. Thesame was suggested in Chapter 3, where it was found that the shape of the forcefield was most satisfying when the force started gradually and stopped abruptlyat the target border. The explanation of this result was that the abrupt stop at thetarget border provides a haptic cue about the arrival and prevents overshootingof the target, because the same force field starts abruptly on the other side of thetarget. As this is exactly the shape we used in the experiment presented here, wethink the same explanation is valid for the result that the two smallest fields arerated as most satisfying. Since they were not significantly more satisfying thanthe no-force condition and led to a longer performance time than the no-forcecondition, adding a force field does not seem recommendable. However, an in-fluence on the results can be that subjects need more time to adapt to the newdevice and to being guided by a force field. In a new situation, especially if it hasa higher degree of difficulty, e.g. if the targets are situated close to each other asin the second experiment, subjects tend to go for accuracy instead of speed. Af-ter the break subjects already moved faster in all conditions. A between-subjectsdesign should be a better procedure perhaps to test the effect of force-field radii.In such a design subjects are only exposed to one condition, so that they canadapt faster.The contribution of this study to the field of cognitive ergonomics is that it showsthat technical developments are not always as positive as they seem. It cannot be simply stated that adding augmented force feedback facilitates a target-
70

4.3 Experiment 2
acquisition task. First of all the shape of the force field matters, as shown inChapter 3. Second, the extent of the field matters. We found that introducingcompeting objects influences the effect of force-field radius. A large radius is notas efficient in a situation with more than one object present. An improvementof the success rate of the prediction algorithm should improve the performancetimes and the satisfaction with force fields, especially if their radius is mediumor large, since subjects can trust the prediction better and, consequently, focusmore on speed than on accuracy. By making the prediction in an iterative way,as we plan to do in future experiments, we expect to have more success whilekeeping the same prediction algorithm. With an iterative prediction we meanto do several predictions during the movement, so that an incorrectly directedforce can soon be changed into a correctly directed force.
71

4 The role of size of an augmented force field
72

5Profits and costs of augmented forcefeedback via an iterative prediction
procedure
AbstractThe aim of the present study is to investigate whether for target acquisition in Human-
Computer Interaction an iterative prediction of a user’s intended target leads to a more
efficient and more satisfying application of augmented force fields than a one-step pre-
diction. A one-step prediction of an intended target is made purely on the basis of the
initial phase of the movement. An iterative prediction is an adaptive procedure that
uses several phases of the movement. An experiment was performed in which two
force fields of different sizes were presented via a one-step and via an iterative pro-
cedure. Fourteen subjects made several cursor movements towards one out of eight
possible objects. After moving several times to targets in eight different directions but
having the same force field, subjects had to rate the force field with a score between -3
(bad) and +3 (good). With the one-step prediction procedure force fields of both sizes
were rated as negative, whereas the iterative procedure yielded positive ratings for both
fields. In both prediction procedures the larger field was considered less satisfying than
the smaller field. Ratings for both field sizes became more positive during the exper-
iments, for both prediction procedures. Performance times were shorter in both the
iterative and the no-force condition, compared with the one-step prediction procedure,
but were not different for the various force field sizes. Combining the results on effi-
ciency and satisfaction one can conclude that an iterative target prediction that turns on
a force field after 60% of the total distance has been covered is appreciated more than a
no-force condition, and is equally efficient.

5 Augmented force feedback via an iterative prediction procedure
5.1 Introduction
After the introduction of the mouse and Graphical User Interfaces (GUI’s) inthe seventies seventies a lot of research has been done to further improve thedirectness of manipulating objects on the screen. One way of increasing thedirectness is to add a sensation of touch. This can be done by exerting forceson the user’s hand and fingers via the control device. Such a force feedbackincreases the amount of information the user gets on his movement and also canhelp to facilitate the movement. For example, Keyson (1996) found a reductionof 12-20% in movement times to a target when force feedback was added.Not only the addition, but also the augmentation of feedback can increasedirectness. For example, when approaching an object this object can visuallyexpand, so that the cursor enters the area of the object sooner (McGuffin &Balakrishnan, 2002; Mensvoort, 2002). Using augmented force fields Hasseret al. (1998) and Dennerlein and Yang (2001) found a reduction of respectively61% and 29% in movement times. An augmented force field will not onlyfacilitate movements towards a target, it can also help to prevent RSI. The finetuning of the cursor, which is most stressful to the muscles, is taken over bythe computer. To profit most from an augmented force field it is important toknow which force-field shapes and sizes are most efficient and satisfying ina target-acquisition task. In Chapter 3 it was found that the force-field shapethat was most efficient and satisfying to user’s using a force-feedback trackball,was a shape in which the force increased gradually and ended abruptly atthe border of the target. In addition an experiment, as described in Chapter4, was done to test what radius of such a force-field shape leads to the mostefficient and satisfying target-acquisition task. In this experiment the predictionalgorithm developed in Chapter 2 was included to predict the user’s targetusing the initial phase of the movement. If only one object is present a largeradius (starting after 30% of the total distance is covered) is most efficient, but asmaller field (starting after 60% to 80% of the total distance is covered) is betterappreciated. If many objects are presented close to one another a large field isleast efficient, but also a smaller field is not better than a no-force situation. Thiseffect was thought to be the result of the production of wrong predictions bythe one-step prediction procedure. Guiding a subject towards the wrong targetis irritating and correction of error takes time.In this Chapter an experiment is described in which we tried to exploit thepositive effect of a large or medium force field without having the disadvantageof an incorrect prediction. This is achieved by presenting different force-field
74
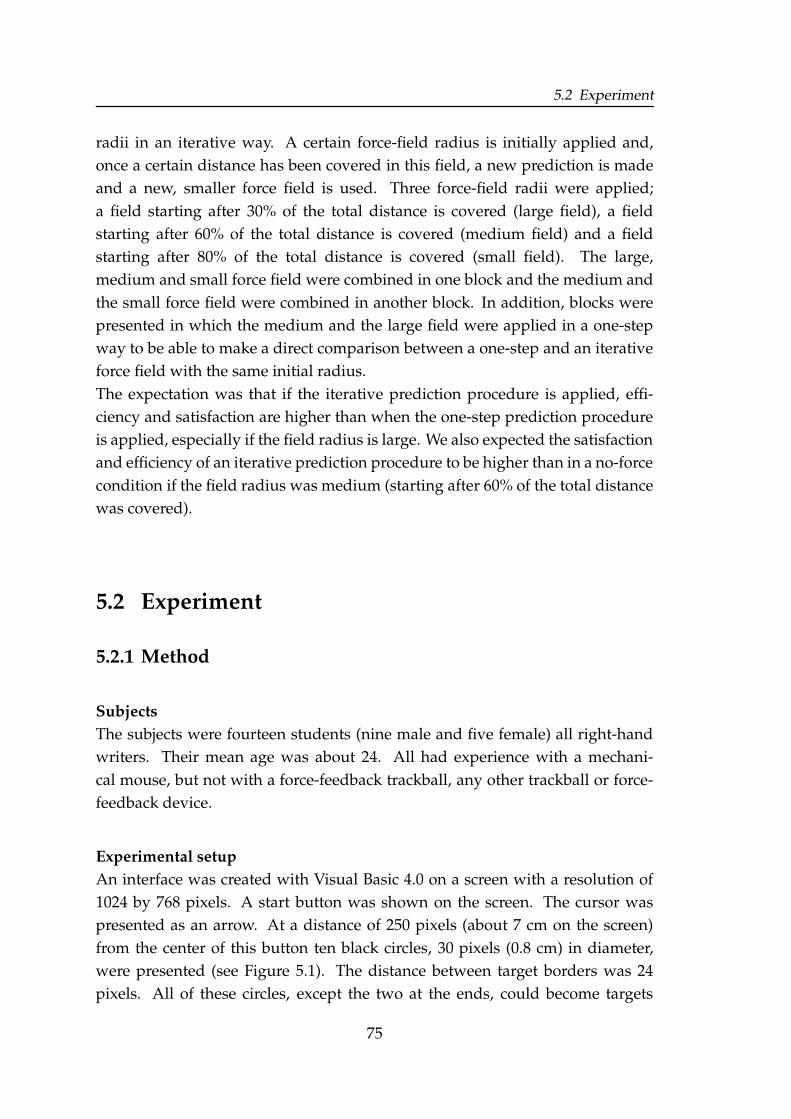
5.2 Experiment
radii in an iterative way. A certain force-field radius is initially applied and,once a certain distance has been covered in this field, a new prediction is madeand a new, smaller force field is used. Three force-field radii were applied;a field starting after 30% of the total distance is covered (large field), a fieldstarting after 60% of the total distance is covered (medium field) and a fieldstarting after 80% of the total distance is covered (small field). The large,medium and small force field were combined in one block and the medium andthe small force field were combined in another block. In addition, blocks werepresented in which the medium and the large field were applied in a one-stepway to be able to make a direct comparison between a one-step and an iterativeforce field with the same initial radius.The expectation was that if the iterative prediction procedure is applied, effi-ciency and satisfaction are higher than when the one-step prediction procedureis applied, especially if the field radius is large. We also expected the satisfactionand efficiency of an iterative prediction procedure to be higher than in a no-forcecondition if the field radius was medium (starting after 60% of the total distancewas covered).
5.2 Experiment
5.2.1 Method
SubjectsThe subjects were fourteen students (nine male and five female) all right-handwriters. Their mean age was about 24. All had experience with a mechani-cal mouse, but not with a force-feedback trackball, any other trackball or force-feedback device.
Experimental setupAn interface was created with Visual Basic 4.0 on a screen with a resolution of1024 by 768 pixels. A start button was shown on the screen. The cursor waspresented as an arrow. At a distance of 250 pixels (about 7 cm on the screen)from the center of this button ten black circles, 30 pixels (0.8 cm) in diameter,were presented (see Figure 5.1). The distance between target borders was 24pixels. All of these circles, except the two at the ends, could become targets
75

5 Augmented force feedback via an iterative prediction procedure
during the experiment, which was achieved by changing their color from blackto yellow. The outer two circles only were there to create neighbor objects forall targets. The eight target circles covered slightly more than one quadrant of acircle. To the extent that movements in each quadrant are the same, the resultsobtained can be generalized to a whole circle (see Chapter 2).During each trial, the X- and Y-coordinates of the cursor and the system timewere sampled (in pixels) with a frequency of 200 Hz.
Figure 5.1: Position of all possible targets.The square in the center is the start button. The blackcircles are the targets except for the outer two.
ProcedureSubjects were seated at a table on which a computer screen and a mechanicalforce-feedback trackball were placed. After pressing a button on the device withthe left hand while the cursor was on the start button, one of eight circles wasrandomly marked as the target by becoming yellow. At the same time the startbutton disappeared. There was a random delay of 0 to 1.5 seconds betweenthe moment the start button was clicked and the target appeared to limit theoccurrence of premature movements. Subjects were asked to move the cursorfrom the start button to the target and click. They could do this with a self-defined combination of speed and accuracy, and could start whenever they wereready for it. When the target was clicked on it became black again and the startbutton re-appeared. Then the cursor could be moved to the start button again tostart the next trial. Before the experiment started, the participants were given a
76

5.2 Experiment
training session in which all force-field radii were presented four times. A textbox appeared when the training session was finished and the actual experimentbegan.
DesignFive different block types were designed. In one block type a no-force conditionwas implemented. This block type alternated with each of the four force-fieldblocks. In these force-field blocks a prediction was made about which object wasaimed at by the subject by analyzing the initial movement path of the cursor.Then a force field was created around the predicted object, guiding the subjectto this object by applying forces to the trackball. Two force-field blocks differedin the force-field radius that was applied (175 pixels or 100 pixels). Within thesetwo blocks the force fields differed as to whether they were applied after a one-step or after an iterative prediction procedure. In a one-step procedure a forcefield was activated and only de-activated after an object was clicked on. In aniterative procedure a force field was active until the user approached an objectto a certain (closer) distance, then the field was de-activated, a new predictionwas computed and a new (smaller) force field was activated. To make the newprediction we used the cursor path from the start of the previous field up to itscurrent sampling point. In the large force field condition (the first with a radiusof 175 pixels) two new force fields were activated, the second with a radius of100 pixels and the third having a radius of 50 pixels. In the small force fieldcondition (the first with a radius of 100 pixels) one new force field was activated,a radius of 50 pixels. Each force-field block was presented two times, followingthe design shown in Table 5.1.
Table 5.1: Orders of the blocks: N=no-force block, A=largest, one-step force-field block (175pixels), Ai= largest, iterative force-field block (175,100 and 50 pixels) B=small, one-step force-field block (100 pixels), Bi=small, iterative force-field block (100 and 50 pixels) per four subjects
pp1 N A N Ai N B N Bi break N Ai N A N Bi N Bpp2 N B N Bi N A N Ai break N Bi N B N Ai N App3 N Ai N A N Bi N B break N A N Ai N B N Bipp4 N Bi N B N A N Ai break N B N Bi N A N Ai
Within each block the eight targets were presented randomly, but always threetimes, adding up to a total of 24 trials per block. In the total experiment 16 blockswere presented, resulting in a total of 384 trials. Directly after each block a textbox appeared in which the subjects had to enter a number from -3 (bad) to +3(good), representing a preference score.
77

5 Augmented force feedback via an iterative prediction procedure
Data analysisAs a measure of efficiency we used the time needed to perform the task(PT). The shorter the PT the more efficiently the target-acquisition task wasperformed. PT was defined as the time (in milliseconds) between the momentthat the target appeared and the moment it was clicked on. Data that were morethan two standard deviations different from the mean PT were assumed to beoutliers and excluded from the analysis.We measured satisfaction by asking people to give a preference score of eachforce-field condition as compared to the no-force condition. So, a score of zeromeant that the user found the force-field condition and the no-force conditionequally satisfying. If they evaluated a force-field condition as less satisfyingthey rated it negatively (minimum of -3). If they evaluated a force-field condi-tion as more satisfying they rated it positively (maximum of +3). Both PT andpreference scores were analyzed by a repeated measures ANOVA. Factors inANOVA were ’order’ (before or after the break), ’radius’ (a large or a mediumfield radius) and ’iterativeness’ (yes or no).
5.2.2 Results
Success of the predictionThe success rate of the prediction for each force field is shown in Table 5.2. It
Table 5.2: Percentage of correct predictions per force-field condition.
Force-field condition Prediction at 30% Prediction at 60% Prediction at 80%Large 56 - -Medium - 78 -Large iterative 54 80 -Medium iterative - 78 89
can be seen that an iterative prediction procedure increases the rate of success. Alarge field in the one-step condition has a success rate of 56%. A large field in theiterative condition leads to a successful prediction in 80% of the cases. Whetherthis will lead to more satisfaction or a faster target acquisition than the no-forcecondition remains to be tested.
78

5.2 Experiment
Preference scoresIn Figure 5.2 the mean preference score for each force field is shown. A re-
(a)
Preference scores before the break
Iterative
yes no
Mea
n pr
efer
ence
sco
re
1.0
.5
0.0
-.5
-1.0
-1.5
Field
large
medium
(b)
Preference scores after the break
Iterative
yes no
Mea
n pr
efer
ence
sco
re
1.0
.5
0.0
-.5
-1.0
-1.5
Field
large
medium
Figure 5.2: Mean preference scores per force-field condition. Plot (a) displays the scores beforethe break and plot (b) displays the scores after the break. In each plot scores are clustered periterativeness and each force-field radius is displayed by a different bar pattern. No bar can beseen for the medium force field applied after a non-iterative, or one-step procedure, after thebreak, because the mean score was zero. The reference line at zero, represents the default scoreof the no-force condition.
peated measures ANOVA showed significant main effects for ’order’��� �%� ��$
.0� (�������� ��� ��. ���, ’iterativeness’
���4�%� ��$2 ��7�� ���1.0���3� � �����and ’radius’
���)�%� ��$ �����7� ���� � ��7����
. In addition, an interaction effect between radius and iterative-ness was found
���)�%� ��$ �� .�(�.0��� � ��7����. This interaction effect can be seen in
Figure 5.2. In an iterative condition the preference scores of the two force-fieldradii are closer to each other than in the non-iterative, one-step condition. Wealso tested whether the fields were rated significantly different from zero, thatis, from the no-force condition. This was true for the large field applied aftera one-step prediction procedure before the break
����$
���� (��������<� � �����
andthe medium field applied after an iterative prediction procedure after the break�
���$-/7�� ��. ���� '� ��� ���
.
79

5 Augmented force feedback via an iterative prediction procedure
Time needed to perform the taskFigure 5.3 shows the time needed to perform the target-acquisition task perforce-condition. We did five repeated measures ANOVAs with force condition
(a)
PT before break
Iterative
yes no
mea
n PT
(ms)
1600
1500
1400
1300
1200
Field
large
medium large
(b)
PT after the break
Iterative
yes no
Mea
n PT
(ms)
1600
1500
1400
1300
1200
Field
large
medium large
Figure 5.3: Mean performance time (in ms) per force-field condition. Plot (a) displays the scoresbefore the break and plot (b) displays the scores after the break. In each plot scores are clusteredper iterativeness and each force-field radius is displayed by a different bar pattern. Mean scoresare displayed within the bars. The mean performance time for the no-force condition is depictedby a line.
and experience as within-subjects factors. In the first four of these we com-pared the result of each force-field condition with the no-force condition. Inthe fifth we compared the four force-field conditions. In the comparison withthe no-force condition the repeated measures ANOVAs demonstrated a signif-icant main effect for radius (the no-force condition having radius zero) for thetwo non-iterative, one-step target prediction conditions. The no-force-field con-dition resulted in faster performances than the large
��� �%� ��$� ����������7����'� � �����and the medium field
���4�%� ��$ �� (� 1.0��� � � �����applied after a one-step pre-
diction. No main effect of radius was found between the no-force conditionand the two iterative prediction conditions;
���4�%� ��$ ����������� � ��� ���, for the
80

5.2 Experiment
large field and���4�%� ��$; � 7�7�.0���� �� ���7��
, for the medium field. In all cases ofthe four repeated measures a main effect for ’order’ was found (one-step pre-diction/large field:
�4�%� ��$ ����� 7���7���� � � ���, one-step prediction/medium field:�)�%� ��$ �� �� ��7�7���� � � ���
, iterative prediction/large field:�4�%� ��$ ��� .0� ����� � � ���
and iterative prediction/medium field:�4�%� ��$ ����� . ������� � � ���
), in whichthe task was always performed faster after the break. The repeated measuresANOVA between the four force-field conditions showed main effects for ’order’���)�%� ��$ ����� ��� ����� �<� �����
and ’iterativeness’���4�%� ��$ <����� (�������� �<� �����
. No interac-tion effects were found.
5.2.3 Discussion and conclusion
Considering the one-step target prediction conditions, the results of the earlierexperiment described in Chapter 4 were reproduced. The performance timeswere shortest in the no-force condition. The large force field applied after a one-step prediction procedure was rated to be significantly less satisfying than theno-force condition, whereas the medium force field applied after the same one-step procedure was not.Another similarity is the order effect on performance time. Not only did subjectsmove faster after the break under each condition, but they also rated each forcefield more positively after the break. This shows that subjects need some time toadapt to the new device and the feeling of being guided towards an object.Introduction of an iterative procedure to predict the user’s target has a positiveeffect on both efficiency and satisfaction. This is emphasized by the interac-tion effect on preference score between radius and iterativeness. Not only areboth force-field radii rated positively if presented in combination with an iter-ative prediction procedure, their results are also closer together implying thatiterative target prediction is especially worthwhile for force fields with a largeradius. However, only the medium field in combination with an iterative pre-diction procedure is appreciated better than a no-force condition.Another positive effect of introducing an iterative prediction procedure is thatthe performance time of both field sizes can compete with the performance timeof the no-force condition.Hence an overall conclusion can be drawn that augmented force feedback can behelpful, especially in helping a user home in on the target with the cursor, as longas the target location is predicted in an iterative manner. If the augmented forcefield starts before the Distance Covering Phase is ended (when only 30% of thetotal distance is covered) the prediction is still insufficiently sophisticated or re-
81

5 Augmented force feedback via an iterative prediction procedure
liable to show an advantage over a no-force situation. The experiment describedin Chapter 4 showed that a large force field applied after a one-step predictioncan can increase the efficiency of a target-acquisition task, but that such a largefield is not appreciated. In the present experiment we showed that a large forcefield is not rated negatively if presented in combination with an iterative targetprediction procedure.The results indicate that theoretically funded research can help technological de-velopments to be applied in an effective way. It is a challenge to further improvethe iterative target prediction procedure, so that the trend continues in mak-ing force fields of large and medium sizes more efficient and satisfying. Oneproposal is to use more iterative steps, so that an erroneous prediction can becorrected sooner. Another proposal is to include a statistical weighing of thechances of an object becoming the target given the previous objects that wereselected. This prediction method was shown to be effective by Munch and Stan-genberg (1996).
82

6General discussion

6 General discussion
RecapitulationThis thesis describes an attempt to investigate how an augmented force field canenhance the efficiency and the satisfaction of a target acquisition task in HCI. Thefirst step was to develop a prediction algorithm for the user’s intended target,so that a force field could be activated only around that target object. Using theinitial phase of the user’s cursor movement as the basis for a predictor, it wasfound that only the direction and not the distance of the target could be pre-dicted reliably.After a working prediction algorithm was developed, a search was made for themost efficient and most satisfying force-field shape and size. The shape that ledto the fastest task performance, and that was the most appreciated by the sub-jects as well, was a profile in which the force started with a gradual increase andended abruptly at the target border. A force field of this shape and a size thatcovered the entire distance between starting point and target was found to bemost efficient but only, of course, if only one target was present. The most ap-preciated force field size, however, was one that began at 60% of the total targetdistance. If several potential targets were present, a field size covering 80% ofthe total path measured from the target was found the least efficient and satis-fying, but smaller fields were also less efficient and satisfying than a no-forcecondition.In the final experiment the prediction algorithm was improved by using on-lineinformation to update the prediction in an iterative way. This iterative proce-dure improved the efficiency and satisfaction scores of the force fields. Subjectsappreciated a force field starting after 60% of the distance to the target was com-pleted more than a no-force condition, without an increase in performance time.
Generalization of the prediction algorithmThe prediction algorithm generated in this study is based on movement charac-teristics of a computer user moving a cursor towards an object on the screen.Cursor movements were explored while only one object was present on thescreen during each movement. This object could be located in different an-gular directions and distances from the starting point. In the experiments, inwhich augmented force fields were investigated and the prediction algorithmwas tested, the objects were placed in such a manner that the prediction algo-rithm would perform at a correct-identification level of 69%. In a real computerinterface such objects are often located much closer together, for instance in amenu bar.
84
6 General discussion
Experimental conditions were also somewhat different from realistic conditionsin the sense that subjects were instructed to move the cursor towards one of theobjects. In reality subjects often move the cursor while deciding on a target, orsimply just to find the cursor. These types of movement are, of course, not suitedfor a prediction algorithm as was studied in this thesis.To generalize the use of augmented force feedback through target prediction,the prediction must meet certain conditions. Firstly, a discrimination proce-dure must be developed to exclude ’find-cursor’ movements from predictionattempts. Secondly, the prediction algorithm should be refined so that an aug-mented force field could also be applied when objects are closer together thanthey were in the present study. This can probably be achieved by a further in-crease of the degree of iteration. Other types of prediction procedures could alsobe included, for instance a procedure in which the likelihood of objects to be tar-geted is indicated by a changing weight factor (Munch & Stangenberg, 1996).Some objects are always selected in the same order.The prediction algorithm developed so far only seems suited for certain appli-cations or situation, such as a public information system. Such systems usuallyprovide information on only a limited subject. This implies that only a limitednumber of icons is likely to be present on the screen during a session.
Ergonomics and adaptationIt became clear during this study that applying new technologies in a merely in-tuitive way does not always lead to the most useful results. For instance, someother studies that dealt with augmented force feedback only compared a sin-gle force field function, of one shape and one size, with a no-force condition(Dennerlein & Yang, 2001; Hasser et al., 1998). The force-field shape in thesestudies had a gradual beginning and ending. In the present study, however, itwas found that subjects prefer a gradual start and an abrupt end to the force(see Chapter 3). As there are an infinite number of force-field shapes, only thoseshapes were tested that met certain criteria. The force had to increase linearlyover distance during the initial stage, stay at the maximum force level during themiddle stage, and decrease linearly again during the final stage. No limit was seton the steepness of the slope, but nonlinear relations between force magnitudeand distance were not allowed. From the results it appeared that steep-slopeabrupt ending of the force in the final stage is particularly important, becauseit provides a haptic cue about hitting the target. A shape that might be able tocompete with this ’optimal’ shape is a shape in which the force continues to in-
85

6 General discussion
crease until it drops to zero at the border of the target. Further research shouldprovide an answer to this possibility.Besides shape, the size or radius of a force field influences its efficiency and sat-isfaction effect as well. A force field starting after 60% of the total distance fromstart to target is covered was found to be the best (Chapters 4 and 5). This find-ing can theoretically be understood by the idea that at this point the ballisticDistance Covering Phase of the movement has come to an end, and the HomingIn Phase begins (Vande Ven, 2002). A reasonable interpretation of the resultsseems to be that subjects like to be guided during the HIP phase, especially be-cause this phase is the most stressful for the muscles and the most risky withrespect to RSI.Another important finding in the studies reported in Chapters 4 and 5 is thatperformance and evaluation results became more positive during the course ofthe experiments. It is clear that subjects need time to adapt to new devices andto the use of force feedback in general. After the break subjects were more satis-fied with an iterative force field than with a no-force condition. This increase insatisfaction may become larger if more adaptation time is provided.
Future researchIt would be a challenge to find ways to further improve the efficiency and the de-gree of satisfaction for augmented force feedback. Some areas in which furtherimprovements could be made have already been identified in this discussion.Firstly, the prediction algorithm or procedure should be improved to preventfalse target identification as much as possible. Secondly, more force-field shapesshould be examined. Especially a force that increases all the way to the tar-get border and abruptly ends there would be interesting. Thirdly, experimentsshould be conducted where subjects are given prolonged learning periods witha force-feedback device and a particular force function. Finally, efficiency andsatisfaction with force feedback might be improved by adding other kinds offeedback, for instance the addition of augmented visual feedback to the forcefield.
General conclusionThe research described in this thesis revealed some interesting facts on aug-mented force feedback. Especially the studies on force-field shape and sizeshowed how force feedback can help computer users to work more efficientlyand with a greater degree of satisfaction. Yet, much more research needs to be
86

6 General discussion
done before augmented force feedback becomes a realistic ergonomic navigationtool in a 2D computer environment.
87

6 General discussion
88

Bibliography
Adam, J. (1992). The effects of objectives and constraints on motor control strat-egy in reciprocal aiming movements. Journal of Motor Behavior, 24, 173-185.
Adam, J., Van Loon, E., Paas, F., Drost, M., Van Dongen, M., & Kodde, R. (1997).Impact forces of one- and two-element target-aiming responses. HumanMovement Science, 16, 369-377.
Akamatsu, M., & MacKenzie, I. (1996). Movement characteristics using a mousewith tactile and force feedback. International Journal of Human-ComputerStudies, 45, 483-493.
Akamatsu, M., & Sato, S. (1994). A multi-modal mouse with tactile and forcefeedback. International Journal of Human-Computer Studies, 40, 443-453.
Baber, C. (1997). Beyond the desktop: Designing and using interaction devices. Lon-don: Academic Press.
Bernstein, N. (1967). The co-ordination and regulation of movements. Oxford: Perg-amon Press.
Blommaert, F., Keuning, H., Fischer, A., & Vogels, I. (2003). On the optimality ofcursor displacements. In Preparation.
Boessenkool, J. (1999). Moving two hands: common versus independent control.Unpublished doctoral dissertation, University Utrecht, The Netherlands.
Card, S., English, W., & Burr, B. (1978). Evaluation of mouse, rate-controlledisometric joystick, step keys, and text keys for text selection on a CRT.Ergonomics, 21, 601-613.
Carson, R., Goodman, D., Chua, R., & Elliott, D. (1993). Asymmetries in theregulation of visually guided aiming. Journal of Motor Behavior, 25, 21-32.
89

Bibliography
Crossman, E., & Goodeve, P. (1983). Feedback control of hand-movements andFitts’ law. Quarterly Journal of Experimental Psychology, 35A, 251-278.
Dennerlein, J., & Yang, M. (2001). Haptic force-feedback devices for the officecomputer: performance and muculoskeletal loading issues. Human Factors,43, 278-286.
Douglas, S., & Mithal, A. (1997). The ergonomics of computer pointing devices.London: Springer-Verlag.
Eliott, D., Chua, R., & Helsen, W. (2001). A century later: Woodworth’s (1899)two-component model of goal-directed aiming. Psychological Bulletin, 127,342-357.
Engel, F., Haakma, R., & Van Ittegem, J. (1990). Trackball with force feedback.Philips Patent, PH-N 13522.
English, W., Englebart, D., & Berman, M. (1967). Display-selection techniquesfor text manipulation. IEEE Transactions on Human Factors in Electronics,HFE-8, 5-15.
Epps, B. (1986). Comparison of six cursor control devices based on Fitts’ law models.Santa Monica, CA: Human Factors Society.
Fitts, P. (1954). The information capacity of the human motor system in con-trolling the amplitude of movement. Journal of Experimental Psychology, 47,381-391.
Frost, G. (1972). Man-machine dynamics. In H. V. Cott & R. Kinkade (Eds.),Human enigneering guide to equipement design (p. 227-309). Washington D.C:U.S. Government Printing Office.
Glenross, D., & Barrett, N. (1989). Discrete movements. Chichester : Wiley.
Gobel, M., Luczak, H., Springer, J., Hedicke, V., & Rotting, M. (1995). Tac-tile feedback applied to computer mice. International Journal of Human-Computer Interaction, 7, 1-24.
Goossens, P. (1992). Trackball with force feedback (Tech. Rep.). IPO, Center forUser-System Interaction, Eindhoven University of Technology.
Green, D. M., & Swets, J. A. (1966). Signal detection theory and psychophysics. NewYork: Wiley.
Hasser, C., Goldenberg, A., Martin, K., & Rosenberg, L. (1998). User per-
90

Bibliography
formance in a GUI pointing task with low-cost force feedback computermouse. In Proceedings of the ASME dynamic systems and control division (p.151-156). Anaheim, CA.
Hollerbach, J. (1990). Planning of arm movements. In D. Osherson, S. Kosslyn,& J. Hollerbach (Eds.), Visual cognition and action (p. 183-211). Cambridge,MA:MIT Press.
Hutchins, E., Hollan, J., & Norman, D. (1986). Direct manipulation interfaces.In D. Norman & S. Draper (Eds.), User centered system design (p. 87-124).Hillsdale, NJ: Lawrence Erlbaum Associates.
Jagacinski, R., Repperger, D., Moran, M., Ward, S., & Glass, B. (1980). Fitts’ lawand the microstructure of rapid discrete movements. Journal of ExperimentalPsychology: Human Perception and Performance, 6, 309-320.
Keyson, D. (1996). Touch in user interface navigation. Unpublished doctoral dis-sertation, Technical University Eindhoven, The Netherlands.
Keyson, D. (1997). Dynamic cursor gain and tactual feedback in the capture ofcursor movements. Ergonomics, 40, 1287-1298.
Lederman, S., & Klatzky, R. (1987). Hand movements: A window into hapticobject recognition. Conitive Psychology, 19, 342-368.
Leenders, G. (1994). Tactile fields and target acquisition in the user interface. Unpub-lished master’s thesis, Technical University Eindhoven, The Netherlands.
Loomis, J., & Ledermann, S. (1986). Tactual perception. In K. Boff, L. Kaufman,& J. Thomas (Eds.), Handbook of perception and human performance, vol 1,sensory processes and perception. New York: John Wiley & Sons Inc.
MacKenzie, I. (1992). Fitts’ law as a research and design tool in Human-Computer Interaction. Human-Computer Interaction, 7, 91-139.
MacKenzie, I., & Buxton, W. (1991). A comparison of input devices in elementalpointing and dragging tasks. New York: ACM.
MacKenzie, I. S., Kauppinen, T., & Silfverberg, M. (2001). Accuracy measuresfor evaluating computer pointing devices. In Proceedings of the SIGCHIconference on human factors in computing systems (p. 9-16). ACM Press.
McGuffin, M., & Balakrishnan, R. (2002). Acquisition of expanding targets. InProceedings of the SIGCHI conference on human factors in computing systems(p. 57-64). ACM Press.
91

Bibliography
Mensvoort, K. (2002). What you see is what you feel: Exploiting the dominanceof the visual over the haptic domain to simulate force feedback with cursordisplacements. In Proceedings of Designing Interactive Systems 2002 (p. 345-348). ACM Press.
Meulenbroek, R., & Thomassen, A. (1992). Effects of handedness and arm po-sition on stroke-direction preference in drawing. Psychological Research, 54,194-201.
Meyer, D., Abrams, R., Kornblum, S., Wright, C., & Smith, J. (1988). Optimalityin human performance: Ideal control of rapid aimed movements. Psycho-logical Review, 95, 340-370.
Morasso, P. (1981). Spatial control of arm movements. Experimental Brain Re-search, 42, 223-227.
Munch, S., & Stangenberg, M. (1996). Intelligent control for haptic displays.Computer Graphics forum, 15, 217-226.
Newell, K., & Carlton, L. (1985). On the relation between peak force and peakforce variability in isometric tasks. Journal of Motor Behavior, 17, 230-241.
Pont, S. (1997). Haptic curvature comparison. Unpublished doctoral dissertation,University Utrecht, The Netherlands.
Preece, J. (1994). Human-computer interaction. Addison-Wesley.
Robles-De-La-Torre, G., & Hayward, V. (2001). Force can overcome object geom-etry in the perception of shape through active touch. Nature, 412, 445-448.
Rutledge, J., & Selker, T. (1990). Force-to-motion funtions for pointing. In Pro-ceedings of INTERACT’90: the IFIP Conference on Human-Computer Interac-tion (p. 701-706). Elsevier Science Publishers.
Schmidt, A., Zelaznik, H., & Hawkins, B. (1979). Motor-output variability: atheory for the accuracy of rapid motor acts. Psychological Review, 86, 415-451.
Schmidt, R. (1982). Motor control and learning. Human Kinetics Publisher, Inc.
Shneiderman, B. (1983). Direct manipulation: a step beyond programming lan-guages. IEEE Computer, 16, 57-69.
Spence, C., & Driver, J. (1997). Cross-modal links in attention between audition,
92

Bibliography
vision, and touch: Implications for interface design. International Journal ofCognitive Ergonomics, 1, 351-373.
Srinivasan, M. (1995). Haptic interfaces. In (p. 161-187). Report of the Committeeon Virtual Reality Research and Development, National Research Council,National Academy Press.
Srinivasan, M., & Basdogan, C. (1997). Haptics in virtual environments: Taxon-omy, research status, and challenges. Computer & Graphics, 21, 393-404.
Teasdale, N., & Schmidt, R. (1991). Deceleration requirements and the controlof pointing movements. Journal of Motor Behavior, 23, 131-138.
Vande Ven, J. (2002). Getting a grip on mental workload. Unpublished doctoraldissertation, Katholieke Universiteit Nijmegen.
Van Galen, G., & De Jong, W. (1995). Fitts’ law as the outcome of a dynamic noisefiltering model of motor control. Human Movement Science, 14, 539-572.
Van Galen, G., Muller, M., Meulenbroek, R., & Van Gemmert, A. (2002). ForearmEMG response activity during motor performance in individuals prone toincreased stress reactivity. American Journal of Industrial Medicine, 41, 406-419.
Van Galen, G., & Schomaker, L. (1992). Fitts’ law as a lowpass filter effect ofmuscle stiffness. Human Movement Science, 11, 11-22.
Van Galen, G., Van Doorn, R., & Schomaker, L. (1990). Effects of motor program-ming on the power spectral density function of finger and wrist move-ments. Journal of Experimental Psychology: Human Perception and Perfor-mance, 16, 755-765.
Van Galen, G., & Van Huygevoort, M. (2000). Error, stress and the role of neuro-motornoise in space oriented behaviour. Biological Psychology, 51, 151-171.
Vogels, I. (1999). A review of haptic interfaces (Tech. Rep. No. 1209). IPO, Centerfor User-System Interaction, Eindhoven University of Technology.
Vogels, I. (2001). Perception of asynchrony for visual-haptic interfaces (Tech. Rep.).IPO, Center for User-System Interaction, Eindhoven University of Tech-nology.
Walker, N., Meyer, D., & Smelcer, J. (1993). Spatial and temporal characteris-tics of rapid cursor-positioning movements with electromechanical micein human-computer interaction. Human Factors, 35, 431-458.
93

Bibliography
Waterink, W. (1997). Facial muscle activity as an index of energy mobilization duringprocessing of information: An EMG study. Unpublished doctoral dissertation,Tilburg University.
Welch, R., & Warren, D. (1986). Intersensory interaction. In K. Boff, L. Kaufman,& J. Thomas (Eds.), Handbook of perception and human performance, vol 1,sensory processes and perception. New York: John Wiley & Sons Inc.
Wickens, C., Gordon, S., & Liu, Y. (1998). An introduction to human factors engi-neering. Addison-Wesley Educational Publishers Inc.
Wolpert, D., Ghahramani, Z., & Jordan, M. (1994). Perceptual distortion con-tributes to the curvature of human reaching movements. ExperimentalBrain Research, 98, 153-156.
Woodworth, R. (1899). The accuracy of voluntary movement. PsychologicalReview, 3, whole No. 13.
94

SummarySince the introduction of the mouse and the Graphical User Interfaces (GUI),researchers have mainly focused on improving the directness of manipulatingon-screen objects. One way to improve the directness of manipulation is to addthe sense of touch. This can be realized by making the computer program ex-ert forces to the user’s hand and fingers through the control device (e.g. thetrackball), thus providing additional feedback to the user about his movementsacross the screen and also to facilitate these movements.
Besides adding force feedback, the controllability of on-screen objects can alsobe increased by enlarging the area in which feedback is given. For example,with the cursor approaching an object, the visual appearance of this object maybe amplified. In this way, the object is reached earlier. The user reaches his goalmore quickly and without extra (muscle) stress that is usually needed for theexact localization of the cursor on the object. Likewise, the amplification of theobject can be combined with the above mentioned force feedback. The thesis athand describes the development of an efficient and satisfying augmented forcefield. A force field is an area on the screen, usually centered on a certain ob-ject, within which a force is present. This thesis solely concerns forces directedtowards the object center. The user will thus be guided towards the object.
One may realize that simultaneously activating (augmented) force fields aroundevery object is ineffective. It would cause interference of force fields. Therefore,the first object in this thesis is to develop an algorithm predicting the user’s tar-get object, based on kinematic aspects of the initial part of the cursor movement.This development is described in Chapter 2. To develop this algorithm the char-acteristics of cursor movements were determined from experiments in whichsubjects had to move the cursor towards several given objects on the screen.Both curvature and variability of the spatial paths and the shape of the velocityprofile were looked at. A reliable prediction only seemed possible concerningtarget direction and not concerning target distance. We thus focused the testingof force fields on force fields around targets in different directions, but all at thesame distance from the start position.
The next aim was to generate a force field which is most efficient and satisfying,both in shape and in radius. This not only facilitates the approach of a target, butcan also help to prevent RSI. The fine tuning of the cursor, which is most stressfulto the muscles, is taken over by the computer. Chapters 3, 4 and 5 describe theresearch on finding an efficient and satisfying force-field shape and radius.
95

Summary
In Chapter 3 an experiment is described in which different force-field shapes arecompared according to efficiency and satisfaction. This is done by measuring thetime subjects need to perform a target-acquisition task and by asking subjects togive a preference score about every force-field shape. The most efficient andsatisfying force-field shape was a shape in which the force starts gradually andends abruptly at the target border. Such a force field guides the user towards histarget and prevents overshooting the target, because the force abruptly start satthe other side of the target.
In Chapter 4 different radii of the ’best’ force-field shape are tested on efficiencyand satisfaction in two experiments. In the first experiment only one object waspresented at a time. In the second experiment more objects were presented onthe screen and the activation of a force field was done on the basis of the predic-tion algorithm developed in Chapter 2. In this way the success of the algorithmcan be tested and its effect on the efficiency of and satisfaction with force-fieldradius.In the case of only one object a large force-field radius (starting after 30% of thetotal distance is covered) was most efficient, but a small radius (starting after80% of the total distance is covered) was appreciated more. In case more objectswere presented close to each other, a large radius was least efficient. However, asmall radius did not outperform a no-force situation on efficiency and satisfac-tion. This result was partly attributed to the influence of incorrect predictionson the general behavior of subjects. Subjects seemed to move more tensely andfocus more on accuracy than on speed of the movement if they might be guidedthe wrong way.
In the last experiment described in Chapter 6, the success rate of the predictionalgorithm was optimized by updating the prediction using on-line information.This iterative and interactive procedure positively influenced the efficiency ofand satisfaction with different force-field radii. Using this procedure subjectsfound a radius starting at 60% of the total distance preferable to a no-force con-dition without moving slower.
With hindsight, it can be concluded that there is still a lot to do before aug-mented force fields can be applied successfully in a 2-dimensional computer en-vironment. The prediction algorithm needs to be improved further, other kindsof force-field shapes need to be tested and it needs to be investigated what hap-pens when subjects are completely adapted to the presence of augmented forcefields.
96

SamenvattingNa de uitvinding van de muis en de Graphical User Interface (GUI) was veel on-derzoek erop gericht om de manipulatie van objecten op het scherm nog hand-iger en directer te maken. Een manier om de directheid van die controle te ver-groten is het toevoegen van een tastsensatie. Dit kan onder andere door hetcomputerprogramma krachten uit te doen oefenen op de hand en vingers viahet control device (bv de trackball) en daarmee de gebruiker meer terugkoppel-ing te geven over zijn bewegingen op het scherm en tevens die bewegingen tefaciliteren.
Naast het toevoegen van krachtsfeedback kan de controle over objecten ookworden verbeterd door het gebied waarin feedback wordt gegeven te vergroten.Bijvoorbeeld, als de cursor een object nadert kan dit object visueel vergroot wor-den. De cursor valt dan eerder in het gebied van het object. De gebruiker issneller op zijn doel zonder de extra inspanning die de uiteindelijke plaatsingvan de cursor soms kost. Dezelfde uitvergroting kan ook gedaan worden incombinatie met de zojuist besproken vorm van krachtsfeedback. In dit proef-schrift wordt de ontwikkeling beschreven van een efficient en prettig uitvergrootkrachtveld. Een krachtveld is een gebied op het scherm, normaliter een objectoverlappend, waarin een kracht de beweging van de gebruiker beinvloedt. Inons geval is de kracht altijd op het centrum van het object gericht. De gebruikerwordt dus naar het object geleid.
Men kan zich indenken, dat het niet effectief is om krachtvelden rondom elk ob-ject gelijktijdig te activeren. Dit veroorzaakt immers interferentie van krachten.Daarom was het eerste subdoel in dit proefschrift een voorspellingsalgoritme tecreeren, dat aan de hand van de kinematische kenmerken van het eerste deel vande cursorbeweging, het momentane doel van de gebruiker voorspelt. Dit wordtbeschreven in hoofdstuk 2. Om een voorspellingsalgoritme te ontwikkelen werdbij proefpersonen de beweging van de cursor bij het benaderen van verschil-lende opgegeven doelen geanalyseerd. Zowel de kromming en variabiliteit vande spatiele paden werd bekeken als de vorm van het snelheidsprofiel. Een be-trouwbare voorspelling bleek alleen te geven over de richting van het doel enniet over de afstand ervan ten opzichte van het startpunt. Bij het testen vankrachtvelden beperkten we ons dan ook tot doelen in verschillende richtingenmaar wel alle op dezelfde afstand van het startpunt.
Het tweede subdoel was om rondom het voorspelde doel een zo efficient enprettig mogelijk krachtveld genereren, zowel wat betreft vorm als radius. Dit
97

Samenvatting
maakt het niet alleen gemakkelijker het doel te bereiken, maar het kan ookRSI voorkomen. De fijne afstelling van de cursor, die de meeste spierspanningvraagt wordt immers door de computer overgenomen. Hoofdstuk drie en vieren vijf beschrijven het onderzoek dat hiervoor werd verricht.
In hoofdstuk 3 wordt een experiment beschreven waarin verschillende vormenvan krachtvelden worden getest op efficintie en plezierigheid. Dit gebeurt doorrespectievelijk de snelheid van taakuitvoering te meten en proefpersonen omeen preferentiescore te vragen. De meest efficiente en prettige vorm van eenkrachtveld bleek een vorm te zijn, waarin de kracht langzaam toeneemt enabrupt stopt aan de rand van het doel. Zo’n kracht geleidt de gebruiker naarzijn doel en voorkomt er overheen te schieten.
In hoofdstuk 4 wordt bekeken bij welke radius deze vorm van krachtveld hetmeest efficiente en prettige resultaat geeft. In een eerste experiment gebeurtdedit in een situatie met maar een doel. In het tweede experiment waren meerdereobjecten aanwezig op het scherm en werd het aanbieden van het krachtveldgedaan aan de hand van het voorspellingsalgoritme. Zodoende kon de prestatievan van het algoritme worden getest en het effect ervan op de efficientie enplezierigheid van een krachtveld worden bekeken.In het eerste experiment met maar een doel, was een groot krachtveld het meestefficient, maar werd een kleiner veld geapprecieerd. In het tweede experiment,met meerdere doelen dicht op elkaar, bleek een groot veld het minst efficient.Maar ook een klein veld won het in efficientie en plezierigheid niet van een situ-atie zonder kracht. Dit resultaat werd gedeeltelijk toegeschreven aan de invloeddie het voorkomen van foute voorspellingen heeft op het algemeen gedrag vande proefpersoon. Mensen lijken krampachtiger te gaan bewegen en zich meerte concentreren op de nauwkeurigheid van de beweging dan de snelheid als dekans bestaat dat ze verkeerd worden gestuurd door het krachveld.
In een laatste experiment, dat wordt beschreven in hoofdstuk 5, werd daarom deprestatie van het voorspellingsalgoritme geoptimaliseerd door de voorspellingvia on-line informatie steeds bij te werken. Deze iteratieve en interactieveprocedure had een positieve invloed op de efficientie en plezierigheid van dekrachtvelden. Met zo’n algoritme bleken proefpersonen bij een veldgrens opongeveer 60% van de totale afstand wel degelijk de voorkeur te geven aankrachtsfeedback boven een situatie zonder kracht en boetten daarbij niet aansnelheid ten opzichte van een situatie zonder kracht in.
Terugkijkend kan er worden geconcludeerd, dat er nog veel te verbeteren is
98

Samenvatting
voordat een vergroot krachtsveld met succes kan worden toegepast in een 2-dimensionale computer omgeving. Het voorspllingsalgoritme moet worden,verbeterd, er moeten andere vormen van krachtvelden worden getest op ef-ficientie en tevredenheid en er moet worden onderzocht wat er gebeurt alsmensen volledig aan de aanwezigheid van vergrootte krachtvelden gewend zijn.
99
DankwoordBedankt, lezer, voor het ter hand nemen en inkijken van mijn proefschrift. Voorhet tot stand komen van mijn proefschrift ben ik een aantal mensen meer dankverschuldigd (hetzij kwantitatief, hetzij kwalitatief) dan het woordje ’bedankt’op papier kan uitdrukken. Mijn dank aan die mensen wil ik daarom nadertoelichten. Ik wil mijn eerste promotor, Aad Houtsma, bedanken voor het in hetleven roepen van mijn project en de vrijheid die hij me gaf bij de invulling ervan.Mijn tweede promotor, Gerard van Galen, wil ik bedanken voor zijn hulp bij hetinkaderen van mijn onderzoek, het nadenken over experimenten en het onderwoorden brengen van mijn gedachten. Martin Boschman heeft mij fanatastis-che technische ondersteuning geboden. Niet alleen omdat die ondersteuninggedegen was, maar ook ’op tijd’. Ingrid Vogels bedank ik graag voor haar in-tensieve begeleiding gedurende haar twee jaar bij het IPO. Mark Houben wasmijn steun en toeverlaat als het om Matlab en Latex ging. Erg plezierig en nut-tig was het om Tom Monne te begeleiden bij zijn afstuderen (zie hoofdstuk 3).Anne-Sophie ben ik dankbaar voor de ontspannende lachbuien en de vriend-schap die we hebben opgebouwd als kamergenootjes. Frans Blommaert voorzijn boeiende uiteenzettingen over gedrag van mens en dier en het inzicht datmijn data daarin gaven. Verder heb ik veel gehad aan de informele gesprekkenmet overige (AIO-)collega’s waaronder Lydia, Wijnand, Arnout en Leon. Alseen nalaatste wil ik graag alle mensen bedanken die de sfeer op het IPO, en laterTM, hebben gemaakt met de vele activiteiten waarvan ik deel mocht uitmakenzoals snowboarden, skien, carten, het IPO-koor en de IPO-band. Tot slot wil ikmijn familie bedanken voor hun emotionele steun, vooral mijn lieve Arjen enmijn liefste Joukje en Meine.
100

Curriculum VitaeHilde is geboren op 7 april 1970 in Eindhoven. In 1982 behaalde zij het VWO-diploma aan het Van Maerlantlyceum te Eindhoven. In september van dat jaarbegon zij met de studie Gezondheidswetenschappen in Maastricht om uitein-delijk als Bewegingswetenschapper af te kunnen studeren. Gedurende hettweede jaar van die studie volgde zij ook een cursus ’inleiding in de informatica’aan de Open Universiteit. Een aantal inleidende colleges en taken op het gebiedvan de psychologie in de studie Bewegingswetenschappen spoorde haar aan omhet derde en vierde jaar te combineren met een deeltijd opleiding Psychologieaan de Universiteit van Tilburg. Die studie bleek dermate interessant dat zij nahet behalen van het doctoraaldiploma in Maastricht verhuisde naar Tilburg omzich te verdiepen in de Arbeidspsychologie. De achterliggende gedachte daarbijwas om ergonomische zaken op de arbeidsplek zowel met een lichaamsgerichteals psychologisch gerichte visie te kunnen benaderen. Deze achtergrond brachthaar in eerste instantie bij de ARBO-dienst van Philips als adviseur ten aanzienvan ergonomische knelpunten. Toch miste zij wetenschappelijke diepgang indit werk en koos in 1998 voor een promotieplaats aan de Technische UniversiteitEindhoven. In 2003 mondde het promotie-onderzoek uit in dit proefschrift.Naast deze intellectuele bezigheden beoefent zij ook muziek en sport. Viool-spelen, hardlopen, schaatsen, tennissen en zeilen zijn vooral belangrijk om hetbloed te laten stromen waar het gaan kan.
101