physical and chemical quality
DESCRIPTION
jurnal perubahan karakteristik fisikia dan kimia stroberi setelah diberi perlakuan coolingTRANSCRIPT

Postharvest Biology and Techndogy
ELSEVIER Postharvest Biology and ‘Kzchnology 6 (1995) 17-28
Physical and chemical quality characteristics of strawberries after storage are reduced by a short delay to cooling
M.C.N. Nunes a, J.K. Brecht bT* , A.M.M.B. Morais a, S.A. Sargent b
a Escola Superior de Biotecnologia, Universidade Catolica Portuguesa, Porto, Portugal b Horticultural Sciences Department, Universiry of Florida, 1143 Fifield Hall, PO. Box 110690,
Gainesville, FL 32608-0690, USA
Accepted 8 November 1994
Abstract
‘Chandler’, ‘0.~0 Grande’ and ‘Sweet Charlie’ strawberries were forced-air precooled after delays of 0 or 6 h at 30°C to study the effect of delaying precooling on physical and chemical quality characteristics of strawberry fruit. Fruit pulp temperatures were equilibrated to 30°C prior to the start of each experiment to minimise water loss differences between treatments. Evaluations were made after storage for one week at 1°C plus one day at 20°C. Delaying the start of precooling resulted in about 50% greater water loss than in control fruit, which was evident as increases in superficial shrivelling. Tissue firmness values were also 14-22% lower in fruit from the delayed treatment. Fruits were darker (lower L* value), less bright (lower chroma) and apparently less red (lower a* value) with the cooling delay, although hue angle was also lower, which may reflect the occurrence of browning. No significant differences in pH were observed in these experiments, but titratable acidity was slightly lower with the delay to cooling. Delaying precooling also caused increased losses of ascorbic acid, soluble solids, fructose, glucose and sucrose compared to controls. In spite of differences related to harvest time and the variability among cultivars, the general responses were quite similar and illustrate the importance of rapid precooling and subsequent storage at low temperature for maintenance of acceptable appearance, texture and nutritive value of strawberries.
Keywords: Forced air cooling; Color; Firmness; Acids; Sugars; Ascorbic acid; Fragaria x ananassa
1. Introduction
The importance of temperature management in maintaining the quality of fresh fruits and vegetables is well recognised (Kader, 1992). Because of the beneficial
* Corresponding author. Fax: 904 392-6479.
09255214/95/$09.50 Q 1995 Elsevier Science B.V. All rights reserved. SSDI 0925-5214(94)00048-4
18 iU.C.h! Nunes et al. /Postharvest Biology and Technoloa 6 (1995) 17-28
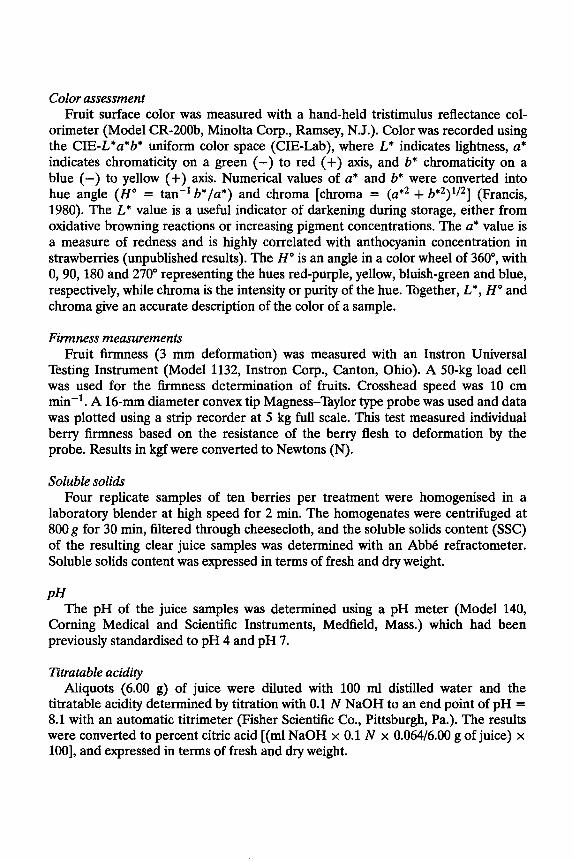
effects of low storage temperatures in extending storage life, rapid attainment of such temperatures is assumed to always have a positive effect on produce quality. However, delays before cooling inevitably occur in commercial handling during field and transport operations, and little objective information is available to determine the effects of these delays on physical and chemical quality characteristics, including the nutritional value of the crops.
Strawberry is one of the most perishable fruits, being very susceptible to mechan- ical injury, water loss, decay and physiological deterioration. The respiration rate is quite high and changes about 4-fold for each 10°C change in temperature over the range of 0-30°C (Hardenburg et al., 1986). Even under proper temperature (0-1°C) and relative humidity (RH) (95%) conditions, storage life is usually only about seven days. Prompt precooling (within l-2 h) of strawberries to near 0°C is often recommended for optimum retention of appearance and marketing quality (Arifin and Chau, 1988; Boyette et al., 1989; Talbot and Chau, 1991).
Most of the literature available on the effects of delays to cooling of fruits and vegetables report only subjective evaluations of marketability or quality (Mitchell et al., 1964; Luoto, 1984) or report measurements of only one or two objective aspects of quality such as color, weight loss or firmness (Harvey and Harris, 1986; Liu, 1986; Gamer et al., 1987; Brennan and Shewfelt, 1989; Collins and Perkins-Veazie, 1993). For example, Mitchell et al. (1964) reported that as little as 2 h delay in the field at 29°C before cooling to 4°C resulted in noticeable reduction in the percentage of marketable strawberries, but gave no information on specific quality characteristics. Collins and Perkins-Veazie (1993) warmed ‘Cardinal’ strawberries to 25°C for 8 h following precooling to l”C, and subsequently stored the fruit at 1 or 5°C. They reported that warmed fruit had greater weight loss and were subjectively rated as softer than fruit stored continuously at 1 or 5”C, but found no differences in color, soluble solids or titratable acidity.
The objective of this work was to evaluate the effects of a short (6 h) delay to cooling at 3O”C, as may be encountered in normal commercial operations, on the weight loss, firmness, color and composition of strawberries. Quality measurements were performed after storage for one week at 1°C plus a simulated retail display period of one day at 20°C in order to determine if differences would be apparent at the consumer level for strawberries handled identically except for the timing of precooling.
2. Materials and methods
Plant material ‘Chandler’, ‘Oso Grande’ and ‘Sweet Charlie’ strawberries were obtained from
a commercial operation near Floral City, Fla. ‘Chandler’ is the leading variety grown in California (Chandler, 1990) and the Mediterranean countries of Europe (Rosati, 1990), while ‘Oso Grande’ is the leading variety grown in Florida (Chandler et al., 1992). ‘Sweet Charlie’ is the most recent release from the University of Florida strawberry breeding program (Chandler et al., 1992). The strawberries were grown in double rows on raised beds covered with black plastic mulch, with drip

hf. C.N. Nunes et al /Postharvest Biology and Technology 6 (I 995) 17-28 19
irrigation and fertilisation practices according to standard recommendations for strawberry production in Florida (Maynard et al., 1988). The fungicides iprodione (Rovral) and captan were applied weekly through the season for decay control. A total of six harvests/experiments were conducted during the 1993 winter season. ‘Chandler’ strawberries were harvested on February 5 and 11, ‘Oso Grande’ on February 18 and 25, and ‘Sweet Charlie’ on March 17 and 24. In each case, the harvests were at the beginning of the harvest period for a cultivar and one week later.
7Jreatment and storage conditions Commercially harvested fruits with calyxes attached were packed in fibreboard
flats containing twelve plastic mesh pint baskets of strawberries, removed from the field with minimal delay after harvest and transported from Floral City to the laboratory in Gainesville within approximately two hours. Ten berries from each of eight flats were selected for uniformity of color development (three-quarter to full red) and freedom from defects, individually weighed, and carefully redistributed through the flats to avoid injury to the fruit. The flats were then placed on open wire racks in a controlled temperature room at 35°C and 70-80% RH, with air flow within the room of 5 m s-l. Fruit pulp temperature reached 30°C within 1 h, at which time four flats were immediately transferred to a 1°C room for forced air cooling and the other four flats maintained at 30°C for 6 h, then transferred to 1°C for cooling. This procedure was followed in order to simulate field temperature and minimise water loss differences between treatments. Forced air cooling was accomplished with a unit that circulated the room air past the strawberries at 0.156 m3 min- 1 kg fruit-’ with a pressure drop of 75 Pa across the flats. The flats were removed from the forced air unit when the fruit pulp temperature reached 4°C (within 1 h under these conditions). The strawberries were then stored at 1°C and 90-95% RH for one week. After one week, the strawberries were transferred to 20°C and 80-85% RH for one day.
Physical and chemical properties were measured using four samples of ten berries per treatment (one sample from each flat). Individual berries were first weighed, then the color and firmness measured as described below. The calyxes were then removed from the berries and the same lo-berry samples homogenised for subsequent chemical measurements.
Weight loss Weight loss was calculated from the weight of 40 individual berries per treatment
measured before and after storage. Concentrations of chemical constituents were expressed in terms of both fresh and dry weight in order to show the actual concentrations of the chemical constituents in the stored strawberries as well as the differences in amounts of those compounds between treatments that tended to be obscured by differences in water content. The dry weight was determined by drying a weighed aliquot of homogenised fruit tissue representing each lo-berry sample at 70°C for six days and reweighing.
20 M.C.N. Nunes et al. f Postharvest Biology and Technology 6 (1995) 17-28
Color assessment Fruit surface color was measured with a hand-held tristimulus reflectance col-
orimeter (Model CR-200b, Minolta Corp., Ramsey, N.J.). Color was recorded using the CIE-L*a*b* uniform color space (CIE-Lab), where L* indicates lightness, a* indicates chromaticity on a green (-) to red (+) axis, and b* chromaticity on a blue (-) to yellow (+) axis. Numerical values of a* and b* were converted into hue angle (H” = tan-’ b*/a*) and chroma [chroma = (Use + b*2)1/2] (Francis, 1980). The L* value is a useful indicator of darkening during storage, either from oxidative browning reactions or increasing pigment concentrations. The a* value is a measure of redness and is highly correlated with anthocyanin concentration in strawberries (unpublished results). The H” is an angle in a color wheel of 360”, with 0,90, 180 and 270” representing the hues red-purple, yellow, bluish-green and blue, respectively, while chroma is the intensity or purity of the hue. Together, L*, H” and chroma give an accurate description of the color of a sample.
Firmness measurements Fruit firmness (3 mm deformation) was measured with an Instron Universal
Testing Instrument (Model 1132, Instron Corp., Canton, Ohio). A 50-kg load cell was used for the firmness determination of fruits. Crosshead speed was 10 cm min-‘. A 16-mm diameter convex tip Magness-Taylor type probe was used and data was plotted using a strip recorder at 5 kg full scale. This test measured individual berry firmness based on the resistance of the berry flesh to deformation by the probe. Results in kgf were converted to Newtons (N).
Soluble solids Four replicate samples of ten berries per treatment were homogenised in a
laboratory blender at high speed for 2 min. The homogenates were centrifuged at 800 g for 30 min, filtered through cheesecloth, and the soluble solids content @SC) of the resulting clear juice samples was determined with an Abbe refractometer. Soluble solids content was expressed in terms of fresh and dry weight.
PH The pH of the juice samples was determined using a pH meter (Model 140,
Corning Medical and Scientific Instruments, Medfield, Mass.) which had been previously standardised to pH 4 and pH 7.
Titratable acidity Aliquots (6.00 g) of juice were diluted with 100 ml distilled water and the
titratable acidity determined by titration with 0.1 N NaOH to an end point of pH = 8.1 with an automatic titrimeter (Fisher Scientific Co., Pittsburgh, Pa.). The results were converted to percent citric acid [(ml NaOH x 0.1 N x 0.064/6.00 g of juice) x 1001, and expressed in terms of fresh and dry weight.

M. C.h! Nunes et aL /Postharvest Biology and Technology 6 (1995) 17-28 21
Ascorbic acid For total ascorbic acid analysis, a 5-g subsample of homogenised fruit tissue
from each of the four, lo-berry samples per treatment was combined with 100 ml of a mixture of 6% metaphosphoric acid in 2 N acetic acid. The fruit-acid mixtures were centrifuged for 20 min at 5000 g. The analysis was performed by the dinitrophenylhydrazine method of Terada et al. (1978). The concentration of total ascorbic acid was calculated per 100 g of fresh and dry weight tissue from absorbence measured at 540 nm using a standard curve.
Sugars Fructose, glucose and sucrose were determined by the analysis of their trime-
thylsilyl derivatives, prepared using Pierce STOX-oxime reagent (Pierce, Rockford, Ill.) and N-trimethylsilylimidizole. A ‘Racer Model 540 gas chromatograph (Tracer Instruments, Austin, Texas) equipped with a flame ionisation detector (FID) and connected to a 244 x 0.3-cm column packed with 3% OV 17, 80-100 mesh Chromosorb WP, with flow rate for helium (carrier gas) of 40 ml min-’ was used for separation of the silylated sugars. The temperature of the column oven was programmed for 140°C for 3 min and subsequently for 8°C min-* to 250°C and injector and detector temperatures were set at 285 and 3OO”C, respectively. Results were expressed in terms of fresh and dry weight.
Statistical analysis The Statistical Analysis System computer package (SAS Institute, Inc., 1982)
was used for analysis of the data in these experiments. Initial analysis of the data for the combined harvests by analysis of variance (ANOVA) indicated a significant harvest effect. Subsequently, data for the different harvests were analysed separately. Significant differences among cultivars were detected using Duncan’s multiple range test, and between 0- and 6-h delay treatments by F values.
3. Results and discussion
Weight loss and firmness Weight loss differed both among cultivars (Table 1) and between harvests (data
not shown) in this study. ‘Sweet Charlie’ fruits from the first harvest had the greatest weight loss; other differences among cultivars were not significant. Weight loss was greater in all cases for strawberries precooled after a 6-h delay at 30°C (Tables 1 and 2). After storage weight loss by strawberries precooled immediately after harvest ranged from 7.27 to 10.01% of the initial weight, while delaying precooling increased weight loss to from 9.84 to 14.69%. Since the cooling and storage conditions were identical for the 0- and 6-h delay treatments, the differences in weight loss noted here must be due primarily to water loss during the delay before cooling. The water loss had a negative effect on the strawberry fruit appearance, leading to shrivelling and a dull appearance of the epidermis. The maximum permissible water loss for strawberries before marketability is impaired has been reported to be approximately 6% (Robinson et al., 1975).
22 M.C.h! Nunes et aL I Postharvest Biology and Technology 6 (1995) 17-28
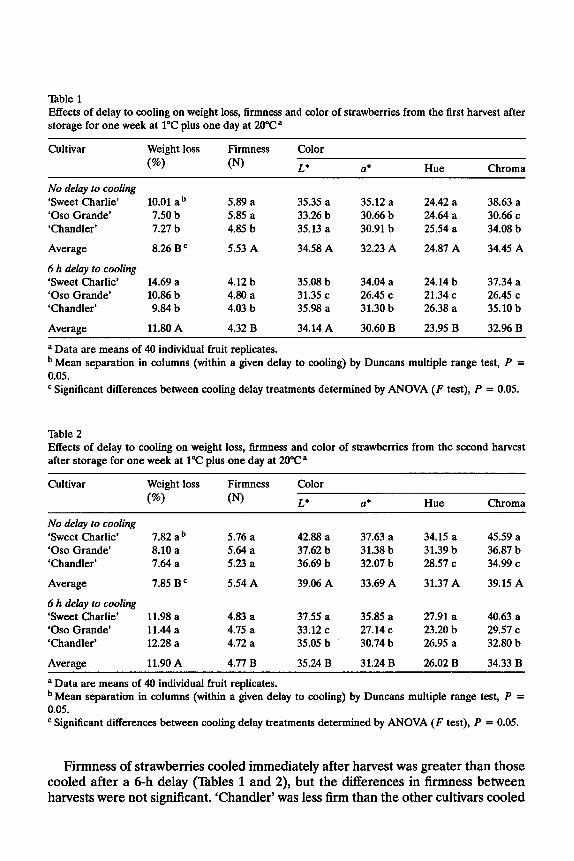
Table 1 Effects of delay to cooling on weight loss, firmness and color of strawberries from the first harvest after storage for one week at 1°C plus one day at 20°C”
Cultivar Weight loss Firmness Color
(%) (N) L’ a* Hue Chroma
No delay to cooling ‘Sweet Charlie’ 10.01 a b 5.89 a 35.35 a 35.12 a 24.42 a 38.63 a ‘Oso Grande’ 7.50 b 5.85 a 33.26 b 30.66 b 24.64 a 30.66 c ‘Chandler’ 7.27 b 4.85 b 35.13 a 30.91 b 25.54 a 34.08 b
Average 8.26 BE 5.53 A 34.58 A 32.23 A 24.87 A 34.45 A
6 h delay to cooling ‘Sweet Charlie’ 14.69 a 4.12 b 35.08 b 34.04 a 24.14 b 37.34 a ‘Oso Grande’ 10.86 b 4.80 a 31.35 c 26.45 c 21.34 c 26.45 c ‘Chandler’ 9.84 b 4.03 b 35.98 a 31.30 b 26.38 a 35.10 b
Average 11.80 A 4.32 B 34.14 A 30.60 B 23.95 B 32.96 B
a Data are means of 40 individual fruit replicates. b Mean separation in columns (within a given delay to cooling) by Duncans multiple range test, P = 0.05. c Significant differences between cooling delay treatments determined by ANOVA (F test), P = 0.05.
Table 2 Effects of delay to cooling on weight loss, firmness and color of strawberries from the second harvest after storage for one week at 1°C plus one day at 20°C a
Cultivar Weight loss
(%)
Firmness
(N)
Color
L* a* Hue Chroma
No delay to cooling ‘Sweet Charlie’ ‘Oso Grande’ ‘Chandler’
7.82 a b 8.10 a 7.64 a
Average
6 h delay to cooling ‘Sweet Charlie’ ‘Oso Grande’ ‘Chandler’
7.85 B c
11.98 a 11.44 a 12.28 a
Average 11.90 A
5.76 a 5.64 a 5.23 a
5.54 A
4.83 a 4.75 a 4.72 a
4.77 B
42.88 a 37.62 b 36.69 b
39.06 A
37.55 a 33.12 c 35.05 b
35.24 B
37.63 a 31.38 b 32.07 b
33.69 A
35.85 a 27.14 c 30.74 b
31.24 B
34.15 a 31.39 b 28.57 c
31.37 A
27.91 a 23.20 b 26.95 a
26.02 B
45.59 a 36.87 b 34.99 c
39.15 A
40.63 a 29.57 c 32.80 b
34.33 B
a Data are means of 40 individual fruit replicates. b Mean separation in columns (within a given delay to cooling) by Duncans multiple range test, P = 0.05. c Significant differences between cooling delay treatments determined by ANOVA (F test), P = 0.05.
Firmness of strawberries cooled immediately after harvest was greater than those cooled after a 6-h delay (Tables 1 and 2), but the differences in firmness between harvests were not significant. ‘Chandler’ was less firm than the other cultivars cooled

M. C. N. Nunes et al. /Postharvest Biology and Technology 6 (I 995) 17-28 23
immediately after the first harvest, but ‘Sweet Charlie’ was more affected by the delayed cooling (Table 1). When firmness was initially measured as the bioyield point, the results suggested that the berries from the delay treatment were actually firmer than berries cooled immediately after harvest (data not shown), but this result appeared to be due to toughening of the epidermis as a consequence of water loss rather than retention of flesh firmness. When the firmness data were expressed as the force required to compress a berry by 3 mm, flesh firmness was shown to actually be lower in the berries from the delay treatment.
Color Fruit color differed significantly among cultivars (Tables 1 and 2) and between
harvest times. Strawberries harvested at the beginning of the season were less red and less bright than those harvested later. This was confirmed by the lower a*, hue and chroma values for the first harvest (Tables 1 and 2). ‘Sweet Charlie’ had higher L*, a* and chroma values than ‘Chandler’ and ‘Oso Grande’ in both of the harvest times, and appeared brighter and more red than the two other cultivars. In spite of the differences between harvest times and among cultivars, significantly lower L*, a*, hue and chroma values overall were noticed with the delay to cooling (Tables 1 and 2). The berries were darker (lower L* value), less red (lower a* value) and the color less bright (lower chroma) than promptly precooled fruit. These color changes resulted in less attractive fruit and may be a consequence of the greater moisture loss and over-ripeness of the fruit from the delay treatment. The apparent contradiction of both lower u* (less redness) and hue (more red) probably reflect the occurrence of browning in the berries with delayed cooling. Changes in color were most striking in ‘Oso Grande’ compared to ‘Sweet Charlie’ or ‘Chandler’. ‘Oso Grande’ berries from the delayed cooling treatment took on a dull, dark reddish brown appearance after storage.
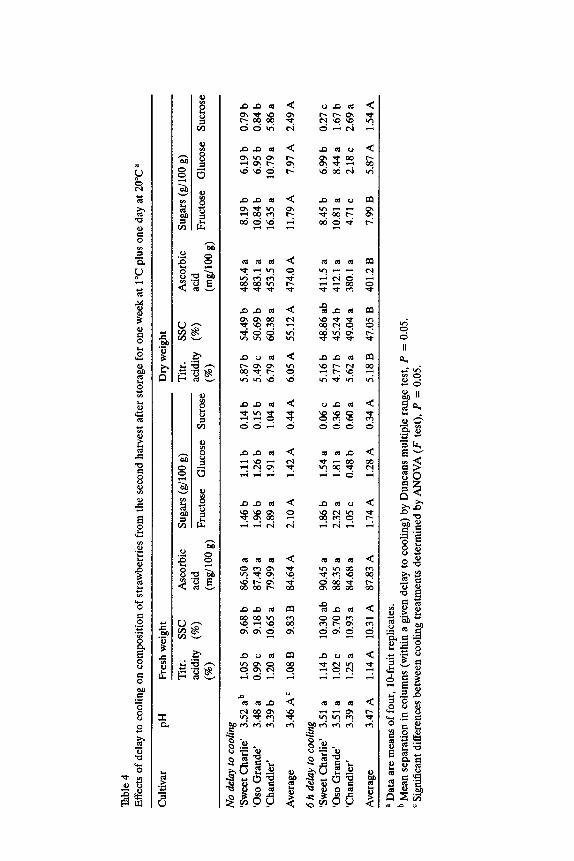
Chemical composition The dry weight of the strawberries in these experiments averaged about 10% of
the initial fresh weight and changed only slightly during storage (data not shown). This level of dry weight is in accordance with other published figures for strawberry (McCance and Widdowson, 1978; U.S. Department of Agriculture, 1991). The high levels of water loss in the strawberries from the 6-h delay to cooling treatment tended to mask real losses on a fresh weight basis of some constituents - in some cases seeming to show no difference, or even greater retention of some constituents compared to the strawberries cooled without delay (Tables 3 and 4). Although it might be argued that the compositional values expressed on a fresh weight basis represent the actual concentrations that would be experienced by consumers, we have expressed the compositional data on a dry weight basis as well in order to illustrate the actual losses that occurred in certain constituents irrespective of the concentrating effect imposed by water loss. The point may again be made that, since the cooling and storage conditions were identical for both treatments, greater losses of individual constituents must have occurred primarily during the 6 h at 30°C in that treatment.

Tab
le 3
E
ffec
ts o
f de
lay
to c
oolin
g on
com
posi
tion
of s
traw
berr
ies
from
th
e fi
rst
harv
est
afte
r st
orag
e fo
r on
e w
eek
at 1
°C p
lus
one
day
at 2
0”C
a
Cul
tivar
PH
Fr
esh
wei
ght
litr.
ss
c ac
idity
(%
)
(%)
Dry
wei
ght
Asc
orbi
c Su
gars
(g/
l00
g)
Tit
r.
ssc
Asc
orbi
c Su
gars
(g/
l00
g)
acid
ac
idity
(%
) ac
id
(mg/
lOO
g)
Fruc
tose
G
luco
se
Sucr
ose.
(%
) (m
g/lO
O g
) Fr
ucto
se
Glu
cose
Su
cros
e
No
dekz
y to
coo
ling
‘Sw
eet
Cha
rlie
’ 3.
51 a
b
1.08
a
10.4
5 b
82.0
6 b
2.05
b
1.59
b
0.21
b
5.38
b
52.2
2 b
410.
1 b
10.2
5 b
7.96
b
0.85
b
‘Gso
Gra
nde’
3.
50 a
0.
97 b
9.
35 b
42
.67
c 1.
60 c
0.
96 c
0.
52 b
5.
54 b
53
.43
b 24
3.8
c 9.
12 b
5.
45 c
2.
49 b
‘C
hand
ler’
3.
50 a
1.
12 a
13
.10
a 91
.79
a 2.
79 a
2.
30 a
1.
22 a
6.
48 a
75
.85
a 53
1.5
a 17
.18
a 13
.33
a 6.
15 a
Ave
rage
3.
50 A
= 1.
05 A
10
.97
A
72.1
7 B
2.
21 A
1.
62 A
0.
65 A
5.
80 A
60
.50
A
395.
1 A
12
.18
A
8.91
A
3.16
A
6 h
dela
y to
coo
ling
‘S
wee
t C
harl
ie’
3.47
a
1.09
ab
10.3
0 b
89.2
7 a
1.88
b
1.48
b
0.26
b
4.40
b
41.7
2 b
361.
5 b
7.59
b
5.98
b
1.31
b
‘Gso
Gra
nde’
3.
51 a
1.
00 b
9.
40 c
48
.72
b 8.
90 c
0.
41 c
0.
43 b
4.
81 b
45
.06
b 23
3.5
c 4.
31 c
1.
97 c
2.
43 b
‘C
hand
ler’
3.
47 a
1.
32 a
13
.23
a 18
0.52
a
2.49
a
2.19
a
0.70
a
6.64
a
66.6
6 a
506.
6 a
14.8
3 a
11.0
4 a
4.07
a
Ave
rage
3.
48 A
1.
14 A
10
.98
A
79.5
0 A
1.
91 B
1.
34 B
0.
46 A
5.
29 A
51
.15
B
367.
2 B
8.
91 B
6.
33 B
2.
60 A
B D
ata
are
mea
ns o
f fo
ur,
lOfr
uit
repl
icat
es.
b M
ean
sepa
ratio
n in
col
umns
(w
ithin
a
give
n de
lay
to c
oolin
g)
by D
unca
ns
mul
tiple
ra
nge
test
, P
= 0
.05.
c
Sign
itica
nt
diff
eren
ces
betw
een
cool
ing
trea
tmen
ts
dete
rmin
ed
by A
NO
VA
(F
te
st),
P
=
0.0
5.
lhbl
e 4
Eff
ects
of
dela
y to
coo
ling
on c
ompo
sitio
n of
str
awbe
rrie
s fr
om
the
seco
nd
harv
est
afte
r st
orag
e fo
r on
e w
eek
at 1
°C p
lus
one
day
at 2
0”C
a
Cul
tivar
PH
Fr
esh
wei
ght
Dry
wei
ght
Tit
r.
SSC
A
scor
bic
Suga
rs (
g/10
0 g)
T
itr.
SS
C
Asc
orbi
c su
gars
(g
/100
g)
acid
ity
(%)
acid
Fr
ucto
se
Glu
cose
Su
cros
e ac
idity
(%
) ac
id
(%)
(mg/
lOO
8)
(%)
(mg/
lOO
8)
Fruc
tose
G
luco
se
Sucr
ose
No
dela
y to
coo
ling
‘S
wee
t C
harl
ie’
3.52
a b
1.
05 b
9.
68 b
86
.50
a 1.
46 b
1.
11 b
0.
14 b
5.
87 b
54
.49
b 48
5.4
a 8.
19 b
6.
19 b
0.
79 b
‘O
so G
rand
e’
3.48
a
0.99
c
9.18
b
87.4
3 a
1.96
b
1.26
b
0.15
b
5.49
c
50.6
9 b
483.
1 a
10.8
4 b
6.95
b
0.84
b
‘Cha
ndle
r’
3.39
b
1.20
a
10.6
5 a
79.9
9 a
2.89
a
1.91
a
1.04
a
6.79
a
60.3
8 a
453.
5 a
16.3
5 a
10.7
9 a
5.86
a
Ave
rage
3.
46 A
= 1.
08 B
9.
83 B
84
.64
A
2.10
A
1.42
A
0.44
A
6.05
A
55.1
2 A
47
4.0
A
11.7
9 A
7.
97 A
2.
49 A
6 h
dela
y to
coo
ling
‘S
wee
t C
harl
ie’
3.51
a
1.14
b
10.3
0 ab
90
.45
a 1.
86 b
1.
54 a
0.
06 c
5.
16 b
48
.86
ab
411.
5 a
8.45
b
6.99
b
0.27
c
‘Oso
Gra
nde’
3.
51 a
1.
02 c
9.
70 b
88
.35
a 2.
32 a
1.
81 a
0.
36 b
4.
77 b
45
.24
b 41
2.1
a 10
.81
a 8.
44 a
1.
67 b
‘C
hand
ler’
3.
39 a
1.
25 a
10
.93
a 84
.68
a 1.
05 c
0.
48 b
0.
60 a
5.
62 a
49
.04
a 38
0.1
a 4.
71 c
2.
18 c
2.
69 a
Ave
rage
3.
47 A
1.
14 A
10
.31
A
87.8
3 A
1.
74 A
1.
28 A
0.
34 A
5.
18 B
47
.05
B
401.
2 B
7.
99 B
5.
87 A
1.
54 A
a D
ata
are
mea
ns o
f fo
ur,
lo-f
ruit
repl
icat
es.
b M
ean
sepa
ratio
n in
col
umns
(w
ithin
a g
iven
del
ay t
o co
olin
g)
by D
unca
ns
mul
tiple
ra
nge
test
, P
= 0
.05.
c
Sign
ific
ant
diff
eren
ces
betw
een
cool
ing
trea
tmen
ts
dete
rmin
ed
by A
NO
VA
(F
te
st),
P
= 0
.05.
26 M.C.h! Nunes et aL /Postharvest Biology and Technology 6 (1995) 17-28
Berry pH was little affected by the delay treatment, despite some indication that there were greater losses of titratable acidity (expressed as citric acid equivalents) in the berries with 6 h delay before cooling (Tables 3 and 4). ‘Oso Grande’ had lower acidity and ‘Chandler’ higher acidity than ‘Sweet Charlie.’ Acidity levels have been reported to decrease in overripe strawberries (Woodward, 1972). Soluble solids content was higher in ‘Chandler’ strawberries than either ‘Sweet Charlie’ or ‘Oso Grande,’ and all three cultivars had lower SSC on a dry weight basis in the delay treatment than with no delay to cooling (Tables 3 and 4). ‘Chandler’ berries also had higher sugar levels than ‘Sweet Charlie’ or ‘Oso Grande’ - of the order of twice as much fructose and sucrose as the other two, and about 1.5-2 x the glucose. Sugar levels were substantially lower in berries from the delay treatment, and these lower sugar levels were apparent in both fresh and dry weight figures (Tables 3 and 4). Reyes et al. (1982) noted lower levels of glucose, fructose and sucrose in overripe strawberries compared to ripe fruit. The observation that differences in glucose, fructose and sucrose levels between the delay treatments do not reflect differences in SSC, when these sugars would be expected to constitute a major part of the soluble solids, may be explained by the likely presence of higher levels of soluble polyuronides and hemicelluloses in the riper, softer berries from the delayed cooling treatment (Woodward, 1972; Huber, 1984).
Ascorbic acid levels varied substantially among cultivars at the first harvest, with ‘Oso Grande’ berries having only about half the amount found in ‘Chandler’ or ‘Sweet Charlie,’ but there were no differences in ascorbic acid among the three cultivars at the second harvest (Tables 3 and 4). Ascorbic acid content on a fresh weight basis appeared to be the same or greater in berries from the delayed cooling treatment compared to berries cooled immediately. However, expressed on a dry weight basis, ascorbic acid content was modestly, but significantly, higher in berries from the no delay treatment. The fact that differences in ascorbic acid levels were not greater due to 6 h exposure to high temperature after harvest may be related to the observation made by some researchers that reduction in moisture content or water activity in plant tissue appears to result in less degradation of ascorbic acid (Lee and Labuza, 1975; Fennema, 1985).
4. Conclusion
The physical and chemical quality characteristics of strawberries that were measured in this study showed substantial variability among cultivars and between harvests as a result of the simulated handling scenarios that were imposed on them. Despite these differences, when cooling was delayed for 6 h at 30°C the berries were significantly softer, more shrivelled, had less attractive color, and the acidity, SSC, sugar and ascorbic acid levels were lower than in fruit that were more quickly cooled. These differences were all apparent after seven days storage at 1°C plus one day at 2O”C, conditions simulating normal transportation and marketing times and optimum temperatures for strawberries. Thus, a rather modest and probably not unusual (in commercial handling) delay between harvest and cooling of strawberries was shown to have significant negative effects on appearance, nutritive value, and

M. C. N. Nunes et al. /Postharvest Biology and Technology 6 (1995) 17-28 27
presumably acceptability, that would be expected to persist at the consumer level. This study seems to affirm the assumption (Kader, 1990) that rapid cooling, in addition to proper storage and transport temperatures, is critical for maintaining strawberry quality.
Acknowledgement
The authors thank Dr. K.V. Chau for designing and constructing the forced air cooling unit. This research was supported by a grant from JNICT (Junta National de Investigar$o Cientifica e Tecnologica), Portugal. Florida Agricultural Experiment Station Journal Series No. R-04001.
References
Arifm, B.B. and Chau, K.V., 1988. Cooling of strawberries in cartons with new vent hole designs. Trans. ASHRAE, 94: 1415-1426.
Boyette, M.D., Wilson, L.G. and Estes, E.A., 1989. Postharvest cooling and handling of strawberries. N.C. Agric. Ext. Serv., Circ., 413-2.
Brennan, P.S. and Shewfelt, R.L., 1989. Effect of cooling delay at harvest on broccoli quality during postharvest storage. J. Food Qual., 12: 13-22.
Chandler, C.K., 1990. North American strawberry cultivars. In: A. Dale and J.J. Luby (Editors), The Strawberry into the 21st Century. Proc. Third N. Am. Strawberry Conf., Timber Press, Portland, Oreg., pp. 60-65.
Chandler, C.K., Sumler, J.C. Jr. and Albregts, E.A., 1992. Performance of ‘Oso Grande’, FL 85-4925, and FL 87-236 strawberry during the 1991-1992 season. Proc. Fla. State Hortic. Sot., 105: 348-349.
Collins, J.K. and Perkins-Veazie, P., 1993. Postharvest changes in strawberry fruits stored under simulated retail display conditions. J. Food Qual., 16: 133-143.
Fennema, O.R. (Editor), 1985. Food Chemistry. Second Edition. Marcel Dekker, New York, N.Y., pp. 488-493.
Francis, F.J., 1980. Colour quality evaluation of horticultural crops. HortScience, 15: 58-59. Garner, J.C., Prussia, SE., Jordan, J.L. and Shewfelt, R.L., 1987. Postharvest quality of peaches after
delays in cooling. ASAE Paper 87-6521, 13 pp. Hardenburg, R.E., Watada, A.E. and Wang, C.Y., 1986. The Commercial Storage of Fruits, Vegetables
and Nursery Stocks. Agriculture Handbook, 66. U.S. Department of Agriculture, Washington D.C., 130 pp.
Harvey, J.M. and Harris, C.M., 1986. In-storage softening of kiwi fruit: effects of delayed cooling. Int. J. Refrig., 9: 352-356.
Huber, D.J., 1984. Strawberry fruit softening: The potential roles of polyuronides and hemicelluloses. J. Food Sci., 49: 1310-1315
Kader, A.A., 1990. Quality and its maintenance in relation to the postharvest physiology of strawberry. In: A. Dale and J.J. Luby (Editors), The Strawberry into the 21st Century. Proc. Third N. Am. Strawberry Conf., Timber Press, Portland, Oreg., pp. 145-152.
Kader, A.A., 1992. Postharvest biology and technology: an overview. In: A.A. Kader (Editor), Posthar- vest Technology of Horticultural Crops. Univ. Calif., Div. Agric. Nat. Resour., Publ., 3311: 15 20.
Lee, S.H. and Labuza, TP., 1975. Destruction of ascorbic acid as a function of water activity. J. Food Sci., 40: 370-373.
Liu, F.W., 1986. Effects of delayed cooling and delayed low-ethylene CA storage on the keeping quality of ‘McIntosh’ apples. J. Am. Sot. Hortic. Sci., 111: 719-723.
Luoto, L., 1984. Strawberry quality: effects of handling, packaging and storage on shelf-life. Acta Hortic., 157: 79-82.

28 iU.C.A! Nunes et aL /Postharvest Biology and Technology 6 (1995) 17-28
Maynard, D.N., Hochmuth, G.J. and Sherman, M., 1988. Strawberry production guide for Florida. Fla. Coop. Ext. Serv. - IFAS, Univ. Fla., Circ., 142C.
McCance, R.A. and Widdowson, E.M., 1978. The Composition of Foods. Elsevier, London, 417 pp. Mitchell, F.G., Maxie, E.C. and Greathead, A.S., 1964. Handling strawberries for fresh market. Univ.
Calif., Div. Agric. Sci., Circ., 527. Reyes, F.G.R., Wrolstad, R.E. and Cornwell, C.E., 1982. Comparison of enxymic, gas-liquid chromato-
graphic, and high performance liquid chromatographic methods for determining sugars and organic acids in strawberries at three stages of maturity. J. Assoc. Off. Anal. Chem., 65: 126-131.
Robinson, J.E., Browne, K.M. and Burton, W.G., 1975. Storage characteristics of some vegetables and soft fruits. Ann. Appl. Biol., 81: 399-408.
Rosati, P., 1990. The strawberry in Europe. In: A. Dale and J.J. Luby (Editors), The Strawberry into the 21st Century. Proc. Third N. Am. Strawberry Conf., Timber Press, Portland, Oreg., pp. 27-35.
SAS Institute, Inc., 1982. SAS User’s Guide: Statistics. Cary, N.C., 584 pp. l’hlbot, M.T. and Chau, K.V., 1991. Precooling strawberries. Fla. Coop. Ext. Serv. - IFAS, Univ. Fla.,
Circ., 942. Terada, M., Watanabe, Y., Kunitoma, M. and Hayashi, E., 1978. Differential rapid analysis of ascorbic
acid and ascorbic acid 2-sulfate by dinitrophenylhydraxine method. Anal. Biochem., 84: 604-608. U.S. Department of Agriculture, 1991. Nutritive value of foods. Service/Home and Garden Bull., 72:
26 PP. Woodward, J.R., 1972. Physical and chemical changes in developing strawberry fruits. J. Sci. Food
Agric., 23: 465-473.