water quality indicators: biological, chemical & physical ... · biological, chemical &...
TRANSCRIPT

Water Quality Indicators: Biological, Chemical & Physical
ParametersAdapted from Healthy Water, Healthy People Educators Guide – www.projectwet.org
Students investigate water quality by conducting simulated and actual biological(macroinvertebrate bioassessment), chemical (pH) and physical (turbidity) assessments.
ContentsSummary and Objectives.....................................................................................Page 1Background........................................................................................................Page 2The pH of common items......................................................................................Page 4Warm Up............................................................................................................Page 5The Activity: Part I...............................................................................................Page 6The Activity: Part II..............................................................................................Page 7The Activity: Part III......................................................................................................Page 8Wrap Up........................................................................................................................Page 9Assessment ................................................................................................................Page 9Extensions...............................................................................................................Page 9Macroinvertebrate Identification Chart - Student Copy Page...........................................Page 11Macroinvertebrate Data Sheet I - Student Copy Page.....................................................Page 12Macroinvertebrate Data Sheet II - Student Copy Page...................................................Page 13Chemical Indicators Data Sheet - Student Copy Page...................................................Page 14Turbidity Test Student Copy Page - Student Copy Page................................................Page 15

© Project WET Foundation, 2011
Adapted from Healthy Water, Healthy People Educators Guide
www.projectwet.org
Water Quality Indicators: Biological, Chemical & Physical Parameters
ObjectivesStudents will:• investigate the role that aquatic macroinvertebrates play in determining water quality through simulating the process of rapid bioassessment.• compare the differences between the relative water quality of different samples.• create acid and base solutions by adding common household items to cabbage water.• interpret the color change of a pH indicator solution to determine whether the solution is an acid or a base.• compare the turbidity of muddy and clear water.
MaterialsWarm up• 10 sheets of paper
Part I: Biological• Copies of Macroinvertebrate Identification Chart Student Copy Page (1 per group)
Grade Level: 6-8, ages 11-14
Subject Areas: Biology, Chemistry, Earth Science, Environmental Science, Mathematics, Language Arts
Duration: Preparation: Part I: 30 minutes; Part II: 30 minutes; Part III: 30 minutesActivity: Part I: two 50-minute periods; Part II: 40 minutes; Part III: 50 minutes
Setting: Classroom, outdoor area or large gymnasium
Skills: Interpret, Organize, Gather, Communicate, Rank, Measure, Compare and Contrast, Investigate, Problem Solve
SummaryStudents investigate water quality by conducting simu-lated and actual biological (macroinvertebrate bioas-sessment), chemical (pH) and physical (turbidity) as-sessments.
Vocabulary: acid, base, benthic, best management practice, bioassessment, biodiversity, concentration, erosion, hydrogen ion (H+), hydroxide ion (OH-), logarithm, macroinvertebrate, nonpoint source pollution, remediate, runoff, sediment, turbidity
1

© Project WET Foundation, 2011
2
Water Quality Indicators
• Copies of Macroinvertebrate Data Sheet I Student Copy Page (1 per group)• Copies of Macroinvertebrate Data Sheet II Student Copy Page (1 per group) Materials for Bioassessment (similar objects may be substituted)• Plastic tubs or storage bins (represents stream) (3)• Smaller plastic tubs (collection buckets) (3)• Aquarium nets (can use hands or other scoop) (3)• Sorting devices (icecube trays, petri dishes, cups) (3)• Calculators (3)• Small paper clips (100)• Large paper clips (50)• Six different sizes, shapes, or colors of beads (50 of each size/color/shape)• Thin rubber bands (50)• Thick rubber bands (50)• coins (50)
• Optional: Water (enough to fill the 3 sample tubs with at least 4 inches of water). (Optional: coloring for the water so students cannot see the objects in the sample tub. Coloring options include dark food coloring; powdered chocolate milk mix to simulate sediment, tea bags to darken the water, powdered fruit drink mix, other.)
Part II: Chemical• Purple cabbage (medium-sized head) and access to a
stove or hot plate• Small beakers, clear jars, or glasses (4 per group)• Distilled water (2 liters per class)• Eye droppers (1 per group)• Plastic spoons (1 per group)• Copies of Chemical Indicators Data Sheet - Student Copy Page (1 per group)• Carbonated beverage–cola, soft drinks (15 drops [1 ml] per group; do not open until time of experiment)• Markers or tape to label sample containers• Lemon juice (15 drops [1 ml] per group)• Ammonia (15 drops [1 ml] per group)• Baking soda (½ teaspoon [1.3g] per group)
Part III: Physical• Clear plastic (or glass) quart jar filled with assorted
rocks, gravel, soil, sand and water• Copies of Turbidity Test Student Copy Page (1 per group)• Turbidity test materials• Flat-bottomed test tubes (preferred) or clear juice glasses (1 per group)• Fine-grained soil (e.g., silt) or milk (to make turbid water)• Sample of clear water (e.g., tap water–at least 1 liter)• Sample of local surface water for comparison (at least 1 liter)
Extension• World Water Monitoring Day Testing Kit
Background The water quality of a stream can be determined in several ways. Water quality can be compared relatively between several water sources, or can be measured absolutely. Biological, chemical and physical factors can all indicate the quality of the water.
Biological IndicatorsOne important way to determine the status of water’s living systems is through biological assessment (bioassessment), which is the use of biological surveys and other direct measurements of living systems within a watershed. Aquatic macroinvertebrates (animals without backbones that live in aquatic environments and are large enough to be seen without the aid of a microscope or other magnification) are commonly monitored and are the basis of Part I of this activity.
Macroinvertebrates are valuable indicators of the health of aquatic environments in part because they are benthic, meaning they are typically found on the bottom of a stream or lake and do not move over large distances. Therefore, they cannot easily or quickly migrate away from pollution or environmental stress. Because different species of macroinvertebrates react differently to environmental stressors like pollution, sediment loading and habitat changes, quantifying the diversity and density of different macroinvertebrates at a given site can create a picture of the environmental conditions of that body of water.

© Project WET Foundation, 2011
3
If exposed to an environmental stressor (e.g., pollution, warming due to low flows, low dissolved oxygen due to algal blooms, etc.), those macroinvertebrates that are intolerant to that stress may perish. Tolerant macroinvertebrates often inhabit the spaces left by the intolerant organisms, creating an entirely different population of organisms. For example, an unimpacted body of water will typically contain a majority of macroinvertebrates that are intolerant of environmental stressors, such as Mayflies (Ephemeroptera), Stoneflies (Plecoptera) and Caddisflies (Trichoptera). A body of water that has undergone environmental stress may contain a majority of macroinvertebrates that are tolerant of these conditions such as leeches (Hirudinea), Tubifex worms (Tubifex sp.), and Pouch Snails (Gastropoda).
Bioassessments of macroinvertebrates are particularly helpful to biologists and others trying to determine the health of a river or stream. Bioassessment of macroinvertebrates is a procedure that uses inexpensive equipment, is scientifically valid if done correctly, and can be conducted by students. Bioassessments can provide benchmarks to which other waters may be compared and can also be used to define rehabilitation goals and to monitor trends. Trend monitoring is a common application of bioassessment by student groups and others involved in water quality monitoring.
Chemical IndicatorsWhile bioassessments are extremely important in and of themselves, they are most useful when combined with chemical and habitat assessments.
Because humans and aquatic organisms are dependent on water with pH levels within a range near neutral, pH is a crucial water quality indicator and is the focus of Part II of this activity. The pH test, one of the most common and easily performed water quality tests, measures the concentration of hydrogen ions, which then allows us to infer the strength of the acid or base.
A water molecule (H2O) can be thought of as one hydrogen ion (H+) and one hydroxide ion (OH-). An acid is defined as any substance that, when dissolved in water, increases the concentration of the hydrogen ion (H+) (Ebbing, 1990).
Therefore, an acid is a solution that has more hydrogen ions than it has hydroxide ions. A base is defined as any substance that, when dissolved in water, increases the concentration of the hydroxide ion (OH-) (Ebbing, 1990). Hence, a base is a solution that has more hydroxide ions than it has hydrogen ions. A neutral solution has an equal number of hydrogen and hydroxide ions.
Mathematically speaking, pH is the negative of the logarithm of the hydrogen ion concentration (Ebbing, 1990). Hydrogen ion concentrations are very small numbers, so scientists developed the pH scale to make reporting and interpreting these numbers easier. Because the pH scale is logarithmic, for every one unit of change on the pH scale, there is a ten-fold change in the acid or base content of a solution (Mitchell, 1997). The pH scale ranges from 0 to 14, with a pH of 7 as neutral. An acid solution has a pH of less than 7, while a base solution has a pH of greater than 7. For example, acid rain with a pH of about 5 is ten times more acidic than natural rain with a pH of about 6. Likewise, a solution with a pH of 10 is one hundred times more basic than a solution with a pH of 8.
pH is usually measured by using either an electrode, which gives a digital reading, or an acid-base indicator dye, which changes color as the pH increases or decreases. The final color is then compared to a small chart or table to determine the pH.
Generally, natural waters have a pH of between 5 and 9 and most aquatic organisms survive in waters within this range. With the exception of some bacteria and microbes, if pH goes higher or lower than this range, aquatic life is likely to perish.
Other water quality problems can stem from high or low pH levels. Water with low pH increases the solubility of nutrients like phosphates and nitrates. This makes these nutrients more readily available to aquatic plants and algae, which can promote harmful overgrowth called “algal blooms.” As these blooms die, bacteria numbers increase in response to the greater food supply. They, in turn, consume more dissolved oxygen from the water, often stressing or killing fish and aquatic macroinvertebrates.
Water Quality Indicators

© Project WET Foundation, 2011
4
Water with low pH can also corrode pipes in drinking water distribution systems and release lead, cadmium, copper, zinc and solder into drinking water. Water treatment plants vigilantly monitor the pH of the water that they treat to safeguard against such corrosion. Also water with a pH below 5 is too acidic and above 9 is too basic for human consumption.
Physical IndicatorsErosion increases the amount of sediment (soil particles) in water. This increased sediment influences turbidity, which is “an optical property of water based on the amount of light reflected by suspended particles” (USEPA, 1999). Thus, very turbid water appears murky or cloudy. All natural waters are somewhat turbid, even if only at microscopic levels.
Measuring turbidity, which will give an idea of the volume of suspended and colloidal matter present in a body of water at a particular time, can be one indicator in assessing water quality and is the focus of Part III of this activity. Suspended and colloidal matter (microscopic particles that remain suspended in water and diffract light) can be anything that is suspended in the water column ranging from sand, silt, clay, plankton, industrial wastes, sewage, lead, and
asbestos to bacteria and viruses. Some suspended matter occurs naturally and some is produced by human activities.
Aquatic organisms are particularly susceptible to the effects of increased sediments and turbidity. Many fish need clear water to spot their prey. Macroinvertebrates, fish eggs, and larvae require oxygen-rich water circulating through clean gravel beds to survive. Sediments can smother fish eggs and aquatic insects on the bottom and can even suffocate clams and oysters as they filter water through their bodies. Sediment and other dissolved substances also decrease light penetration, which inhibits aquatic plant photosynthesis.
Because cloudy water absorbs more of the sun’s energy than clear water, high turbidity also leads to higher water temperatures. This can severely affect aquatic organisms, many of which have adapted to survive within narrow temperature ranges.
Sediment and turbidity also affect people. According to the USEPA, sediment is one of the first things filtered out of source water at a drinking water treatment plant and is one of the few water quality contaminants that must be monitored daily. Suspended solids can harbor harmful bacteria and can also decrease the effectiveness of chlorination used to help remove those harmful bacteria. Increased turbidity and sediments have economic impacts as well. The production of everyday products, like paper, food, and computer chips, requires water that is free of sediment and other suspended solids.
The most common natural source of suspended matter is sediment that is washed by erosion and runoff into a body of water. Sediment carried over land during runoff is the most common form of nonpoint source pollution in the United States. Human-caused erosion stems mainly from activities like road building, construction, agriculture, logging, and other endeavors that remove or disturb vegetation. Natural erosion and the resulting turbidity is a common occurrence in some watersheds.
If erosion and runoff are the largest contributors to sediments in our waterways, then slowing runoff and
Water Quality Indicators
Substance pH or pH range
Hydrochloric acidStomach acidLemon juiceVinegarColaGrapefruitAcid rainNatural rainMilkPure deionized waterSea waterBaking sodaMilk of magnesiaHousehold ammoniaSodium hydroxide
0.01.0-3.02.2-2.42.4-3.42.63.0-3.24.0-5.55.6-6.26.3-6.77.07.0-8.38.410.511.913.0-14.0
Bas
icN
eutr
alA
cidi
c
The pH of Common Items
© Project WET Foundation, 2011
5
mitigating erosion is crucial to improving water quality. Sometimes human-caused erosion can be managed to reduce the turbidity of waterways. The simplest way is to maintain or plant vegetation along the edge of waterways to serve as a buffer strip, capturing the sediments before they enter the water.
Plants slow the velocity of water as it runs off over the surface of the land. When runoff is slowed, erosion is decreased. Plants prevent soil from being washed away by holding it together. They also reduce the velocity at which raindrops hit the soil. When unobstructed raindrops strike the ground, it promotes rapid runoff by forcing finer soil particles to the surface. These particles eventually create a barrier, which prevents water from soaking easily into the ground (Farthing et al., 1992).
Plants help store water by adding organic matter to the soil, which eventually decomposes into highly absorbent humus. Fallen leaves and stems can slow water down, giving it more time to soak into the ground. Roots also help plants store water by conducting it away from the surface and into the ground.
ProcedureWarm UpDue to the complexity of pH and the frequent misconceptions about how to explain the pH scale, this Warm Up is focused on the chemical parameter of pH.
1. Review the pH scale, which ranges from 0 to 14. A pH of 7 is neutral. Most natural waters typically have a pH range between 5 and 9. Any solution greater than pH 7 is basic, and any solution less than pH 7 is acidic.
2. Explain to students that a water molecule (H2O) can be thought of as one hydrogen ion (H+) and one hydroxide ion (OH-). The pH is determined by the concentration of hydrogen ions (H+) in a solution. An acid is defined as any substance that, when dissolved in water, increases the concentration of the hydrogen ions (H+) (Ebbing, 1990). Therefore, an acid is a solution that has more hydrogen ions than it has hydroxide ions. A base is defined as any
substance that, when dissolved in water, increases the concentration of the hydroxide ions (OH-) (Ebbing, 1990). Hence, a base is a solution that has more hydroxide ions than it has hydrogen ions. A neutral solution has an equal number of hydrogen and hydroxide ions.
3. Ask the students to help demonstrate the concept of pH in the following activity.
4. Write a large H+ on 10 sheets of paper of one color, and a large OH- on ten sheets of paper of another color.
5. Ask 10 students to come to the front of the room. Give one student a sheet of paper with an H+ on it, and the other a sheet with an OH-.
6. Ask the other students to identify these ions—hydrogen (H+), and hydroxide (OH-). Ask if the solution created by these two students (H+ and OH-) is an acid, base, or neutral. (This is a neutral molecule since H+ has a charge of +1 and OH- has a charge of –1).
7. Ask two more students to join the other two students at the front of the room. Give one a sheet with H+ and one a sheet with OH-. Now ask one of the OH- students to step aside for a moment. Is the solution still neutral? (Since it has a lone OH-it has a net charge of +1, which makes it an acid.)
8. What will make the solution neutral? (The OH- student needs to return.)
9. Next, ask one of the H+ students to step aside. Now is the solution neutral? (Since there is a single H+, the net charge is –1, so it is basic.)
10. What will make the OH- solution neutral? (Bring the H+ student back.)
11. Continue to experiment with this model, adding and subtracting more hydrogen and hydroxide ions, until you feel your students are comfortable identifying acid and base solutions.
Water Quality Indicators
© Project WET Foundation, 2011
6
12. Ask students what would be affected if streams or lakes had a pH of less than 5 (e.g., fish and aquatic organisms would struggle to survive; land animals could not drink the water; etc.). Explain that, in the following activity, students will manipulate several solutions to determine whether they are acids or bases.
Upper Level or Mathematics Extension to Warm UpTo demonstrate the mathematical concepts of the logarithmic relationships of the pH scale, conduct a final step (most suitable for upper- level or mathematics students). Start with two students in front of the room—one holding an H+ card and one holding an OH- card. Ask the class to identify whether this solution is an acid, base, or neutral (the answer is neutral). Ask ten students to join them in the front of the room, all holding H+ cards. Again ask the class whether the solution represented is an acid, base, or neutral (it is an acid). Then ask them what number on the pH scale is represented by this solution. If they need a hint, let them know that the original two students represented a neutral solution, or 7 on the pH scale. A change in one unit up or down the scale requires the solution to be 10 times more acidic or basic than the solution preceding it. The students are representing a solution that is 10 times more acidic than neutral (10 more H+ ions), so the resulting unit on the
Water Quality Indicators
pH scale is 6 (one unit more acidic than neutral 7). For bonus points, ask students how many H+ students are required to change the solution to a pH of 5 (10 x 10 or 100). For a pH of 4, 10 x 100 or 1000 H+ ions are required, and so on.
The ActivityPart I : Biological
1. Inform students that they will be simulating a bioassessment of a stream using ordinary objects to represent macroinvertebrates.
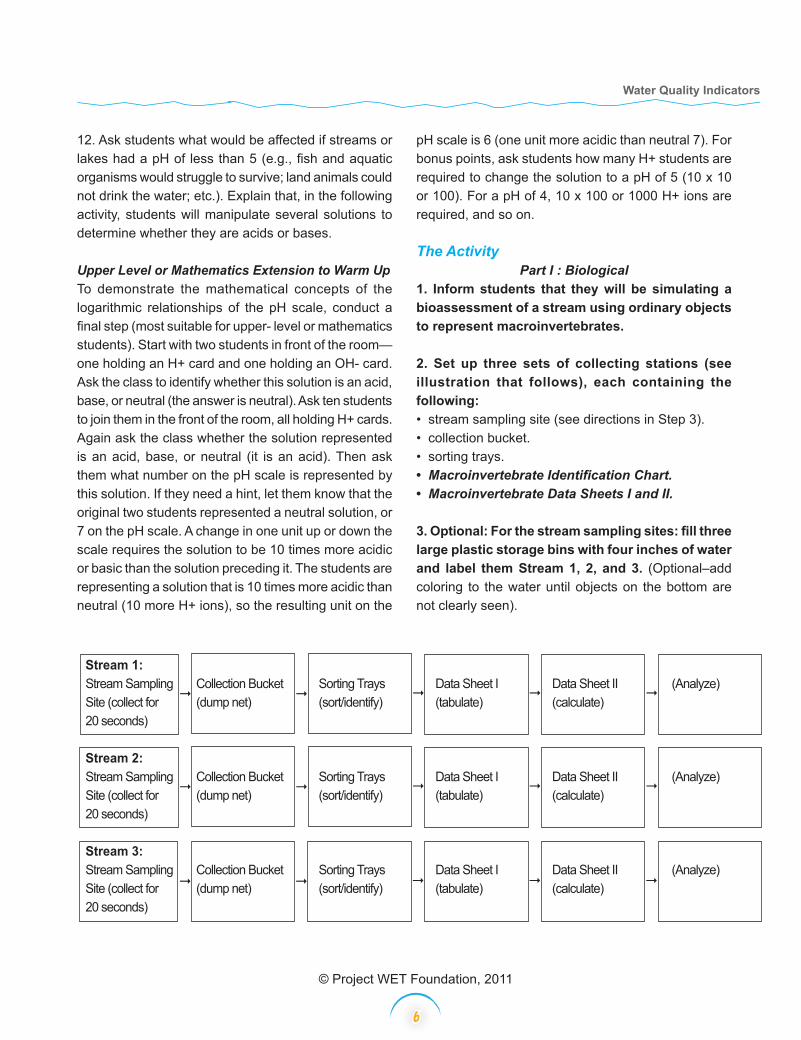
2. Set up three sets of collecting stations (see illustration that follows), each containing the following: • stream sampling site (see directions in Step 3).• collection bucket. • sorting trays. • Macroinvertebrate Identification Chart.• Macroinvertebrate Data Sheets I and II.
3. Optional: For the stream sampling sites: fill three large plastic storage bins with four inches of water and label them Stream 1, 2, and 3. (Optional–add coloring to the water until objects on the bottom are not clearly seen).
Stream 1: Stream Sampling Collection Bucket Sorting Trays Data Sheet I Data Sheet II (Analyze) Site (collect for (dump net) (sort/identify) (tabulate) (calculate) 20 seconds) Stream 2: Stream Sampling Collection Bucket Sorting Trays Data Sheet I Data Sheet II (Analyze) Site (collect for (dump net) (sort/identify) (tabulate) (calculate) 20 seconds)
Stream 3: Stream Sampling Collection Bucket Sorting Trays Data Sheet I Data Sheet II (Analyze) Site (collect for (dump net) (sort/identify) (tabulate) (calculate) 20 seconds)

© Project WET Foundation, 2011
7
4. Place objects representing macroinvertebrates in the three tubs according to the following chart:
Water Quality Indicators
5. Divide students into three groups. Assign students within each group to one of the following five tasks: stream sampling, sorting at the collection bucket, counting/recording on Macroinvertebrate Data Sheet I, and calculating/evaluating on Macroinvertebrate Data Sheet II.
6. Instruct students to simulate a rapid bioassessment at their stream sampling site as follows:
a. Using an aquarium net, the students at the site have 20 seconds to collect as many macroinvertebrates (paper clips, beads, etc.) from the stream containers as possible. They should place the macroinvertebrates in the collection bucket.b. Students at the collection bucket then sort the collected macroinvertebrates into like categories based on the Macroinvertebrate Identification Sheet and place them in the icecube tray or cups. For example, they should place all of the Mayflies into one cube, Caddisflies into another, etc.
c. The students using the Macroinvertebrate Data Sheet I tabulate the sorting results onto the data sheet and calculate the percent composition of each macroinvertebrate in the stream site.d. The students with Macroinvertebrate Data Sheet II use the data from Data Sheet I to complete the Pollution Tolerance Index to determine their Water Quality Assessment score for their stream sample.
7. Have students compare their results with the other groups. What were the similarities and differences between the three sites? Which stream had the highest level of water quality? The lowest?
Part II: ChemicalYou will be using cabbage water because it changes color as the pH changes, making it an acid-base indicator. Neutral cabbage water is purple, while acidic cabbage water is reddish and basic cabbage water is blue/green. Note: It is important to use freshly made cabbage water
Macroinvertebrate Represented by: Number of Items per Sample Total Items Stream Sample 1 Stream Sample 2 Stream Sample 3 Mayflies Yellow beads 35 15 0 50 beads Stoneflies Small paper clips 65 35 0 100 clips Caddisflies Blue beads 30 20 0 50 beads Dobsonflies Large paper clips 30 20 0 50 clips Midges Red beads 0 20 30 50 beads Craneflies White beads 25 13 12 50 beads Dragonflies Green beads 20 20 10 50 beads Scuds Black beads 5 15 30 50 beads Pouch Snails Coins 0 15 35 50 coins Tubifex Worms Thin rubber bands 0 15 35 50 bands Leeches Thick rubber bands 0 15 35 50 bands

© Project WET Foundation, 2011
8
as it quickly becomes unstable as an indicator. If possible, make the cabbage water on the same day you will use it, and refrigerate it until use. Also, it may be helpful to make a reference set of standards with color changes representing various pH ranges (e.g., 2, 4, 6, 8, 10, 12). The students can then compare their color changes with these standards to determine approximately where on the pH scale their solutions reside. Another option is to measure and record the pH readings for the solutions so students can use them for later comparison.
1. First prepare a cabbage water solution by boiling one medium-sized head of purple cabbage in 2 liters (more for larger classes or multiple classes) of distilled water until the water turns a deep purple color—approximately 20-30 minutes. Filter or strain the cabbage and refrigerate the purple liquid.
2. Divide the class into groups of three or four students. Give each group four clear containers (each containing 25 milliliters of cabbage water), eyedroppers, spoons, and one Chemical Indicators Data Sheet.
3. Ask the groups to add 15 drops (1 ml) cola to one of the cabbage water jars, and stir. Record the color change and conclusions on the Chemical Indicators Data Sheet. Label this sample #1.
4. Take another 25 ml sample of cabbage water; add 15 drops (1 ml) of lemon juice and stir. Record the color change and conclusions on the Chemical Indicators Data Sheet. Label this sample #2.
5. Follow the same procedure, using 15 drops (1 ml) of ammonia, and a ½ teaspoon (1.3 g) of baking soda, putting each in 25 ml samples of cabbage water. Stir and record changes on the Chemical Indicators Data Sheet. Label these samples #3 and #4.
6. Have each group arrange their samples in order from most acidic to most basic (lightest red to darkest blue/green).
Water Quality Indicators
7. Instruct students to complete Part II and Part III on the Chemical Indicators Data Sheet.
8. Have each group present and discuss their results with the class before moving on to Part III and the Wrap Up.
Part III: Physical1. Fill a clear quart jar 1/3 full with assorted rocks, pebbles, mud, sand and soil. Add water until the jar is full. Shake the container to stir up the rocks, water and soil until the water becomes muddy.
2. Show students the sample of muddy water and ask if they can see through it. Would they drink the muddy water? Why not? How does cloudy water affect aquatic organisms?
3. As the mud, or sediment, in the jar settles, the heaviest rocks will be on the bottom, the smaller rocks above them, and the finer soil particles, or sediment, on top of the rocks covering them like a blanket.
4. Have students brainstorm possible impacts of this sediment covering the rocks (e.g., can smother fisheggs, suffocate aquatic insects and plants, abrade fish gills and mollusks). Many fish have adapted to live in highly turbid waters, such as paddlefish and catfish. What adaptations do these fish have that allow them to thrive in turbid water? Since the clarity of the water does affect living organisms, scientists have developed a turbidity test to measure water clarity.
5. Explain to students that they will conduct a relative turbidity test using common materials.
6. Premix a turbid solution (muddy water) using fine-grained soil (i.e. silt) so that soil stays suspended (milk, a substitute, creates a turbid solution of a different color for comparison). Conduct the turbidity test on the Turbidity Test Student Copy Page ahead of time to ensure that your solution is neither too muddy nor too clear—it should test out at grayscale circles D or E with

© Project WET Foundation, 2011
9
about one inch of solution in the tube or glass. If mud or heavy soil is used, pour the sample through a coffee filter to strain out the larger particles that could settle out and cover the bottom of the test tube, giving an inaccurate reading. If possible, distribute the solution to the students via an eyedropper, as this will ensure that suspended and not heavier particles are being used.
7. Have students work in groups and distribute a test tube or juice glass and a Turbidity Test Student Copy Page to each group.
8. Have students follow the testing procedures on the Turbidity Test Student Copy Page recording the corresponding letter of their relative turbidity reading and its interpretation. Have students continually swirl their samples to ensure the sediment remains suspended and not settled on the bottom.
9. Repeat the turbidity test with clear water.
10. Repeat the turbidity test with the sample of local surface water. Ask students to compare their results. What can account for the differences in turbidity between the solutions?
Wrap UpAsk students why one solution is more acidic than another? (Refer back to the Warm Up exercise.)
What would happen to an acid solution if a base, such as ammonia, were added? (With the addition of OH, the solution will approach neutral, and eventually surpass it and become a basic solution. You may wish to demonstrate this with the class.) Likewise, a single OH- makes a solution basic. What would happen if an acid (vinegar), were added to a base solution? The solution will approach, and eventually surpass, neutral (pH = 7). Students may wish to experiment with their acid and base solutions by adding a neutralizing solution to their samples to reach a neutral pH in each sample.
Have student groups list ways that pH, bioassessment and turbidity are important in their lives (e.g., digestion
Water Quality Indicators
of food in our stomachs; drinking water; acid rain; etc.). Have each group present their list and form a master list for each type of indicator on the board.
AssessmentHave students:Part I: Biological• simulate the process of rapid bioassessment of aquatic macroinvertebrates (Steps 5 and 6).• collect, sort, classify, identify, analyze, and evaluate a sample of materials representing aquatic macroinvertebrates (Step 6).• determine a stream’s water quality using a Pollution Tolerance Index based on a sample of aquatic macroinvertebrates (Step 6).• compare the differences between the relative water quality of different samples (Step 7).Part II: Chemical• create acid and base solutions by adding common household items to cabbage water (The Activity).• relate the color change of a pH indicator solution to determine whether the solution is an acid or a base (The Activity).
Part III: Physical• explore the relationship of soil erosion to the turbidity of waterways (Steps 1-6).• compare water samples with high and low turbidity (Steps 7-10).• quantify the turbidity of water samples using a turbidity test (Steps 7-10).
ExtensionsMake your own litmus paper by dipping paper towels or coffee filters into cabbage water. Allow the paper to dry, then cut into strips. Use your homemade litmus paper as an acid/base indicator by dipping it into several household products.
Using litmus paper, test the pH of various household products. Make a chart of your results by lining up the litmus paper by color or acid/base concentration.Invite a scientist from your local wastewater treatment plant to discuss how and what he or she measures when testing wastewater.

© Project WET Foundation, 2011
10
Use a World Water Monitoring Day Testing Kit to test the biological, chemical and physical parameters of a local lake, river, or stream in your area. Upload your results to www.worldwatermonitoringday.org.
ResourcesBarzilay, J.I., J.W. Eley, and W.G.Weinberg. 1999. The Water We Drink. New Brunswick, NJ: Rutgers University Press.
Ebbing, D. 1990. General Chemistry, Third Edition. Boston, MA: Houghton Mifflin Co.
Farthing, P., B. Hastie, S. Weston, and D. Wolf. 1992. The Stream Scene. Portland, OR: Aquatic EducationProgram.
Fore, L. 1998. Field Guide to Freshwater Invertebrates. http://www.seanet.com/~leska/Online/about_guide.html.
Freedman, B. 1989. Environmental Ecology. San Diego, CA: Academic Press, Inc.
Freshwater Benthic Ecology and Aquatic Entomology Homepage. 1999. http://www.chebucto.ns.ca/Science/SWCS/ZOOBENTH/BENTHOS/benthos.html.
Hill, M. Date Unknown. Determining Acids and Bases.http://www.col-ed.org/cur/sci/sci119.txt. Important Water Quality Factors. 2001. Retrieved on September 4, 2001, from the Hach Company Website: http://www.hach.com/h20u/h2wtrqual.html.
Karr, J., and E. Chu. 1998. Restoring Life in Running Waters: Better Biological Monitoring. Washington, D.C.: Island Press.
Mitchell, M., and W. Stapp. 1997. Field Manual for Water Quality Monitoring: An Environmental Education Program for Schools. Dubuque, IA: Kendall/Hunt Publishing Co.
Murdock, T., & M. Cheo. 1996. Streamkeepers Field Guide. Everett, WA: The Adopt-A-Stream Foundation.
Water Quality Indicators
Save Our Streams (SOS) Stream Study. 1999. http://www.people.virginia.edu/~sos-iwla/Stream-Study/StreamStudyHomePage/Stream-Study.html.
Tillery, B. 1996. Physical Science, Third Edition. Dubuque, IA: Wm. C. Brown Publishers.
Torgerson, J. Date Unkown. OFCN’s Academy Curricular Exchange- Science. http://ofcn.org/cyber.serv/academy/ace/sci/cecsci/cecsci181.html.
United States Environmental Protection Agency (EPA). 1999. Guidance Manual for Compliance with the Interim Enhanced Surface Water Treatment Rule: Turbidity Provisions. Retrieved on December 3, 2001, from the Website: http://www.epa.gov/safewater/mdbp/mdbptg.html.
United States Environmental Protection Agency (EPA). 1991. Rapid Bioassessment Protocols (RBPs) for use in Streams and Wadeable Rivers. http://www.epa/gov/owow/monitoring/rbp/
Water Quality Index: Turbidity. 1999. Retrieved on October 8, 2001, from the Kansas Collaborative Research Network (KanCRN) Web site: http://www.kancrn.org/stream/.
© Project WET Foundation, 2011
11
Water Quality Indicators - Student Copy PagePart I: Biological
With special thanks to Joann Y. Wheeler, Maryland Department of Natural Resources.
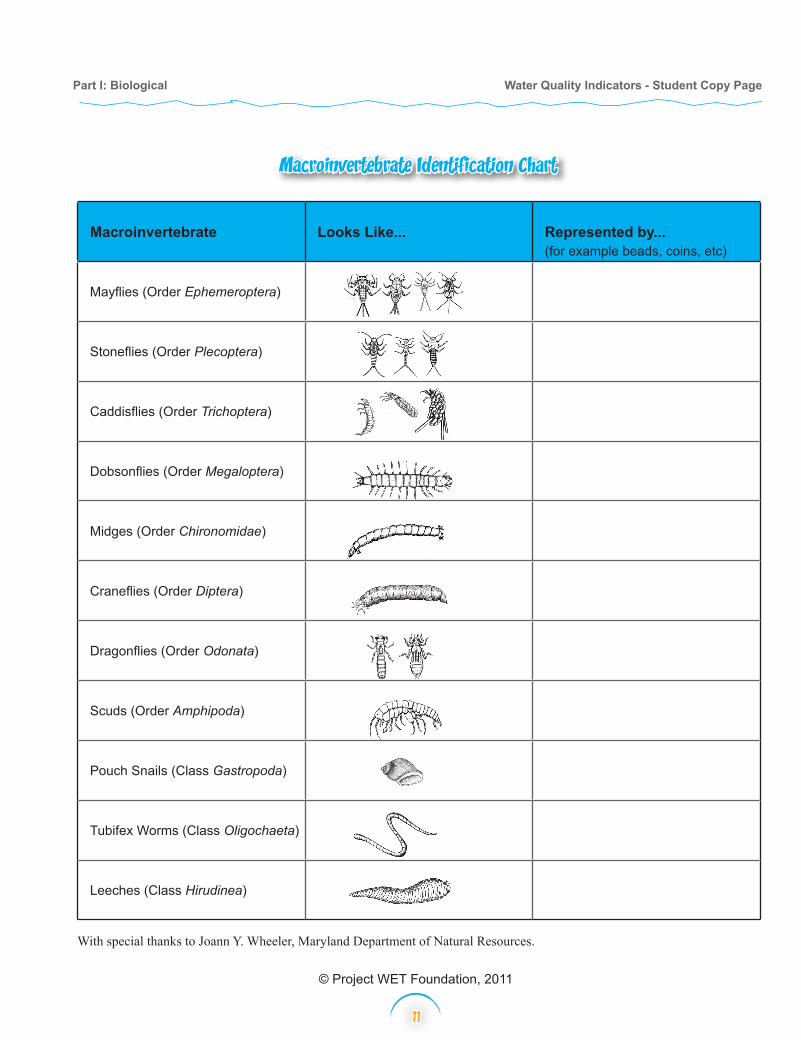
Macroinvertebrate Identification Chart
Macroinvertebrate Looks Like... Represented by...(for example beads, coins, etc)
Mayflies (Order Ephemeroptera)
Stoneflies (Order Plecoptera)
Caddisflies (Order Trichoptera)
Dobsonflies (Order Megaloptera)
Midges (Order Chironomidae)
Craneflies (Order Diptera)
Dragonflies (Order Odonata)
Scuds (Order Amphipoda)
Pouch Snails (Class Gastropoda)
Tubifex Worms (Class Oligochaeta)
Leeches (Class Hirudinea)

© Project WET Foundation, 2011
12
Water Quality Indicators - Student Copy PagePart I: Biological
Macroinvertebrate Data Sheet I
Stream #:Recorded by:Date of Sampling:
Percent Composition of Major Groups:
After the macroinvertebrates are sorted, tabulate the number of organisms for each of the major groups listed below and calculate their percent composition. This measure yields the relative abundance of macroinvertebrates within your sample.
Percent Composition = Number of Organisms in Each Group Total Number of Organisms
Macroinvertebrates Number of Organisms in Each Group Percent Composition
Mayflies (Order Ephemeroptera)
Stoneflies (Order Plecoptera)
Caddisflies (Order Trichoptera)
Dobsonflies (Order Megaloptera)
Midges (Order Chironomidae)
Craneflies (Order Diptera)
Dragonflies (Order Odonata)
Scuds (Order Amphipoda)
Pouch Snails (Class Gastropoda)
Tubifex Worms (Class Oligochaeta)
Leeches (Class Hirudinea)
Total Number of Organisms
(Adapted from Mitchell, 1997)

© Project WET Foundation, 2011
13
Water Quality Indicators - Student Copy PagePart I: Biological
Macroinvertebrate Data Sheet II
Pollution Tolerance Index
1. Place a check next to each macroinvertebrate group present in your sample. For example, whether you found one mayfly or 50 mayflies, place one check next to the mayfly line in Group 1. 2. Complete the chart for all of the macroinvertebrate groups. 3. Calculate the group scores using the multipliers provided. 4. Total all of the group scores for your Total Score. 5. Compare your Total Score with the Water Quality Assessment Chart scores and record the relative water quality rating for your stream sample.
Stream #:Recorded by:Date of Sampling:
Group 1 Macroinverte-brates: Very Intolerant
Group 2 Macroinverte-brates: Intolerant
Group 3 Macroinverte-brates: Tolerant
Group 4 Macroinverte-brates: Very Tolerant
___Stoneflies___Mayflies___Caddisflies___Dobsonflies
___Dragonflies___Scuds___Craneflies
___Midges___Leeches
___Pouch Snails___Tubifex Worms
# of checks = ___ x4Group Score = ___
# of checks = ___ x3Group Score = ___
# of checks = ___ x2Group Score = ___
# of checks = ___ x1Group Score = ___
Total Score = ______
Your Water Quality Assessment:
Water Quality Assessment Chart:
≥23 Potentially Excellent Water Quality17-22 Potentially Good Water Quality11-16 Potentially Fair Water Quality≤10 Potentially Poor Water Quality
(Adapted from Mitchell, 1997)

© Project WET Foundation, 2011
14
Water Quality Indicators - Student Copy PagePart II: Chemical
Chemical Indicators Data Sheet
I. After adding a common household item to the cabbage water, stir briefly and record your findings in the following table.
Common Household Item Color of Solution
Cabbage water, nothing added
Sample #1 15 drops (1ml) of cola added
Sample #2 15 drops (1ml) of lemon juice added
Sample #3 ½ teaspoon (1.3 g) of baking soda added
Sample #4 15 drops (1 ml) of ammonia added
II. Look at the color change of the samples and determine whether the color change indicates the solution is an acid, a base, or neutral. Discuss with your group where on the scale you think each sample belongs. For example, the pH of purple cabbage water with nothing added is 7. Write “purple cabbage water” under the neu-tral (7) on the scale. Write the sample number on the scale where you think each sample belongs according to their pH.
Acid Neutral Base
III. After completing the experiment, answer the following questions.
1. What makes the cabbage water change color upon adding lemon juice?
2. What makes the cabbage water change color upon adding ammonia?
3. What do you think would happen if you combined the lemon juice solution with the ammonia solution?
0 1 2 3 4 5 6 7 8 9 10 11 12 13 14

© Project WET Foundation, 2011
15
Water Quality Indicators - Student Copy PagePart III: Physical
1. Fill the test tube or glass with the sample. Continually shake or swirl the container to ensure the sediment stays suspended.
2. Place the test tube/glass over each circle, starting with (A). Look down through the test tube/glass. If you can distinguish between the dark and light sections, move to the next circle (B).
3. The first circle where you can-not distinguish between the dark and light sections is your turbidity reading.
4. If you can distinguish between the dark and light sections in all of the circles, then you have mostly clear water with little turbidity.
A–Stressful for some fish due to lack of food productionB–Aquatic insect production slowsC–Algae and zooplankton production dropsD–Less light reaches plants, photosynthesis slowsE–Little effect on aquatic plants and animals
Turbidity Test
Data Sheet for Turbidity Test
Water Sample 1: Letter:
Interpretation:
Water Sample 2: Letter:
Interpretation:
Water Sample 3: Letter:
Interpretation:
A B C
D E