photoplethysmography for determining major airway...
TRANSCRIPT

PHOTOPLETHYSMOGRAPHY FOR DETERMINING MAJOR AIRWAY
RESISTANCE CHANGES AND FOR DETECTING FLUID LOSS IN BLOOD DONORS AND RENAL HEMODIALYSIS PATIENTS
By
BRIAN SCOTT FUEHRLEIN
A DISSERTATION PRESENTED TO THE GRADUATE SCHOOL OF THE UNIVERSITY OF FLORIDA IN PARTIAL FULFILLMENT
OF THE REQUIREMENTS FOR THE DEGREE OF DOCTOR OF PHILOSOPHY
UNIVERSITY OF FLORIDA
2006

Copyright 2006
by
Brian Scott Fuehrlein

To my wife, Dianna: I attribute my achievements to your love, support, and caring. This would not have been possible without you.

ACKNOWLEDGMENTS
First I would like to thank my parents for affording me every opportunity to
achieve. I did not always make the right decisions in life, but through it all they believed
that I would succeed even when I did not believe it myself. I thank the rest of my family
for their support and caring. I wish that my grandfathers were alive to witness my
achievements. I see more and more of both of them in me every day. I also thank my
dog, T-Bone for making me look forward to coming home from work every day.
Where’s the light?
I thank Richard Melker for becoming my mentor many years before I began
pursuing my PhD. He is the reason I became a Doctor and that is something I will carry
with me the rest of my life. I thank my supervisory committee (Hans van Oostrom, Neil
Euliano, Charles Wood, and Chris Batich) for their guidance and support. I thank the
departments of Biomedical Engineering and Anesthesiology. I thank the staff of the renal
hemodialysis clinic (especially Ed Ross and Tracy Hollen). I thank the staff of the
LifeSouth Community Blood Center. I thank George Worley of Beta Biomed Services
for giving me valuable real-world experience and practical advice. I thank Convergent
Engineering for providing software and technical expertise, and Novametrix for
providing equipment. I thank Mark Gold for providing so many opportunities to enhance
my training. I thank Lou Ritz for every now and then allowing me to win in racquetball.
I thank Steve Bonett for sharing an office with me for many years and listening to my
rants. I hope I can do 20 stadiums when I am 48 years old. I thank all of my friends of
iv

the medical school class of 2005 for constantly reminding me that I have yet to complete
the third year of medical school. I thank Matthew Warren for completing everything
before me and then instructing me on how to do it. Finally, I thank the members of the
2006 National Championship Florida Gator Men’s Basketball team for all of the
excitement. It was something I will never forget.
v

TABLE OF CONTENTS page
ACKNOWLEDGMENTS ................................................................................................. iv
LIST OF TABLES............................................................................................................. ix
LIST OF FIGURES .......................................................................................................... xii
ABSTRACT..................................................................................................................... xix
CHAPTER
1 BACKGROUND ..........................................................................................................1
Pulse Oximetry .............................................................................................................1 Theory of Pulse Oximetry .....................................................................................1 History of Pulse Oximetry.....................................................................................4 Reasons for Errors in Pulse Oximetry ...................................................................7
Photoplethysmography .................................................................................................8 Fundamentals of Photoplethysmography ..............................................................8 Photoplethysmograph Processing..........................................................................9 Uses of the Photoplethysmograph .......................................................................10
Arterial mechanics........................................................................................10 Respiratory rate ............................................................................................11 Pulsus paradoxus ..........................................................................................14 Blood volume ...............................................................................................14
Patent Review......................................................................................................16
2 INTRODUCTION ......................................................................................................20
Novel Pulse Oximeter Prototypes...............................................................................20 Literature Review ................................................................................................20 Novel Probe Designs ...........................................................................................21
Pulse Oximeter Data Acquisition Viewer...................................................................22 Pilot Operating Room Study.......................................................................................23
Secondary Findings .............................................................................................24 Arrhythmias..................................................................................................25 Ventilator effect............................................................................................26 Cardiac bypass..............................................................................................27 Blood pressure cuff ......................................................................................27
vi

Limitations ...................................................................................................27 Updated Signal Separation Algorithm........................................................................28 Secondary Findings from the Operating Room Study Revisited................................29 Nasal Alar Probe.........................................................................................................30 Additional Studies ......................................................................................................31
3 BROAD CLINICAL GOALS ....................................................................................45
Clinical Goal 1............................................................................................................45 Clinical Populations.............................................................................................45
Asthma .........................................................................................................45 Obstructive sleep apnea syndromes .............................................................48
Changes Caused By Respiration .........................................................................51 Pilot Data .............................................................................................................51
Exploratory pilot study.................................................................................51 Ventilator and volunteer resistance study ....................................................52 Mathematically characterizing the resistance...............................................54
Clinical Goal 2............................................................................................................55 Rationale..............................................................................................................56 Blood Donors.......................................................................................................57 Renal Hemodialysis.............................................................................................58
4 EXPERIMENTAL DESIGN AND METHODS........................................................64
Methods ......................................................................................................................64 Blood Donors.......................................................................................................65 Hemodialysis Patients .........................................................................................67
Photoplethysmograph Processing and Novel Variables .............................................68 Signal Processing Algorithm...............................................................................68 Separating Breath Data........................................................................................70
Hypotheses..................................................................................................................72 Hypotheses – Clinical Goal 1 ..............................................................................72 Hypotheses – Clinical Goal 2 ..............................................................................72
Justification.................................................................................................................73 Justification for Hypotheses 1 and 2 ...................................................................73 Justification Hypotheses 3, 4, and 5 ....................................................................74
5 STATISTICAL ANALYSIS AND RESULTS ..........................................................81
Data Filtering ..............................................................................................................81 Multiple Breaths ..................................................................................................81 Cardiac Arrhythmias ...........................................................................................82 Artifact.................................................................................................................83 Unattainable Photoplethysmograph.....................................................................83
Demographics .............................................................................................................84 Statistical Analysis......................................................................................................84
Hypothesis 1 ........................................................................................................84
vii

Hypothesis 2 ........................................................................................................87 Hypothesis 3 ........................................................................................................89 Hypothesis 4 ........................................................................................................90 Hypothesis 5 ........................................................................................................91
Discussion of Statistical Results.................................................................................92 Hypotheses 1 and 2..............................................................................................93 Hypothesis 3 ........................................................................................................95 Hypotheses 4 and 5..............................................................................................99 Regression Analysis ..........................................................................................100
6 CLINICAL SIGNIFICANCE AND INDIVIDUAL SUBJECT ANALYSIS..........139
Statistical and Clinical Significance .........................................................................139 Individual Analysis...................................................................................................140
Hypothesis 1 ......................................................................................................140 Hypothesis 2 ......................................................................................................143 Hypothesis 3 ......................................................................................................144 Hypotheses 4 and 5............................................................................................148
7 CONCLUSIONS ......................................................................................................162
Summary of Conclusions..........................................................................................162 Clinical Relevance and Future Studies .....................................................................163
Clinical Goal 1...................................................................................................163 Clinical Goal 2...................................................................................................168
LIST OF REFERENCES.................................................................................................172
BIOGRAPHICAL SKETCH ...........................................................................................182
viii

LIST OF TABLES
Table page 3-1. Estimated pressure drop across the ET tubes based on Poiseuille’s Law. ...............61
3-2. Calculated, simulated, and measured intrathoracic pressure changes ......................62
5-1. Demographic information for the blood donors. ....................................................101
5-2. Demographic information for the HD patients.......................................................102
5-3. Test for normality in the LFC Swings of the blood donors....................................102
5-4. Test for normality in the LFC Swings of the HD patients......................................103
5-5. Friedman’s test results for the LFC Swings of the blood donors. ..........................103
5-6. Friedman’s test results for the LFC Swings of the HD patients.............................104
5-7. Wilcoxon Signed-Rank results across the three resistance levels for the LFC Swings for the blood donors...................................................................................104
5-8. Wilcoxon Signed-Rank results across the three resistance levels for the LFC Swings for the HD patients. ...................................................................................104
5-9. R2 values of LFC Swings compared to estimated intrathoracic pressure for blood donors. ....................................................................................................................104
5-10. R2 values of LFC Swings compared to estimated intrathoracic pressure for HD patients. ..................................................................................................................105
5-11. Wilcoxon Signed-Rank results for the LFC Swings of the blood donors before and after blood loss. ...............................................................................................105
5-12. Wilcoxon Signed-Rank results for the LFC Swings of the HD patients before and after HD. ..........................................................................................................105
5-13. Test for normality for the PCC MagDiff of the blood donors................................105
5-14. Test for normality for the PCC MagDiff of the HD patients..................................105
ix
5-15. Wilcoxon Signed-Rank results for the PCC MagDiff of the blood donors and HD patients.............................................................................................................106
5-16. Test for normality for the PCC MagMean of the blood donors. ............................106
5-17. Test for normality for the PCC MagMean of the HD patients. ..............................106
5-18. Wilcoxon Signed-Rank results for the PCC MagMean of the blood donors and HD patients.............................................................................................................106
5-19. Friedman’s test results for the respiratory flow rates of the blood donors. ............107
5-20. Wilcoxon Signed-Rank results for the respiratory flow rates of the blood donors.107
5-21. Friedman’s test results for the respiratory volume of the blood donors. ................107
5-22. Wilcoxon Signed-Rank results for the respiratory volume of the blood donors. ...108
5-23. Friedman’s test results for the respiratory flow rates of the HD patients...............108
5-24. Wilcoxon Signed-Rank results for the respiratory flow rates of the HD patients. .108
5-25. Friedman’s test results for the respiratory volume of the HD patients...................109
5-26. Wilcoxon Signed-Rank results for respiratory volume of the HD patients............109
5-27. Wilcoxon Signed-Rank results for the respiratory flow rates and volumes of the blood donors before and after blood loss. ..............................................................109
5-28. Wilcoxon Signed-Rank results for the respiratory flow rates and volumes of the HD patients before and after HD............................................................................109
5-29. Wilcoxon Signed-Rank results of the pulse rate and blood pressure of the blood donors before and after blood loss. ........................................................................110
5-30. Wilcoxon Signed-Rank results of the pulse rate and blood pressure of the HD patients before and after HD. .................................................................................110
5-31. Wilcoxon Signed-Rank results for the LFC Swings of the blood donors comparing breaths 1 and 2 to subsequent breaths in the alar. ................................110
5-32. Wilcoxon Signed-Rank results for the LFC Swings of the blood donors comparing breaths 1 and 2 to subsequent breaths in the finger..............................110
5-33. Wilcoxon Signed-Rank results for the LFC Swings of the HD patients comparing breaths 1 and 2 to subsequent breaths in the alar. ................................110
5-34. Wilcoxon Signed-Rank results for the LFC Swings of the HD patients comparing breaths 1 and 2 to subsequent breaths in the finger..............................111
x

5-35. Wilcoxon Signed-Rank results for the LFC Swings of the blood donors comparing breaths 1 and 2 before and after blood loss..........................................111
5-36. Wilcoxon Signed-Rank results for the LFC Swings of the HD patients comparing breaths 1 and 2 before and after HD. ...................................................111
6-1. The R2 values for the regression analysis between estimated intrathoracic pressure changes and alar LFC Swings for the blood donors. ...............................153
6-2. The R2 values for the regression analysis between estimated intrathoracic pressure changes and alar LFC Swings for the HD patients. .................................153
6-3. Multiple variable regression analysis for the alar LFC Swings during high resistance for the HD patients. ...............................................................................153
6-4. Multiple variable linear regression analysis for the alar PCC MagDiff for the blood donors. ..........................................................................................................154
6-5. Multiple variable linear regression analysis for the alar PCC MagMean for the blood donors. ..........................................................................................................154
xi

LIST OF FIGURES
Figure page 1-1. A Graphic representation of the LFC and PCC from a typical finger probe............18
1-2. A typical display of a processed pulse oximeter waveform. ....................................19
2-1. Novel pulse oximeter probes manufactured by Beta Biomed Services (Rowlett, TX).. .........................................................................................................35
2-2. Variance of SpO2 from SaO2 as hypoxic conditions increased, as measured by the cheek probe.........................................................................................................35
2-3. Variance of SpO2 from SaO2 as hypoxic conditions increased, as measured by the nasal septum probe. ............................................................................................36
2-4. The Pulse Oximetry Data Acquisition Viewer software. .........................................36
2-5. A 30 min pulse rate tracing of an operating room pilot study subject, showing arrhythmias...............................................................................................................37
2-6. A 30 sec PCC tracing of the PPG of an operating room pilot study subject, showing arrhythmias. ...............................................................................................37
2-7. A 30 sec PCC tracing of the PPG of an operating room pilot study subject, showing the effect of the ventilator..........................................................................37
2-8. A 30 min oxygen saturation trend of an operating room pilot study subject, showing how the cheek probe resumed functionality 5 min sooner than the finger probe following cardiac bypass. ....................................................................38
2-9. A 30 sec PCC tracing of the PPG of an operating room pilot study subject, showing the effect of a blood pressure cuff. ............................................................38
2-10. The unprocessed PPG data of an operating room subject with the peaks and troughs identified discretely. ....................................................................................38
2-11. The PCC of the PPG from the cheek of an operating room pilot study subject, showing periodic reduction in amplitude corresponding to blood flow...................38
2-12. The PCC of the PPG from the nasal septum of an operating room pilot study subject, showing periodic reduction in amplitude corresponding to blood flow. ....39
xii

2-13. The PCC of the PPG from the nasal septum of an operating room pilot study subject, showing changes in blood flow over time. .................................................39
2-14. The LFC of the PPG from the nasal septum of an operating room pilot study subject, showing changes in baseline venous blood over time. ...............................39
2-15. The LFC of the PPG from the nasal septum of an operating room pilot study subject, showing increased fluctuations over time...................................................39
2-16. The PCC of the PPG from the finger of an operating room pilot study subject, showing the periodic effect of a blood pressure cuff. ..............................................40
2-17. The LFC of the PPG from the finger of an operating room pilot study subject, showing the periodic effect of a blood pressure cuff. ..............................................40
2-18. The PCC of the PPG from the nasal septum of an operating room pilot study subject, showing the effect of the ventilator. ...........................................................40
2-19. The nasal alar probe design, based on the cheek probe design. ...............................40
2-20. The PCC of the PPG from the finger of a healthy volunteer, showing the effect of a blood pressure cuff over time............................................................................41
2-21. The LFC of the PPG from the finger of a healthy volunteer, showing the effect of a blood pressure cuff over time............................................................................41
2-22. The PCC of the PPG from the finger of a healthy volunteer, showing the effect of brachial artery occlusion. .....................................................................................41
2-23. The LFC of the PPG from the finger of a healthy volunteer, showing the effect of brachial artery occlusion. .....................................................................................41
2-24. The PCC of the PPG from the finger of a healthy volunteer, showing the effect of a Valsalva maneuver. ...........................................................................................42
2-25. The LFC of the PPG from the finger of a healthy volunteer, showing the effect of a Valsalva maneuver. ...........................................................................................42
2-26. The PCC and LFC of the PPG from the finger of a healthy volunteer, showing the effect of position of the hand with respect to the heart.. ....................................42
2-27. The PCC of the PPG from the finger of a healthy volunteer, showing the effect of Mueller and Valsalva maneuvers.........................................................................43
2-28. The LFC of the PPG from the finger of a healthy volunteer, showing the effect of Mueller and Valsalva maneuvers.........................................................................43
2-29. The PCC of the PPG from the alar of a healthy volunteer, showing the effect of breathing through various endotracheal tubes..........................................................43
xiii

2-30. The LFC of the PPG from the alar of a healthy volunteer, showing the effect of breathing through various endotracheal tubes..........................................................44
2-31. The LFC of the PPG from the alar of a healthy volunteer, showing the effect of spontaneous respiration. ...........................................................................................44
3-1. Average simulated intrapleural pressure changes per breath ...................................62
3-2. Measured esophageal pressure changes per breath in healthy volunteers................63
3-3. Intrathoracic pressure changes per breath, simulated and measured........................63
4-1. A spectral analysis, where the x-axis corresponds to the frequency in Hz and the y-axis corresponds to power and is a log scale. .......................................................77
4-2. A low-pass filter. ......................................................................................................77
4-3. A high-pass filter.. ....................................................................................................78
4-4. The unprocessed PPG recorded from the nasal alar of a blood donor subject. ........78
4-5. The LFC of the PPG recorded from the nasal alar of a blood donor subject. ..........78
4-6. The PCC of the PPG recorded from the nasal alar of a blood donor subject. ..........78
4-7. The respiratory flow data, where the x-axis represents time and the y-axis represents flow rate. .................................................................................................79
4-8. The LFC of the PPG with respiratory flow. .............................................................79
4-9. The PCC of the PPG plotted with respiratory flow.. ................................................79
4-10. The PCC for the duration of one breath. ..................................................................80
4-11. The unprocessed PPG demonstrating the exaggerated affect of respiration on the LFC, hiding the PCC................................................................................................80
5-1. Respiratory flow data showing the elimination of one breath................................111
5-2. The PCC for the duration of one breath, showing an arrhythmia...........................112
5-3. The unprocessed PPG with respiratory flow data, showing the result of motion artifact.....................................................................................................................112
5-4. The alar LFC Swings for the blood donors, before and after blood loss................112
5-5. The finger LFC Swings for the blood donors, before and after blood loss. ...........113
5-6. The alar LFC Swings for the HD patients, before and after HD. ...........................113
xiv

5-7. The finger LFC Swings for the HD patients, before and after HD. .......................114
5-8. Estimated intrathoracic pressure change per breath vs alar LFC Swings in blood donors, before blood loss. ......................................................................................114
5-9. Estimated intrathoracic pressure change per breath vs alar LFC Swings in blood donors, after blood loss. .........................................................................................115
5-10. Estimated intrathoracic pressure change per breath vs finger LFC Swings in blood donors, before blood loss. ............................................................................115
5-11. Estimated intrathoracic pressure change per breath vs finger LFC Swings in blood donors, after blood loss. ...............................................................................116
5-12. Estimated intrathoracic pressure change per breath vs alar LFC Swings in HD patients, before HD. ...............................................................................................116
5-13. Estimated intrathoracic pressure change per breath vs alar LFC Swings in HD patients, after HD ...................................................................................................117
5-14. Estimated intrathoracic pressure change per breath vs finger LFC Swings in HD patients, before HD. ...............................................................................................117
5-15. Estimated intrathoracic pressure change per breath vs finger LFC Swings in HD patients, after HD. ..................................................................................................118
5-16. The alar LFC Swings of the blood donors, before and after blood loss. ................118
5-17. The finger LFC Swings of the blood donors, before and after blood loss. ............119
5-18. The alar LFC Swings of the HD patients, before and after HD. ............................119
5-19. The finger LFC Swings of the HD patients, before and after HD..........................120
5-20. The alar and finger PCC MagDiff in blood donors, before and after blood loss. ..120
5-21. The alar and finger PCC MagDiff in HD patients, before and after HD................121
5-22. The alar and finger PCC MagMean in blood donors, before and after blood loss.121
5-23. The alar and finger PCC MagMean in HD patients, before and after HD. ............122
5-24. The peak inspiratory flow rates in the blood donors, before and after blood loss..122
5-25. The peak expiratory flow rates in the blood donors, before and after blood loss. .123
5-26. The respiratory volumes in the blood donors, before and after blood loss. ...........123
5-27. The peak inspiratory flow rates in the HD patients, before and after HD. .............124
xv

5-28. The peak expiratory flow rates in the HD patients, before and after HD...............124
5-29. The respiratory volumes in the HD patients, before and after HD.........................125
5-30. The peak inspiratory flow rates of the blood donors for all three levels of respiratory resistance..............................................................................................125
5-31. The peak expiratory flow rates of the blood donors for all three levels of respiratory resistance..............................................................................................126
5-32. The respiratory volumes of the blood donors for all three levels of respiratory resistance. ...............................................................................................................126
5-33. The peak inspiratory flow rates of the HD patients for all three levels of respiratory resistance..............................................................................................127
5-34. The peak expiratory flow rates of the HD patients for all three levels of respiratory resistance..............................................................................................127
5-35. The respiratory volume of the HD patients for all three levels of respiratory resistance. ...............................................................................................................128
5-36. The pulse rate of the blood donors for all three levels of resistance. .....................128
5-37. The seated blood pressure of the blood donors for all three levels of resistance. ..129
5-38. The pulse rate of the HD patients for all three levels of resistance. .......................129
5-39. The seated blood pressure of the HD patients for all three levels of resistance. ....130
5-40. A comparison between the alar LFC Swings from the first two breaths and subsequent breaths in the blood donors, before and after blood loss. ....................130
5-41. A comparison between the finger LFC Swings from the first two breaths and subsequent breaths in the blood donors, before and after blood loss. ....................131
5-42. A comparison between the alar LFC Swings from the first two breaths and subsequent breaths in the HD patients, before and after HD. ................................131
5-43. A comparison between the finger LFC Swings from the first two breaths and subsequent breaths in the HD patients, before and after HD. ................................132
5-44. The alar LFC Swings from the first two breaths of the blood donors, before and after blood loss. ......................................................................................................132
5-45. The finger LFC Swings from the first two breaths of the blood donors, before and after blood loss. ...............................................................................................133
xvi

5-46. The alar LFC Swings from the first two breaths of the HD patients, before and after HD..................................................................................................................133
5-47. The finger LFC Swings from the first two breaths of the HD patients, before and after HD..................................................................................................................134
5-48. Ultrafiltrate removed vs alar LFC Swings in the HD patients for the high resistance level. ......................................................................................................134
5-49. Ultrafiltrate removed vs alar LFC Swings in the HD patients for the medium resistance level. ......................................................................................................135
5-50. Ultrafiltrate removed vs alar LFC Swings in the HD patients for the low resistance level. ......................................................................................................135
5-51. Ultrafiltrate removed as a percent of body weight vs alar LFC Swings in the HD patients for the high resistance level. .....................................................................136
5-52. Ultrafiltrate removed as a percent of body weight vs alar LFC Swings in the HD patients for the medium resistance level. ...............................................................136
5-53. Ultrafiltrate removed as a percent of body weight vs alar LFC Swings in the HD patients for the low resistance level. ......................................................................137
5-54. Estimated blood volume vs alar PCC MagDiff in the blood donors for the low resistance level. ......................................................................................................137
5-55. Estimated blood volume vs alar PCC MagMean in the blood donors for the low resistance level. ......................................................................................................138
6-1. The alar LFC Swings for all three resistance levels for the first ten blood donors, before blood loss. ...................................................................................................155
6-2. The unexpected alar LFC Swings for all three resistance levels for the blood donors, both before and after blood loss. ...............................................................155
6-3. The unexpected alar LFC Swings for all three resistance levels for the HD patients, both before and after HD. ........................................................................156
6-4. The peak inspiratory flow rates for all three levels of resistance for the blood donors, before blood loss. ......................................................................................156
6-5. Estimated intrathoracic pressure changes per breath vs alar LFC Swings in blood donor subject 1, after blood loss.............................................................................157
6-6. The alar LFC Swings for the HD patients, both before and after HD....................157
6-7. Fluid removed as a percent of body weight in the HD patients. ............................158
xvii

6-8. The alar PCC MagDiff for the blood donors, both before and after blood loss. ....158
6-9. The alar PCC MagMean for the blood donors, both before and after blood loss...159
6-10. The peak inspiratory flow rate for the blood donors, both before and after blood loss..........................................................................................................................159
6-11. The total respiratory volume for the blood donors, both before and after blood loss..........................................................................................................................160
6-12. The approximate percentage of red blood cells removed in the blood donors.......160
6-13. The pulse rate of the blood donors, both before and after blood loss.....................161
6-14. The alar LFC Swings for the blood donors, both before and after blood loss........161
xviii

Abstract of Dissertation Presented to the Graduate School of the University of Florida in Partial Fulfillment of the Requirements for the Degree of Doctor of Philosophy
PHOTOPLETHYSMOGRAPHY FOR DETERMINING MAJOR AIRWAY RESISTANCE CHANGES AND FOR DETECTING FLUID LOSS IN BLOOD
DONORS AND RENAL HEMODIALYSIS PATIENTS
By
Brian Scott Fuehrlein
August 2006
Chair: Richard Melker Major Department: Biomedical Engineering
There is currently no gold standard for noninvasive monitoring of respiratory
airway resistance or fluid volume status. The photoplethysmograph (PPG) is a
noninvasive optical method that can be used to monitor hemodynamic parameters and has
been shown to correlate with respiratory rate.
The PPG was recorded from the finger and nasal alar of 40 subjects: 20 volunteer
blood donors and 20 hemodialysis (HD) patients. Before and after donation/HD, each
subject performed resistance breathing maneuvers through three different endotracheal
tubes. A standard Butterworth filter was used to separate the PPG into a low frequency
component (LFC) and pulsatile cardiac component (PCC). A novel LFC measure was
compared across the three resistance levels. Three novel measures—one involving the
LFC and two involving the PCC—were compared before and after donation/HD.
Statistical differences were found across all three levels of resistance, indicating
that the PPG may be useful in detecting major changes in airway resistance. Statistical
xix

differences were found in the PCC variables in the blood donor subjects after blood loss,
and in the LFC variables in the dialysis subjects after fluid loss. These results indicate
that the PPG may be useful in detecting fluid loss and also in differentiating between
whole blood and ultrafiltrate loss. Patients with asthma and obstructive sleep apnea
should be studied to test the clinical application of the PPG for detecting changes in
airway resistance. Critically ill subjects should be studied to test the clinical application
of the PPG for monitoring fluid status.
xx

CHAPTER 1 BACKGROUND
Pulse Oximetry
Pulse oximetry is a standard of care in anesthesia and is found in many operating
rooms in the country. It is also used in doctors’ offices, by emergency paramedic
personnel, and in intensive care units. It is simple to use and noninvasive.
Theory of Pulse Oximetry
Hemoglobin (Hb) is the oxygen-transporting molecule in our blood. It contains
two pairs of globin peptide chains: alpha and beta. Each of these chains is able to
combine with a heme group. Each heme group is composed of one atom of iron
combined with a protophyrin molecule, and is able to combine reversibly with one
molecule of oxygen (Perutz 1969). The shape of the Hb changes with the binding of
oxygen and is the basis for the change in the optical absorption spectrum detected by the
spectrophotometric methods of pulse oximeters (Middleton and Henry 2000).
Spectrophotometry is based on the Beer-Lambert law, which relates the fraction of
radiant energy absorbed by the tested substance to the concentration and amount of the
substance. It states that the concentration can be determined as a mathematical function
of the light transmitted through the solution (Middleton and Henry 2000).
The Beer-Lambert law is a combination of Beer’s law and Lambert’s law. Beer’s
law states that the intensity of a transmitted light decreases exponentially as the
concentration of the substance increases, and can be expressed as A = ln ( Io / I )
(Equation 1-1). Lambert’s law says the intensity of transmitted light decreases
1

2
exponentially as the distance traveled through the substance increases, and can be
expressed as A = ε * L * C (Equation 1-2). Where A is absorbance, ε is the molar
absorptivity (or molar extinction coefficient), L is the path length, and C is the
concentration of the compound in the solution. These laws can be combined and
expressed as ln ( Io / I ) = ε * L * C (Equation 1-3). This is the fundamental basis by
which pulse oximeters calculate oxygen saturation.
Two wavelengths of light are emitted from a light emitting diode (LED). A red
wavelength (~660 nm) and infrared (IR) wavelength (~900 nm) are used. The isobestic
point is the point at which the two different Hbs absorb the two wavelengths of light to
the same extent. This occurs at 805 nm. The red and IR wavelengths were chosen
because they fall approximately equidistant from the isobestic point. Absorbance of
oxygenated hemoglobin (HbO2) at the red wavelengths is less than that of Hb, hence
HbO2 is more transparent to red light than Hb (Middleton and Henry 2000). The reverse
is seen in the IR spectrum, but to a lesser extent. Thus, comparison of absorbencies at
different wavelengths allows estimation of the relative concentrations of HbO2 and Hb
(i.e., saturation)—the basis of pulse oximetry. At wavelengths shorter than 600 nm,
melanin causes a greater degree of absorption; therefore blue, green, and yellow light are
not useful. At wavelengths longer than 1300 nm, absorption is excessive due to the
presence of water in the tissues (Middleton and Henry 2000).
The pulse oximeter probe consists of an LED mounted perpendicular to a
semiconductor photodiode (PD). An LED is a low-cost, mass-produced light source. A
separate LED is used for each wavelength. They are monochromatic, easy to
manufacture, and can be rapidly switched on and off. Major disadvantages associated

3
with LEDs include variations in the central wavelength of different diodes of the same
type. This variability can be as much as + 15 nm from the central wavelength. This
range can be significant, particularly in the red range, as the absorption spectra change
rapidly over a short distance. The LEDs alternate flashing the red, IR, and no light many
times per second, depending on the main power frequency. The purpose of the dark
period is to detect ambient light, which can then be subtracted from the detected red and
IR. This minimizes interference caused by external light. A single PD is used to detect
the light from both the red and IR LEDs. This PD is usually made from silicone, which
uses the semiconductor property of altering its electrical performance when exposed to
outside energy. It has a wide dynamic output range. Finally, the cable carrying the
signals from the probe to the oximeter unit must be shielded from electromagnetic
radiation. This is accomplished by including a flexible conductive braid in the covering
of the cable (Middleton and Henry 2000).
Pulse oximetry relies on the pulsatile nature of blood flow for its calculations. The
pulsatile absorbance between the light source and the PD is caused by arterial blood. The
pulse oximeter calculates the absorbance at each wavelength in the pulsatile component
and divides this by the corresponding nonpulsatile component to obtain a pulse-added
value. This value is independent of both the incident light intensity and the distance. It
then calculates the ratio (R) of these pulse-added absorbances at the different
wavelengths. This is then empirically related to saturation (Grace 1994). This can be
stated as R = (ACred / DCred) / (ACir / DCir) (Equation 1-4). This R is then calibrated
against a “co-oximeter”. This instrument uses small samples of heparinized blood
hemolyzed by ultrasound. This blood then has up to 17 wavelengths of light transmitted

4
through it. Using known oxygen concentrations from healthy volunteers, the pulse
oximeter is calibrated. This limits the accuracy of the device to oxygenation values
attainable from the healthy volunteers during calibration, and is the source of error in
hypoxic states (Jubran 1999).
History of Pulse Oximetry
Stokes (1864) reported that the colored substance in blood carries oxygen. This
was followed by Hoppe-Seyler (1864) who first crystallized this substance and coined the
term “haemoglobin.” Additionally, it was shown that the pattern of light absorption
changes when shaken with air (Hoppe-Seyler 1864).
Hertzman (1937a) described using photoelectric plethysmography of fingers and
toes as a dynamic analysis of the peripheral circulation. The device consisted of a beam
of light directed from an ordinary automobile headlight bulb on the finger or toe placed
above a shielded photoelectric cell of the photo-emissive type, purchased from the radio
trade. Photoelectric oscillations with variations in the blood content of the digit were
recorded by a string of galvanometer or suitable oscillograph after amplification.
Movements of the arm must not be transmitted to the finger, and a comfortable saddle or
sling is necessary to secure the arm to achieve the desired muscle relaxation, which
affects finger volume. This method was also used over the nasal septum and the values
were compared.
Millikan et al. (1941) first coined the term “oximeter” and described a method for
the continuous measurement of arterial saturation. A small unit placed over the shell of
the ear contained a lamp; two color filters; and two barrier-type, light-sensitive cells, with
which the transmission of either green or red light is measured. The green reading
depends on the amount of total Hb there is between the lamp and the photocell, and is

5
used to measure the degree of vasodilation, or “blood thickness” in the ear. This enables
one to choose the correct direct-reading calibration scale for estimating arterial oxygen
saturation, as measured in the red reading. This method has an accuracy of 5% in the top
half of its range and 8% in the bottom half. Goldie (1942) developed a device for
continuous indication of oxygen saturation of circulating blood in man.
This led Wood and Geraei (1949) to improve on these devices and develop a
method for photoelectric determination of arterial oxygen saturation. Prior instruments
were required to be preset to known arterial saturation values and could not be
conveniently used in patients who had arterial hypoxia, nor could they be used for the
actual determination of arterial oxygen saturation. The older devices could only be used
for qualitative changes in saturation. As a result of these shortcomings, Wood and Geraei
(1949) developed a device that could measure, and follow continuously, the absolute
value of arterial oxygen saturation from a pickup unit attached to the pinna of the human
ear. This new design consisted of a photoelectric earpiece that allows simultaneous
measurement of the transmission of red and near-IR light through either the normal
heat-flushed ear or the bloodless ear. Then by calculation, the light transmission of the
blood alone in these spectral regions can be determined, and in turn the percentage of
oxygen saturation of this blood content can be derived. This device was used in clinical
physiologic laboratories but its use did not spread.
Oximetry research then went dormant until 1972 when Aoyagi (2003) began his
work. His group wanted to build on the theories and success of the Wood oximeter.
They created a dye densitometry method. Two wavelengths of light were used. The ratio
of the two optical densities was calculated to obtain a dye curve. This curve was

6
expected to correspond to dye concentrations in blood. During this series of experiments
that importance of the pulsatile variations was first reported. After investigating the
effect of this pulsatile component using mathematical analysis of the Beer-Lambert law,
it was concluded that calculating the ratio of two optical densities compensates for the
pulsations. At this point, Aoyagi concluded if the optical density of the pulsating portion
is measured at two appropriate wavelengths and the ratio of the optical densities is
obtained, the result must be equivalent to Wood’s ratio. Aoyagi also concluded that the
arterial blood is selectively measured, and the venous blood does not affect the
measurement. Therefore, the probe site is not restricted to the ear. Finally, the reference
for optical density calculation is set for each pulse. Therefore, an accidental shift of
probe location introduces a short artifact and quick return to normal measurements.
Aoyagi continued working on oximeters until 1975. By 1975 he had developed a
technique very similar to modern-day pulse oximeters. Two wavelengths of light (630
nm and 900 nm) were chosen. From the transmitted light intensity data, the pulsation
amplitude (AC) and the total intensity (DC) were obtained, and the ratio (AC/DC) was
calculated. This ratio was obtained at both wavelengths of light to create a ratio of ratios
that corresponded to SaO2.
In 1980, Minolta developed OXIMET using two optical fibers and precision optics.
They adopted the finger as the probe site and proved that pulse oximetry was accurate
(Aoyagi 2003). Nellcor followed this in 1983 with development of the N-100. This was
a convenient pulse oximeter that used high-performance LEDs, a highly sensitive and
accurate PD, and a microcomputer. These technological advances led to the widespread
clinical use of pulse oximeters in the 1980s.

7
As pulse oximeters continue to improve, active research is being conducted
(Aoyagi 2003) in several key areas. Current research is focused on accuracy, optimum
alarm level setting, response time to desaturation, and motion artifact.
Reasons for Errors in Pulse Oximetry
In low perfusion states, saturation readings are intermittent or unavailable. This is
caused by the calibration of the devices using healthy adult volunteers. Therefore, the
accuracy is decreased at low saturation levels. Unfortunately, low saturation levels are
when the pulse oximeters are extremely useful.
The calculation of oxygenation is a moving average of user-preset length. The
problem of a delayed response time for pulse oximeters to detect desaturations can be
partially overcome by reducing the averaging setting to the shortest duration: usually two
seconds (Grace 1994). This is seldom done clinically, however, as it increases the
likelihood of artifact and false alarms. To overcome the problem of delayed response
time, it is necessary to develop processing algorithms sensitive enough to detect changes
quickly, while allowing for artifact rejection and avoiding false alarms.
Trivedi et al. (1997) explored the effects of various common sources of error on
several pulse oximeter models. In phase 1, a 150 watt Sylvania operating room light was
shone on pulse oximeter probes at a distance of 4 ft. Errors were defined as a heart rate
of more than 5% difference from electrocardiograph (ECG) and a SpO2 greater than 4%
from the SaO2 measured value. Inability of the pulse oximeter to obtain a reading was
also defined as an error. Error rates in phase 1 were as high as 63% for heart rate and
57% for saturation. In phase 2 of the study a motion generator was designed to generate
a standardized up-and-down 2 hz and 4 hz motion of a subject’s hand with oximeter
probes attached. The amplitude of this motion was approximately 4 in. All tested pulse

8
oximeters showed clinically significant error rates in saturation in both 2 hz and 4 hz
movements. Error rates were low in the 2 hz motion for heart rate calculations, however
all devices failed at 4 hertz motion. Others have also reported on the errors and false
alarms associated with movement artifact (Reich et al. 1996, Moller et al. 1993,
Runciman et al. 1993, Lawless 1994). Other sources of error include darkly pigmented
skin (Jubran 1999), nail polish, finger and/or toe burns, and inaccessibility of the
extremities.
A study was designed by van Oostrom and Melker (2004) to compare the
accuracy of nonproprietary probes designed for use with a variety of pulse oximeters with
that of their corresponding proprietary probes. A controlled signal was used to simulate
apneas. Statistical significance was not found in most of the comparisons but in some
instances the proprietary probes were closer to arterial oxygen than the nonproprietary
probes. Whether or not the manufacturer of the probe is the same as the manufacturer of
the pulse oximeter may have importance.
Photoplethysmography
Fundamentals of Photoplethysmography
There are two main frequencies of variation in the value of light hitting the PD, and
both are affected by absorption of the light by blood and various tissues. The low
frequency component (LFC), or nonpulsatile component, represents the baseline amount
of light hitting the PD. This value is affected by the total path traveled by the light. Skin,
bone, cartilage, adipose, blood, and so on—all absorb light, and this relatively constant
path results in a baseline amount of light hitting the PD. This baseline amount fluctuates
at a lower frequency than the heart rate. Since the biological tissues in the path of the
light are constant, with the exception of venous and arterial blood, the changes in the

9
LFC component correspond to changes in baseline blood volume in the path of the light.
Most of this baseline blood resides in the venous system.
The pulsatile cardiac component (PCC) corresponds to changes in the arterial blood
volume with each heartbeat. The magnitude of the change of the PCC with each
heartbeat is related to stroke volume, and the area under the curve of each heartbeat is
related to the volume of blood entering the vascular bed with each beat (Murray and
Foster 1996). The PCC therefore represents flow into a vascular bed, while the LFC
represents changes in venous volume (Figure 1-1).
The typical pulse oximeter displays a processed waveform (Figure 1-2). Since the
raw data collected by the device corresponds to light hitting the PD (which is inversely
related to blood volume), the waveform must be inverted to resemble an arterial pressure
waveform. If the photoplethysmograph (PPG) was shown as raw data and not inverted,
Point A would represent increasing light hitting the PD (corresponding to a decrease in
blood volume), and Point B would correspond to the point of maximum light hitting the
PD, or the point of least blood in the vascular bed being monitored. Steepness of the
flow of inflow Phase A may indicate ventricular contraction, and the amplitude of the
phase may be used to indicate stroke volume (Murray and Foster 1996). The vertical
position of the dicrotic notch can be used to indicate vasomotor tone. Under most
circumstances the notch descends to the baseline during increasing vasodilation, and
climbs toward the apex with vasoconstriction (Murray and Foster 1996).
Photoplethysmograph Processing
Before the advent of powerful personal computers, many researchers printed the
PPG waveform and measured various parameters with a ruler. More recent efforts
involve elaborate mathematical and signal processing models. Battacharya et al. (2001)

10
used a novel concept aimed at detecting the dominant nonsinusoidal period and extracting
the associated periodic component. This detection and extraction was performed with a
moving window to accommodate the variations of the physiological oscillations. They
also characterized the system with a nonlinear dynamical system.
Goldman et al. (2000) published a detailed description of their signal extraction
for error reduction. Massimo signal extraction technology used a new conceptual model
of light absorption for pulse oximetry and used discrete saturation transforms to isolate
individual saturation components in the optical pathway. Johansson (2003) processed the
PPG signal with a 16th-order bandpass Bessel filter and a 5th-order bandpass Butterworth
filter. A neural network analysis was performed. Nilsson et al. (2003) used three
separate methods for evaluating the PPG (called the blood volume pulse) for changes
caused by exercise. First they derived a single parameter from the distribution found in
the average histogram of the time-aligned beats. Their second approach analyzed the
ratio observed between the first harmonic and higher harmonics in the signal. The third
approach evaluated the dicrotic notch depth directly from the PPG waveform.
Uses of the Photoplethysmograph
Arterial mechanics
Kato et al. (1999) constructed a mathematical model of the fingertip arterial wall
from the relationship between the PPG wave and arterial pressure. The PPG and pressure
at the ipsilateral radial artery were monitored simultaneously. Different mathematical
models were tested to fit the data. The best model was then applied to data obtained
during administration of vasoactive drugs in anesthetized patients. The vasoactive agents
produced changes in the model parameters implying mechanical alterations in the arterial
11
wall. The authors concluded that a four-element, two-compartment model can be applied
to the PPG to determine peripheral vascular wall mechanics.
Chowienczyk et al. (1999) sought to determine whether a simple index of pressure
wave reflection may be derived from the digital volume pulse (DVP) and used to
examine endothelium dependent vasodilatation in patients with type II diabetes mellitus.
They focused on the relative height of the inflection point separating the systolic and
diastolic components of the DVP. By administering various drugs and monitoring the
DVP, they were able to conclude that PPG assessment of the DVP may provide a useful
method to examine vascular reactivity.
Millasseau et al. (2002) concluded that contour analysis of the DVP provides a
simple, reproducible, noninvasive measure of large artery stiffness. Millasseau et al.
(2003) concluded that indices of pressure wave reflection and large artery stiffness can be
used as an index of vascular aging. Bortollo et al. (2000) determined that the second
derivative of the PPG and the pulse wave velocity can both be used to evaluate vascular
aging in hypertensives.
The use of the PPG as an indicator of various vascular functions is an active area of
research. If the PPG can provide a noninvasive window into the functioning of the
vascular system this would provide a major medical advancement.
Respiratory rate
Changes in intrathoracic pressure during the respiratory cycle displace venous
blood, affecting the LFC. These changes also affect cardiac return, changing the
amplitude of the PCC. During spontaneous breathing, subatmospheric pressure during
inspiration draws air and blood together into the lungs: blood is drawn from the vena
cava into the right heart and pulmonary vascular bed. A minor decrease in peripheral

12
venous pressure (PVP) ensues. Soon thereafter the expiratory pressure normalizes the
system. During positive pressure ventilation, the inspiration is drawn by positive
pressure, which raises intrathoracic pressure and reduces venous return to the right heart.
Simultaneously, and very briefly, blood forced from the low-pressure pulmonary vascular
bed increases return to the left heart and stroke volume (Pinsky and Summer 1983). This
is followed by a decrease in cardiac output as venous return into the central circulation
drops off. The extent of the fluctuations caused by positive pressure ventilation depend
on the state of filling of the peripheral vascular bed, the intrathoracic pressure changes,
peripheral vasoconstrictor activity, and central blood volume (Murray and Foster 1996).
Since positive pressure ventilation often accompanies general anesthesia, which causes
vasodilation and damped vasomotor response, respiratory fluctuations are emphasized. It
was also discovered that early hypovolemia may be reflected in an exaggerated
respiratory wave before other more classic signs of decreased urine output, tachycardia or
hypotension (Murray and Foster 1996).
Nilsson et al. (2000) extracted the cardiac and respiratory related components,
applied a mathematical algorithm, and developed a new PPG device for monitoring heart
rate and respiratory rate simultaneously. Sixteen patients undergoing routine operations
received general anesthesia. Continuous PPG measurements were made for 60 min in
each patient. The signal was amplified, the LFC was eliminated, and various analyses
were performed. They concluded that the PPG has the potential for respiratory rate
monitoring.
Nilsson et al. (2003) looked at the physiologic basis for the changes in the LFC,
which they termed respiratory induced intensity variations (RIIV). They hypothesized

13
that the filling of peripheral veins is a major mechanism behind the RIIV signal. In the
study, 16 adult volunteers had a cannula inserted for the measurement of PVP. The PVP
and RIIV amplitudes changed significantly with tidal volume and respiratory rate and
with thoraco-abdominal separation. These signals were significantly greater in
predominantly thoracic respiration than in natural respiration. They concluded that a
correlation exists in the amplitudes of the RIIV in the PPG and the respiratory variations
in PVP (p < .01). This correlation could be a co-variance and not an explanatory factor.
Leonard et al. (2003 and 2004) sought to determine if analysis of the PPG by
wavelet transforms could determine respiratory rate at an earlier stage than a drop in
saturation. They concluded that baseline respiratory rate was easily identified from a
pulse oximeter PPG using wavelet transforms. Foo and Wilson (2005) estimated the
breathing interval (BI) in children using the PPG. The BI was extracted from the PPG
using a two-stage signal processing technique termed zero-phase digital filtering. They
concluded that the BI obtained from the PPG was significantly related to that estimated
by a calibrated air pressure transducer during tidal breathing in the absence of motion
artifact (p < .05). Nilsson et al. (2005) concluded that respiration can be monitored by
the PPG with high sensitivity and specificity regardless of anesthesia and ventilatory
mode. Reflectance PPG was measured at the forearm on awake spontaneously breathing
patients, anesthetized spontaneously breathing patients and anesthetized ventilated
patients.
Leonard et al. (2006) continued their work by developing a fully automated
algorithm for the determination of respiratory rate from the PPG. The PPG was recorded
14
from 12 spontaneously breathing, healthy adult volunteers. The automated algorithm
used wavelet analysis techniques with two novel secondary transforms.
Pulsus paradoxus
Pulsus paradoxus (PP) is the inspiratory decrease in systolic blood pressure, which
is proportional to changes in intrathoracic pressure during inspiration and expiration
(Frey and Butt 1998). It is increased in asthma, upper airway obstruction, cardiac
tamponade, myocardial decompensation and hypovolemia (Miro and Pinsky 1992,
Heitmiller and Wetzel 1996, Pfenninger 1985, Morgan et al. 1969). Butt and Frey (1998)
sought to correlate the respiratory variations of the PPG to PP. They defined the
respiratory dependent changes of the PPG as the difference between the highest value of
the upper peak of the wave and the lowest value in the upper peak of the wave. In 62
nonintubated children, the PPG wave, arterial blood pressure, breathing cycle and ECG
were recorded. They concluded that pulse oximetry is a rapid, noninvasive method for
objectively estimating the degree of PP.
Hartert et al. (1999) studied 26 patients with obstructive airway disease. They
described the characteristic alterations in the pulse oximetry tracings that occur in the
presence of pulsus paradoxus and auto positive end expiratory pressure. The pulse
oximetry tracings were evaluated for respiratory waveform variation, measured in
millimeters from the PPG printout. The respiratory tracing was derived by connecting
the AC component minimums.
Blood volume
The changes in systolic pressure with respiration, as shown by arterial pressure
waveforms, are referred to as systolic pressure variation (SPV). This variability with
positive pressure ventilation is useful in estimating various conditions (Perel et al. 1987,
15
Pizov et al. 1988, Coriat et al. 1994, Rooke et al. 1995). Perel et al. (1987) quantified the
SPV during graded hemorrhage in ventilated dogs and compared its reliability relative to
other hemodynamic parameters. They concluded that the difference between systolic
pressure at end-expiration and the lowest value during the respiratory cycle (dDown)
correlated to the degree of hemorrhage. It also correlated with the cardiac output and the
pulmonary capillary wedge pressure. Thus, SPV and its dDown component are accurate
indicators of hypovolemia in ventilated dogs subjected to hemorrhage. Rooke et al.
(1995) also concluded that SPV and the dDown appear to follow shifts in intravascular
volume in relatively healthy, mechanically ventilated humans under isoflourane
anesthesia.
Building on this principle, Partridge (1987) attempted to use pulse oximetry as a
noninvasive method to assess intravascular volume status. Data was collected from 12
patients, ranging in age from 29 to 80 years, undergoing general anesthesia. The patients
were monitored with intraarterial and central venous or pulmonary artery catheters.
Printouts were made of the PPG waveform over a two breath cycle. They measured
mean intraarterial blood pressure, mean central venous pressure (CVP) at end expiration
in mm Hg, SPV, CVP variation, and pulse waveform variation. The study showed that
the PPG correlated with the SPV (r = .61), which was previously shown to be a sensitive
indicator of hypovolemia.
Shamir et al. (1999) investigated ventilation induced changes in the PPG after
removing and reinfusing 10% estimated blood volume in 12 anesthetized patients. The
plethysmographic SPV was measured as the vertical distance between maximal and
minimal peaks of waveforms during the ventilatory cycle and expressed as a percentage

16
of the amplitude of the PPG signal during apnea. This was measured during five
consecutive mechanical breaths before apnea and the mean value was obtained for
analysis. The 10% loss of estimated blood volume resulted in increased heart rate
without changes in mean arterial pressure. Both the PPG waveform changes and the SPV
from the arterial blood pressure tracing increased significantly after blood withdrawal
(p < .01). The changes in the PPG correlated with the changes in the SPV. After volume
replacement, heart rate decreased while arterial pressure remained unchanged. There
were no significant changes in the PPG waveform or the SPV with volume replacement.
Patent Review
United States Patent number 3,334,065 by Al-Ali et al. (2001) discussed an
improved stereo pulse oximeter providing simultaneous, noninvasive oxygen status and
PPG measurements at both single and multiple sites. It measures both arterial and venous
oxygen saturation with a corresponding PPG. Its main advantage is the detection and
management of persistent pulmonary hypertension in neonates, patent ductus arteriosis,
and aortic coarctation.
United States Patent number 6,616,613 by Goodman (2003) discussed a health
monitoring and biofeedback system made of a PPG sensor, a processing device, and a
web site server for determining, displaying and analyzing various cardiovascular
parameters. The PPG was recorded specifically for the purpose of measuring the systolic
wave pulse and the systolic reflected wave pulse present within the DVP signal. The
PPG was processed in a variety of ways including first, second, third and fourth order
derivatives and a 6 to 20 Hz filter. The mean volume pulse amplitude and the area under
the contour during the duration of the DVP pulse were analyzed. The PPG measures
were a fraction of the overall measures used in the monitoring system.

17
United States Patent number 6,709,402 by Dekker (2004) claimed the use of the
PPG to monitor secondary physiological processes, such as respiratory rate and heart rate.
He discussed the “DC component,” which generally corresponds to the attenuation
related to the nonpulsatile volume of the perfused tissue. He also discussed the “AC
component,” which corresponds to the heart rate. Additionally, the signal separation of
the DC and AC components was discussed. The DC component varies over a low
frequency and small amplitude and this variation is attributable to changes in the
monitored tissue caused by other physiologic processes.
The International Patent Application number WO 2004/080300 by Shelley et al.
(2004) discussed a method of assessing blood volume using photoelectric
plethysmography. The method analyzed the cardiovascular waveform—representing the
systolic pressure upon the cardiac signal—and compared it to the per heartbeat
minimums of the cardiovascular waveform—representing the diastolic pressure upon the
cardiac signal. The analyzing step included applying harmonic analysis to the
cardiovascular waveform, extracting a frequency signal created by ventilation, and
applying the extracted frequency signal in determining blood volume of the subject.
United States Patent number 6,898,452 by Al-Ali et al. (2005) discussed
additional uses for stereo pulse oximeters. Stereo pulse oximeters simultaneously
measure both arterial and venous oxygen saturation at specific sites, and generate a
corresponding PPG waveform. Additionally, they compute the corresponding arterial
minus venous oxygen saturation, which is advantageous for oxygen therapy management.
The PPG is recorded at two different sites and analyzed for phase differences and
damping.

18
United States Patent Application 20060058691 (Kiani 2006) discussed a
hypovolemia monitor by utilizing a PPG signal. A measurement of the respiration-
induced variation was made. The measurement was normalized and converted into a
hypovolemia parameter. An audible or visual indication of hypovolemia was provided.
International Patent number WO2006/037184 (Oates and Martin 2006) discussed a
method and apparatus for noninvasive monitoring of respiratory parameters in sleep
disordered breathing. They described the analysis of both the alternating current (AC)
amplitude and offset. The AC amplitude is most indicative of vascular compliance and is
best analyzed from a PPG derived from a finger. They describe how the offset varies
with respiratory effort. They also describe the relationship between the PPG baseline and
pulsus paradoxus.
Figure 1-1. A Graphic representation of the LFC and PCC from a typical finger probe.
The PCC is typically less than 5% of the total signal acquired.

19
Figure 1-2. A typical display of a processed pulse oximeter waveform. A) the rate of
maximum volume increase, B) the point of maximum volume, C) the dicrotic notch, and D) the minimal basal volume.

CHAPTER 2 INTRODUCTION
Novel Pulse Oximeter Prototypes
Literature Review
The nasal septum was explored as a possible monitoring site in 1937 (Hertzman
1937b). Groveman et al. (1966) also explored the nasal septum and believed that it
represents a constant picture of the internal carotid circulation and reflects cerebral flow.
Cucchiara and Messick (1981) showed that plethysmography from the nasal septum
failed to estimate cerebral blood flow during carotid occlusion. In 1991 the nasal septum
was explored during hypothermia (Ezri et al. 1991). Fourteen patients were monitored
every 20 min during major abdominal procedures. The nasal septum probe was superior
to the finger probe in detecting a pulse during hypothermia. The authors concluded that
monitoring at the nasal septum was more reliable than monitoring at the finger in
hypothermic patients. They acknowledged several limitations, including use during nasal
intubation, in patients with extremely small nostrils, or the presence of a nasogastric tube.
Buccal probes were evaluated as an alternative. They were prepared by taping a
malleable metal bar securely over the back of a disposable Nellcor finger probe and
bending the metal bar and probe around the corner of a patient’s mouth (O’Leary et al.
1992). It was determined that buccal SpO2 was greater than finger SpO2 and agreed more
closely with SaO2. The authors concluded that buccal pulse oximetry is a viable
alternative to the finger. Limitations included longer preparation time, difficult
placement, and possible dislodgement during airway maneuvers.
20

21
Awad et al. (2006) demonstrated that the ear plethysmographic waveform is
relatively immune to vasoconstriction. They also determined that the PPG width has a
good correlation to cardiac output. They concluded that the ear is more suitable for
monitoring hemodynaic changes than the finger.
Novel Probe Designs
A significant number of subjects can not be adequately monitored using the fingers
and other peripheral sites. We developed pulse oximeter probes specifically for
monitoring saturation and pulse rate from central sites: the cheek and nasal septum. The
prototype probes (Figure 2-1) were adapted for use with Novametrix 520A pulse
oximeters.
The nasal septum has strong promise as a pulse oximeter monitoring site.
Kiesselbach’s Plexus is the area in the anteroinferior part of the nasal septum. It is
supplied by the sphenopalatine, greater palatine, superior labial and anterior ethmoid
arteries (Groveman 1966). These vessels originate from both the internal and external
carotid arteries and are the most frequent cause of epistaxis. The anastemotic blood
supply from both branches of the common carotid artery allows for a unique look at
blood flow to the head and brain. The strength of the photoplethysmograph (PPG) signal
from the nasal septum is strong enough to force the use of physical filters over the light
emitting diodes (LED) to prevent PD saturation.
To test the accuracy of the novel nasal septum and cheek probes, a desaturation
study was conducted in the hypoxia research laboratory at the University of California
San Francisco. A Perkin Elmer Model 1100 medical gas analyzer, Radiometer Model
OSM-3 hemoximeter, Radiometer Model ABL-5 blood gas machine and Nellcor Model
N200 pulse oximeter were used in the analysis. Six males and six females were

22
desaturated to a SaO2 of 65%. The variation in saturation readings for the cheek probe
(Figure 2-2) and nasal septum probe (Figure 2-3) was consistently less than + 3% and the
root mean square (RMS) error within one standard deviation of all data points was
approximately two.
While the SpO2 readings in the testing laboratory were accurate, the clinical utility
of the probes needed to be addressed. A 30 patient study was designed to evaluate the
clinical utility of these novel pulse oximeter probes. This study required the development
of software that allowed for collection of pulse oximetry data.
Pulse Oximeter Data Acquisition Viewer
Pulse Oximetry Data Acquisition Viewer (PODAV) was developed by Convergent
Engineering (Gainesville, FL). It simultaneously communicates with three pulse
oximeters. It interfaces with the serial output port of the Novametrix Oxypleth 520A and
uses the Novametrix proprietary Venus data logging protocol. It collects pulse rate, SpO2
and the PPG. The PPG waveform is sampled at 100 Hz from the infrared (IR) LED, and
the SpO2 and pulse rate are sampled once per second. The Venus protocol also provides
access to the LED power of the transmitter. The LED power is a normalized value that
varies between zero and 254. The PODAV software stores all data in Microsoft Access
database files for analysis. While recording the data, users can also record time-stamped
notes for future reference and enter patient information.
In PODAV, the PPG is displayed based on the data collected from the IR channel
of the pulse oximeter. Since the data collected in PODAV represents values of light
hitting the photodiode (PD), processing is required to display the real-time PPG in a user-
friendly format. To display the pulsatile cardiac component (PCC) of the PPG, a simple
algorithm was used to remove the baseline low frequency component (LFC). Depending

23
on the pulse oximeter collection site, data values are in the range of hundreds of
thousands of arbitrary light units while the PCC fluctuations are in the range of
thousands, resulting in a small signal to noise ratio. Many pulse oximeter manufacturers
use complex, proprietary algorithms to boost signal strength and eliminate this problem.
The PODAV software continuously calculates a 10 sec moving average of the data. This
value is continually subtracted from the baseline data. This new data is plotted and
centered at zero and represents the PCC. The subtracted value is displayed in the
software as “DC Gain” (Figure 2-4), and represents the LFC.
The PCC is displayed (Figure 2-4) for three pulse oximeter probes. The PODAV
software interface shows the oxygen saturation for up to three probes for the previous 20
min, the pulse rate, and the LED power. The LED power is automatically adjusted by the
pulse oximeter so the light hitting the PD falls within a desired range. The septum is a
thin piece of cartilage and requires less light to penetrate it, hence the LED power
required to power the pulse oximeter usually very low. The LED power of a finger probe
is always 254, the highest value. The DC gain is continuously updated and subtracted
from the raw data to obtain the PCC. Additionally, the pulse rate can be graphed for the
previous 20 min (similar to saturation). Finally, patient information can be entered and
notes can be taken at any time during the case.
Pilot Operating Room Study
After the development of PODAV, the operating room pilot clinical utility testing
study of the two novel pulse oximeter probes was conducted. Thirty adult subjects
undergoing surgery at a university medical hospital were recruited. Of the 30 subjects,
15 were male and 15 were female. They ranged in age from 21 to 80 years. Subjects
undergoing head or neck surgery or a procedure where the nasal septum or cheek probes

24
would interfere with the surgical field were excluded. The anesthetic technique used was
at the discretion of the anesthesiologist. The study was approved by the Western IRB.
Subjects were paid for their participation.
On the day of surgery, a novel nasal septum pulse oximeter probe, a novel cheek
pulse oximeter probe and a standard finger pulse oximeter probe were all placed on the
subject. The finger probe was placed on a finger adjacent to the routine finger probe used
by the anesthesiologist. The three experimental probes were connected to Novametrix
Oxypleth pulse oximeters. The data was ported to PODAV, running on a laptop
computer, and recorded continuously throughout the surgery. The saturation averaging
was set to 2 sec. The age, height, weight, gender, and surgical procedure were recorded
for each subject. Additional data including blood gas results and intermittent blood
pressure readings were recorded during the procedure. A minimum of 45 min of data was
collected for each subject.
The study concluded that the oxygen saturation and pulse readings of the nasal
septum and cheek probes did not differ from the gold standard finger probe.
Additionally, it was concluded that the ease of access to the face by the anesthesiologist
offered an advantage over the traditional finger probe.
Secondary Findings
The moving average algorithm eliminated the LFC and displayed the PCC in a user
friendly form. By nature, a moving average does not eliminate relatively fast changes.
The more stable the LFC was, the more easily it was eliminated. The nature of the
algorithm provided valuable insight.

25
Arrhythmias
Arrhythmias were detectable using the PPG. Arrhythmias create sharp fluctuations
in the pulse rate. Since the pulse rate is calculated by the timing of the individual
heartbeats, it is affected by arrhythmias. During a premature ventricular contraction
(PVC) a premature heartbeat is followed by a delayed beat. This variation in the timing
of the heartbeats causes the pulse rate to change rapidly. If the pulse rate calculation
averaging is set to the longest duration, the slight delay in the heart rate caused by the
arrhythmias is not sufficient to affect the calculation. Since most clinicians set the
averaging to the longest duration, this information is usually not available.
A pulse tracing for a 30 min period is shown (Figure 2-5). Until the 9:36 mark the
pulse rate was relatively stable. At approximately 9:36, high frequency fluctuations
began. This marked the beginning of period of very frequent cardiac arrhythmias
(Figure 2-6).
There are three examples of arrhythmias in the 30 sec window (Figure 2-6). The
exact cause and nature of the arrhythmias was not known as an electrocardiograph (ECG)
was not being simultaneously recorded. Premature beats occur at a faster rate than the
normal heart rate, resulting in a sharp increase in the heart rate while the subsequent
delayed beat results in a decrease in heart rate. These changes occur for only these two
beats and the pulse quickly resumes its previous rate. Arrhythmias affected eight of the
30 patients in the study. Further studies should be conducted to determine the type of
arrhythmias detectable with PPG. Preliminary observations suggest that arrhythmia
detection can very easily be built into existing pulse oximeters by using the PPG with
simple processing algorithms.

26
Ventilator effect
During positive pressure ventilation the intrathoracic pressure increases, reducing
venous return to the right heart. Simultaneously, and very briefly, blood forced from the
low-pressure pulmonary vascular bed increases return to the left heart and stroke volume
(Pinsky and Summer 1983). This is followed by a decrease in cardiac output as venous
return into the central circulation drops off. The extent of the fluctuations caused by
positive pressure ventilation depend on the state of filling of the peripheral vascular bed,
the intrathoracic pressure changes, peripheral vasoconstrictor activity, and central blood
volume (Murray and Foster 1996). Since positive pressure ventilation often accompanies
general anesthesia, which causes vasodilation and damped vasomotor response,
respiratory fluctuations are emphasized. It has also been discovered that early
hypovolemia may be reflected in an exaggerated respiratory wave before other more
classic signs of decreased urine output, tachycardia or hypotension.
Several of the subjects in the operating room study were under anesthesia for
greater than 3 h, and in some cases the ventilator effect on the PPG was magnified. In
some cases the effects were large enough to not be removed with the 10 sec moving
average algorithm, resulting in low frequency baseline fluctuations of the PCC
component of the PPG.
The ventilator effect on the PCC from the nasal septum was easily identifiable
(Figure 2-7). The moving average algorithm was serendipitous in that it removed enough
LFC to allow for a user friendly display centered at zero yet did not remove too much to
eliminate interesting fluctuations. An ideal separator of PCC and LFC would always
keep the PCC centered at zero, regardless of ventilator effect. The ventilator effect on the

27
PPG—particularly how it is magnified in the nasal septum and cheek probes—is the
cornerstone of many subsequent studies, updated software, and newer probe designs.
Cardiac bypass
Two of the 20 cases required a cardiac bypass pump. During bypass, the lack of
pulsations prevented the pulse oximeter from calculating oxygen saturation. The nasal
septum, cheek and finger probes were equally ineffective. In one of the cardiac bypass
surgery cases, the cheek probe detected a pulse significantly earlier than the other two
probes when the pump was turned off and the heart began pumping. This resulted in an
oxygen saturation reading 5 min earlier than the nasal septum and finger pulse oximeter
probes. The oxygen saturation trends of the cheek and finger pulse oximeter probes are
shown (Figure 2-8).
Blood pressure cuff
In one subject, the noninvasive blood pressure cuff was placed on the same arm as
the finger pulse oximeter probe. The PCC component of the PPG from a finger pulse
oximeter probe is displayed using the 10 sec moving average algorithm (Figure 2-9). It
shows the effects of a blood pressure cuff on the PCC. The blood pressure cuff inflates to
a pressure greater than systolic pressure and blood flow to the finger ceases. As the cuff
deflates, the magnitude of the PCC slowly returns to its baseline level.
Limitations
To avoid injury, the nasal septum probe does not contact the septum. For this
reason, it is extremely susceptible to movement artifact. The pilot study was performed
during general anesthesia and the subjects were motionless. Due to artifact caused by
movement, the nasal septum probe requires redesign to be used in awake subjects.

28
Light interference errors occurred in the nasal septum several times. This error was
attributed to the lack of septum contact with the PD resulting in exposure to ambient
light. In subjects with a thin septum, the PD was saturated, rendering the probe useless.
Physical filters were placed over the PD to absorb some of the light allowing the probes
to function normally. In darkly pigmented subjects, or those with a thick septum, the
filters created low signal strength errors as too much light was being absorbed. Ideally,
there would be a range of nasal septum probe designs to be used on different patient
populations.
The position of the cheek probe varied the saturation reading in one case. The
saturation reading rose after slight positional adjustment. It is possible that the beard of
the subject caused the interference.
Updated Signal Separation Algorithm
These interesting findings, coupled with the utility of PCC and LFC extraction,
prompted the need for an improved algorithm for signal separation. MatLab was used
and an algorithm was created to facilitate this analysis. First, the peaks and troughs of the
signal were identified discretely. They were identified at the expected heart rate,
estimated by Fourier or autocorrelation analysis. Finding the midpoints between peaks
and troughs were then calculated. The LFC was extracted as the interpolated (and
possibly smoothed, or splined) line that connects these midpoints. The PCC was
extracted as the raw signal minus the LFC.
The algorithm was applied to unprocessed data and further interesting findings
were obtained from the pilot OR study. The unprocessed PPG obtained from the nasal
septum is shown (Figure 2-10). The scale on the left corresponds to 320,000 to 330,000
arbitrary light intensity units obtained directly from the PD. The high frequency

29
fluctuations correspond to the heart rate. These heart rate induced changes are very small
relative to the overall amount of light hitting the PD. In this case, the baseline light
hitting the PD is around 320,000 while the magnitude of change from the heart beating is
approximately 3,000. The lower frequency changes represent the ventilator effect. When
the ventilator fires, there is an increase in intrathoracic pressure leading to a reduction of
venous return to the heart. This blood becomes temporarily pooled in tissue beds distal to
the heart. This results in an increase in absorbance and decrease in light hitting the PD.
Each time the ventilator fires the PPG shifts downward. Using raw data and applying the
algorithm described, the PCC and LFC were plotted separately.
Secondary Findings from the Operating Room Study Revisited
The amplitude of the PCC of the PPG is an indicator of stroke volume (Murray and
Foster 1996) and may be a surrogate marker for blood flow. When analyzing the PCC
for trends, it is often helpful to plot the PCC during several hours.
The PCC from the cheek probe and nasal septum probe of the same patient over the
course of nearly 2 h is shown (Figures 2-11 and 2-12). The baseline LFC changes have
been removed from the PCC. Periodically, blood flow to the cheek and nasal septum
diminished. The causes of the local changes in blood flow are unclear but independent
probes demonstrating the same phenomena at the same time indicate a true physiologic
change occurred.
The PCC and LFC from the nasal septum from the same 10 min period from the
same subject are shown (Figures 2-13 and 2-14). The PCC shows an increase in blood
flow near the beginning of this 10 min period evidenced by the increase in amplitude.
Simultaneously, there was a decrease in the LFC. This patient experienced a local
increase in blood flow to the head illustrated by the increase in PCC, and an increase in

30
local venous blood volume evidenced by the drop in LFC. The slightly different lines
depicting the LFC represent slightly different smoothing algorithms used for display.
In several cases, the amplitude of the LFC fluctuations, corresponding to the
ventilator firing, changed throughout the case. This coincides with previous observations
of increased ventilator effect on the PPG. The LFC from the nasal septum probe over a
20 min period is shown (Figure 2-15). The sharp fluctuations represent the LFC changes
corresponding to the ventilator firing. The amplitude of these changes increased toward
the end of this case. This shows the exaggerated effect of the ventilator on the LFC.
The PCC and LFC from the finger pulse oximeter of the subject with the blood
pressure cuff are shown (Figures 2-16 and 2-17). The reduction of the PCC seven times
corresponds to the blood pressure cuff inflation. The LFC decreases with each inflation.
This decrease corresponds to an increase in absorption due to the pooled peripheral
venous blood, which accumulates in the hand while the cuff is inflated. The higher
frequency low magnitude fluctuations in the LFC correspond to the ventilator rate.
Additionally, there is a slight decrease in PCC magnitude in between the second and third
cuff firing simultaneous to a slight increase in overall LFC. This case illustrates just a
few of the potential applications of the PCC and LFC of the PPG and the ability to detect
a variety of physiologic events. The effect of the ventilator can be seen in the PCC as
well. When the troughs of the PCC were aligned with the zero axis, the respiratory effect
on cardiac output is seen on a beat-to-beat basis (Figure 2-18).
Nasal Alar Probe
To reduce motion artifact while preserving the signal to noise ratio and physiologic
sensitivity, a spin-off of the nasal septum probe was designed. The nasal alar is fed by
the same branches of the internal and external carotid arteries as the nasal septum. Since
31
the alar is protected by a layer of epidermis, it allows for a probe that can apply slight
pressure, which reduces movement artifact and light interference. A nasal alar probe was
designed (Figure 2-19). Similar to the nasal septum probe, this alar probe is able to
obtain readings from branches of both the internal and external carotids. The major
drawbacks of the nasal septum probe previously discussed were reduced or eliminated.
Additional Studies
The PCC is mainly affected by arterial blood, while the LFC is mainly affected by
venous blood. The PCC and LFC from a finger probe in a healthy volunteer over 20 min
are shown (Figures 2-20 and 2-21). A blood pressure cuff was inflated at a rate of 5
mmHg per minute until the pressure in the cuff exceeded systolic pressure. The PCC
amplitude gradually decreased. This corresponded to a gradual decrease in flow to the
finger with increasing cuff pressure. Finally, once systolic pressure was exceeded the
flow to the finger fell to zero indicated by the flat PCC. Meanwhile, the LFC continued
to drop as blood was trapped in the arm.
The PCC and LFC from the finger probe from a volunteer are shown (Figure 2-22
and 2-24). In this case the brachial artery was occluded by direct pressure while allowing
venous blood to continue to drain from the arm. The PCC immediately fell to zero as
there was no pulsatile flow to the finger. The LFC, however, rose, as more light hit the
PD as venous blood was allowed to drain from the arm while no arterial blood entered.
This simple series of experiments using a finger probe on a volunteer clearly showed the
need to look at both the PCC and LFC when attempting to understand what is happening
physiologically.
The PCC and LFC from a finger probe are shown (Figures 2-23 and 2-24). In this
experiment a Vasalva maneuver was performed. A Valsalva maneuver involves bearing

32
down against a closed glottis. This increases intrathoracic pressure, impeding venous
return, causing a pooling of venous blood in the periphery. The lack of venous return
causes a reduction in cardiac output. The amplitude of the PCC dropped immediately
after the onset of the Valsalva (arrow of Figure 2-24). Simultaneously, the LFC also fell
rapidly as there was a pooling of blood in the periphery reducing the amount of light
hitting the PD (Figure 2-25). Initially there was a one beat increase in the PCC at the
onset of the Valsalva maneuver. The heart was squeezed, forcing additional blood out
with the initial beat. This is the basis for antigravity induced loss of consciousness
Valsalva training in military pilots. Holding the Valsalva for longer than a few seconds,
however, reduces cardiac output.
In the following study, the effect of hand position relative to the heart on the PPG
derived from a finger probe was explored using Valsalva maneuvers. The PCC and LFC
(Figure 2-26) were derived from the finger probe of a volunteer subject. The probe was
held at heart level for phase 1 of the study. During the phase 2 the subject had his hand
raised above heart level. Finally, in phase 3 the probe was below heart level. During
each phase, a Valsalva maneuver was performed. The PCC and LFC at heart level were
at a baseline and the effect of the Valsalva was as previously described. When the arm
was raised above the head, the PCC increased dramatically, and the LFC also increased.
The reasons for the increase in the PCC amplitude were not clear. One hypothesis is that
an intact sympathetic nervous system may cause a local increase in blood flow while the
hand is above the head. This local increase overcomes gravity and causes an increase in
flow. This could be the foundation for a future study in people with known autonomic
dysfunction. A second hypothesis relates to venous congestion creating impedance

33
surrounding the arteries. When the hand was raised above the head, the venous blood
drained from the arm increasing the LFC. This allowed for the small vessels in the hand
to expand at a larger rate as there was less impedance surrounding them. The opposite
was apparent in phase 3. With the arm below the heart, venous congestion in the arm
caused a decrease in LFC, and this local impedance also caused the drop in PCC
amplitude.
To fully understand the effect of spontaneous breathing on the PCC and LFC, a
study was conducted involving several breathing maneuvers. The PCC and LFC were
recorded from the nasal alar of a volunteer (Figures 2-27 and 2-28). Mueller and
Valsalva maneuvers were both conducted. Mueller maneuvers involve a forced
inspiration against a closed glottis. The Mueller maneuvers had little effect on the PCC
but increased the LFC. During a Mueller maneuver there is a sharp decrease in the
intrathoracic pressure associated with a strong forced inspiration. This decrease in
intrathoracic pressure draws blood into the thorax decreasing the amount of pooled
venous blood in the periphery. This reduction in peripheral venous blood resulted in
more light hitting the PD and an increase in the LFC.
Mueller and Valsalva maneuvers represent the maximum intrathoracic pressure
changes associated with spontaneous breathing. A follow-up study involved a volunteer,
monitored with an alar probe, breathing through endotracheal (ET) tubes with decreasing
diameters. These ET tubes represent increasing resistance. The PCC and LFC from a
nasal alar probe in a healthy volunteer instructed to inhale and exhale through a series of
ET tubes with decreasing diameters are shown (Figures 2-29 and 2-30). The duration
through each ET tube was approximately 1 min followed by 1 min of no resistance.

34
Breathing through resistance magnifies the effects of spontaneous breathing. During
inspiration though resistance it is necessary to create a large negative pressure. This
enhances venous return. Upon exhalation it is necessary to create a large positive
pressure, which dampens venous return. These effects increase with increasing resistance
as the intrathoracic pressure changes become more pronounced. The LFC amplitude
increased as a direct reflection of the movement of the venous blood in the periphery
(periphery is anywhere distal to the heart). Also, as the diameters of the ET tubes
decreased, and resistance increased, the PCC reflected this. This represents changes in
the cardiac output through the breathing cycle. On inspiration, cardiac output increased
due to enhanced venous return while during expiration cardiac output fell due to
decreased venous return. As the intrathoracic pressure swings increased this effect was
exaggerated.
The upstroke of the swings (Figure 2-31) corresponds to increasing light hitting the
PD. This represents decreasing pooled peripheral blood. This occurs during inspiration
as pooled blood is being forced into the thorax created by the negative pressure. The
downstroke represents decreasing light hitting the PD. This occurs when pooled
peripheral blood is increasing during forced expiration. The trough represents the point
of least light hitting the PD corresponding to the maximum pooling of blood with each
respiratory cycle. Since venous blood flow is affected by intrathoracic pressure swings,
and this affect is enhanced by adding resistance to the breathing, the PPG is the ideal way
to monitor these changes.

35
Figure 2-1. Novel pulse oximeter probes manufactured
(Rowlett, TX). A) Cheek, B) Nasal septum
80859095100Saturation (%)
SpO2 -
Figure 2-2. Variance of SpO2 from SaO2 as hypoxic cothe cheek probe.
A
B
by Beta Biomed Services .
-15-12-9-6-303691215
657075
SpO
2 Dev
iatio
n (%
)
SaO2 SaO2
nditions increased, as measured by

36
-15-12-9-6-303691215
65707580859095100Saturation (%)
SpO
2 Dev
iatio
n (%
)
SpO2 - SaO2 SaO2
Figure 2-3. Variance of SpO2 from SaO2 as hypoxic conditions increased, as measured by
the nasal septum probe.
1 3 4
2 5
Figure 2-4. The Pulse Oximetry Data Acquisition Viewer software. 1) The PCC, 2) The
30 min saturation tracing, 3) Oxygen saturation and pulse rate, 4) LED power, 5) DC gain.

37
Figure 2-5. A 30 min pulse rate tracing of an operating room pilot study subject, showing
arrhythmias.
Figure 2-6. A 30 sec PCC tracing of the PPG of an operating room pilot study subject,
showing arrhythmias.
Figure 2-7. A 30 sec PCC tracing of the PPG of an operating room pilot study subject,
showing the effect of the ventilator.

38
Figure 2-8. A 30 min oxygen saturation trend of an operating room pilot study subject,
showing how the cheek probe resumed functionality 5 min sooner than the finger probe following cardiac bypass.
Figure 2-9. A 30 sec PCC tracing of the PPG of an operating room pilot study subject,
showing the effect of a blood pressure cuff.
Figure 2-10. The unprocessed PPG data of an operating room subject with the peaks and
troughs identified discretely.
Figure 2-11. The PCC of the PPG from the cheek of an operating room pilot study
subject, showing periodic reduction in amplitude corresponding to blood flow.

39
Figure 2-12. The PCC of the PPG from the nasal septum of an operating room pilot study
subject, showing periodic reduction in amplitude corresponding to blood flow.
Figure 2-13. The PCC of the PPG from the nasal septum of an operating room pilot study
subject, showing changes in blood flow over time.
Figure 2-14. The LFC of the PPG from the nasal septum of an operating room pilot study
subject, showing changes in baseline venous blood over time.
Figure 2-15. The LFC of the PPG from the nasal septum of an operating room pilot study
subject, showing increased fluctuations over time.

40
Figure 2-16. The PCC of the PPG from the finger of an operating room pilot study
subject, showing the periodic effect of a blood pressure cuff.
Figure 2-17. The LFC of the PPG from the finger of an operating room pilot study
subject, showing the periodic effect of a blood pressure cuff.
Figure 2-18. The PCC of the PPG from the nasal septum of an operating room pilot study
subject, showing the effect of the ventilator.
Figure 2-19. The nasal alar probe design, based on the cheek probe design.

41
Figure 2-20. The PCC of the PPG from the finger of a healthy volunteer, showing the
effect of a blood pressure cuff over time.
Figure 2-21. The LFC of the PPG from the finger of a healthy volunteer, showing the
effect of a blood pressure cuff over time.
Figure 2-22. The PCC of the PPG from the finger of a healthy volunteer, showing the
effect of brachial artery occlusion.
Figure 2-23. The LFC of the PPG from the finger of a healthy volunteer, showing the
effect of brachial artery occlusion.

42
Figure 2-24. The PCC of the PPG from the finger of a healthy volunteer, showing the
effect of a Valsalva maneuver (arrow).
Figure 2-25. The LFC of the PPG from the finger of a healthy volunteer, showing the
effect of a Valsalva maneuver.
Figure 2-26. The PCC and LFC of the PPG from the finger of a healthy volunteer,
showing the effect of position of the hand with respect to the heart. A) Valsalva maneuver, B) Valsalva maneuver, C) Valsalva maneuver.
BC A
1. Heart Level 2. Above Heart 3. Below Heart

43
Figure 2-27. The PCC of the PPG from the finger of a healthy volunteer, showing the
effect of Mueller and Valsalva maneuvers.
Figure 2-28. The LFC of the PPG from the finger of a healthy volunteer, showing the
effect of Mueller and Valsalva maneuvers. A) Meuller maneuver, B)Valsalva maneuver.
A AB
B
Figure 2-29. The PCC of the PPG from the alar of a healthy volunteer, showing the effect
of breathing through various endotracheal tubes. A) 5.5 mm, B) 5.0 mm, C) 4.5 mm, D) 4.0 mm.
12:03:00 12:04:00 12:05:00 12:06:00 12:07:00 12:08:00 12:09:00 12:10:
A B C D

44
Figure 2-30. The LFC of the PPG from the alar of a healthy volunteer, showing the effect
of breathing through various endotracheal tubes. A) 5.5 mm, B) 5.0 mm, C) 4.5 mm, D) 4.0 mm.
12:03:00 12:04:00 12:05:00 12:06:00 12:07:00 12:08:00 12:09:00 12:10
CB
A
D
Figure 2-31. The LFC of the PPG from the alar of a healthy volunteer, showing the effect
of spontaneous respiration.
10 12:09:20 12:09:30 12:09:40 12:09:50 12:10:00
Inspiration Expiration
Maximum Pooled Blood

CHAPTER 3 BROAD CLINICAL GOALS
Clinical Goal 1
The first clinical goal is to use the photoplethysmograph (PPG) to detect changes in
airway resistance. Disorders that increase airway resistance include asthma, obstructive
sleep apnea (OSA), chronic bronchitis, cystic fibrosis and chronic obstructive pulmonary
disease. Other disorders, such as acute respiratory distress syndrome and pneumonia,
increase work of breathing by reducing lung compliance. These disorders necessitate
large negative and positive intrathoracic pressures to move air in and out of the lungs,
either due to increasing airway resistance or decreasing lung compliance. Large
intrathoracic pressure changes, both negative during inspiration and positive during
exhalation, affect cardiac return and cardiac output. These changes may be detectable
using the PPG. The first broad clinical goal is to show that the PPG can be used to detect
changes in airway resistance. Clinical uses include, but are not limited to, noninvasive
diagnosis of severity of asthma and detecting OSA, and estimating its severity.
Clinical Populations
Asthma
Asthma is a chronic inflammatory disease of the airways affecting 14 to 15 million
people in the United States and is the most common chronic disease of childhood. People
with asthma collectively have more than 100 million days of restricted activity and
470,000 hospitalizations annually. Each year more than 5000 people die from asthma
(NAEPP 1997).
45
46
In 1991 the National Asthma Education and Prevention Program (NAEPP)
published four recommendations for the management and treatment of asthma including
the use of objective measures of lung function to assess the severity of asthma and to
monitor the course of therapy (NAEPP 1991). The current standard of care for the
monitoring of asthma includes monitoring signs and symptoms, monitoring pulmonary
function with spirometry and peak flow measurements, monitoring quality of life and
functional status, monitoring asthma history, monitoring pharmacotherapy, and
monitoring patient-provider communication and patient satisfaction (NAEPP 1997).
Specific evaluations for asthma severity include physical examinations by a health care
provider, spirometry and patient self-assessment (NAEPP 1997).
Spirometry measures the maximal volume of air forcibly exhaled from the point
of maximal inhalation (FVC) and the volume of air exhaled during the first second of the
FVC (FEV1). The degree of airway obstruction is indicated by a reduced FEV1 and
FEV1/FVC values relative to reference values (NAEPP 1997). There is no standard for
direct measurement of airway resistance. The ability to noninvasively measure airway
resistance for the monitoring of asthma severity could have broad clinical implications.
The interrupter technique for measuring airway resistance (Rint) was first
introduced by Von Neergaard and Wirz (1927) but has only been commercially available
for the last five years (Hadjikoumi et al. 2003). It is a rapid, noninvasive, and convenient
method for measuring airway resistance. During transient interruption of airflow (100
msec) alveolar pressure equilibrates rapidly with pressure at the mouth (Von Neergaard
and Wirz 1927). The alveolar pressure is derived from the measurement of mouth
pressure immediately following occlusion. If flow is measured immediately before

47
occlusion, then airway resistance can be calculated by dividing the pressure by the flow
(Hadjikoumi et al. 2003).
The interrupter technique is primarily used for children too young for accurate
spirometry measures and is not without flaws. There is no standard way to measure
pressure change during valve closure. In patients requiring a longer time to gain
equilibrium, the end occlusion might underestimate the pressure change measured at the
mouth and therefore the calculated airway resistance (Kooi et al. 2005). It is also
important to firmly support the cheeks and mouth floor of the subject. Unsupported
cheeks lead to significantly lower Rint values. In many children, a facemask instead of a
mouthpiece could simplify the measurements but many children are not accepting of a
facemask (Kooi et al. 2005). The interrupter method is an active area of research for
noninvasive resistance measurements in children.
Determining respiratory resistance by forced oscillation (Rfo) is a noninvasive,
effort-independent technique that can be obtained at the bedside in children as young as 3
years old (Dubois et al. 1956a, Dubois et al. 1956b, Cogswell 1973, Solymar et al. 1989,
Duiverman et al. 1985). The technique was proven valid, with strong correlations
between respiratory resistance measured by Rfo and whole body plethysmography
(Fichter et al. 1989, Barleban et al. 1990, Simm 1989). It was also proven feasible in
children older than 3 years old, both stable and acutely ill (Ducharme and Davis 1997,
Cogswell 1973). It was also evaluated as a reproducible and responsive measure of
asthma severity, and appears to be an attractive alternative for evaluating children who
are too young or too sick for spirometry (Ducharme and Davis 1998).
48
Pagani et al. (2003) evaluated pulse transit time (PTT) as a measure of inspiratory
effort in children. The PTT is the time it takes the pulse wave to travel between two
arterial sites (normally heart to finger). The speed at which the pulse wave travels is
indirectly proportional to the PTT. The authors found a good correlation between the
induced inspiratory effort and the amplitude of PTT variations and concluded that PTT
should be a method for quantifying changes in inspiratory effort due to augmented upper
airway resistance in awake children.
Officer et al. (1998) compared four least squares regression algorithms for
determining pulmonary resistance and dynamic elastance in subjects with emphysema,
normal subjects, and subjects with asthma; before and after bronchoconstriction. The
four methods gave comparable results in normal and asthmatic subjects and differed
slightly in the emphysema subjects.
Identification of new noninvasive measures of airway resistance for determining
asthma severity is an active area of research. Asthma severity is dictated by airway
resistance, which is proportional to the intrathoracic pressure changes with respiration. If
the PPG derived noninvasively from a pulse oximeter can reliably measure intrathoracic
pressure changes it may also be an indicator of airway resistance and hence asthma
severity.
Obstructive sleep apnea syndromes
There are several forms of sleep-disordered breathing. One major group is the
obstructive sleep apnea syndromes; including primary snoring, upper airway resistance
syndrome (UARS) and OSA (Collop 2005). A narrowing or complete obstruction of the
upper airway is a commonality among these disorders.

49
Snoring is a respiratory noise generated from the upper airway during sleep that
may occur during inspiration or expiration. Primary snoring occurs regularly and usually
does not result in significant daytime impairment although some studies have shown
snorers may have an increased risk of cardiovascular disease (Hoffstein 1996, Hu et al.
2000). A decrease in tone of the upper airway muscles results in constriction of the
ooropharynx and results in snoring. There is no standard measure of snoring and it is
often quantified using a microphone and sound meter (Collop 2005).
In 1993 the term UARS was first used by Guilleminault et al. (1993) to describe a
group of patients with excessive daytime somnolence. Extensive monitoring utilizing an
esophageal pressure catheter revealed repetitive instances of increasingly negative
intrathoracic pressure associated with upper airway flow limitation. These events
culminated in arousal and return of intrathoracic pressure and upper airway flow to
normal. These respiratory effort measurements are important in detecting obstructed
breathing events, however esophageal catheters are invasive and not practical for
standard polysomnography (Collop 2005). A noninvasive, simpler method to accurately
measure respiratory effort by measuring intrathoracic pressure changes would make
diagnosis of UARS more practical.
Obstructive sleep apnea is a repetitive, partial or complete obstruction of the
upper airway during sleep and is the most severe of the obstructive sleep apnea
syndromes. Its prevalence is approximately 5% (Young et al. 2002) and is more common
in males. Its severity is commonly determined by the apnea-hypoxia index (AHI)
frequency. The AHI is computed by (apneas + hypopneas / total hours of sleep). The
level of severity is arbitrary as there is little data on the relationship between AHI and
50
morbidity and mortality as AHI alone fails to take into account the severity of oxygen
desaturation or the amount of sleep disruption (Collop 2005). A more accurate indicator
of OSA severity is needed.
Since intrathoracic pressure measurements correlate with the degree of upper
airway obstruction, researchers are evaluating ways to measure this pressure during sleep.
Patil et al. (2004) developed and validated a simplified approach to analyze the pressure-
flow relationship in sleeping subjects. They concluded that the analytic approach has the
potential for standardizing and simplifying the ascertainment of the critical pressure for
studies examining the effect of therapeutic devices and agents on upper airway
collapsibility during sleep.
Haba-Rubio et al. (2005) evaluated the use of the pulse wave amplitude (PWA)
derived from the PPG of a standard finger pulse oximeter for evaluating sleep
fragmentation. Several respiratory events were analyzed, including apnea, hypopnea and
upper airway resistance episodes. The PWA changes were significantly greater than
heart rate changes during these events. The authors concluded that the PWA obtained
from a simple pulse oximeter might be a valuable method to evaluate sleep fragmentation
in breathing disorders.
The gold standard for diagnosing OSA remains the attended, overnight level I
polysomnogram (Pang and Terris 2006). Unfortunately, limited resources, including
limited number of recording beds, high cost, long waiting lists, and labor requirements
prevent diagnosis in a large portion of the population. Screening questionnaires and
devices have also been developed. The ideal screening device should be cheap, readily
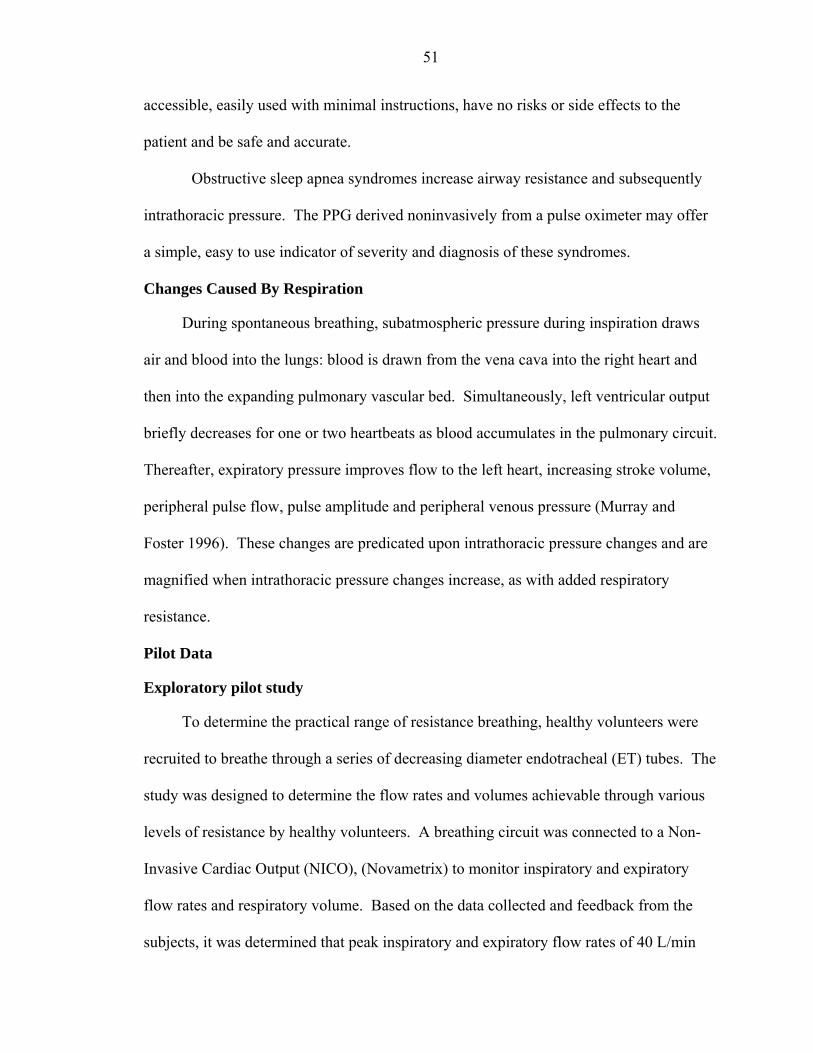
51
accessible, easily used with minimal instructions, have no risks or side effects to the
patient and be safe and accurate.
Obstructive sleep apnea syndromes increase airway resistance and subsequently
intrathoracic pressure. The PPG derived noninvasively from a pulse oximeter may offer
a simple, easy to use indicator of severity and diagnosis of these syndromes.
Changes Caused By Respiration
During spontaneous breathing, subatmospheric pressure during inspiration draws
air and blood into the lungs: blood is drawn from the vena cava into the right heart and
then into the expanding pulmonary vascular bed. Simultaneously, left ventricular output
briefly decreases for one or two heartbeats as blood accumulates in the pulmonary circuit.
Thereafter, expiratory pressure improves flow to the left heart, increasing stroke volume,
peripheral pulse flow, pulse amplitude and peripheral venous pressure (Murray and
Foster 1996). These changes are predicated upon intrathoracic pressure changes and are
magnified when intrathoracic pressure changes increase, as with added respiratory
resistance.
Pilot Data
Exploratory pilot study
To determine the practical range of resistance breathing, healthy volunteers were
recruited to breathe through a series of decreasing diameter endotracheal (ET) tubes. The
study was designed to determine the flow rates and volumes achievable through various
levels of resistance by healthy volunteers. A breathing circuit was connected to a Non-
Invasive Cardiac Output (NICO), (Novametrix) to monitor inspiratory and expiratory
flow rates and respiratory volume. Based on the data collected and feedback from the
subjects, it was determined that peak inspiratory and expiratory flow rates of 40 L/min

52
with a total breath volume of 1.5 L was ideal through a broad range of resistance levels.
The smallest diameter ET tube used was 3.5 mm, creating the largest resistance. Through
this ET tube, flow rates of greater than 40 L/min were not attainable with healthy
volunteers. The largest diameter ET tube used was 7.5 mm, creating the lowest level of
resistance. Through this ET tube a flow rate of 40L/min was reported as of similar
difficulty to breathing through no resistance, thus minimally affecting intrathoracic
pressure. Increasing the flow rate through the 7.5mm ET tube would increase the
intrathoracic pressure changes, however the flow rate should remain constant and rates
higher than 40L/min were not attainable through the highest resistance.
Ventilator and volunteer resistance study
To estimate the intrathoracic pressure changes associated with breathing through a
variety of resistors at constant flow rates and volumes, the following two-part experiment
was conducted. In the first part of the study, a Puritan Bennett 7200 Series Ventilatory
System was used to simulate breathing and a Michigan Instruments Inc. Model 1600
Dual Adult Training Test Lung was used to simulate the lungs (Katz, et al. 1988, Banner
et al. 1993). Endotracheal tubes of length 7-11 cm with diameters 3.5 mm, 4.0 mm, 4.5
mm, 5.0 mm, 5.5 mm, 6.0 mm, 6.5 mm, 7.0 mm and 7.5 mm were connected to the
breathing circuit and tested. Respiratory flow rates and volumes were measured using a
NICO and collected using proprietary software developed by Convergent Engineering.
Pressure was measured at the lung inlet, simulating intrapleural pressure and collected
using the same software.
First, the 3.5 mm diameter ET tube was inserted into the breathing circuit. The
ventilator was set to achieve a peak inspiratory flow rate of 40 L/min to a volume of 1.5
L. The test lung exhales passively with a force determined by a user set compliance level

53
and is unable to simulate forced exhalation. The compliance was set to .10 L/cmH2O to
simulate a healthy volunteer. This compliance was not enough to force the exhalation
through the resistor at 40 L/min. To maintain normal compliance while simulating forced
exhalation a brass weight was placed on the lung platform during exhalation only. The
weight was placed in a position appropriate to force the exhalation at a flow rate of 40
L/min. Once the ventilator settings were appropriate and the position of the weight was
determined the experiment began. Ten mechanical breaths were recorded at a volume of
1.5 L through the 3.5 mm diameter ET tube at peak inspiratory and expiratory flow rates
of 40 L/min. Peak minimum pressure during inspiration was approximately -50 cmH2O
and peak positive pressure on expiration was approximately 40 cmH2O.
This experiment was repeated with each ET tube between 3.5 mm and 7.5 mm.
The ventilator settings and position of the brass weight were modified to maintain the 40
L/min flow rate and 1.5 L volume per breath. Through the 5.0 mm ET tube, the brass
weight was no longer necessary to achieve the expiratory flow rate of 40 L/min,
indicating that the normal elastic recoil of the simulated healthy lung was sufficient. As
the tube diameter exceeded 5.0 mm the expiratory flow rates began exceeding 40 L/min.
It was not possible to simulate a deliberate decrease in expiratory force and the machine
was simply allowed to recoil passively. Flow rates up to 80 L/min were recorded through
the largest ET tubes but the affect on positive pressure was negligible.
The average simulated intrapleural pressure change per breath, created by the nine
ET tubes are shown (Figure 3-1). Ten breaths were recorded for each level of resistance.
Y-Error bars in the graph represent + standard error of measure (SEM) and are barely
visible due to the consistency of the ventilator and lack of variability between breaths.

54
Next, informed consent was obtained on two healthy volunteers for an institutional
review board approved study. Subject one was a 47 year-old male in good health.
Subject two was a 38 year-old male in good health. Each subject swallowed an
esophageal balloon; used to measure esophageal pressure, an estimate of intrathoracic
pressure. Placement of the balloon in the esophagus was verified using occlusion tests.
Subjects were coached to breathe at inspiratory and expiratory flow rates of 40 L/min at a
volume of 1.5 L through the same ET tubes discussed previously. Once proficient, ten
breaths were recorded through the 3.5mm ET tube at flow rates of 40 L/min at a volume
of 1.5 L. These data, along with the esophageal pressure, were collected. The study was
repeated for each ET tube between 3.5 mm and 7.5 mm.
The average esophageal pressure changes per breath created by the nine levels of
resistance is shown (Figure 3-2). Ten breaths were collected for each resistance level.
Y-Error bars represent + SEM. The intrathoracic pressure changes per breath for each of
the nine ET tubes—both simulated using the ventilator and test lung apparatus, and
measured from the two volunteers—are shown (Figure 3-3). Intrathoracic pressure is
estimated as intrapleural pressure from the test lung and as esophageal pressure from the
two volunteers.
Mathematically characterizing the resistance
The resistance created by a tube of known radius and length can be calculated using
Poiseuille’s Law, R = 8ηL/πr4 (Equation 3-1). Where η is the viscosity of the fluid
moving through the tube, L is the length of the tube and r is the inner radius of the tube.
Based on this formula, the estimated pressure drop across each ET tube was estimated
(Table 3-1). Poiseuille’s Law assumes laminar flow. Since the calculated pressure drop
is significantly different from the measured pressure drop (Figure 3-3) it was necessary to

55
determine if the flow was laminar. For this, the Reynold’s number calculation, based on
R = ρvd/ η (Equation 3-2) was used. Where R is Reynold’s number (unitless), ρ is the
fluid density, v is the fluid velocity, d is the tube diameter and η is the fluid viscosity.
This calculation resulted in a Reynold’s number of 17429. If Reynold’s number is >
2000 flow is considered turbulent and Poiseuille’s law does not apply.
Guttmann et al. (2000) experimentally determined the flow-pressure relationship
through various ET tubes. They derived P = K1F + K2F2 (Equation 3-3) where P equals
the pressure drop across the tube, K1 and K2 are experimentally derived constants, and F
is flow. The expected pressure changes caused by inspiring and expiring through various
ET tubes in cmH2O at a flow rate of 40 L/min are shown (Table 3-2). These values were
consistent with previous results.
Resistance created by ET tubes of varying diameters has been characterized and the
intrathoracic pressure changes they cause have been estimated using a ventilator and
validated using a healthy volunteer. The agreement with Equation 3-3 validates the
pressure change results. Equation 3-3 will be used to estimate intrathoracic pressure
changes in subsequent analyses.
Clinical Goal 2
Clinical goal 2 is to use the PPG to detect fluid loss. The current gold standard for
monitoring volume status in critically ill patients is measuring pulmonary artery
occlusion pressure, or in its absence, central venous pressure through an invasive
catheter. Nonspecific measures include heart rate, blood pressure and urine production.
To explore the feasibility of using the PPG to detect changes in fluid volume, two patient
populations who lose a measurable amount of fluid were explored. Blood donors lose a
measurable amount of whole blood while hemodialysis (HD) subjects lose a measurable

56
amount of ultrafiltrate, while retaining red blood cells. Studying blood donors and HD
patients may provide an important first step in determining the feasibility of the PPG for
estimating fluid loss.
Rationale
Many studies have explored the value of the difference between systolic pressure at
end-expiration and the lowest value during the respiratory cycle (dDown) as an indicator
of hypovolemia. This requires an invasive catheter to continuously monitor arterial blood
pressure. Very few studies, however, have investigated the use of the PPG as an
indicator of volume status even though it is noninvasive and used routinely.
Partridge (1987) sought to prove a relationship between changes in the PPG and
the dDown of arterial pressure. Monitoring the plethysmographic waveform of the pulse
oximeter should indicate instantaneous blood volume changes in the tissue between the
light emitter and sensor. Twelve patients were studied and a relationship was found
between the PPG and systolic blood pressure variations (SPV). It was concluded that the
PPG could be used to detect hypovolemia based on the established relationship between
SPV and volume status. While this study is a good foundation, several limitations were
present. First, only a finger pulse oximeter probe was used. Second, data was not
collected continuously. Instead, once per hour, three seconds of data was sampled and
printed. Pulse waveform variation was defined as the maximum variation in the
waveform peaks during positive pressure ventilation as measured on the printout. The
printouts reflected a PPG after processing by the Nelcor unit.
Shamir et al. (1999) removed then reinfused 10% blood volume in 12 patients
while monitoring the PPG. It was concluded that the PPG is a good indicator of mild
hypovolemia. The first major limitation of this study was the use of a finger probe only.

57
Secondly, a paper printout of a processed waveform was used and was only obtained for
five consecutive mechanical breaths, one time following blood removal. While these
studies were able to show a relationship between the PPG and volume status, the state of
technology greatly limited their ability to collect data and monitor alternate sites.
Blood Donors
Blood donors must be healthy, at least 17 years old, weigh at least 110 pounds and
not have donated blood in the past 56 days. “Healthy” means feeling well and able to
perform daily activities. If chronic conditions such as diabetes or hypertension exist,
healthy also means that these conditions are being treated and are under control.
According to the American Red Cross, each of the following will disqualify
donors for varying lengths of time: acupuncture treatment where the sterility of the
needles can not be verified, body temperatures greater than 99◦, autoimmune diseases,
certain cancers such as leukemia and lymphoma, clotting disorders, Creutzfeldt-Jakob
disease, hemochromatosis, hemoglobin below 12.5 g/dL, hematocrit below 38%, hepatitis
caused by a virus, HIV/AIDS, active infections, malaria or recent travel to an area
prevalent in malaria, pregnancy, syphilis, gonorrhea, sickle cell disease, and recent
tattoos. In general, medications do not disqualify donors.
Before donation, blood pressure, pulse rate and temperature are taken. During the
donation approximately 500 ccs of blood is removed over a 10 min period. Most people
experience no effects though some get an upset stomach, feel faint or dizzy and can have
a local hematoma at the puncture site. It is rare for a person to faint, suffer nerve damage
or have muscle spasms.
During volunteer blood donation a fixed amount of blood is lost in a measurable
amount of time. This represents an ideal opportunity to study the effects of blood loss.

58
Total pre-donation blood volume can be estimated using Allen’s formula (Allen et al.
1956), BVmen = 0.417 * H3 + 0.0450 * W - 0.030 (Equation 3-4) and
BVwomen = 0.414 * H3 + 0.0328 * W - .030 (Equation 3-5). Where H is the height in
meters and W is the weight in kilograms.
Renal Hemodialysis
End stage renal disease (ESRD) can only be treated with renal transplant or renal
HD. Hemodialysis is an important life sustaining treatment for ESRD. A patient on HD
will spend approximately 4 h undergoing treatment, three days per week.
Before treatment, the accumulated volume load is mainly located in the interstitial
space and must be removed. Plasma water removal by ultrafiltration (UF) increases
oncotic pressure in the blood and decreases hydrostatic pressure in the venous system.
This enhances the vessel refilling from the interstitial space. The refilling rate depends
on several factors (Basile 2001) including individual state of hydration, vessel
permeability, and protein balance. Refilling usually proceeds slower than UF and only
partially compensates for fluid loss. As a result, intravascular water content
progressively decreases (Donauer and Bohler 2003). In addition to the refilling of
vessels, several other factors contribute to intradialytic intravascular volume changes
including autonomic function (Kersh et al. 1974, Lilley et al. 1976, Daul et al. 1987,
Converse et al. 1992, Esforzado et al. 1997, Stojceva-Taneva et al. 1991), impaired
venous compliance (Rouby et al. 1978, Kooman et al. 1992) and heat accumulation
during the treatment (Maggiore et al. 1981, Jost et al. 1993, Van der Sande et al. 2001).
Since the main goal of HD therapy is to remove the excess fluid that has
accumulated during the interdialytic period, intradialytic hypotension (IDH) remains one
of the most common, and serious complications of HD (Daugirdas 2001). The initial

59
cause of IDH is intravascular hypovolemia (Leunissen et al. 2000). Considering the
number of elderly, cardiovascular-compromised patients on HD is increasing, it is likely
that IDH will remain a serious concern. The etiology and management of IDH has
become an increasingly complex issue (Sherman 2002). Patients vary markedly in their
hemodynamic tolerance to fluid removal indicating that IDH has many underlying
causes. If patients fail to support blood pressure with adequate vasoconstriction and
increased heart rate as a response to hypovolemia they will experience IDH.
The venous system maintains cardiac output and blood pressure during HD since
most of the blood volume is contained in the venous system. With hypovolemia,
arteriolar resistance increases, which increases systemic blood pressure; not only by
increasing total peripheral resistance, but also by decreasing pressure in the highly
compliant venous bed. This decrease in pressure favors passive venous recoil, resulting
in translocation of blood to the central vessels and maintains cardiac filling. The
effectiveness of this mechanism may vary greatly in HD patients (Sherman 2002). In
addition, venous constriction promotes cardiac return and increases blood pressure.
The first prerequisite of a hemodynamically stable HD treatment is the correct
definition of dry weight. Dry weight is the body weight during normal urine production.
During HD the weight should be brought down to the correct dry weight. If a large
amount of fluid is withdrawn after the patient has reached the dry weight, no physiologic
mechanism or technical device will prevent hypotension (Donauer and Bohler 2003).
Unfortunately, dry weight estimation is one of the most difficult tasks in the management
of HD patients and results in frequent reevaluations throughout the year. Even with
correct dry weight assumptions, IDH continues to occur.

60
To reduce the incidence of IDH, relative blood volume (RBV) measurements
have been developed. These measurements are based on the optical reflection method
(Leunissen et al . 2000) and monitor changes in hematocrit or total protein content in
whole blood via ultrasonically measured blood velocity (Koomans et al. 1984). The
rationale is that the red cell mass (or protein content) should remain constant while
untrafiltration removes fluid from the intravascular space, making the change in blood
volume inversely proportional to the change in hematocrit (or plasma proteins). This
technique was shown to correlate well with those determined by albumin concentration
(Leypoldt et al. 1995). Data supports the use of blood volume monitoring in chronic HD
patients as a tool both in preventing IHD and in identifying patients with volume
overload (Mitra et al. 2002, Tonelli et al. 2002, Krepel et al. 2000) showed that changes
in the RBV showed considerable intra and inter-individual variability that could not be
explained by differences in UF volume. They concluded that the RBV is not necessarily
a good indicator of IDH.
Other tools are available for the assessment of volume status including
biochemical markers, inferior vena cava diameter and bioimpedence (Ishibe and Peixoto
2004). Even if a perfect measure of RBV did exist, studies have shown that
measurements of stroke volume, cardiac output and total peripheral resistance are also
very important indicators of IDH. Wallin et al. (2003) showed that immediately after
HD, central blood volume was reduced in parallel with reductions in plasma volume,
stroke volume, cardiac output, systolic blood pressure and serum artial natiuretic peptide
(ANP). Two hours after HD, central blood volume had recovered while plasma volume,
stroke volume, systolic blood pressure and serum ANP remained low. Boon et al. (2004)

61
determined that during HD, patients responding to a blood volume reduction with a blood
pressure decrease differ in their stroke volumes from patients with a stable blood
pressure. Hence, changes in blood volume alone do not predict blood pressure response
to HD.
In summary, the most optimum system would be to develop an algorithm on the
basis of all of the above mentioned factors that could be manipulated to regulate the
target blood volume in concert with the vascular reactivity target to control blood
pressure. Such an integrated system is the technical answer to the problem of IDH in the
cardiac compromised patients (Leunissen 2000). While a broad clinical goal is to use the
PPG for volume loss estimation in critically ill subjects, HD subjects may also benefit
from a device able to detect IDH. The PPG was shown to correlate with blood volume
status, can be used to determine vascular wall mechanics and is related to stroke volume
yet no research has been done to correlate PPG with fluid loss in renal HD patients.
Table 3-1. Estimated pressure drop across the ET tubes based on Poiseuille’s Law.
mm length (m) Resistance (kg/m4s) Pressure Drop (Pa) Pressure Drop (cmH2O) 3.5 0.102 496540 333 3.39 4.0 0.102 291063 195 1.98 4.5 0.111 198744 133 1.35 5.0 0.073 85689 57 0.58 5.5 0.076 61071 41 0.41 6.0 0.073 41324 28 0.28 6.5 0.076 31307 21 0.21 7.0 0.076 23275 16 0.15 7.5 0.083 19134 13 0.13
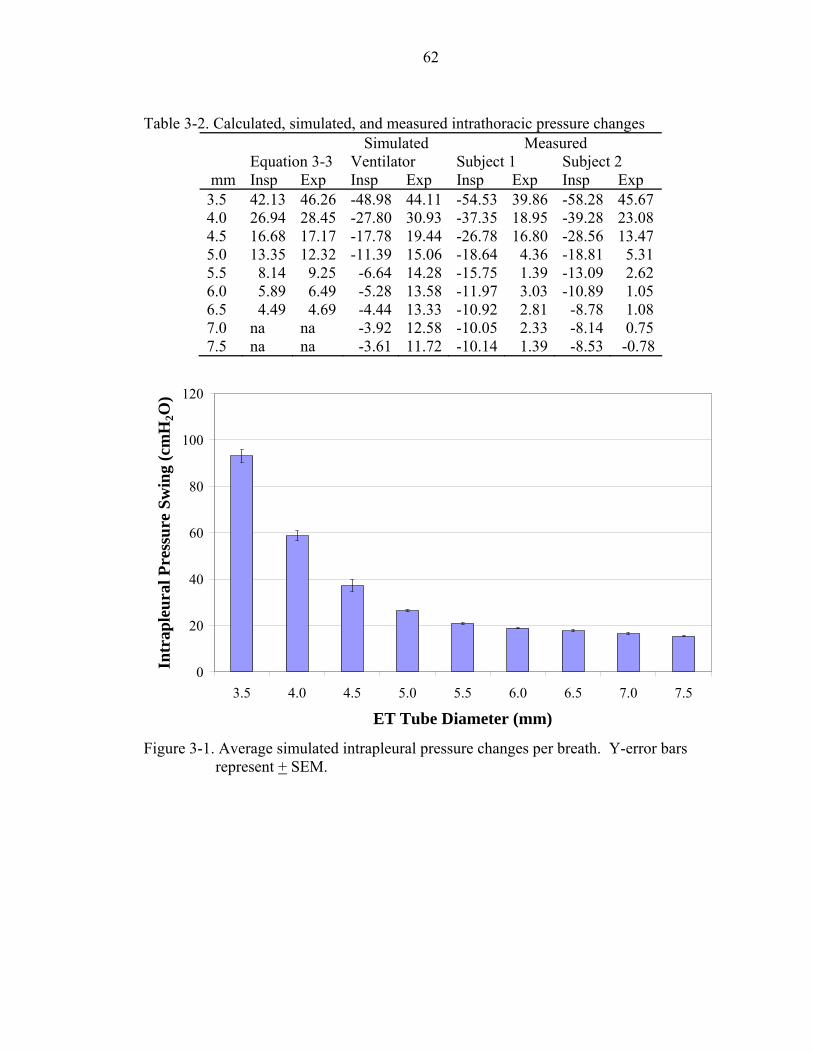
62
Table 3-2. Calculated, simulated, and measured intrathoracic pressure changes
Simulated Measured Equation 3-3 Ventilator Subject 1 Subject 2 mm Insp Exp Insp Exp Insp Exp Insp Exp 3.5 42.13 46.26 -48.98 44.11 -54.53 39.86 -58.28 45.67 4.0 26.94 28.45 -27.80 30.93 -37.35 18.95 -39.28 23.08 4.5 16.68 17.17 -17.78 19.44 -26.78 16.80 -28.56 13.47 5.0 13.35 12.32 -11.39 15.06 -18.64 4.36 -18.81 5.31 5.5 8.14 9.25 -6.64 14.28 -15.75 1.39 -13.09 2.62 6.0 5.89 6.49 -5.28 13.58 -11.97 3.03 -10.89 1.05 6.5 4.49 4.69 -4.44 13.33 -10.92 2.81 -8.78 1.08 7.0 na na -3.92 12.58 -10.05 2.33 -8.14 0.75 7.5 na na -3.61 11.72 -10.14 1.39 -8.53 -0.78
0
20
40
60
80
100
120
3.5 4.0 4.5 5.0 5.5 6.0 6.5 7.0 7.5
ET Tube Diameter (mm)
Intr
aple
ural
Pre
ssur
e Sw
ing
(cm
H2O
)
Figure 3-1. Average simulated intrapleural pressure changes per breath. Y-error bars
represent + SEM.

63
0
20
40
60
80
100
120
140
3.5 4.0 4.5 5.0 5.5 6.0 6.5 7.0 7.5ET Tube Diameter (mm)
Eso
phag
eal P
ress
ure
(cm
H2O
)Subject 1 Subject 2
Figure 3-2. Measured esophageal pressure changes per breath in healthy volunteers. Y-
error bars represent + SEM.
0
20
40
60
80
100
120
140
3.5 4.0 4.5 5.0 5.5 6.0 6.5 7.0 7.5ET Tube Diameter (mm)
Pres
sure
(cm
H2O
)
Subject 1 Subject 2 Ventilator
Figure 3-3. Intrathoracic pressure changes per breath, simulated and measured. Y-error
bars represent + SEM.

CHAPTER 4 EXPERIMENTAL DESIGN AND METHODS
Methods
The low frequency component (LFC) is an indicator of venous blood volume and
varies with respiration. The LFC is impacted by a loss in blood volume hence the
variable “LFC Swings”, defined below, is an outcome variable. Additionally, stroke
volume is affected by a loss of blood volume and the pulsatile cardiac component (PCC)
is an indicator of stroke volume (Murray and Foster 1996), hence the “PCC MagDiff”
and “PCC MagMean”, as described below, are the second and third outcome variables.
All variables were measured on a breath-by-breath basis. Each breath was
defined by the respiratory flow data, as defined below. Multiple breaths through the
same level of resistance reflect repeated measures, and were averaged for comparison
purposes.
The first broad clinical goal is to use the photoplethysmograph (PPG) to
noninvasively detect changes in airway resistance. To demonstrate this, three levels of
resistance were chosen. It was previously described (Chapter 3) that volunteers could
breathe to a volume of 1.5 L at a flow rate of 40 L/sec through endotracheal (ET) tubes as
small as 3.5 mm in diameter. The mean intrathoracic pressure changes per breath—as
estimated by esophageal pressure—created by different ET tubes, were presented (Table
3-2).
The 3.5 mm, 4.0 mm and 5.5 mm ET tubes were selected based upon their affect
on intrathoracic pressure. When subjects breathed at a flow rate of 40 L/min to 1.5 L
64

65
through these three ET tubes, the intrathoracic pressure changes per breath were
approximately 100 cmH2O, 60 cmH2O and 20 cmH2O, respectively. From this point on,
the 3.5 mm ET tube is referred to as “high resistance”, the 4.0 mm ET tube is referred to
as “medium resistance” and the 5.5 mm ET tube is referred to as “low resistance”.
The second clinical goal is to use the PPG to noninvasively detect fluid loss. As
previously described (Chapter 3), it was determined that blood donors and hemodialysis
(HD) patients represent ideal patient populations to test this clinical goal.
Blood Donors
Twenty blood donors were recruited on the day of donation and informed consents
obtained. Inclusion and exclusion criteria were identical to that for blood donation.
Before donation, subjects reported height, weight, age and sex. Seated blood pressure
was measured.
Two pulse oximeter probes were placed on the subject before donation. One was
placed on the opposite finger of the donation arm and one placed on the nasal alar. These
probes were connected to Novametrix Oxypleth 520A pulse oximeters and data was
collected continuously and ported through the pulse oximetry data acquisistion viewer
(PODAV) software to a laptop computer. Subjects were provided a mouthpiece for
breathing, connected to a CO2SMO (Novametrix). The CO2SMO measures air flow and
volume during respirations. These measurements were made by flow sensors creating a
pressure drop, which is transmitted to a differential pressure transducer calibrated to
relate this pressure drop to flow.
Before donation, subjects performed the breathing study outlined below. The
parameters of the breathing study were selected based upon the results of the pilot data
previously described (Chapter 3). The high, medium and low resistance ET tubes were

66
used to create resistance. The order that the subjects breathed through the resistors was
randomized. Subjects breathed at peak inspiratory and expiratory flow rates of 40 L/min
to a volume of 1.5 L per breath. The pulse oximetry data acquisition viewer (PODAV)
software includes a real-time graph of both volume and flow and was used as feedback to
train the subjects to breathe consistently. The breathing study was performed in the
following phases:
• Phase 1: Breathing through ET tube 1 for approximately 10 breaths.
• Phase 2: Baseline breathing with no resistance for approximately 30 sec.
• Phase 3: Breathing through ET tube 2 for approximately 10 breaths.
• Phase 4: Baseline breathing with no resistance for approximately 30 sec.
• Phase 5: Breathing through ET tube 3 for approximately 10 breaths.
During the breathing study, the saturation, pulse rate, and PPG were recorded
continuously from the two pulse oximeter probes. The respiratory flow rates and
volumes were recorded using the CO2SMO. The subjects were coached to breathe at 40
L/min to a volume of 1.5 L.
Upon completion of the breathing study, the mouthpiece was removed and the
blood donation began. The two pulse oximeter probes were left in place during donation,
and pulse rate, saturation and PPG were monitored. The respiratory flows and volumes
were not collected during blood donation as this required the mouthpiece, and was not
practical during blood donation. When the donation was complete, the breathing study
was repeated. The order was again randomized. When the second breathing study was
completed, the pulse oximeter probes were removed and data collection ceased. Seated

67
blood pressure was once again measured. Orthostatic blood pressure was also measured
in several subjects. Subjects were paid for participation in the study.
Hemodialysis Patients
Twenty subjects undergoing renal HD were recruited and informed consents
obtained. There were no specific inclusion or exclusion criteria, other than the HD
physician recommending subjects based upon their state of health and physical ability.
Before HD, subjects reported height, weight, age, and sex. Seated blood pressure was
measured. The past medical history was obtained for each subject.
Two pulse oximeter probes were placed on the subject before HD. One was
placed on a finger and the other was placed on the nasal alar. These probes were
connected to Novametrix Oxypleth 520A pulse oximeters and data was collected
continuously and ported through PODAV to a laptop computer. Collected data included
oxygen saturation, pulse rate, PPG, and respiratory flow and volume. Patients were
provided a mouthpiece for breathing, connected to a CO2SMO.
Before HD, subjects performed the breathing study outlined below. The
parameters of the breathing study were selected based upon the results of the pilot data
previously described (Chapter 3). The high, medium and low resistance ET tubes were
used to create resistance. The order that the subjects breathed through the resistors was
randomized. Subjects breathed at peak inspiratory and expiratory flow rates of 40 L/min
to a volume of 1.5 L per breath. The study was performed in the following phases:
• Phase 1: Breathing through ET tube 1 for at least 10 breaths.
• Phase 2: Baseline breathing with no resistance for approximately 30 sec.
• Phase 3: Breathing through ET tube 2 for at least 10 breaths.

68
• Phase 4: Baseline breathing with no resistance for approximately 30 sec.
• Phase 5: Breathing through ET tube 3 for at least 10 breaths.
Upon completion of the breathing study, the mouthpiece was removed. The two
pulse oximeter probes were left in place during HD, and pulse rate, saturation and PPG
were continuously monitored. The respiratory flows and volumes were not collected
during HD as this required the mouthpiece and was not practical during HD.
Upon completion of HD, the breathing study was repeated. The order of the
resistance levels was randomized. Total volume of ultrafiltrate removed was recorded.
Blood pressure was measured at the conclusion of HD and orthostatic blood pressure was
measured in several of the patients. The pulse oximeter probes were then removed and
the study was completed. Subjects were paid for participation in the study.
The HD subjects performed two breathing studies, the first representing before
HD and the second representing after HD. In some cases the first breathing study
occurred just after the start of HD and in some cases the after HD breathing study
occurred just before the end of HD. Additionally, HD time varies between subjects as
there were under 3 h between the breathing studies in some subjects and over 4 h in other
subjects.
Photoplethysmograph Processing and Novel Variables
Signal Processing Algorithm
The unprocessed PPG for the duration of each breathing study was isolated for each
patient. The beginning and end of each breathing study was determined by the flow data
measured by the CO2SMO. For each breathing study, each level of resistance was
separated from the unprocessed data. For each blood donor and HD patient, there were
six unprocessed data sets—three resistance levels for each of two breathing studies.

69
A spectral analysis was then applied to each individual data set to identify the
frequencies present (Figure 4-1). The original data was sampled at 100 hz, providing two
frequency peaks. The first peak occurred at approximately .2 Hz, or 12 beats per minute.
This corresponds to the respiratory rate. The second peak, located at approximately 1.5
Hz, or 90 beats per minute, corresponds to the heart rate.
The spectral analysis is estimated using Welch's averaged periodogram method.
Welch’s method splits a data set into smaller data sets and calculates the modified
periodogram of each set. The modified periodogram is calculated by applying a window
function to the time-domain data, computing the discrete Fourier transform, and then
computing the magnitude square of the result. The frequency domain coefficients arising
from calculating the modified periodograms are averaged over the frequency components
of each data set to reduce the variance. Due to the windowing, the Welch method
provides a smoothed periodogram estimate (Welch 1967).
To separate the two frequencies, a cutoff frequency was selected based on the
spectral analysis of the data set. A standard Butterworth filter was then applied to the
unprocessed data using a cutoff frequency of .8 Hz and a filter kernel (M) of 5. The filter
kernel represents roll off and is inversely proportional to the width of the transition band.
A larger M results in a more accurate signal separation and is necessary when the
frequencies are very close together in the spectrum. A large M also requires a longer
compute time. The Butterworth filter was used as both a high-pass and low-pass filter.
Low-pass and high-pass filters are presented (Figures 4-2 and 4-3). The stopband
frequencies are blocked while the passband frequencies pass. An ideal filter has a

70
perfectly vertical transition zone (very large M). The width of the transition zone and
magnitude of M are dictated by the frequencies of interest.
The signal separation is shown (Figures 4-4 to 4-6). The two frequencies in the
unprocessed PPG signal are apparent (Figure 4-4). The low-pass filter removed all
frequencies greater than the cutoff frequency resulting in the LFC (Figure 4-5). The
high-pass filter removed all frequencies lower than the cutoff frequency resulting in the
PCC (Figure 4-6). While the cutoff frequency for each data set for each patient may have
differed slightly, an M of 5 was used for all subjects.
Separating Breath Data
Once the LFC and PCC for each level of resistance for each of the two breathing
studies were separated, each individual breath was defined. The breaths were defined
using the flow data (Figure 4-7). The upward slope corresponds to inspiration—with the
peak representing peak inspiratory flow—while the downward slope represents
exhalation—with the trough representing peak expiratory flow. The breaths were defined
as the period of time from the peak of the inspiratory flow to the following peak.
The respiratory flow data, with peaks identified, was plotted with the LCF (Figure
4-8). The flow curve immediately before the third indicated peak briefly goes flat. The
CO2SMO automatically purges the pressure sensor line every 2, 5, or 10 min depending
on system conditions. The timing of the second breath was affected. This had a very
minor affect on the calculations presented below.
The first outcome variable is the LFC Swing. It is defined as the maximum LFC
value minus the minimum LFC value during the duration of one breath. Breath one
corresponds to the maximum LFC value minus the minimum LFC value between
respiratory flow peaks one and two. This analysis was performed for all breaths, for each

71
level of resistance, for both breathing studies, for the alar, and finger PPG, for each of the
subjects.
The second and third outcome variables were based on the PCC of the PPG. They
are the “PCC MagDiff” and “PCC MagMean.” The PCC for each individual breath was
plotted (Figure 4-9). Approximately eight heartbeats occurred during the duration of this
breath. The PCC for one of these breaths was plotted (4-10). First, the amplitude of each
heartbeat was calculated. The amplitude of heartbeat one corresponds to the value at
peak one minus the value at trough one. Heartbeat two is the value at peak two minus the
value at trough two. This was repeated for each heartbeat during each breath. Once the
PCC amplitude for each heartbeat was calculated, the outcome variables were computed.
The PCC MagDiff is the difference between the largest amplitude minus the smallest
amplitude for the each breath. This represents the stroke volume fluctuation during the
respiratory cycle. The PCC MagDiff was computed for each breath, for only the low
level of resistance, for each breathing study, for the alar and finger, for each subject. The
PCC MagMean is the average of all heartbeat amplitudes in a breath adjusted for heart
rate. The adjustment is the number of heartbeats (represented by the number of peaks)
divided by the duration of time for that breath. This factor is then multiplied to the mean
of the amplitudes. The PCC MagMean represents the average cardiac output (CO) per
breath. This variable is calculated for each breath, for only the low level of resistance,
for each breathing study, for the alar and finger, for each subject.
As the airway resistance increased, large intrathoracic pressure changes were
needed to drive flow through the small ET tube. The large intrathoracic pressure changes
created very large baseline low frequency swings in the PPG—the basis for the LFC
72
measurement described above. These large baseline changes can be several orders of
magnitude larger than the PCC and distort the PCC frequency (Figure 4-11). For this
reason, the PCC variables were only computed for the low level of resistance.
In summary, there were three outcome variables measured from the PPG. The LFC
Swing was measured for each breath, for each of the three levels of resistance. The LFC
Swing represents the shifting of venous blood with respiration. The second outcome
variable was the PCC MagDiff, which represents stroke volume variability per
respiration. It was measured for each breath, but only for the low level of resistance. The
final outcome variable is the PCC MagMean, which represents the average CO per
respiratory cycle. It was measured for each breath, but also only for the low level of
resistance.
Hypotheses
Hypotheses – Clinical Goal 1
• Hypothesis 1: The LFC Swings for the high level of resistance will be greater than the LFC Swings for the medium and low levels of resistance, and the LFC Swings for the medium will be greater than the low level of resistance, independent of fluid state, and PPG monitoring site.
• Hypothesis 2: The LFC Swings will correlate with intrathoracic pressure
change per breath as estimated by Equation 3-3 (Guttmann 2000), independent of fluid state, and PPG monitoring site.
Hypotheses – Clinical Goal 2
• Hypothesis 3: The LFC Swings for breathing study one (before fluid loss) will be less than the LFC swings for breathing study two (after fluid loss), for each level of resistance, independent of monitoring site.
• Hypothesis 4: The PCC MagDiff for breathing study one (before fluid
loss) will be greater than the PCC MagDiff for breathing study two (after fluid loss), independent of monitoring site.

73
• Hypothesis 5: The PCC MagMean for breathing study one (before fluid loss) will be greater than the PCC MagMean for breathing study two (after fluid loss), independent of monitoring site.
Justification
Justification for Hypotheses 1 and 2
An unprocessed PPG contains two main frequencies, and both are affected by
absorption of the light by blood and other tissues. The LFC represents the baseline
amount of light hitting the photodiode (PD). This value is affected by the path traveled
by the light. Skin, bone, cartilage, adipose, and blood absorb light and it is this relatively
constant path that results in a baseline amount of light hitting the PD. This baseline
amount fluctuates at a frequency that corresponds to changes in venous blood caused by
ventilation—both mechanical and spontaneous. Since the biological tissues in the path of
the light are constant, with the exception of venous and arterial blood, the changes in the
LFC component correspond to changes in the venous blood volume in the path of the
light.
During spontaneous breathing, subatmospheric pressure draws air and blood into
the lungs: blood is drawn from the vena cava into the right heart and then into the
expanding pulmonary vascular bed. Simultaneously, left ventricular output briefly
decreases for one or two heartbeats as blood accumulates in the pulmonary circuit.
Thereafter, expiratory pressure improves flow to the left heart, increasing stroke volume,
peripheral pulse flow, pulse amplitude and peripheral venous pressure (Murray and
Foster 1996). These changes are predicated upon intrathoracic pressure changes, and are
magnified when intrathoracic pressure changes increase, as with added respiratory
resistance.

74
Nilsson et al. (2003) looked at the physiologic basis for the changes in the LFC,
which they termed respiratory induced intensity variations (RIIV). They hypothesized
that the filling of peripheral veins is a major mechanism behind the RIIV signal. In the
study, 16 adult volunteers had a cannula inserted for the measurement of peripheral
venous pressure (PVP). The PVP and RIIV amplitudes changed significantly with tidal
volume and respiratory rate, and with thoraco-abdominal separation. These signals were
significantly greater in predominantly thoracic respiration than in natural respiration.
They concluded that a correlation exists in the amplitudes of the respiratory induced
intensity variations in the PPG and the respiratory variations in peripheral venous
pressure.
Frey and Butt (1998) concluded that pulse oximetry is a rapid, noninvasive method
for the objective estimation of the degree of pulsus paradoxus. Pulsus paradoxus is
increased in asthma, upper airway obstruction, cardiac tamponade, myocardial
decompensation and hypovolemia (Miro and Pinsky 1992, Heitmiller and Wetzel 1996,
Pfenninger 1985, Morgan et al. 1969). They defined the respiratory dependent changes
of the PPG as the difference between the highest value of the upper peak of the wave and
the lowest value in the upper peak of the wave.
It is well documented that the LFC of the PPG corresponds to respiratory rate and
is caused by fluctuations in intrathoracic pressure. It should follow that as respiratory
resistance increases, the change in the LFC per breath (LFC Swing) should also increase.
These changes should correlate with intrathoracic pressure changes.
Justification Hypotheses 3, 4, and 5
It was documented that the extent of the fluctuations of the LFC caused by positive
pressure ventilation depends on central blood volume (Murray and Foster 1996). It has

75
also been discovered that early hypovolemia may be reflected in an exaggerated
respiratory wave before other more classic signs of decreased urine output, tachycardia or
hypotension.
Several researchers have attempted to relate fluid loss to changes in the PPG.
Perel et al. (1987) aimed to quantify the systolic pressure variation (SPV) during graded
hemorrhage in ventilated dogs, and to compare its reliability relative to other
hemodynamic factors. They concluded that the difference between systolic pressure at
end-expiration and the lowest value during the respiratory cycle (dDown) correlated to
the degree of hemorrhage, CO, and the pulmonary capillary wedge pressure. Rooke et al.
(1995) also concluded that SPV and the dDown appear to follow shifts in intravascular
volume in relatively healthy, mechanically ventilated humans under isoflourane
anesthesia. Partridge (1987) found a significant correlation between the PPG and SPV.
Shamir et al. (1999) found both the PPG waveform changes and the SPV from the arterial
blood pressure tracing increased significantly after blood withdrawal. The changes in the
PPG correlated with the changes in the SPV.
Based upon the results of these researchers, the PPG and more specifically, the
LFC of the PPG, can potentially be used to monitor fluid loss. LFC amplitude changes
with respiration have been reported and the physiology is understood (Murray and Foster
1996). Additionally, they have been shown to correlate with hypovolemia (Partridge
1987, Shamir et al. 1999). Therefore, it is expected that the LFC Swings will be
exaggerated by hypovolemia.
The PCC corresponds to changes in arterial blood volume in the vascular bed with
each heartbeat. The PCC was shown to correlate with stroke volume (SV) (Murray and

76
Foster 1996), which is affected by circulating volume status. A smaller volume of total
blood should correspond to a smaller stroke volume and hence reduce the PCC
MagMean.
Inspiratory impedence threshold devices (ITD) have been the subject of many
experiments as they increase SV and venous return without causing hemodilution
(Convertino et al. 2004). These devices have been shown to decrease intrathoracic
pressure with each inspiration, which increases preload and venous return to the heart
(Lurie et al. 2000a, Lurie et al. 2000b, Lurie et al. 2002a, Lurie et al. 2002b). This
increases SV and CO and raises blood pressure. Inspiratory impedence threshold device
training imposes no additional resistance during expiration, keeping the SV and CO
elevated throughout the duration of treatment. It is suspected that increasing expiratory
resistance, in addition to inspiratory resistance, will elevate intrathoracic pressure
temporarily impeding venous return and lowering SV and CO. Thus, with added
inspiratory and expiratory resistance, SV should show increased variability with each
respiration. Since stroke volume and CO decrease with fluid loss it is suspected that this
variability will be blunted. As a result, the PCC MagDiff, which represents the stroke
volume variability per respiratory cycle, should decrease with fluid loss.

77
Figure 4-1. A spectral analysis, where the x-axis corresponds to the frequency in Hz and
the y-axis corresponds to power and is a log scale.
1 Passband
Transition Zone
Stopband 0 Frequency
Figure 4-2. A low-pass filter. The width of the transition zone is determined by the magnitude of M.

78
1 Passband
Transition Zone
0 Stopband Frequency
Figure 4-3. A high-pass filter. The width of the transition zone is determined by the magnitude of M.
Figure 4-4. The unprocessed PPG recorded from the nasal alar of a blood donor subject.
Figure 4-5. The LFC of the PPG recorded from the nasal alar of a blood donor subject.
Figure 4-6. The PCC of the PPG recorded from the nasal alar of a blood donor subject.

79
Figure 4-7. The respiratory flow data, where the x-axis represents time and the y-axis
represents flow rate. The peak inspiratory flow rates for each breath are indicated (o).
Figure 4-8. The LFC of the PPG with respiratory flow. The flow has identified peaks (o)
and the LFC does not. The x-axis scale is time. The y-axis was adjusted to fit both plots and does not indicate that the amplitude of the flow is equal to the amplitude of the LFC.
Figure 4-9. The PCC of the PPG plotted with respiratory flow. The high frequency
tracing represents the PCC. Approximately six breaths are shown. The x-axis scale is time. The y-axis was adjusted to fit both tracings and is arbitrary.

80
Figure 4-10. The PCC for the duration of one breath. The peaks (o) and troughs (x) are
shown. The x-axis represents time and the y-axis represents the amplitude of the PCC in light units.
Figure 4-11. The unprocessed PPG demonstrating the exaggerated affect of respiration on
the LFC, hiding the PCC.

CHAPTER 5 STATISTICAL ANALYSIS AND RESULTS
Statistical significance indicates the level of certainty that differences in the
sampled populations are real. The likelihood that the differences are not true is
represented by P. Statistical significance in no way indicates clinical utility.
Data Filtering
All outcome variables were measured on a breath-to-breath basis. Each breathing
study consisted of three levels of resistance, of approximately ten breaths each. The ten
breaths within each level of resistance, for each breathing study, represent repeated
measures. These values were averaged together, resulting in one data point, for each
variable, for each level of resistance. Averaging these repeated measures reduces the
likelihood of aberrant data. Before averaging the data and performing the statistical
analysis, each individual data point was observed for artifact or other obvious sources of
error.
Multiple Breaths
Respiratory flows and volumes were measured using a CO2SMO. The CO2SMO
periodically purges its pressure sensor, temporarily eliminating the ability to record
measurements. This may either cause a minor delay in the timing of the individual
breaths (Figure 4-8) or it may eliminate an entire breath from the data set (Figure 5-1).
When the data from at least one breath was eliminated, all outcome variables measured
during that breath were discarded.
81

82
There were approximately ten breaths of data recorded for each of the three levels
of resistance, both before and after blood donation or hemodialysis (HD). This was
approximately 60 breaths of data from each of the 20 blood donors and each of the 20
HD patients, or 1200 individual breaths from each population. There were 13 instances
of eliminated breaths in the blood donor subjects and nine occurrences in the HD
patients. If these breaths occurred during the low level of resistance, the low frequency
component (LFC) Swing, pulsatile cardiac component (PCC) MagDiff and PCC
MagMean variables were eliminated for that breath. If these breaths occurred during the
medium or high level of resistance, only the LFC Swing variable was discarded as this
was the only variable measured. Since the data points were averaged together, the effect
of the elimination of one data point was minimal, thus reinforcing the reason for the
repeated nature of the measurements.
Cardiac Arrhythmias
The PCC MagDiff and PCC MagMean variable calculations are dependent upon
accurately calculating the amplitude of each individual heart beat through the duration of
each individual breath. Cardiac arrhythmias, such as premature ventricular contractions,
affect the stroke volume and the amplitude of the PCC (Figure 5-2). A premature beat
occurred immediately following the fifth heart beat. This premature beat was followed
by a larger amplitude, delayed beat. The PCC MagDiff represents the difference between
the smallest and largest heart beats was therefore affected. The PCC MagMean, which
represents the average value of these amplitudes, was also affected.
Neither the blood donor subjects nor the HD patients were monitored with an
electrocardiograph, rendering it impossible to diagnose the occurrence and type of
cardiac arrhythmias. All PCC variable calculations corresponding to breaths containing a

83
suspected cardiac arrhythmia were eliminated. Since the PCC variables were only
calculated for the low level of resistance, the PCC of the medium and high levels of
resistance were not evaluated for arrhythmias. Individual occurrences of suspected
arrhythmias occurred in four blood donors and five HD patients.
Artifact
The nature of pulse oximetry monitoring, coupled with the fact that the blood donor
and HD patients were awake and alert, caused movement artifact during data collection.
In addition to movement artifact, the photodiode (PD) occasionally experienced ambient
light interference. All variables were evaluated for these sources of artifact.
The unprocessed photoplethysmograph (PPG), plotted with respiratory flow, is
shown (Figure 5-3). During the ninth breath there was a sharp spike in the unprocessed
PPG data. This spike is not consistent with the data surrounding it and appears
nonphysiologic. The cause of such artifact was related to movement of the subject. All
individual breath data containing artifact were eliminated.
Overall, less than 5% of the total data were eliminated due to the reasons
presented above. By reproducibly eliminating the data points representing possible
sources of calculation error, the reliability of the averages of the remaining data points
increased.
Unattainable Photoplethysmograph
In one blood donor subject and two HD patients, a PPG was unattainable from the
finger. The HD patients each reported a history of poor peripheral circulation and an
inability of a finger pulse oximeter to function. The blood donor subject was a 21 year-
old female and the inability to acquire a reliable PPG tracing from the finger was
surprising. The inability of a finger pulse oximeter probe to function in three out of 40

84
total subjects reinforces the need for alternative site pulse oximeter monitoring, even for
routine use.
Demographics
The blood donor subjects ranged in age from 19 to 65 years of age. There were
seven males and 13 females (Table 5-1). The dialysis patients ranged in age from 26 to
80 years of age and there were ten males and ten females (Table 5-2).
Statistical Analysis
Upon completion of the outcome variable filtering, the data points were averaged.
The averaging of the repeated measures resulted in one outcome data point for each
variable, for each level of resistance, for each breathing study, for the alar and the finger,
for each subject. All analyses occurred separately for the blood donor data and the HD
data and at no time were these two data sets combined. All analysis occurred separately
for the data collected from the alar and finger and at no time were these data sets
combined.
Hypothesis 1
Hypothesis 1 states that the LFC Swings for the high level of resistance are greater
than the LFC Swings for the medium and low levels of resistance and the LFC Swings
for the medium are greater than the LFC Swings for the low level of resistance,
independent of fluid state, and PPG monitoring site.
All LFC Swing outcome measures were separated by resistance level, donation
state and monitoring site. The following data sets were compared:
• Blood donor alar LFC Swings before donation: high vs medium vs low resistance.
• Blood donor alar LFC Swings after donation: high vs medium vs low
resistance.

85
• Blood donor finger LFC Swings before donation: high vs medium vs low
resistance. • Blood donor finger LFC Swings after donation: high vs medium vs low
resistance. • Hemodialysis alar LFC Swings before donation: high vs medium vs low
resistance. • Hemodialysis alar LFC Swings after donation: high vs medium vs low
resistance. • Hemodialysis finger LFC Swings before donation: high vs medium vs
low resistance. • Hemodialysis finger LFC Swings after donation: high vs medium vs low
resistance.
Since there was one LFC Swing data point for each resistance level, the sample
sizes corresponded to the number of subjects. For the blood donor subjects N=20 for the
alar and N=19 for the finger. For the HD patients N=20 for the alar and N=18 for the
finger. The reduced sample size for the finger was due to the inability to acquire a finger
PPG signal in the three subjects.
To determine the appropriate statistical tests to run, it was first necessary to
determine if the data sets were normally distributed. A Kolmogorov-Smirnov (KS) test
for normality with Lilliefors significance correction was applied to the data. The KS test
is used to determine whether a sample of data comes from a specific distribution
(Chakravarti et al. 1967). When testing for normality, minor corrections are made by
applying the Lilliefors correction. The Lilliefors test is used to test the null hypothesis
that the data come from a normally distributed population (Lilliefors 1967).

86
The results are presented (Tables 5-3 and 5-4). Of the 24 individual data sets,
only four were significantly normal. Since most of the data sets were not normally
distributed and N is < 20 for all data sets, nonparametric tests were used for the statistical
tests.
For each of the eight analyses, three data sets were compared. The data in each of
the three sets were paired. The Friedman’s test is the nonparametric equivalent of a one-
way ANOVA. The Friedman’s test tests the null hypothesis that k related variables come
from the same population. For each case, the k variables are ranked from 1 to k. The test
statistic is based on these ranks (SPSS 2005).
The results are shown for the blood donors and HD patients (Tables 5-5 and 5-6).
The mean ranks, coupled with the significance level of each test, indicates that in all eight
analyses there are significant differences between the three resistance levels with
high > medium > low.
To determine where specific differences exist, a post-hoc analysis comparing the
individual data sets was performed. The Wilcoxon signed-rank test is a nonparametric
alternative to the paired Student's t-test for the case of two related samples or repeated
measurements of a single sample. The test is named for Frank Wilcoxon, who proposed
this, and the rank-sum test for two independent samples (Wilcoxon 1945).
The results are shown for the Wilcoxon signed-rank test for the blood donor and
HD patients (Tables 5-7 and 5-8). To determine which outcome variables differ, each
level of resistance was compared to the other levels of resistance. The four parts of each
of the two tables represent the eight analyses described above. Within each of these
analyses there were three individual analyses performed using the Wilcoxon signed-rank

87
test. All analyses showed significance with the exception of the medium vs high level of
resistance in the HD patients from the alar, before fluid loss.
Hypothesis 1 states that differences exist between the low, medium and high
levels of resistance. This was proven to be true. Graphical representations of the results
are shown (Figures 5-4 to 5-7).
Hypothesis 2
Hypothesis 2 states that the LFC Swings will correlate with the intrathoracic
pressure changes per breath, as estimated by Equation 3-3, independent of fluid state and
PPG monitoring site. Equation 3-3 estimates pressure drop across endotracheal (ET)
tubes and correlated well with the measured results previously discussed (Chapter 3). To
estimate the intrathoracic pressure change using this equation, the inspiratory and
expiratory flow rates were used and the two constants (K1 and K2) were based upon the
diameter of the ET tubes. The estimated intrathoracic pressure change per breath was
then calculated for each subject. For each resistance level, all breaths were averaged, as
previously described.
For each subject there was a single LFC Swing value for each level of resistance
before and after fluid loss for the alar and finger. There was also a corresponding
estimated intrathoracic pressure change. A regression analysis was performed to explore
the relationship between these values. The following data sets were compared:
• Estimated intrathoracic pressure changes and alar LFC Swings through all resistance levels for the blood donor subjects, before donation.
• Estimated intrathoracic pressure changes and alar LFC Swings through all
resistance levels for the blood donor subjects, after donation. • Estimated intrathoracic pressure changes and finger LFC Swings through all
resistance levels for the blood donor subjects, before donation.

88
• Estimated intrathoracic pressure changes and finger LFC Swings through all
resistance levels for the blood donor subjects, after donation. • Estimated intrathoracic pressure changes and alar LFC Swings through all
resistance levels for the HD patients, before HD. • Estimated intrathoracic pressure changes and alar LFC Swings through all
resistance levels for the HD patients, after HD. • Estimated intrathoracic pressure changes and finger LFC Swings through all
resistance levels for the HD patients, before HD. • Estimated intrathoracic pressure changes and finger LFC Swings through all
resistance levels for the HD patients, after HD.
Linear and second order regression analyses were performed to determine a
relationship between the LFC Swings and estimated intrathoracic pressure changes and
the results are shown (Tables 5-9 and 5-10). Graphical representations of these values
are also shown (Figures 5-8 through 5-15). The R2 values for the linear and second order
analyses were virtually identical. In the blood donors and HD patients there were no
significant relationships between the LFC Swings and the estimated intrathoracic
pressure changes in any comparisons. This lack of relationship was caused primarily by
the inter-subject variability and presence of outliers.
Hypothesis 2 states that there is a relationship between the LFC Swings and the
estimated intrathoracic pressure changes. Due to inter-subject variability and outliers, no
statistically significant relationship was found. Chapter six explores this relationship on a
subject to subject basis eliminating the effect of inter-subject variability.

89
Hypothesis 3
Hypothesis 3 states that the LFC Swings for breathing study one (before fluid loss)
are less than the LFC swings for breathing study two (after fluid loss) for each level of
resistance, independent of monitoring site.
The LFC Swing data before fluid loss was compared to the LFC Swing data after
fluid loss for the following:
• Blood donor subjects, alar, high level of resistance.
• Blood donor subjects, alar, medium level of resistance.
• Blood donor subjects, alar, low level of resistance.
• Blood donor subjects, finger, high level of resistance.
• Blood donor subjects, finger, medium level of resistance.
• Blood donor subjects, finger, low level of resistance.
• Hemodialysis patients, alar, high level of resistance.
• Hemodialysis patients, alar, medium level of resistance.
• Hemodialysis patients, alar, low level of resistance.
• Hemodialysis patients, finger, high level of resistance.
• Hemodialysis patients, finger, medium level of resistance.
• Hemodialysis patients, finger, low level of resistance.
The 12 individual hypothesis 3 comparisons were each an individually paired,
before and after analysis. The fundamental statistical test for this type of comparison is
the paired Student’s t-test. As previously discussed, however, the LFC Swing data was
not normally distributed. The Wilcoxon signed-rank test is the nonparametric alternative
to the paired Student's t-test for the case of two related samples, and was used.

90
The results of the 12 individual comparisons are shown (Tables 5-11 and 5-12 and
Figures 5-16 to 5-19). In the blood donor subjects, none of the comparisons were
significantly different; however, the LFC Swings from the low resistance level from the
finger had a p-value of .059 indicating a trend towards significance. In contrast, the HD
patients all had P <.2 with half of them being <.05 or statistically significant.
Hypothesis 3 states that the LFC Swings before fluid loss are smaller than the
LFC swings after fluid loss, for each level of resistance, independent of monitoring site.
Of the six comparisons, three significantly differed and the other three trended towards
significance. For the blood donor subjects, none of the comparisons showed significant
differences.
Hypothesis 4
Hypothesis 4 states that the PCC MagDiff for breathing study 1 (before fluid loss)
is greater than PCC MagDiff for breathing study 2 (after fluid loss), independent of
monitoring site. The PCC MagDiff data before fluid loss was compared to the PCC
MagDiff data after fluid loss for the following:
• Blood donor subjects, alar, low level of resistance.
• Blood donor subjects, finger, low level of resistance.
• Hemodialysis patients, alar, low level of resistance.
• Hemodialysis patients, finger, low level of resistance.
The four individual hypothesis 4 comparisons were each an individually paired,
before and after analysis. To determine the appropriate statistical test, each data set was
first tested for normality. As previously described, a KS test with Lilliefors correction
was used.

91
The results of the KS normality test with Lilliefors significance correction for the
PCC MagDiff are shown (Tables 5-13 and 5-14). Since not all of the PCC MagDiff data
was normally distributed and the sample sizes were small, a Wilcoxon signed-rank test,
the nonparametric alternative to the paired Student's t-test, was used.
The difference between the before and after blood donation alar PCC MagDiff
was statistically significant (Table 5-15 and Figures 5-20 and 5-21). The same
comparison in the HD patients was not significantly different. Neither the blood donors
nor the HD patients were significantly different in the finger PCC MagDiff.
Hypothesis 4 states that the PCC MagDiff before fluid loss is greater than PCC
MagDiff after fluid loss, independent of monitoring site. This was true for the blood
donor subjects measured from the alar and was not true of the other comparisons.
Hypothesis 5
Hypothesis 5 states that the PCC MagMean for breathing study one (before fluid
loss) is larger than the PCC MagMean for breathing study two (after fluid loss),
independent of monitoring site.
The PCC MagMean before fluid loss was compared to the PCC MagMean data
after fluid loss for the following:
• Blood donor subjects, alar, low level of resistance.
• Blood donor subjects, finger, low level of resistance.
• Hemodialysis patients, alar, low level of resistance.
• Hemodialysis patients, finger, low level of resistance.
The four individual hypothesis 5 comparisons were each an individually paired,
before and after analysis. To determine the appropriate statistical test, each data set was

92
first tested for normality. As previously described, a KS test with Lilliefors correction
was used.
The results of the KS normality test with Lilliefors significance correction for the
PCC MagMean are shown (Tables 5-16 and 5-17). Since only one of the eight data sets
were found to not be normally distributed and since the sample size for all data sets was
small (either 18 or 20), a nonparametric test was used for the comparison. A Wilcoxon
signed-rank test, the nonparametric alternative to the paired Student's t-test was used.
The difference between the before and after blood donation alar PCC MagDiff
was statistically significant (Table 5-18 and Figures 5-22 and 5-23). Additionally, the
change was consistent with that of the PCC MagDiff. The difference in the finger PCC
MagMean of the HD patients was also statistically different. The same comparison in the
blood donor subjects was not.
Hypothesis 5 states that the PCC MagMean before fluid loss is larger than the
PCC MagMean after fluid loss, independent of monitoring site. This was true for the
blood donor subjects measured from the alar and the HD patients measured from the
finger. It was not true of the other comparisons.
In summary, hypothesis 1 was supported while hypothesis 2 was not. Hypothesis
3 was supported in the HD patients while Hypotheses 4 and 5 were supported in the
blood donor subjects from the alar. The fact that the HD patients show differences in the
LFC Swings while the blood donors subjects show differences in the PCC variables has
important clinical and theoretical implications.
Discussion of Statistical Results
The blood donors and HD patients represent two distinctly different populations.
Although a medical history was not performed, in general, the blood donor subjects were

93
in good health. The blood donation screening procedure does not exclude all chronic
medical conditions but the subjects must be in general good health and be feeling well the
day of donation. On the other hand, the HD patients generally have a long and
complicated medical history and were taking an average of nearly ten medications.
Additionally, the blood donor subjects lose whole blood, including red blood cells, while
HD patients lose ultrafiltrate, not including red blood cells.
Hypotheses 1 and 2
Hypotheses 1 and 2 from clinical goal 1 were analyzed separately for a relatively
healthy population (blood donors) and a relatively unhealthy population (HD patients).
Additionally, the analysis was performed separately before and after fluid loss. As a
result, hypotheses 1 and 2 were tested for a total of four populations: a euvolemic,
relatively healthy population; a relatively healthy population with minor whole blood
loss; a fluid loaded relatively unhealthy population; and a euvolemic, relatively unhealthy
population.
All four of these populations, showed statistical differences across the three levels
of resistance. This indicates that the LFC could potentially be used to distinguish major
airway resistance differences in a variety of patient populations.
Hypothesis 2 explored the relationship between the LFC Swings and the
estimated changes in intrathoracic pressure. The intrathoracic pressure changes per
breath used in this analysis were estimated using an experimentally derived equation
(Equation 3-3). The equation only uses inspiratory and expiratory flow rates to predict
the pressure drop across ET tubes and does not account for intrinsic pressure changes in
each individual.

94
In addition to the possible inaccuracy of Equation 3-3, the level of variation in the
LFC Swings between subjects was high. The inability to account for actual variability in
intrathoracic pressure changes coupled with the high inter-subject variability of the LFC
Swings resulted in a nonsignificant relationship between the LFC Swings and estimated
intrathoracic pressure.
The differences in the LFC Swings as shown in hypothesis 1 are caused by the
intrathoracic pressure changes created by the added respiratory resistance. Inspiratory
and expiratory flow rates and total respiratory volume contribute to the intrathoracic
pressure change per breath. The inspiratory and expiratory flow rates and the respiratory
volumes were analyzed for differences between resistance levels, since this would affect
intrathoracic pressure, and could possibly confound the LFC Swing resistance data
comparison. The statistical analysis that has been previously described was used and the
results are presented (Tables 5-19 to 5-26 and Figures 5-24 to 5-29).
The peak inspiratory and expiratory flow rates differed significantly across all
levels of resistance. They were greater in the low level of resistance than medium and
greater in medium than high. Although the subjects were coached to breathe in and out at
constant flow rates though all resistance levels, the flow rates increased as resistance
decreased. Only one peak inspiratory comparison had a P >.05 and it was .07. The
respiratory volume data in the blood donors and HD patients did not differ consistently.
The high level of resistance was less than the other two levels before HD. Otherwise, no
differences in the volumes were present.
Respiratory flow rate is directly related to the intrathoracic pressure change,
which affects the LFC. Since the flow rates differed across the three resistance levels this

95
potentially confounded the LFC results. With all resistance levels being equal, the
subjects with the greatest peak inspiratory and expiratory flow rates would be expected to
have the greatest change in intrathoracic pressure and hence the largest LFC Swings. The
results of hypothesis 1 indicate that the subjects breathing through the high resistance
level had the greatest LFC Swings. These are the same subjects with the smallest peak
inspiratory and expiratory flow rates. The difference in intrathoracic pressure caused by
the difference in the flow rates does not override the difference caused by the added
resistance. It did, however, possibly reduce the difference in the LFC Swings of the three
resistance levels. Had the peak flow rates been identical, the differences found in the
LFC Swings across the three resistance levels may have been even larger.
Since it is not feasible to guarantee that all subjects will have the ability to breathe
to exact flow rates and volumes, this shortcoming can never truly be overcome. Since the
foundation of the LFC Swings is the intrathoracic pressure, and the added resistance is
only a means to increase intrathoracic pressure changes, future studies should monitor
similar groups of patients with esophageal balloons, which provide an estimate of
intrathoracic pressure. The variability of peak flow rates would not be as important since
the actual intrathoracic pressure changes caused by the resistance levels, flows and
volume would be known.
Hypothesis 3
The comparisons in clinical goal 2 were based upon the fluid state of the subjects.
Blood donors lose whole blood while HD patients lose ultrafiltrate and retain red blood
cells. In both patient populations, the clinical goal 2 comparisons were before and after
fluid loss.

96
Hypothesis 3 analyzed the LFC Swings for changes related to fluid loss. The
three individual resistance levels were analyzed separately. Differences in the LFC
Swings of the HD patients were either significant or trending toward significance
whereas no differences were found in the blood donors subjects.
Respiratory flow rates and volumes were compared before and after fluid loss for
the blood donor and HD patients. The statistical methods previously described were
used. The results are presented (Tables 5-27 and 5-28 and Figures 5-30 to 5-35). No
differences were found in peak inspiratory flow, peak expiratory flow or respiratory
volume in either blood donors or HD patients. The differences in the alar LFC Swings of
the HD patients before and after HD were therefore not caused by variation in peak
inspiratory flow, peak expiratory flow or respiratory volume. Additionally, there were no
before and after blood loss differences found in the LFC Swings of the blood donor
subjects. This lack of difference was not affected by differences in these respiratory
parameters.
Hypothesis 3 states that the LFC Swings increased after fluid loss. It was
assumed that enough fluid would be lost during HD or blood donation to cause this
change. Other expected changes that would occur with fluid loss include increased heart
rate and decreased blood pressure. Pulse rate and seated blood pressure were analyzed
for differences before and after fluid loss in the blood donor and HD patients. The results
are presented (Tables 5-29 and 5-30 and Figures 5-36 to 5-39).
Consistent with the LFC Swing differences, the pulse rate and blood pressure did
not differ in the blood donor subjects before and after blood donation. In the HD
97
patients, however, the pulse rate at all resistance levels increased significantly after fluid
loss and the systolic and diastolic blood pressure both decreased significantly.
The LFC Swing results, coupled with the pulse and blood pressure results,
indicate that the overall physiologic effect of the fluid loss in HD is greater than in blood
donation. The total blood lost in blood donation does not cause an increase in pulse rate
or a decrease in blood pressure. It is therefore not surprising that there were no changes
in the LFC Swings.
Hemodialysis patients, on the other hand, lose enough fluid to have a statistically
significant increase in pulse rate and decrease in blood pressure. These physiologic
compensatory mechanisms indicate that the fluid lost is physiologically significant. The
LFC Swings either increased significantly or trended toward significance in the alar and
finger of the HD patients.
These data indicate that compensatory physiologic mechanisms must be present
for the LFC Swings to significantly increase. It is suspected that the overall effect of the
blood loss resulting from blood donation is too small to influence the LFC Swings. An
interesting follow-up study could remove enough whole blood from volunteer donors to
cause compensatory mechanisms, indicating that the blood loss is physiologically
significant. If the LFC Swings significantly increase, this would support this theory.
In many of the subjects, the effects of the resistance breathing on the LFC was
greater in the first two breaths than subsequent breaths. To explore this relationship, the
first two breaths for each subject were separated from subsequent breaths and averaged
separately. First, the mean of breaths one and two were compared to the mean of the
subsequent breaths. This analysis was performed for the alar and finger, before and after

98
fluid loss, in the blood donor and HD patients. The results are presented (Tables 5-31 to
5-34 and Figures 5-40 to 5-43).
In the blood donor subjects there were six instances of the difference between the
mean of the first two breaths being significantly different from the mean of subsequent
breaths. This occurred three times in the HD patients with a fourth P=.053. In all ten
cases the mean of the first two breaths was greater than the mean of the subsequent
breaths.
When resistance is initially added to a breathing circuit, the LFC responds with
large changes. After two breaths, the magnitude of the LFC Swings stabilizes to a
slightly lower level than the magnitude of the first two breaths. Considering not all
analyses were significantly different, more research should be conducted to fully
understand the physiologic significance of the initial shifting of the venous blood and
how this differs from the stabilized changes.
A follow-up analysis explored the differences between the first two breaths before
and after fluid loss. The results of the before and after fluid loss analysis of the first two
breath LFC Swing data are presented (Tables 5-35 and 5-36 and Figures 5-44 to 5-47).
No difference were found in the LFC Swings of the blood donors when all breaths
were combined, however when looking at the first two breaths only, differences were
found in the high level of resistance. The LFC Swings of the first two breaths after blood
loss were significantly greater than before blood loss. It is possible that the LFC Swings
of the first two breaths may be a more sensitive indicator of blood loss than other more
traditional measures, such as pulse rate and blood pressure.

99
In HD patients, the LFC Swings in the first two breaths were significantly greater
in the after HD compared to before HD in the medium and low levels of resistance.
Since the average of all breaths was also significant or trending towards significance, the
first two breaths may not provide any additional information in the HD patient
population, probably because the fluid loss is physiologically significant. It is suspected
that initial LFC Swings caused by the first two breaths may be a sensitive indicator of
minor blood loss whereas in the case of more significant fluid loss, all LFC Swings can
be used.
Hypotheses 4 and 5
Hypotheses 4 and 5 explored the effects of fluid loss on the PCC. In blood donor
subjects, the alar PCC MagDiff and alar PCC MagMean both decreased after blood
donation whereas in HD patients there were no differences. This is in contrast to the LFC
Swings, which increased in HD patients and not blood donors.
The absorbance of red and infrared light in pulse oximetry mainly occurs as
hemoglobin passes by the PD. The PPG is a graphical representation of the absorbance
of infrared light. In blood donation, red blood cells, and hence hemoglobin, are removed.
Even though the blood loss has minor physiologic consequences, the PCC MagDiff and
PCC MagMean both decreased significantly. This is logical considering red blood cells
are lost and light absorption decreases. While the decrease in PCC variables indicates a
decrease in stroke volume and cardiac output it may simply reflect the decrease in
absolute amount of hemoglobin absorbing infrared light. The fact that HD patients lose a
physiologically significant amount of fluid while experiencing no change in the PCC
variables support this theory.

100
To date, no studies have explored the differences between losing whole blood and
clear fluid. The PPG may be used to detect physiologic changes with fluid loss but may
also be used to detect changes in hemoglobin concentration. As with blood loss during
donation, the physiologic consequences are insignificant yet detectable by a decrease in
the PCC measures.
Regression Analysis
The LFC Swings significantly increased after fluid loss in HD and the PCC
variables significantly decreased after blood donation. To determine if the magnitude of
fluid loss affects the magnitude of these variables, a regression analysis was performed.
First, the difference between the LFC Swings before and after HD was calculated
for each level of resistance. The total fluid removed in each HD patient was noted. A
regression analysis was performed to determine a relationship between the volume of
fluid removed and the magnitude of the LFC Swing change following this fluid loss. The
regression analysis plots along with R2 values for the linear and second order analysis are
presented (Figures 5-48 to 5-50).
No relationship was found between total fluid removed and the magnitude of the
change in the LFC Swings in HD patients. The total amount of fluid removed was then
divided by total body weight to give an estimation of the relative amount of fluid
removed. A follow-up regression analysis was then performed to determine if changes in
the LFC Swings correlated with an estimation of relative fluid loss. These results are
presented (Figures 5-51 to 5-53). Similarly, no relationship was found between the
magnitude of LFC Swing change and the fluid removed as a percent of total body weight.
A similar relationship was explored for the blood donors. First, the total blood
volume in the blood donor subjects was estimated using Equations 3-4 and 3-5. The PCC

101
MagDiff and PCC MagMean differences were calculated as before blood loss minus after
blood loss. The results of this regression analysis are presented (Figures 5-54 and 5-55).
Since all but two of the blood donors lost the same amount of blood, calculating the
percent blood loss would not add additional information.
Whole blood loss in a population of blood donors causes significant changes in
the PCC measures while fluid loss in a population of HD patients causes significant
changes in the LFC measures. Inter-subject variability prohibits these measures from
accurately estimating the degree of fluid loss in these populations.
Table 5-1. Demographic information for the blood donors. Height (cm) Weight (kg) Sex Age P01 183 81.8 M 60 P02 165 107.7 F 40 P03 160 60.5 F 21 P04 157 50.0 F 27 P05 178 81.8 M 35 P06 157 59.1 F 55 P07 178 71.8 F 26 P08 178 95.5 M 34 P09 201 104.5 M 32 P10 170 75.0 M 48 P11 175 86.4 F 31 P12 178 67.7 F 33 P13 165 84.1 F 33 P14 183 84.1 M 54 P15 183 84.1 M 65 P16 165 68.2 F 20 P17 175 66.4 F 21 P18 152 63.6 F 19 P19 168 85.5 F 21 P20 157 59.1 F 20

102
Table 5-2. Demographic information for the HD patients.
Height (cm) Weight (kg) Sex Age P01 175 72.5 M 52 P02 193 110.0 M 50 P03 173 78.5 F 61 P04 168 129.5 F 45 P05 160 56.0 F 26 P06 188 131.4 M 54 P07 168 73.0 M 80 P08 165 82.6 F 49 P09 168 91.3 F 36 P10 180 91.7 F 56 P11 170 136.0 F 29 P12 170 72.2 M 44 P13 180 86.4 M 58 P14 196 130.1 M 54 P15 160 80.8 F 36 P16 188 83.9 M 62 P17 188 94.1 M 38 P18 160 60.6 F 57 P19 175 83.0 F 40 P20 170 62.3 M 44
Table 5-3. Test for normality in the LFC Swings of the blood donors.
Tests of Normality Blood Donors Kolmogorov-Smirnov(a) Statistic df Sig. Alar high before 0.19 20 0.049 Alar high after 0.29 20 0.000 Alar medium before 0.16 20 0.2* Alar medium after 0.17 20 0.137 Alar low before 0.17 20 0.114 Alar low after 0.29 20 0.000 Finger high before 0.14 19 0.2* Finger high after 0.19 19 0.083 Finger medium before 0.25 19 0.002 Finger medium after 0.17 19 0.141 Finger low before 0.16 19 0.2* Finger low after 0.24 19 0.004 * Lower bound of the true significance. (a) Lilliefors Significance Correction

103
Table 5-4. Test for normality in the LFC Swings of the HD patients. Tests of Normality HD patients Kolmogorov-Smirnov(a) Statistic df Sig. Alar high before 0.30 20 0.000 Alar high after 0.16 20 0.171 Alar medium before 0.29 20 0.000 Alar medium after 0.20 20 0.029 Alar low before 0.28 20 0.000 Alar low after 0.30 20 0.000 Finger high before 0.21 18 0.028 Finger high after 0.21 18 0.030 Finger medium before 0.14 18 0.2* Finger medium after 0.18 18 0.149 Finger low before 0.25 18 0.003 Finger low after 0.25 18 0.004 * Lower bound of the true significance. (a) Lilliefors Significance Correction
Table 5-5. Friedman’s test results for the LFC Swings of the blood donors.
Mean Rank
Mean Rank
Mean Rank
Mean Rank
Alar high before 2.85
Alar high after 2.85
Finger high before 2.74
Finger high after 2.79
Alar med before 1.90
Alar med after 2.05
Finger med before 2.05
Finger med after 2.16
Alar low before 1.25
Alar low after 1.10
Finger low before 1.21
Finger low after 1.05
Test Statistics N 20 N 20 N 19 N 19 Chi-Square 25.9 Chi-Square 30.7 Chi-Square 22.21 Chi-Square 29.37 df 2 df 2 df 2 df 2 Sig. 2.38E-06 Sig. 2.16E-07 Sig. 1.50E-05 Sig. 4.19E-07

104
Table 5-6. Friedman’s test results for the LFC Swings of the HD patients.
Mean Rank
Mean Rank
Mean Rank
Mean Rank
Alar high before 2.65
Alar high after 2.75
Finger high before 2.81
Finger high after 2.83
Alar med before 2.35
Alar med after 2.15
Finger med before 2.00
Finger med after 2.11
Alar low before 1
Alar low after 1.1
Finger low before 1.19
Finger low after 1.06
Test Statistics N 20 N 20 N 18 N 18 Chi-Square 30.9 Chi-Square 27.9 Chi-Square 23.69 Chi-Square 28.78 df 2 df 2 df 2 df 2
Sig. 1.95E-07 Sig. 8.74E-07 Sig. 7.2E-06 Sig.
5.64E-07
Table 5-7. Wilcoxon Signed-Rank results across the three resistance levels for the LFC
Swings for the blood donors. Before After Alar med Alar low Alar low Alar med Alar low Alar low vs vs vs vs vs vs Alar high Alar med Alar high Alar high Alar med Alar high Sig. 0.0010 0.0012 0.0001 0.0008 0.0003 0.0001 Before After Finger med Finger low Finger low Finger med Finger low Finger low vs vs vs vs vs vs Finger high Finger med Finger high Finger high Finger med Finger high Sig. 0.0100 0.0025 0.0002 0.0048 0.0004 0.0001
Table 5-8. Wilcoxon Signed-Rank results across the three resistance levels for the LFC
Swings for the HD patients. Before After Alar med Alar low Alar low Alar med Alar low Alar low vs vs vs vs vs vs Alar high Alar med Alar high Alar high Alar med Alar high Sig. 0.0620 0.0001 0.0001 0.0111 0.0004 0.0009 Before After Finger med Finger low Finger low Finger med Finger low Finger low vs vs vs vs vs vs Finger high Finger med Finger high Finger high Finger med Finger high Sig. 0.0012 0.0014 0.0004 0.0123 0.0003 0.0002
Table 5-9. R2 values of LFC Swings compared to estimated intrathoracic pressure for
blood donors. Alar before Alar after Finger before Finger after Linear 0.2902 0.3449 0.1984 0.3005 Second Order 0.3018 0.415 0.2593 0.3132

105
Table 5-10. R2 values of LFC Swings compared to estimated intrathoracic pressure for HD patients.
Alar before Alar after Finger before Finger after Linear 0.0318 0.0128 0.1529 0.2803 Second Order 0.1227 0.2308 0.162 0.2172
Table 5-11. Wilcoxon Signed-Rank results for the LFC Swings of the blood donors
before and after blood loss. Alar Finger High after Med after Low after High after Med after Low after vs vs vs vs vs vs High before Med before Low before High before Med before Low before Sig. 0.823 0.502 0.911 0.717 0.629 0.059
Table 5-12. Wilcoxon Signed-Rank results for the LFC Swings of the HD patients before
and after HD. Alar Finger High after Med after Low after High after Med after Low after vs vs vs vs vs vs High before Med before Low before High before Med before Low before Sig. 0.108 0.028 0.126 0.145 0.020 0.043
Table 5-13. Test for normality for the PCC MagDiff of the blood donors.
Tests of Normality Blood Donors Kolmogorov-Smirnov(a) Statistic df Sig. Alar low before 0.14 20 0.2* Alar low after 0.29 20 0.000 Finger low before 0.16 19 0.2* Finger low after 0.15 19 0.2* * Lower bound of the true significance. (a) Lilliefors Significance Correction
Table 5-14. Test for normality for the PCC MagDiff of the HD patients.
Tests of Normality HD patients Kolmogorov-Smirnov(a) Statistic df Sig. Alar low before 0.21 20 0.018 Alar low after 0.26 20 0.001 Finger low before 0.42 18 0.000 Finger low after 0.31 18 0.000 * Lower bound of the true significance. (a) Lilliefors Significance Correction

106
Table 5-15. Wilcoxon Signed-Rank results for the PCC MagDiff of the blood donors and HD patients Blood Donor HD Alar Finger Alar Finger Low before Low before Low before Low before vs vs vs vs Low after Low after Low after Low after Sig. 0.017 0.643 0.970 0.286
Table 5-16. Test for normality for the PCC MagMean of the blood donors.
Tests of Normality Blood Donors Kolmogorov-Smirnov(a) Statistic df Sig. Alar low before 0.19 20 0.054 Alar low after 0.19 20 0.052 Finger low before 0.27 19 0.001 Finger low after 0.16 19 0.188 * Lower bound of the true significance. (a) Lilliefors Significance Correction
Table 5-17. Test for normality for the PCC MagMean of the HD patients.
Tests of Normality HD patients Kolmogorov-Smirnov(a) Statistic df Sig. Alar low before 0.22 20 0.016 Alar low after 0.20 20 0.039 Finger low before 0.12 18 0.2* Finger low after 0.24 18 0.006 * Lower bound of the true significance. (a) Lilliefors Significance Correction
Table 5-18. Wilcoxon Signed-Rank results for the PCC MagMean of the blood donors
and HD patients. Blood Donor HD Alar Finger Alar Finger Low before Low before Low before Low before vs vs vs vs Low after Low after Low after Low after Sig. 0.028 0.968 0.852 0.010

107
Table 5-19. Friedman’s test results for the respiratory flow rates of the blood donors.
Mean Rank
Mean Rank
Mean Rank
Mean Rank
Insp high before 1.18
Insp high after 1.05
Exp high before 1.43
Exp high after 1.43
Insp med before 1.95
Insp med after 2.08
Exp med before 1.75
Exp med after 1.88
Insp low before 2.88
Insp low after 2.88
Exp low before 2.83
Exp low after 2.70
Test Statistics N 20 N 20 N 20 N 20 Chi-Square 29.72 Chi-Square 34.78
Chi-Square 22.31 Chi-Square 18.33
df 2 df 2 df 2 df 2 Sig. 3.52E-07 Sig. 2.80E-08 Sig. 1.43E-05 Sig. 1.05E-04
Table 5-20. Wilcoxon Signed-Rank results for the respiratory flow rates of the blood
donors. Before After Insp med Insp low Insp low Insp med Insp low Insp low vs vs vs vs vs vs Insp high Insp med Insp high Insp high Insp med Insp high Sig. 0.0009 0.0002 0.0001 0.0002 0.0003 0.0001 Before After Exp med Exp low Exp low Exp med Exp low Exp low vs vs vs vs vs vs Exp high Exp med Exp high Exp high Exp med Exp high Sig. 0.0732 0.0001 0.0003 0.0102 0.0007 0.0002
Table 5-21. Friedman’s test results for the respiratory volume of the blood donors.
Mean Rank
Mean Rank
High before 1.58 High after 1.88 Med before 2.05 Med after 2.13 Low before 2.38 Low after 2.00 Test Statistics N 20 N 20
Chi-Square 6.82 Chi-Square 0.64
df 2 df 2 Sig. 0.033 Sig. 0.726

108
Table 5-22. Wilcoxon Signed-Rank results for the respiratory volume of the blood donors.
Pre Post Vol med Vol low Vol low Vol med Vol low Vol low vs vs vs vs vs vs Vol high Vol med Vol high Vol high Vol med Vol high Sig. 0.052 0.365 0.046 0.108 0.658 0.171
Table 5-23. Friedman’s test results for the respiratory flow rates of the HD patients.
Mean Rank
Mean Rank
Mean Rank
Mean Rank
Insp high before 1.025
Insp high after 1
Exp high before 1.025
Exp high after 1
Insp med before 2.05
Insp med after 2
Exp med before 1.975
Exp med after 2
Insp low before 2.925
Insp low after 3
Exp low before 3
Exp low after 3
Test Statistics N 20 N 20 N 20 N 20 Chi-Square 37.10 Chi-Square 40.00
Chi-Square 39.52 Chi-Square 40.00
df 2 df 2 df 2 df 2 Sig. 8.78E-09 Sig. 2.06E-09 Sig. 2.62E-09 Sig. 2.06E-09
Table 5-24. Wilcoxon Signed-Rank results for the respiratory flow rates of the HD
patients. Before After Insp med Insp low Insp low Insp med Insp low Insp low vs vs vs vs vs vs Insp high Insp med Insp high Insp high Insp med Insp high Sig. 1.28E-04 2.45E-04 8.79E-05 8.43E-05 8.72E-05 8.72E-05 Before After Exp med Exp low Exp low Exp med Exp low Exp low vs vs vs vs vs vs Exp high Exp med Exp high Exp high Exp med Exp high Sig. 1.24E-04 8.79E-05 8.75E-05 8.23E-05 8.76E-05 8.68E-05

109
Table 5-25. Friedman’s test results for the respiratory volume of the HD patients. Mean Rank Mean Rank High before 1.3 High after 1.725 Med before 2.35 Med after 2.175 Low before 2.35 Low after 2.100 Test Statistics N 20 N 20 Chi-Square 15.08 Chi-Square 2.35 df 2 df 2 Sig. 0.001 Sig. 0.308
Table 5-26. Wilcoxon Signed-Rank results for respiratory volume of the HD patients.
Before After Vol med Vol low Vol low Vol med Vol low Vol low vs vs vs vs vs vs Vol high Vol med Vol high Vol high Vol med Vol high Sig. 0.001 0.879 0.001 0.024 0.641 0.048
Table 5-27. Wilcoxon Signed-Rank results for the respiratory flow rates and volumes of
the blood donors before and after blood loss. Inspiration Expiration Respiratory Volume
High before
Med before
Low before
High before
Med before
Low before
High before
Med before
Low before
vs vs vs vs vs vs vs vs vs
High after
Med after
Low after
High after
Med after
Low after
High after
Med after
Low after
Sig. 0.504 0.952 0.150 0.482 0.584 0.599 0.731 0.421 0.155 Table 5-28. Wilcoxon Signed-Rank results for the respiratory flow rates and volumes of
the HD patients before and after HD. Inspiration Expiration Respiratory Volume
High before
Med before
Low before
High before
Med before
Low before
High before
Med before
Low before
vs vs vs vs vs vs vs vs vs
High after
Med after
Low after
High after
Med after
Low after
High after
Med after
Low after
Sig. 0.585 0.925 0.409 0.159 0.795 0.952 0.145 0.601 0.380

110
Table 5-29. Wilcoxon Signed-Rank results of the pulse rate and blood pressure of the blood donors before and after blood loss.
Pulse Blood Pressure High before Med before Low before Sys before Dia before vs vs vs vs vs High after Med after Low after Sys after Dia after Sig. 0.965 0.060 0.515 0.075 0.169
Table 5-30. Wilcoxon Signed-Rank results of the pulse rate and blood pressure of the HD
patients before and after HD. Pulse Blood Pressure High before Med before Low before Sys before Dia before vs vs vs vs vs High after Med after Low after Sys after Dia after Sig. 0.007 0.008 0.005 0.000 0.009
Table 5-31. Wilcoxon Signed-Rank results for the LFC Swings of the blood donors
comparing breaths 1 and 2 to subsequent breaths in the alar. Before After High Medium Low High Medium Low Breath 1 and 2 1 and 2 1 and 2 1 and 2 1 and 2 1 and 2 vs vs vs vs vs vs Breath > 2 > 2 > 2 > 2 > 2 > 2 Sig. 0.100 0.717 0.033 0.023 0.823 0.023
Table 5-32. Wilcoxon Signed-Rank results for the LFC Swings of the blood donors
comparing breaths 1 and 2 to subsequent breaths in the finger. Before After High Medium High Medium High Medium Breath 1 and 2 1 and 2 1 and 2 1 and 2 1 and 2 1 and 2 vs vs vs vs vs vs Breath > 2 > 2 > 2 > 2 > 2 > 2 Sig. 0.658 0.133 0.002 0.005 0.091 0.004
Table 5-33. Wilcoxon Signed-Rank results for the LFC Swings of the HD patients
comparing breaths 1 and 2 to subsequent breaths in the alar. Before After High Medium High Medium High Medium Breath 1 and 2 1 and 2 1 and 2 1 and 2 1 and 2 1 and 2 vs vs vs vs vs vs Breath > 2 > 2 > 2 > 2 > 2 > 2 Sig. 0.433 0.028 0.014 0.355 0.191 0.455

111
Table 5-34. Wilcoxon Signed-Rank results for the LFC Swings of the HD patients comparing breaths 1 and 2 to subsequent breaths in the finger.
Before After High Medium High Medium High Medium Breath 1 and 2 1 and 2 1 and 2 1 and 2 1 and 2 1 and 2 vs vs vs vs vs vs Breath > 2 > 2 > 2 > 2 > 2 > 2 Sig. 0.811 0.586 0.349 0.811 0.053 0.008
Table 5-35. Wilcoxon Signed-Rank results for the LFC Swings of the blood donors
comparing breaths 1 and 2 before and after blood loss. Alar Finger High before Med before Low before High before Med before Low before vs vs vs vs vs vs High after Med after Low after High after Med after Low after Sig. 0.011 0.520 0.881 0.099 0.913 0.117
Table 5-36. Wilcoxon Signed-Rank results for the LFC Swings of the HD patients
comparing breaths 1 and 2 before and after HD. Alar Finger High before Med before Low before High before Med before Low before vs vs vs vs vs vs High after Med after Low after High after Med after Low after Sig. 0.212 0.351 0.247 0.199 0.031 0.002
Figure 5-1. Respiratory flow data showing the elimination of one breath. The peak
inspiratory flow rates are marked (o).

112
Figure 5-2. The PCC for the duration of one breath, showing an arrhythmia.
Figure 5-3. The unprocessed PPG with respiratory flow data, showing the result of
motion artifact.
0
5000
10000
15000
20000
25000
30000
35000
Before After
High Medium Low Figure 5-4. The alar LFC Swings for the blood donors, before and after blood loss.

113
0
500
1000
1500
2000
2500
3000
3500
4000
Before After
High Medium Low Figure 5-5. The finger LFC Swings for the blood donors, before and after blood loss.
0
10000
20000
30000
40000
50000
60000
Before After
High Medium Low Figure 5-6. The alar LFC Swings for the HD patients, before and after HD.

114
0
500
1000
1500
2000
2500
3000
3500
4000
4500
Before After
High Medium Low Figure 5-7. The finger LFC Swings for the HD patients, before and after HD.
R2 = 0.2902
R2 = 0.3018
0
20
40
60
80
100
120
140
0 20000 40000 60000 80000Alar LFC Swings
Est
imat
ed In
trat
hora
cic
Pres
sure
Cha
nge
per
Bre
ath
(cm
H2O
)
Figure 5-8. Estimated intrathoracic pressure change per breath vs alar LFC Swings in
blood donors, before blood loss.

115
R2 = 0.3449
R2 = 0.415
0
20
40
60
80
100
120
140
0 20000 40000 60000 80000 100000 120000
Alar LFC Swings
Est
imat
ed In
trat
hora
cic
Pres
sure
Cha
nge
per
Bre
ath
(cm
H2O
)
Figure 5-9. Estimated intrathoracic pressure change per breath vs alar LFC Swings in
blood donors, after blood loss.
R2 = 0.1984
R2 = 0.2593
0
20
40
60
80
100
120
140
0 2000 4000 6000 8000 10000
Finger LFC Swings
Est
imat
ed In
trat
hora
cic
Pres
sure
Cha
nge
per
Bre
ath
(cm
H2O
)
Figure 5-10. Estimated intrathoracic pressure change per breath vs finger LFC Swings in
blood donors, before blood loss.

116
R2 = 0.3005
R2 = 0.3132
0
20
40
60
80
100
120
140
0 2000 4000 6000 8000 10000
Finger LFC Swings
Est
imat
ed In
trat
hora
cic
Pres
sure
Cha
nge
per
Bre
ath
(cm
H2O
)
Figure 5-11. Estimated intrathoracic pressure change per breath vs finger LFC Swings in
blood donors, after blood loss.
R2 = 0.0318
R2 = 0.1227
0
10
20
30
40
50
60
70
80
0 20000 40000 60000 80000 100000 120000 140000 160000
Alar LFC Swings
Est
imat
ed In
trat
hora
cic
Pres
sure
Cha
nge
per
Bre
ath
(cm
H2O
)
Figure 5-12. Estimated intrathoracic pressure change per breath vs alar LFC Swings in
HD patients, before HD.

117
R2 = 0.0128
R2 = 0.2308
0
10
20
30
40
50
60
70
80
0 20000 40000 60000 80000 100000 120000 140000 160000
Alar LFC Swings
Est
imat
ed In
trat
hora
cic
Pres
sure
Cha
nge
per
Bre
ath
cmH
2O)
Figure 5-13. Estimated intrathoracic pressure change per breath vs alar LFC Swings in
HD patients, after HD
R2 = 0.162
R2 = 0.1529
0
10
20
30
40
50
60
70
80
0 1000 2000 3000 4000 5000 6000
Finger LFC Swings
Est
imat
ed In
trat
hora
cic
Pres
sure
Cha
nge
per
Bre
ath
(cm
H2O
)
Figure 5-14. Estimated intrathoracic pressure change per breath vs finger LFC Swings in
HD patients, before HD.

118
R2 = 0.2803
R2 = 0.2175
0
10
20
30
40
50
60
70
80
0 2000 4000 6000 8000 10000
Finger LFC Swings
Est
imat
ed In
trat
hora
cic
Pres
sure
Cha
nge
per
Bre
ath
(cm
H2O
)
Figure 5-15. Estimated intrathoracic pressure change per breath vs finger LFC Swings in
HD patients, after HD.
0
5000
10000
15000
20000
25000
30000
35000
High Medium Low
Before Blood Loss After Blood Loss Figure 5-16. The alar LFC Swings of the blood donors, before and after blood loss.

119
0
500
1000
1500
2000
2500
3000
3500
4000
High Medium Low
Before Blood Loss After Blood Loss Figure 5-17. The finger LFC Swings of the blood donors, before and after blood loss.
0
10000
20000
30000
40000
50000
60000
High Medium Low
Before HD After HD Figure 5-18. The alar LFC Swings of the HD patients, before and after HD.

120
0
500
1000
1500
2000
2500
3000
3500
4000
4500
5000
High Medium Low
Before HD After HD Figure 5-19. The finger LFC Swings of the HD patients, before and after HD.
0
500
1000
1500
2000
2500
3000
3500
4000
Alar Finger
Before Blood Loss After Blood Loss Figure 5-20. The alar and finger PCC MagDiff in blood donors, before and after blood
loss.

121
0
1000
2000
3000
4000
5000
6000
7000
8000
Alar Finger
Before HD After HD Figure 5-21. The alar and finger PCC MagDiff in HD patients, before and after HD.
0
50000
100000
150000
200000
250000
300000
350000
400000
450000
Alar Finger
Before Blood Loss After Blood Loss Figure 5-22. The alar and finger PCC MagMean in blood donors, before and after blood
loss.

122
0
100000
200000
300000
400000
500000
600000
700000
Alar Finger
Before HD After HD Figure 5-23. The alar and finger PCC MagMean in HD patients, before and after HD.
0
10
20
30
40
50
60
Before After
L /
Min
High Medium Low Figure 5-24. The peak inspiratory flow rates in the blood donors, before and after blood
loss.

123
0
5
10
15
20
25
30
35
40
45
Before After
L /
Min
High Medium Low Figure 5-25. The peak expiratory flow rates in the blood donors, before and after blood
loss.
0.00
0.20
0.40
0.60
0.80
1.00
1.20
1.40
Before After
L
High Medium Low Figure 5-26. The respiratory volumes in the blood donors, before and after blood loss.

124
0
10
20
30
40
50
60
Before After
L /
Min
High Medium Low Figure 5-27. The peak inspiratory flow rates in the HD patients, before and after HD.
0
5
10
15
20
25
30
35
40
45
Before After
L /
Min
High Medium Low Figure 5-28. The peak expiratory flow rates in the HD patients, before and after HD.

125
0.00
0.20
0.40
0.60
0.80
1.00
1.20
1.40
1.60
Before After
L
High Medium Low Figure 5-29. The respiratory volumes in the HD patients, before and after HD.
0
10
20
30
40
50
60
High Medium Low
L /
Min
Before Blood Loss After Blood Loss Figure 5-30. The peak inspiratory flow rates of the blood donors for all three levels of
respiratory resistance.

126
0
5
10
15
20
25
30
35
40
45
3.5 4 5.5
L /
Min
Before Blood Loss After Blood Loss Figure 5-31. The peak expiratory flow rates of the blood donors for all three levels of
respiratory resistance.
0.00
0.20
0.40
0.60
0.80
1.00
1.20
1.40
High Medium Low
L
Before Blood Loss After Blood Loss Figure 5-32. The respiratory volumes of the blood donors for all three levels of
respiratory resistance.

127
0
10
20
30
40
50
60
High Medium Low
L /
Min
Before HD After HD Figure 5-33. The peak inspiratory flow rates of the HD patients for all three levels of
respiratory resistance.
0
5
10
15
20
25
30
35
40
45
3.5 4 5.5
L /
Min
Before HD After HD Figure 5-34. The peak expiratory flow rates of the HD patients for all three levels of
respiratory resistance.

128
0.00
0.20
0.40
0.60
0.80
1.00
1.20
1.40
1.60
High Medium Low
L
Before HD After HD Figure 5-35. The respiratory volume of the HD patients for all three levels of respiratory
resistance.
66
68
70
72
74
76
78
80
82
High Medium Low
Before Blood Loss After Blood Loss Figure 5-36. The pulse rate of the blood donors for all three levels of resistance.

129
60
70
80
90
100
110
120
130
Systolic Diastolic
Before Blood Loss After Blood Loss Figure 5-37. The seated blood pressure of the blood donors for all three levels of
resistance.
66
68
70
72
74
76
78
80
82
84
86
High Medium Low
Before HD After HD Figure 5-38. The pulse rate of the HD patients for all three levels of resistance.

130
40
50
60
70
80
90
100
110
120
130
140
Systolic Diastolic
Before HD After HD Figure 5-39. The seated blood pressure of the HD patients for all three levels of
resistance.
0
5000
10000
15000
20000
25000
30000
35000
40000
High BeforeBlood Loss
MediumBefore Blood
Loss
Low BeforeBlood Loss
High AfterBlood Loss
Medium AfterBlood Loss
Low AfterBlood Loss
First 2 Breath Data > Breath 2 Data Figure 5-40. A comparison between the alar LFC Swings from the first two breaths and
subsequent breaths in the blood donors, before and after blood loss.
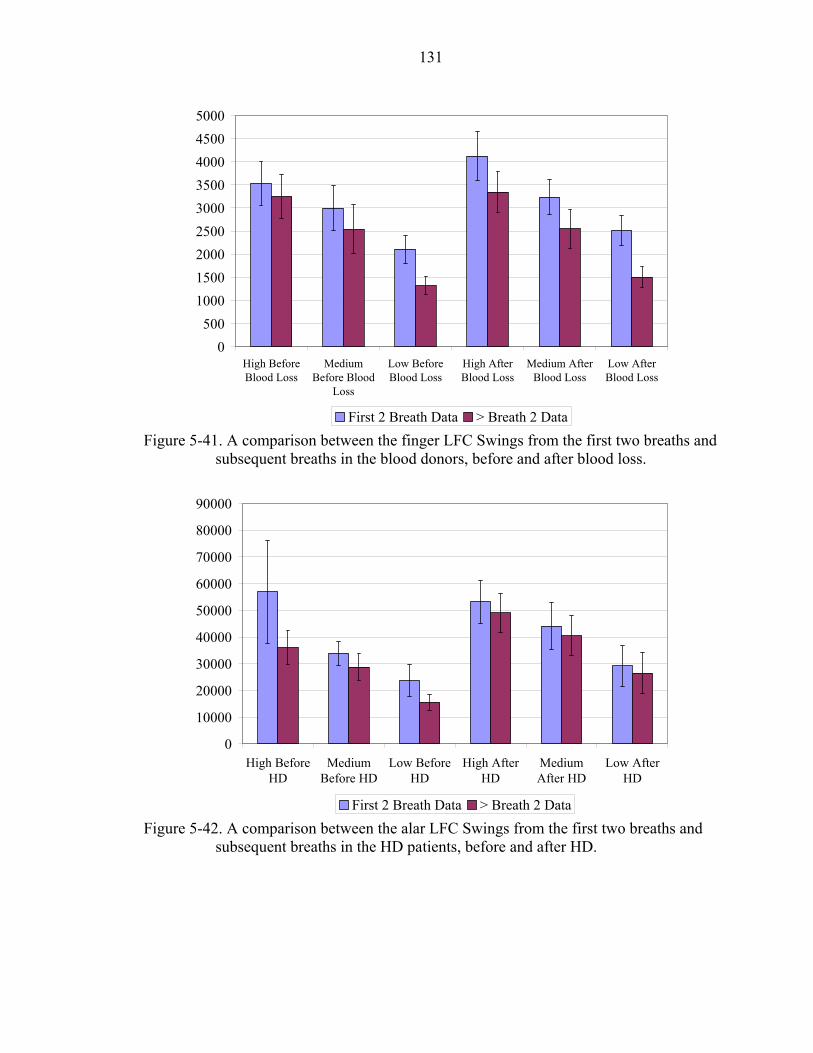
131
0500
100015002000250030003500400045005000
High BeforeBlood Loss
MediumBefore Blood
Loss
Low BeforeBlood Loss
High AfterBlood Loss
Medium AfterBlood Loss
Low AfterBlood Loss
First 2 Breath Data > Breath 2 Data Figure 5-41. A comparison between the finger LFC Swings from the first two breaths and
subsequent breaths in the blood donors, before and after blood loss.
0
10000
20000
30000
40000
50000
60000
70000
80000
90000
High BeforeHD
MediumBefore HD
Low BeforeHD
High AfterHD
MediumAfter HD
Low AfterHD
First 2 Breath Data > Breath 2 Data Figure 5-42. A comparison between the alar LFC Swings from the first two breaths and
subsequent breaths in the HD patients, before and after HD.

132
0
1000
2000
3000
4000
5000
6000
High BeforeHD
MediumBefore HD
Low BeforeHD
High AfterHD
MediumAfter HD
Low AfterHD
First 2 Breath Data > Breath 2 Data Figure 5-43. A comparison between the finger LFC Swings from the first two breaths and
subsequent breaths in the HD patients, before and after HD.
0
5000
10000
15000
20000
25000
30000
35000
40000
High Medium Low
Before Blood Loss After Blood Loss Figure 5-44. The alar LFC Swings from the first two breaths of the blood donors, before
and after blood loss.
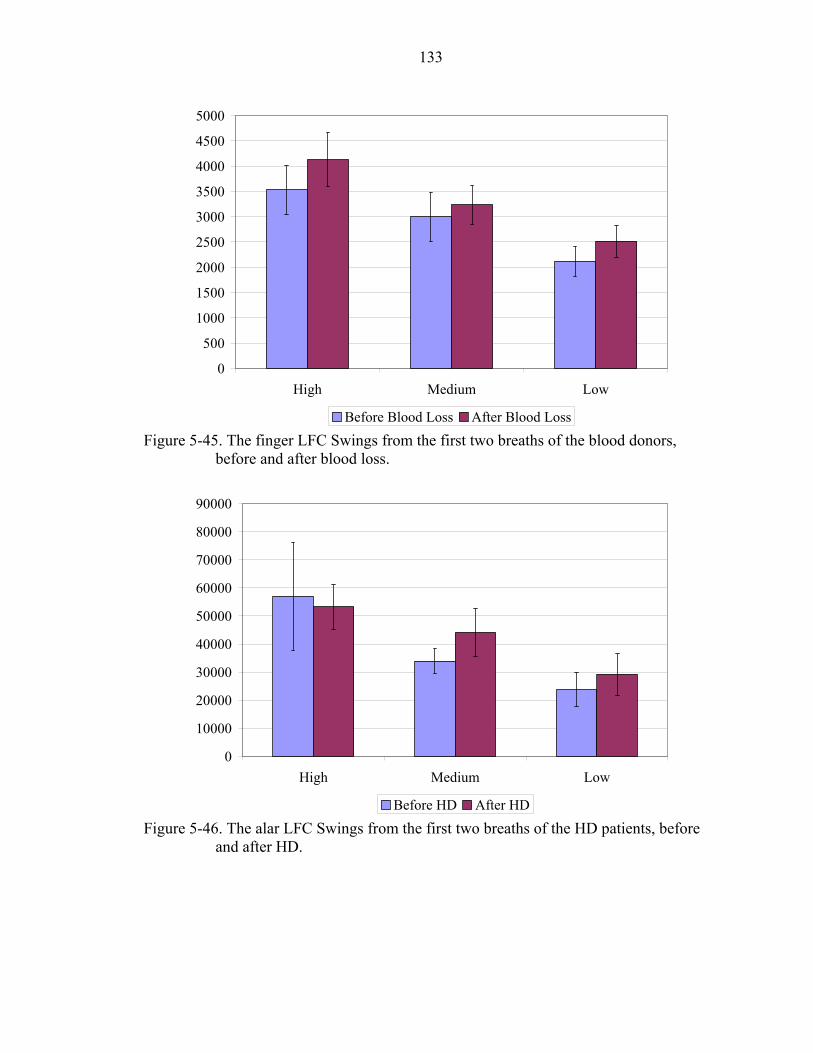
133
0
500
1000
1500
2000
2500
3000
3500
4000
4500
5000
High Medium Low
Before Blood Loss After Blood Loss Figure 5-45. The finger LFC Swings from the first two breaths of the blood donors,
before and after blood loss.
0
10000
20000
30000
40000
50000
60000
70000
80000
90000
High Medium Low
Before HD After HD Figure 5-46. The alar LFC Swings from the first two breaths of the HD patients, before
and after HD.

134
0
1000
2000
3000
4000
5000
6000
High Medium Low
Before HD After HD Figure 5-47. The finger LFC Swings from the first two breaths of the HD patients, before
and after HD.
R2 = 0.0206
R2 = 0.0358
0
500
1000
1500
2000
2500
3000
3500
4000
4500
5000
-100000 -50000 0 50000 100000
LFC Swings After HD - LFC Swings Before HD
Flui
d R
emov
ed (m
l)
Figure 5-48. Ultrafiltrate removed vs alar LFC Swings in the HD patients for the high
resistance level.

135
R2 = 0.0014
R2 = 0.0255
0
500
1000
1500
2000
2500
3000
3500
4000
4500
5000
-40000 -20000 0 20000 40000 60000 80000 100000
LFC Swings After HD - LFC Swings Before HD
Flui
d R
emov
ed (m
l)
Figure 5-49. Ultrafiltrate removed vs alar LFC Swings in the HD patients for the medium
resistance level.
R2 = 0.0096
R2 = 0.0458
0
500
1000
1500
2000
2500
3000
3500
4000
4500
5000
-20000 0 20000 40000 60000 80000
LFC Swings After HD - LFC Swings Before HD
Flui
d R
emov
ed (m
l)
Figure 5-50. Ultrafiltrate removed vs alar LFC Swings in the HD patients for the low
resistance level.

136
R2 = 0.0111
R2 = 0.0532
0.00
1.00
2.00
3.00
4.00
5.00
6.00
7.00
-100000 -50000 0 50000 100000
LFC Swings After HD - LFC Swings Before HD
Flui
d R
emov
ed a
s a P
erce
nt o
f Bod
y W
eigh
t
Figure 5-51. Ultrafiltrate removed as a percent of body weight vs alar LFC Swings in the
HD patients for the high resistance level.
R2 = 0.0021
R2 = 0.0033
0.00
1.00
2.00
3.00
4.00
5.00
6.00
-40000 -20000 0 20000 40000 60000 80000 100000
LFC Swings After HD - LFC Swings Before HD
Flui
d R
emov
ed a
s a P
erce
nt o
f Bod
y W
eigh
t
Figure 5-52. Ultrafiltrate removed as a percent of body weight vs alar LFC Swings in the
HD patients for the medium resistance level.

137
R2 = 0.0017
R2 = 0.0029
0.00
1.00
2.00
3.00
4.00
5.00
6.00
-20000 0 20000 40000 60000 80000
LFC Swings After HD - LFC Swings Before HD
Flui
d R
emov
ed a
s a P
erce
nt o
f Bod
y W
eigh
t
Figure 5-53. Ultrafiltrate removed as a percent of body weight vs alar LFC Swings in the
HD patients for the low resistance level.
R2 = 0.0035
R2 = 0.0734
0.00
1.00
2.00
3.00
4.00
5.00
6.00
7.00
8.00
9.00
-4000 -3000 -2000 -1000 0 1000 2000 3000 4000 5000PCC MagDiff Before Blood Loss - PCC MagDiff After Blood Loss
Est
imat
ed B
lood
Vol
ume
(L)
Figure 5-54. Estimated blood volume vs alar PCC MagDiff in the blood donors for the
low resistance level.

138
R2 = 0.0786
R2 = 0.3156
0.00
1.00
2.00
3.00
4.00
5.00
6.00
7.00
8.00
9.00
-400000 -200000 0 200000 400000 600000PCC MagMean Before Blood Loss - PCC MagMean After Blood Loss
Est
imat
ed B
lood
Vol
ume
(L)
Figure 5-55. Estimated blood volume vs alar PCC MagMean in the blood donors for the
low resistance level.
CHAPTER 6 CLINICAL SIGNIFICANCE AND INDIVIDUAL SUBJECT ANALYSIS
Statistical and Clinical Significance
Statistical significance is affected by the sample size, intersubject variability, and
the presence of outliers. It does not imply clinical relevance. Various parameters, both
physiologic and nonphysiologic, affect the photoplethysmograph (PPG). When the PPG
is divided into the low frequency component (LCF) and pulsatile cardiac component
(PCC), the physiologic parameters affecting both are easily explored.
The two main contributors to the PCC are the stroke volume and arterial
compliance. Factors affecting stroke volume include preload, afterload, and contractility.
Factors affecting the preload include venous return, mitral insufficiency, mitral stenosis,
aortic insufficiency, fluid volume, medications, posture, and intrathoracic pressure (Topol
et al. 2002). Factors affecting the afterload include aortic valve stenosis, peripheral
constriction, hypertension, polycythemia, medications, vasoconstriction due to
temperature, and intrathoracic pressure. Factors affecting contractility include
medications, sympathetic tone, hypercalcemia, hypoxia, hypercapnia, and heart disease.
Factors affecting arterial compliance include age, hypertension, sympathetic tone,
medications, impedance by venous blood or edema, and temperature.
The LFC represents venous blood; hence anything affecting the movement of
venous blood affects the LFC. These factors include blood pressure, gravity, valves, the
skeletal muscle pump, respiratory pump, sympathetic tone, venous blood volume, and
venous compliance.
139

140
Nonphysiologic factors affecting the LFC and PCC include artifact caused by
subject or probe movement, excessive light interference and 60 Hz interference. For each
individual subject, most these factors were controlled and did not change.
The PPG data obtained from the finger is very prone to confounding variables.
The finger PPG is sensitive to the positioning of the hand relative to the heart. Slight
positional adjustments of the hand may result in large compartmental shifting of pooled
blood, affecting the LFC and PCC. Additionally, the hands are particularly sensitive to
the affects of ambient temperature and local blood flow is moderated accordingly. These
variables were not controlled in this study. Even though several statistical analyses
showed significance in the finger comparisons, individual subject finger analyses were
not performed due to the possible presence of additional confounding variables that were
not controlled for and can not be identified. Additionally, it is suspected that central sites
will be the future of PPG monitoring; hence the alar was the focus of this analysis.
Finally, the individual finger data was excluded for the sake of brevity.
Individual Analysis
Hypothesis 1
The LFC Swings differed statistically across the three levels of resistance. This
indicates that the LFC could potentially be used to detect major airway resistance
changes in a variety of patient populations. The data for each individual subject for each
population were explored for trends.
Of the factors affecting the LFC, only changes in the intrathoracic pressure caused
by the respiratory pump varied in this study. Since this comparison was made for each
subject individually, and the position of the subject was constant during the breathing

141
study, blood pressure, gravity caused by position, venous valves, the skeletal muscle
pump, sympathetic tone and venous compliance were all constant.
First, individual data for the three resistance levels were compared for trends in all
blood donors and HD patients. The intersubject variability was high in the alar LFC
Swings of the blood donors and HD patients. Possible causes of this variability include
thickness of the alar, pigmentation of skin, and light emitting diode (LED) power of the
pulse oximeter probe. Subjects with a thin alar, or those who were not darkly pigmented,
required a power of <50 for proper functionality of the LED. Other subjects required the
maximum LED power of 254. Additionally, the placement of the alar probe affects the
baseline amount of light striking the photodiode (PD), affecting the LFC. To eliminate
these variables, the alar probes were secured with adhesive tape. Assuming each probe
was in the same position for the duration of each breathing study, these variables would
be controlled for in each individual subject. Intersubject variability, however, would still
be high. Changes in the positioning of the probe causes changes in the LED power,
hence the LED power was monitored. Any shifting in the alar probe not causing LED
power change was deemed insignificant.
Overall, the alar LFC Swings decreased with decreasing resistance. In subject 9,
the LFC Swings for the low level of resistance were greater than the medium level of
resistance (Figure 6-1). Of the 40 total comparisons, there were 11 instances of
unexpected results in the blood donors (Figure 6-2) and in the HD patients (Figure 6-3).
In HD patient 13, the alar LFC Swings behaved opposite to what was expected
following HD and as expected before HD. Also, of the 40 total subjects from both
142
populations, only three had alar LFC Swings that behaved unexpectedly both before and
after fluid loss.
To understand why certain subjects behaved differently from the majority of the
others, several follow-up analyses were conducted. First, the inspiratory and expiratory
flow rates were analyzed for trends (Figure 6-4). The relationship between the peak
respiratory flow rates and volumes and the LFC Swings for each individual subject was
explored. The alar LFC Swings of blood donor subject 9 behaved differently from the
other nine subjects (Figure 6-1). The peak inspiratory flow was most likely not the cause
(Figure 6-4). In several of the individual breathing studies the flow rates and volumes
were consistent and in others they differed. The reasons for the unusual LFC Swing data
in subject 13 and in all other subjects whose data behaved differently were not caused by
variations in the respiratory flow rates or volumes.
Each breathing study lasted only several minutes, yet in several cases the LED
power of the alar probe changed, indicating a shift of the alar probe. Of the 80 total
analyses, the LED power changed during a breathing study in 18 of them. Of the 18,
only six occurred in subjects whose LFC Swing data behaved inconsistently. Of the 22
breathing studies whose data was inconsistent, the LED power changed in six of them.
Based on these results it is unlikely that changes in the LED power affected the LFC
Swings. It does affect the baseline light striking the photodetector but does not change
the low frequency change in light striking the photodetector caused by the respiratory
resistance.
In summary, the differences in the three levels of resistance were statistically
significant. Of the 80 individual analyses, 72% of the results were expected, with the

143
LFC Swings decreasing as resistance decreased. This indicates that on a per-subject
basis, the LFC Swings can be used to detect major changes in respiratory resistance with
corresponding changes in intrathoracic pressure. In 28% of the individual studies, the
LFC Swings in at least one of the resistance levels did not decrease with decreasing
resistance. The reasons for these individual variations are unclear but do not seem to be
caused by changes in respiratory flow or volumes, or changes in LED power. Although
these individual aberrations did not affect the statistical significance of the populations,
they do create the need for follow-up studies to identify their cause when considering the
development of a clinical device.
Hypothesis 2
The intrathoracic pressure changes, as estimated by Equation 3-3, did not
statistically correlate with the LFC Swings. The intersubject variability was the main
reason for this lack of relationship. The high resistance LFC Swings in some subjects
was approximately equal to the low resistance LFC Swings in other subjects. While each
individual subject may have behaved as expected, the variability between subjects caused
a failure to show an overall relationship.
For each subject, the before and after fluid loss states were analyzed separately.
For this analysis the individual breath data was not averaged. This resulted in
approximately ten breaths of data for each resistance level, both before and after fluid
loss. A plot of the first blood donor is shown (Figure 6-5). Each data point represents the
LFC Swing of an individual breath. There are three groups of data points present, each
group representing a different resistance level. There was nearly a significant
relationship. This analysis was performed for the 20 blood donors and 20 HD patients
both before and after fluid loss. The results are presented (Tables 6-1 and 6-2) where the

144
numbers represent the number of analyses that fell within that range of R2 values. In the
blood donors and HD patients, approximately half resulted in R2 values < .5 with very
few being > .8.
The LFC Swing analysis presented is not sensitive enough to reproducibly
correlate with the estimated intrathoracic pressure changes per breath as estimated by the
Equation 3-3. This is possibly due to the inapplicability of the equation in human
subjects. Future studies should measure esophageal pressure, an estimate of intrathoracic
pressure, and compare these measurements to LFC Swings in different patient
populations.
Hypothesis 3
The LFC Swings increased significantly in the HD patients and did not change in
the blood donors. Since this comparison occurred between breathing studies that took
place several hours apart, the following factors may have affected the LFC: blood
pressure, sympathetic tone, and venous blood volume. Also, due to the extended
duration, the alar probe is likely to have shifted. For these comparisons, the resistance
levels being compared were the same, hence the intrathoracic pressure and respiratory
pump were kept constant.
To investigate the potential clinical utility of the alar LFC Swings for determining
fluid loss in individual subjects, an analysis on a per-subject, descriptive basis in the HD
patients was conducted. The alar LFC Swings before HD were compared the alar LFC
Swings after HD, for each level of resistance, for each subject. A sample plot is shown
(Figure 6-6).
Following HD, for the high resistance level, the alar LFC Swings of 11 of the
subjects increased, five decreased, and four did not change. For the medium resistance

145
level, the alar LFC Swings increased in nine, decreased in two and did not change in
nine. For the low level of resistance the alar LFC Swings increased in eight, decreased in
three, and did not change in nine. Additionally, the following trends were identified:
• The alar LFC Swings of subject 13 were considerably larger than all other subjects for all resistance levels, yet the finger LFC Swings were smaller than most other subjects.
• Also in subject 13, the alar LFC Swings decreased after HD at the highest
resistance level and increased after HD at the medium and low resistance levels.
• Subjects 6 and 17 had alar LFC Swings that decreased following HD
through all three resistance levels.
• Subject 16 had a very large increase in LFC Swings following HD in all three resistance levels.
• Seven of the 20 subjects had alar LFC Swings that increased after HD
across all three resistance levels.
The peak inspiratory and expiratory flow rates were compared before and after
HD. No differences were found for most subjects for all resistance levels. In subjects 1
and 20, the peak inspiratory flow rates before HD were greater than after HD, for all three
resistance levels. The expiratory flow rate was also smaller after HD in subject 20,
across all levels of resistance. No obvious relationship existed between inspiratory or
expiratory flow and alar LFC Swings as the LFC Swings of subjects 1 and 20 did not
behave inconsistent with the other subjects.
Next, the total respiratory volumes were analyzed. In subject 8, the respiratory
volume decreased following HD, while in subject 20 it increased. In all other subjects
the respiratory volumes were consistent before and after HD. The respiratory volume did
not have a consistent affect on the LFC Swings in the HD patients.

146
The volume of fluid removed during HD varied greatly between subjects. No
direct relationship existed between the volume of fluid removed and the magnitude of the
LFC Swings. This relationship was further explored on an individual subject basis for
trends. The subjects with the largest percentage of fluid removed were 12, and 15.
Those with the least percentage of fluid removed were 7 and 9. This does not explain any
of the trends found in the LFC Swings.
Following HD, systolic and diastolic blood pressures were analyzed for each
subject individually. The systolic blood pressure decreased by at least 10 mmHg in 14 of
the 20 subjects. The systolic blood pressure increased by at least 10 mmHg in subjects 1
and 13. The diastolic blood pressure decreased by at least 10 mmHg in nine of the
subjects and increased by more than 10 mmHg in subject 4. The systolic blood pressure
increased in subject 13, who also had LFC Swings that behaved inconsistent with other
subjects. The systolic pressure also increased in subject 1, whose LFC Swings behaved
as expected. There were no clear trends between changes in blood pressure and changes
in the LFC.
The PCC MagDiff and PCC MagMean were analyzed for trends and for a
relationship to the LFC Swings. These were plotted for each HD patient individually.
There were no statistical differences before and after HD in either of these variables. In
most individual subjects the PCC MagDiff did not change following HD. Subjects 3, 13
and 16 increased while subject 18 decreased after HD.
Unlike the PCC MagDiff, the PCC MagMean of many of the subjects did change
following HD but many increased while many others decreased, resulting in no statistical
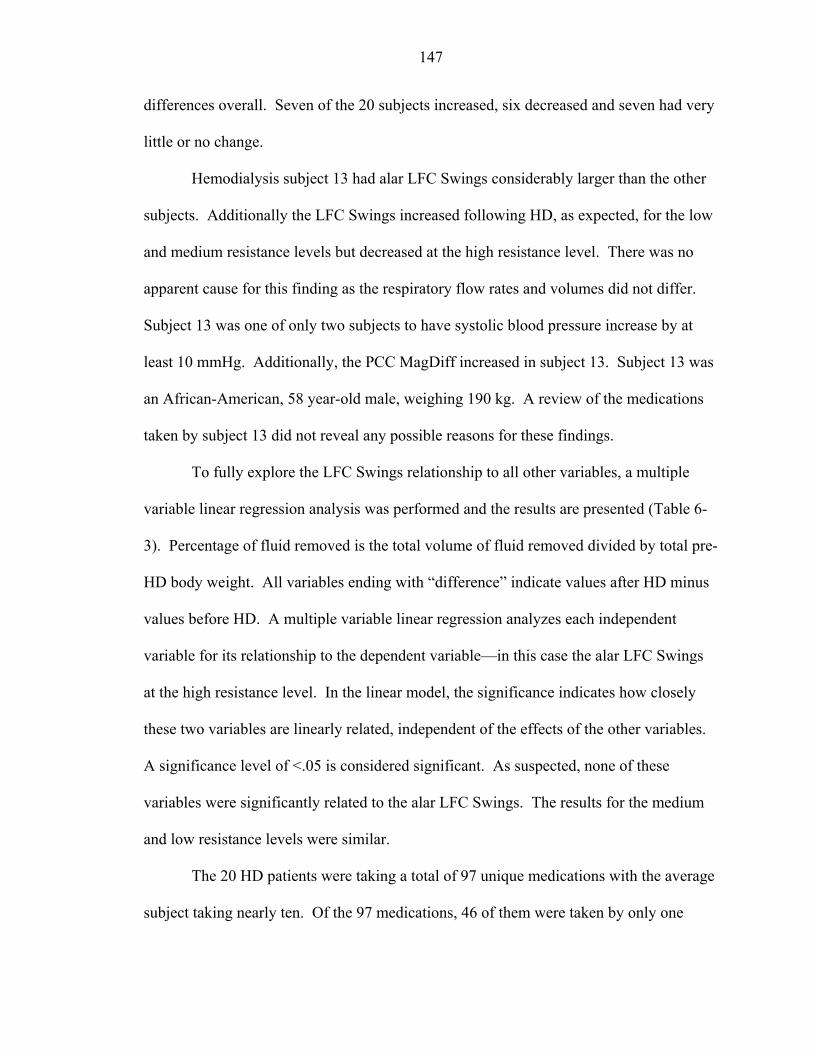
147
differences overall. Seven of the 20 subjects increased, six decreased and seven had very
little or no change.
Hemodialysis subject 13 had alar LFC Swings considerably larger than the other
subjects. Additionally the LFC Swings increased following HD, as expected, for the low
and medium resistance levels but decreased at the high resistance level. There was no
apparent cause for this finding as the respiratory flow rates and volumes did not differ.
Subject 13 was one of only two subjects to have systolic blood pressure increase by at
least 10 mmHg. Additionally, the PCC MagDiff increased in subject 13. Subject 13 was
an African-American, 58 year-old male, weighing 190 kg. A review of the medications
taken by subject 13 did not reveal any possible reasons for these findings.
To fully explore the LFC Swings relationship to all other variables, a multiple
variable linear regression analysis was performed and the results are presented (Table 6-
3). Percentage of fluid removed is the total volume of fluid removed divided by total pre-
HD body weight. All variables ending with “difference” indicate values after HD minus
values before HD. A multiple variable linear regression analyzes each independent
variable for its relationship to the dependent variable—in this case the alar LFC Swings
at the high resistance level. In the linear model, the significance indicates how closely
these two variables are linearly related, independent of the effects of the other variables.
A significance level of <.05 is considered significant. As suspected, none of these
variables were significantly related to the alar LFC Swings. The results for the medium
and low resistance levels were similar.
The 20 HD patients were taking a total of 97 unique medications with the average
subject taking nearly ten. Of the 97 medications, 46 of them were taken by only one

148
subject. All subjects except 11, 13 and 20 take at least one medication unique to
themselves. Many different medications within the same class are often prescribed,
explaining this finding. For example, only subject 5 was taking atenolol however other
subjects were taking metoprolol. Due to the number of different drugs taken by the HD
patients, attributing specific LFC changes to specific drugs is virtually impossible.
Interesting to note, however, is that subject 13, is one of the few subjects not taking a
drug prescribed only to him.
Finally, the LED power was reviewed and analyzed for changes. Due to the
duration of the HD sessions, the LED power of the alar probe changed in virtually all
subjects. The LED power increased in several of the subjects and decreased in several
other subjects. In subject 13, the LED power only changed from 76 before HD to 86
after HD. No trends could be identified as specific causes for the LFC Swing changes.
In summary, there were statistical differences between the alar LFC Swings of the
HD patients, before and after HD. The individual subject analysis revealed many
interesting findings but the reasons for these finding were elusive. The alar LFC Swings
increased in approximately 50% of the subjects so individual clinical monitoring of HD
patients for fluid loss requires follow up studies to fully understand the reasons why the
alar LFC swings changed the way they did.
Hypotheses 4 and 5
Hypotheses 4 and 5 explored the affects of fluid loss on the PCC of the PPG. In
blood donors, the alar PCC MagDiff and PCC MagMean both decreased after blood loss
whereas in the HD patients they did not change. This is in contrast to the LFC Swings,
which increased in HD patients and not in blood donors. Individual subject analyses for

149
the PCC MagDiff and PCC MagMean of the blood donors were performed (Figures 6-8
and 6-9).
The alar PCC MagDiff decreased significantly after blood loss. Individually, the
PCC MagDiff decreased in 14 of the subjects. The alar PCC MagMean decreased
significantly after blood loss and decreased in 14 subjects as well. As expected, the two
PCC variables mirrored each other very well. Subjects 5, 8 and 14 were the most
interesting. The PCC variables both increased after blood loss in subjects 5 and 14. In
subject 8 the PCC variables had unusually large values, but decreased, as expected.
Several variables contributed to changes in the PCC following fluid loss,
including venous return, fluid volume, vasoconstriction due to temperature, intrathoracic
pressure, sympathetic tone, and impedance by venous blood or edema. Vasoconstriction
due to temperature and sympathetic tone mainly affect the PPG from the finger and
should not affect the PPG from the alar. Intrathoracic pressure is constant since the
comparison of the PCC variables is between the same resistance level. The main factors
contributing to the changes in the PCC should therefore be venous return and venous
impedance, both affected by total blood volume, which also directly affects the PCC.
The PCC variables decreased in most blood donors, indicating their potential
utility for monitoring blood loss. In several subjects, however, the PCC variables either
increased or did not change.
The peak inspiratory and peak expiratory flow rates were evaluated before and
after blood loss (Figure 6-10). The peak expiratory flow rates were nearly identical. In
all subjects, the flow rates before and after blood loss were within 10 L/min of each other
with most being within 5 L/min. Subjects 5, 8 and 14 do not show any trends that could

150
explain their unusual findings. Subject 14 did have inspiratory and expiratory after blood
loss greater than before blood loss, however other subjects without unusual findings did
as well.
Next, the total respiratory volumes were analyzed for all 20 blood donors (Figure
6-11). In subject 14, the respiratory flow rates and volumes increased following blood
loss, potentially explaining the reason for the inconsistent findings in the PCC variables.
During blood donation approximately 500 ccs of whole blood was removed from
all donors, regardless of weight. The option for “double red blood cells” was available
and two of the blood donors chose this option. During double donation approximately
360 cc’s of packed red blood cells was removed with approximately 500 cc’s of saline
plus all plasma returned to the subject. Subjects 1 and 11 underwent a double donation
procedure, and while they each lost double red blood cells, they actually experienced a
slight net gain in total fluid. Both of these subjects had a decrease in PCC variables
following this donation procedure and both had either no change or a slight increase in
the LFC Swings.
Subjects 1 and 11 had the largest percentage of red blood cells removed due to the
double donation. Subjects 5, 8 and 14 had smaller than average percentage of blood
removed so the interesting findings associated with these three subjects are not
attributable to the volume of blood lost.
The pulse rate affects the PCC variable calculations in several ways. When heart
rate increases, the stroke volume decreases to maintain a constant cardiac output. In the
blood donors subjects it was shown that the pulse rate did not change statistically across
all subjects. An individual subject analysis was performed to analyze trends.

151
The blood donor average pulse rate before and after blood loss is shown (Figure 6-
13). The pulse rate was stable in all subjects with only subjects 4 and 18 experiencing a
pulse rate increase of 10 and 12 beats per minute, respectively. The systolic and diastolic
blood pressures were very similar. Only subjects 6, 9, 16 and 20 had a decrease in
systolic blood pressure of greater than 10 mmHg and only subject 1 had an increase in
diastolic blood pressure greater than 10 mmHg with no subjects having a greater than 10
mmHg drop in diastolic blood pressure following blood loss. It is not likely that pulse
rate variation or changes in blood pressure attributed to PCC variable variation.
The LFC Swings of the blood donors did not change statistically following blood
loss. The LFC Swings of the individual subjects were explored for trends (Figure 6-14).
The high and medium resistance levels show very similar results, while at the low
resistance, several subjects experienced a decrease in alar LFC Swings following blood
loss. Subjects 5 and 14 both had PCC variables that increased following blood loss and
the alar LFC Swings of these two subjects also increased. Additionally, subject 8 had
very large PCC variables and also had very large LFC Swings. While the fact that the
LFC Swings behaved in a fashion similar to the PCC variables does not attribute
causality it does solidify trends and supports physiologic believability.
A multiple variable linear regression analysis was then performed for the PCC
MagDiff and the PCC MagMean variables (Table 6-4). Percent red blood cells removed
is the total estimated blood volume divided by the volume of red blood cells removed.
All variables ending with “difference” indicate values after blood loss minus values
before blood loss. A multiple variable linear regression analyzes each independent
variable for its relationship to the dependent variable—in this case the alar PCC MagDiff.

152
In the linear model, the significance indicates how closely these two variables are linearly
related, independent of the effects of the other variables. A significance level of <.05 is
generally considered significant. As suspected from the descriptive analyses presented
above, none of the variables were significantly related to the PCC MagDiff, however the
alar LFC Swings at the high resistance level showed the best overall relationship as
indicated by the smallest significance value.
The alar LFC Swings at the medium level of resistance were significantly related to
the alar PCC MagMean while at the high level of resistance the alar LFC Swings were
trending towards significance. This indicates a near linear relationship between the
difference in alar LFC Swings and difference in alar PCC MagMean. Most blood donors
experienced no change in alar LFC Swings and a decrease in the PCC MagMean
following blood loss. In several subjects, however, both variables increased, partially
explaining this relationship. The reasons why the physiology of these subjects was
different from the remaining subjects can not be determined.
Lastly, the LED power was explored for changes before and after blood loss. Of
the 20 blood donors, nine had LED power after blood loss slightly different from before
blood loss. Several of the subjects had an increase in LED power and several had a
decrease. The most likely cause of the change in LED power is slight shifting of the
probe during blood donation. There appears to be no relationship between the LED
power and the PCC variables.
In summary there were statistical differences between the alar PCC variables of
the blood donors before and after blood loss. The individual subject analysis revealed
many interesting findings but the reasons for these finding were elusive. The PCC

153
variables decreased in approximately 70% of the subjects, so individual clinical
monitoring of whole blood loss is a possibility.
Table 6-1. The R2 values for the regression analysis between estimated intrathoracic pressure changes and alar LFC Swings for the blood donors.
R2 Linear Secondary < 0.3 11 7 0.3 – 0.5 11 10 0.5 – 0.8 15 19 > 0.8 3 4
Table 6-2. The R2 values for the regression analysis between estimated intrathoracic pressure changes and alar LFC Swings for the HD patients.
R2 Linear Secondary < .3 12 10 .3 - .5 10 10 .5 - .8 17 18 > .8 1 2
Table 6-3. Multiple variable regression analysis for the alar LFC Swings during high
resistance for the HD patients. Variable Significance Height 0.785 Weight 0.881 Age 0.767 Fluid Removed 0.694 Percent Fluid Removed 0.791 Systolic Pressure Difference 0.443 Diastolic Pressure Difference 0.688 Pulse Rate Difference 0.541 Inspiratory Flow Difference 0.693 Expiratory Flow Difference 0.973 Respiratory Volume Difference 0.303 PCC MagDiff Difference 0.978 PCC MagMean Difference 0.492

154
Table 6-4. Multiple variable linear regression analysis for the alar PCC MagDiff for the blood donors.
Variable Significance Height 0.702 Weight 0.643 Age 0.817 Total Estimated Blood Volume 0.611 Red Blood Cells Removed 0.761 Percent Red Blood Cells Removed 0.709 Systolic Pressure Difference 0.920 Diastolic Pressure Difference 0.728 Pulse Rate Difference 0.803 Inspiratory Flow Rate Difference 0.801 Expiratory Flow Rate Difference 0.599 Volume Difference 0.489 Alar LFC Swings Difference High Resistance 0.273 Alar LFC Swings Difference Medium Resistance 0.382 Alar LFC Swings Difference Low Resistance 0.965
Table 6-5. Multiple variable linear regression analysis for the alar PCC MagMean for the
blood donors. Variable Significance Height 0.985 Weight 0.994 Age 0.953 Total Estimated Blood Volume 0.580 Red Blood Cells Removed 0.227 Percent Red Blood Cells Removed 0.191 Systolic Pressure Difference 0.863 Diastolic Pressure Difference 0.225 Pulse Rate Difference 0.449 Inspiratory Flow Rate Difference 0.708 Expiratory Flow Rate Difference 0.443 Volume Difference 0.172 Alar LFC Swings Difference High Resistance 0.101 Alar LFC Swings Difference Medium Resistance 0.032 Alar LFC Swings Difference Low Resistance 0.799

155
0
10000
20000
30000
40000
50000
60000
70000
80000
1 2 3 4 5 6 7 8 9 10Subject
HighMediumLow
Figure 6-1. The alar LFC Swings for all three resistance levels for the first ten blood
donors, before blood loss.
0
5000
10000
15000
20000
25000
30000
35000
9 Before
11Before
16Before
18Before
19Before
20Before
6 After
13After
16After
17After
19After
Subject
HighMediumLow
Figure 6-2. The unexpected alar LFC Swings for all three resistance levels for the blood
donors, both before and after blood loss.

156
0
20000
40000
60000
80000
100000
120000
140000
160000
6 Before
7 Before
9 Before
14Before
15Before
16Before
17Before
4 After
8 After
13After
16After
Subject
HighMediumLow
Figure 6-3. The unexpected alar LFC Swings for all three resistance levels for the HD
patients, both before and after HD.
0
10
20
30
40
50
60
1 2 3 4 5 6 7 8 9 10Subject
High Medium Low
Figure 6-4. The peak inspiratory flow rates for all three levels of resistance for the blood
donors, before blood loss.

157
R2 = 0.7516
R2 = 0.7645
0
20
40
60
80
100
120
0 5000 10000 15000 20000 25000 30000 35000
Alar LFC Swings
Est
imat
ed In
trat
hora
cic
Pres
sure
Cha
nge
per
Bre
ath
(cm
H2O
)
Figure 6-5. Estimated intrathoracic pressure changes per breath vs alar LFC Swings in
blood donor subject 1, after blood loss.
0
20000
40000
60000
80000
100000
120000
140000
160000
1 2 3 4 5 6 7 8 9 10 11 12 13 14 15 16 17 18 19 20Subject
Before HDAfter HD
Figure 6-6. The alar LFC Swings for the HD patients, both before and after HD.

158
0.00%
1.00%
2.00%
3.00%
4.00%
5.00%
6.00%
7.00%
1 2 3 4 5 6 7 8 9 10 11 12 13 14 15 16 17 18 19 20
Subject
Figure 6-7. Fluid removed as a percent of body weight in the HD patients.
0
2000
4000
6000
8000
10000
12000
1 2 3 4 5 6 7 8 9 10 11 12 13 14 15 16 17 18 19 20Subject
Before Blood LossAfter Blood Loss
Figure 6-8. The alar PCC MagDiff for the blood donors, both before and after blood loss.
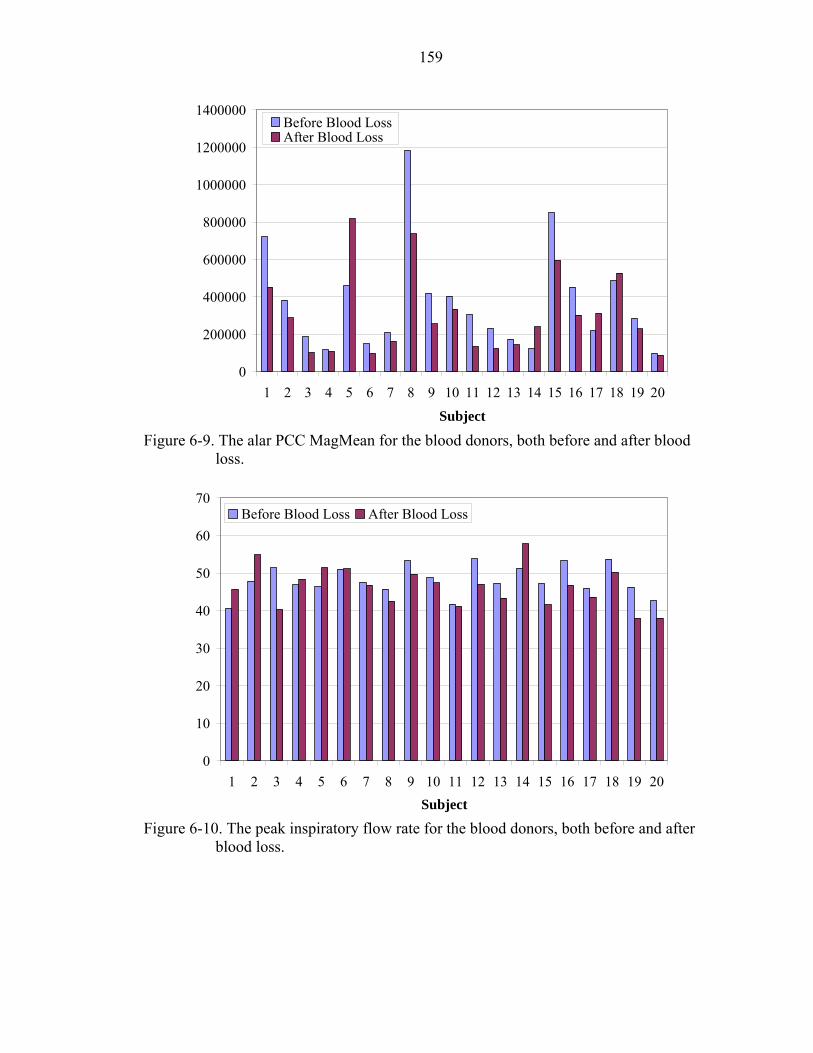
159
0
200000
400000
600000
800000
1000000
1200000
1400000
1 2 3 4 5 6 7 8 9 10 11 12 13 14 15 16 17 18 19 20
Subject
Before Blood LossAfter Blood Loss
Figure 6-9. The alar PCC MagMean for the blood donors, both before and after blood
loss.
0
10
20
30
40
50
60
70
1 2 3 4 5 6 7 8 9 10 11 12 13 14 15 16 17 18 19 20Subject
Before Blood Loss After Blood Loss
Figure 6-10. The peak inspiratory flow rate for the blood donors, both before and after
blood loss.

160
0.00
0.50
1.00
1.50
2.00
2.50
1 2 3 4 5 6 7 8 9 10 11 12 13 14 15 16 17 18 19 20Subject
Before Blood Loss After Blood Loss
Figure 6-11. The total respiratory volume for the blood donors, both before and after
blood loss.
0%
5%
10%
15%
20%
25%
1 2 3 4 5 6 7 8 9 10 11 12 13 14 15 16 17 18 19 20
Subject
Figure 6-12. The approximate percentage of red blood cells removed in the blood donors.

161
0
20
40
60
80
100
120
1 2 3 4 5 6 7 8 9 10 11 12 13 14 15 16 17 18 19 20Subject
Before Blood LossAfter Blood Loss
Figure 6-13. The pulse rate of the blood donors, both before and after blood loss.
0
20000
40000
60000
80000
100000
120000
1 2 3 4 5 6 7 8 9 10 11 12 13 14 15 16 17 18 19 20Subject
Before Blood LossAfter Blood Loss
Figure 6-14. The alar LFC Swings for the blood donors, both before and after blood loss.

CHAPTER 7 CONCLUSIONS
Summary of Conclusions
Hypothesis 1 explored the ability of the low frequency component (LFC) Swings to
detect changes in airway resistance in several different populations. Statistically
significant differences were found across all populations. Individually, 72% of the
subjects experienced changes in the LFC corresponding to the changes in airway
resistance, indicating the potential for individual patient monitoring.
Hypothesis 2, which was an extension of hypothesis 1, explored the sensitivity of
the LFC Swings for predicting intrathoracic pressure changes, as estimated by an
experimentally derived equation. No statistically significant relationship was found
between the estimated intrathoracic pressure change per breath and the LFC Swings.
Most individual subjects had a borderline significant relationship with R2 values between
0.5 and 0.8 with several being >0.8. Since Equation 3-3 was developed to the estimate
pressure drop across endotracheal tubes and does not take human variability into account,
it is possible that the equation may be the reason for the lack of relationship.
Hypotheses 3, 4 and 5 each explored various measures of the
photoplethysmograph (PPG) to detect either whole blood loss during blood donation or
ultrafiltrate loss during hemodialysis (HD). The HD patients had a statistically
significant increase in LFC Swings following HD and the blood donors had a statistically
significant decrease in pulsatile cardiac component (PCC) MagDiff and PCC MagMean
162

163
following blood loss. This important difference indicates the potential for the PPG to be
used to differentiate between whole blood loss and fluid loss.
Individually, approximately 50% of the HD subjects experienced an increase in
LFC Swings following HD and 72% of the blood donor subjects had a decrease in the
PCC variables following blood loss.
Clinical Relevance and Future Studies
Clinical Goal 1
The first broad clinical goal was to show that the PPG could be used to detect
changes in airway resistance and be used to estimate intrathoracic pressure changes.
Clinical uses include, but are not limited to, noninvasive diagnosis of severity of asthma
and detecting obstructive sleep apnea (OSA) and an estimating its severity.
The statistical and clinical results of hypothesis 1 indicate that it is possible to use
the LFC to detect major airway resistance changes in a variety of populations. For the
first broad clinical goal, asthmatic subjects are one of the target clinical populations of
interest.
The current standard of care for the monitoring of asthma includes monitoring
pulmonary function with spirometry and peak flow measurements (NAEPP 1997). There
is no standard for direct measurement of airway resistance. Identification of new
noninvasive measures of airway resistance for determining asthma severity is an active
area of research. Asthma severity is dictated by airway resistance, which is proportional
to the intrathoracic pressure changes with respiration. If the PPG derived noninvasively
from a pulse oximeter could reliably measure intrathoracic pressure changes, it may also
be an indicator of airway resistance and hence asthma severity.

164
If the LFC derived noninvasively from the PPG of an alar pulse oximeter probe
could differentiate major changes in airway resistance, it could either replace or
supplement the more traditional spirometry measures for the diagnosis and monitoring of
the severity of asthma. Asthmatic patients would first establish the LFC Swings for
normal, baseline breathing. They would then breathe through a series of endotracheal
(ET) tubes, creating resistance. Flow rates and volumes would be monitored and
controlled. The LFC Swings for each of these levels of resistance would be calculated to
establish the LFC Swings for that individual subject through the full range of airway
resistances. Whenever airway obstruction needed to be estimated, the LFC Swings could
be measured and compared to these established baseline values. Additionally, the
severity of an attack could be estimated using the LFC Swings as an indicator of major
airway obstruction.
LFC measurements currently have some limitations and would require validation
before meeting these clinical expectations. First, the alar probe placement and its affect
on the magnitude of the LFC Swings would need to be fully understood. In our study,
the alar probe was left in place for the duration of the comparisons. Removing and
replacing the probe hours, days, or even weeks apart may affect the LFC measurements.
As previously discussed, the exact placement of the probe on the alar affects the overall
LFC value, reflecting baseline light striking the photodiode (PD), but should not affect
the LFC Swings, which measure the shifting of venous blood.
A future study should explore the relationship between the alar probe placement
position and the magnitude of the LFC Swings. A very simple study design could be as
follows: recruit healthy volunteers to perform the breathing study previously outlined

165
(Chapter 4) while being monitored with an alar pulse oximeter probe. Move the alar
probe on the same nostril and repeat the breathing study. Have them come back one
week and one month later for repeated breathing studies. The LFC Swings should not
differ if the probe placement does not affect the LFC Swings.
When comparing LFC measures from the same individual several days or weeks
apart would be important to eliminate other confounding variables. Other possible
variables affecting the LFC could include time of day, autonomic activation, position of
subject, state of hydration, etc. In addition to evaluating the effect of the probe placement
on the alar, these other confounding variables should be evaluated independently and
understood.
The LFC Swings did not correlate with the intrathoracic pressure changes, as
estimated by equation 3-3. It is important to understand if the LFC could potentially be a
sensitive enough measure to predict precise levels of airway obstruction and intrathoracic
pressure changes. A future study should monitor a variety of subjects with esophageal
balloons to estimate intrathoracic pressure changes. Similar breathing studies should then
create a variety of intrathoracic pressure changes. The relationship between the LFC
Swings and the intrathoracic pressure changes should then be evaluated. Other analyses
of the LFC should be performed and other measures of the LFC may have a closer
relationship to the intrathoracic pressure than the LFC Swings, defined in our study.
The results presented (Chapters 5 and 6) show promise for the use of the LFC to
monitor airway obstruction and asthma severity. The lack of relationship between the
LFC Swings and the estimated intrathoracic pressure coupled with the lack of

166
understanding of many other variables that potentially affect the LFC necessitate the need
for follow-up studies to verify the feasibility of monitoring asthma severity with the PPG.
The second clinical population of interest includes OSA syndrome patients
including snoring, upper airway resistance syndrome (UARS) and OSA. Snoring is a
respiratory noise generated from the upper airway during sleep that may occur during
inspiration or expiration. A decrease in tone of the upper airway muscles results in
constriction of the ooropharynx and results in snoring. There is no standard measure of
snoring and it is often quantitated using a microphone and sound meter (Collop 2005).
UARS describes patients experiencing excessive daytime somnolence caused by
repetitive instances of increasingly negative intrathoracic pressure associated with upper
airway flow limitation. A noninvasive, simpler method to accurately measure respiratory
effort by measuring intrathoracic pressure changes would make diagnosis of UARS more
practical. Finally, OSA is a repetitive, partial or complete obstruction of the upper
airway during sleep, and is the most severe of the OSA syndromes. A more accurate
indicator of OSA severity is needed and is an active area of research.
The gold standard for diagnosing OSA remains the attended, overnight level I
polysomnogram (Pang and Terris 2006). Unfortunately, limited resources, including
limited number of recording beds, high cost, long waiting lists, and labor requirements
prevent diagnosis in a large portion of the population. Screening questionnaires and
devices have also been developed. The ideal screening device should be cheap, readily
accessible, easily used with minimal instructions, have no risks or side effects to the
patient and be safe and accurate (Pang and Terris 2006).

167
The LFC Swings from an alar pulse oximeter probe could either be used as a
supplemental measure with the standard overnight PSG or used in place of the PSG
entirely. The alar probe could be placed on the patient before going to sleep. While
sleeping, prior to the obstructive events occurring, the baseline LFC Swings could be
measured. The LFC Swings should then increase dramatically when the obstructive
events occur. To normalize the degree of obstruction, the patient could complete a
similar breathing study, as outlined above, and the LFC Swings created by these levels of
resistance could act as the control values for that subject.
Since the LFC Swings would be measured continuously in one night, the other
confounding variables, including probe placement, time of day, etc would be eliminated.
Comparing the degree of overnight obstruction to a baseline breathing study or
comparing them to values obtained from monitoring from prior nights would require a
full understanding of the variables discussed in the asthma section. For simple
comparisons to the nighttime baseline, pilot studies should take place. Patients should be
monitored with a full PSG, including an esophageal balloon, while being monitored with
an alar probe. The LFC Swings should be compared to the esophageal pressure values
and the other standard measures of obstruction severity. It would also be important to
understand the effects of shifting during sleep and sympathetic activation during dreams.
Using the LFC Swings from a centrally placed pulse oximeter probe to detect
major airway resistance changes in individual asthma subjects or during sleep in OSA
subjects is not too far away. To precisely estimate the exact degree of severity would
require several more key studies to determine feasibility.

168
Clinical Goal 2
The gold standard for monitoring volume status in critically ill patients is
pulmonary artery wedge pressure, or in its absence, central venous pressure. Other
means include heart rate, blood pressure, effects of mechanical ventilation on arterial
blood pressure and urine output. To explore the feasibility of using the PPG to detect
changes in fluid volume, two patient populations who lost a measurable amount of fluid
were explored.
The results of hypotheses 3, 4, and 5 indicate that it may be possible to use
various measures of the PPG to monitor clear fluid loss and whole blood loss and
possibly distinguish the difference between the two. Significant changes in the LFC
Swings of the HD patients were found following a physiologically significant fluid loss.
Following this fluid loss, however, there were no changes in the PCC variables, which
was initially unexpected. The blood donors did not lose a physiologically significant
amount of whole blood, evidenced by lack of change in blood pressure and pulse rate
following blood loss. The blood donors, did, however, experience a decrease in PCC
variables following blood loss. The contrasting results of the HD patients and blood
donors have important clinical implications. We hypothesize that the PPG differences
between the blood donors and HD patients is attributed to the volume and type of fluid
lost by each group.
The LFC represents changes in venous capacitance. Hemodialysis patients lost a
physiologically significant volume of fluid, evidenced by the increase in heart rate and
decrease in blood pressure. This fluid loss affected the venous capacitance and was
reflected in the LFC swings. Blood donors lost a physiologically insignificant volume of
blood resulting in no affect on venous capacitance and no change in the LFC swings.

169
The PCC is a measure of arterial blood flow. The PCC variables decreased
significantly in the blood donors. This was caused by the volume of red blood cells lost
during blood loss. The PPG is derived from the infrared (IR) light striking the PD. The
amount of the IR light striking the PD is mainly influenced by its absorption by the
oxygenated hemoglobin found in the red blood cells of arterial blood. This theory is
further supported by the lack of change in the PCC variables found in the HD patients,
who lost no red blood cells. While the stroke volume and cardiac output may have both
decreased following HD, the PCC variables did not change, as the total number of red
blood cells present remained constant.
Under some circumstances, the PCC amplitude may not purely reflect stroke
volume, as previously reported (Murray and Foster 1996), but may more closely reflect
the total number of red blood cells passing by the PD. If the stroke volume is cut in half
yet the concentration of red blood cells doubles, the PCC may not change. This
hypothesis deserves further elaboration. No previous research has explored the
differences between whole blood and ultrafiltrate fluid loss and how they affect the PPG.
These represent quite different causes of intravascular volume reduction and may allow
further insight into the PPG signal.
The differences in the LFC swings between the blood donor subjects and the HD
patients may also be caused by the differences in the compensatory mechanisms of the
populations. The smooth muscles in the veins control the capacitance of the venous
system. A variety of conditions inhibit the ability of this smooth muscle to appropriately
moderate capacitance by impairing sympathetic/parasympathetic activation. Since the
blood donors represent a generally healthy population, it is assumed that these

170
mechanisms are intact. The HD patients, on the other hand, are chronically ill and may
have an impaired ability to adequately moderate venous capacitance. The differences in
the LFC swings of the two populations may reflect the differences in the ability to
compensate for fluid loss. Further studies are needed to determine if the PPG can detect
these impairments.
It may be possible to use various measures of the PPG to differentiate ultrafiltrate
(or other causes of acellular fluid losses, such as diarrhea) and whole blood loss. This
may be valuable during monitoring of a wide variety of patients. It may also be possible
to detect impairment of physiologic compensation to fluid loss. With the alar probes,
motion artifact is generally minimal. Additionally, since the monitoring took place over
several hours, each patient acted as their own control over discrete monitoring periods.
Additional studies are needed to verify the above claims.
The main clinical population who could stand to benefit from a device used to
monitor whole blood or fluid loss is critically ill patients, who are receiving positive
pressure ventilation. The extent of the fluctuations caused by positive pressure
ventilation depend on central blood volume (Murray and Foster 1996). The PPG could
be incorporated into the ventilator and the LFC and PCC variables measured in real time.
The duration of the breaths would be known from the ventilator and used in the
calculations. If the subject being monitored experienced a sudden loss of fluid or blood,
the LFC Swings would increase or the PCC variables would decrease. An alarm
threshold can be set. If the increase or decrease is greater than a certain preset amount,
an alarm could sound alerting the nurse or physician to investigate possible fluid or blood
volume changes.

171
Since critically ill subjects are generally motionless, movement artifact and
positional changes are generally avoided. Additionally, since the monitoring would take
place over several hours, each patient would act as their own control for each individual
monitoring period. Additional studies are needed to verify the possibility of a device
such as this. First, the effect of positive pressure ventilation is different from the effects
of breathing through resistance. It would be important to fully understand the effects of
positive pressure ventilation on the PPG. Pilot studies should invasively monitor the
fluid status of critically ill subjects and compare these measures to the LFC and PCC
measures defined in our study.
The PPG derived from a pulse oximeter is a noninvasive window into various
physiologic parameters. The centrally derived PPG has many advantages over the more
traditional peripheral PPG and will become the standard for PPG monitoring. With these
studies as a foundation for future studies to build upon, many new clinical uses for the
PPG will surface. Monitoring the severity of asthma and OSA, and detecting blood and
fluid loss in critically ill subjects is just the tip of the iceberg of the clinical possibilities
of the PPG.

LIST OF REFERENCES
Al-Ali, A., Diab, M., Kiani, M., Kopotic, R. and Tobler, D. Stereo Pulse Oximeter. United States Patent Number 6,334,065. 2001.
Al-Ali, A., Diab, M., Kiani, M., Kopotic, R. and Tobler, D. Stereo Pulse Oximeter. United States Patent Number 6,898,452. 2005.
Allen, T., Peng, M., Chen, K., Huang, T., Chang, C and Fang, H. Prediction of Blood Volume and Adiposity in Man From Body Weight and Cube of Height. Metabolism. 1956; 5(3):328-45.
Aoyagi, T. Pulse Oximetry: Its Invention, Theory and Future. Journal of Anesthesia. 2003; 17:259-266.
Awad, A., Stout, R., Ghobashy, M., Rezkanna, H., Simverman, D and Shelley, K. Analysis of the Ear Pulse Oximeter Waveform. Journal of Clinical Monitoring and Computing. In Press, 2006.
Banner, M., Blanch, P. and Kirby, R. Imposed Work of Breathing and Methods of Triggering a Demand-Flow, Continuous Positive Airway Pressure System. Critical Care Medicine. 1993; 21(2):183-90.
Barleben, A., Muller, E., Wilke, A. and Vogel J. Lung Function Diagnosis Using Multi-Frequency Oscillometry with Reference to Lung Volume. Pneumologie. 1990; 44:950-4.
Basile, C. Should Relative Blood Volume Changes be Routinely Measured During the HD Session? Nephrology HD Transplant. 2001; 16:10-2.
Bhattacharya, J., Kanjilal, P. and Muralidhar, V. Analysis and Characterization of the Photo-Plethysmographic Signal. IEEE Tansactions on Biomedical Engineering. 2001; 48(1):5-11.
Boon D., van Montfrans, G., Koopman, M., Krediet, R. and Bos, W. Blood Pressure Response to Uncomplicated HD: The Importance of Changes in Stroke Volume. Nephron Clinical Practice. 2004; 96:c82-7.
Bortolotto, L., Blacher, J., Kondo, T., Takazawa, K. and Safar, M. Assessment of Vascular Aging and Atherosclerosis in Hypertensive Subjects: Second Derivative of Photoplethysmogram Versus Pulse Wave Velocity. American Journal of Hypertension. 2000; 13:165-71.
172

173
Chakravarti, I., Laha, R. and Roy, J. Handbook of Methods of Applied Statistics, Volume I, John Wiley and Sons. 1967:392-394.
Chowienczyk, P., Kelly, R., MacCallum, H., Millasseau, S., Andersson, T., Gosling, R., Ritter, J. and Anggard, E. Photoplethysmographic assessment of pulse wave reflection: blunted response to endothelium-dependent beta2-adrenergic vasodilation in type II diabetes mellitus. Journal of the American College of Cardiology. 1999; 34(7)2007-14.
Cogswell, J. Forced Oscillation Technique for Determination of Resistance to Breathing in Children. Archives of Disease in Childhood. 1973:48:259-66.
Collop, N. Obstructive Sleep Apnea Syndromes. Seminars in Respiratory and Critical Care Medicine. 2005; 26(1):13-24.
Converse, R., Jacobsen, T., Jost, C., Toto, R., Grayburn, P., Obregon, T., Fouad-Tarazi, F. and Victor, R. Paradoxical Withdrawal of Reflex Vasoconstricion as a Cause of HD-Induced Hypotension. Journal of Clinical Investigation. 1992; 90:1657-65.
Convertino, V., Ratliff, D., Ryan, K., Doerr, D., Ludwig, D., Muniz, G., Britton, D., Clah, S., Fernald, K., Ruiz, A., Lurie, K. and Idris, A. Hemodynamics Associated with Breathing Through an Inspiratory Impedance Threshold Device in Human Volunteers. Critical Care Medicine. 2004; 32(9):S381-6.
Coriat, P., Vrillon, M., Perel, A., Baron, J., Le Bret, F., Saada, M. and Viars, P. A Comparison of Systolic Pressure Variations and Echocardiographic Estimates of End-Diastolic Left Ventricular Size in Patients After Aortic Surgery. Anesthesia and Analgesia. 1994; 78:46-53.
Cucchiara, R. and Messick, J. The Failure of Nasal Plethysmography to Estimate Cerebral Blood Flow During Carotid Occlusion. Anesthesiology. 1981;55(5):585-6.
Daugirdas, J. Pathophysiology of HD Hypotension: An Update. American Journal of Kidney Disease. 2001; 38:S11-S17.
Daul, A., Wang, X., Michel, M. and Brodde, O. Arterial Hypotension in Chronic Hemodialyzed Patients. Kidney International. 1987; 32:728-35.
Dekker, J. Apparatus and Method for Monitoring Respiration with a Pulse Oximeter. United States Patent Number 6,709,402. 2004.
Donauer, J. and Bohler, J. Rationale for the Use of Blood Volume and Temperature Control Devices during HD. Kidney and Blood Pressure Research. 2003; 26:82-9.

174
Dubois, A., Botelho, S. and Comroe, J. A New Method for Measuring Airway Resistance in Man Using a Body Plethysmograph: Values in Normal Subjects and in Patients with Respiratory Disease. Journal of Clinical Investigation. 1956a; 35:327-35.
Dubois, A., Brody, A., Lewis, D. and Burgess, B. Oscillation Mechanics of Lungs and Chest in Man. Journal of Applied Physiology. 1956b; 8:587-94.
Ducharme, F. and Davis, G. Measurement of Respiratory Resistance in the Emergency Department: Feasibility in Young Children with Acute Asthma. Chest. 1997; 11:1519-25.
Ducharme, F. and Davis, G. Respiratory Resistance in the Emergency Department: A Reproducible and Responsive Measure of Asthma Severity. Chest. 1998; 113:1566-72.
Duiverman, E., Clement, J., van de Woestijne, K., Neijens, H,, van den Bergh A. and Kerrebijn K. Forced Oscillation Technique: Reference Values for Resistance and Reactance Over a Frequency Spectrum of 2-26 Hz in Healthy Children Aged 2.3-12.5 Years. Bulletin of European Physiopathology of Respiration. 21:171-8.
Esforzado, A., Cases, A., Bono, I., Gaya, B., Calls, G. and Rivera, F. Autonomic Nervous System and Adrenergic Receptors in Chronic Hypotensive HD Patients. Nephrology HD Transplant. 1997; 12:939-44.
Ezri, T., Lurie, S., Konichezky, A. and Soroker, D. Pulse Oximetry from the Nasal Septum. Journal of Clinical Anesthesia. 1991; 3:447-50.
Fichter, J., Wilkens, J. and Fabel, H. Oscillatory Measurement of Airway Resistance with the Custo Vit in Comparison with Oscillaire and Whole Body Plethysmography. Pneumologie. 1989; 43:382-6.
Foo, J., and Wilson, S. Estimation of Breathing Interval from the Photoplethysmographic Signals in Children. Physiological Measurements. 2005; 26(6):1049-58.
Frey, B. and Butt, W. Pulse Oximetry for Assessment of Pulsus Paradoxus: A Clinical Study in Children. Intensive Care Medicine. 1998; 24:242-6.
Goldie, E. Device for Continuous Indication of Oxygen Satuaration of Circulating Blood in Man. Journal of Scientific Instrumentation. 1942; 19:23-25.
Goldman, J., Petterson, M., Kopotic, R. and Barker S. Masimo Signal Extraction in Pulse Oximetry. Journal of Clinical Monitoring and Computing. 2000; 16:475-83.
Goodman, J. Physiological Signal Monitoring System. United States Patent Number 6,616,613. 2003.

175
Grace, R. Pulse Oximetry: Gold Standard or False Sense of Security? The Medical Journal of Australia. 1994; 160(10):638-44.
Groveman, J., Cohen, D. and Dillon, J. Rhinoplethysmography: Pulse Monitoring at the Nasal Septum. Anesthesia and Analgesia. 1966; 45(1):63-8.
Guilleminault, C., Stoohs, R., Clerk, A., Cetel, M. and Maistros, P. A Cause of Daytime Sleepiness: The Upper Airway Resistance Syndrome. Chest. 1993; 104:781-7.
Guttmann, J., Kessler, V., Mols, G., Hentsche,l R., Haberthur, C. and Geiger K. Continuous Calculation of Intratracheal Pressure in the Presence of Pediatric Endotracheal Tubes. Critical Care Medicine, 28(4) 1018-26, 2000.
Haba-Rubio, J., Darbellay, G., Herrmann, F., Frey, J., Fernandes, A., Vesin, J., Thiran, J. and Tschopp, J. Obstructive Sleep Apnea Syndrome: Effect of Respiratory Events and Arousal on Pulse Wave Amplitude Measured in NREM Sleep. Sleep and Breathing. 2005; 9:73-81.
Hadjikoumi, I., Hassan, A. and Milner, A. Effects of Respiratory Timing and Cheek Support on Resistance Measurements, Before and After Bronchodilation in Asthmatic Children Using the Interrupter Technique. Pediatric Pulmonology. 2003; 36:495-501.
Hartert, T., Wheeler, A. and Sheller, J. Use of Pulse Oximetry to Recognize Severity of Airflow Obstruction in Obstructive Airway Disease: Correlation to Pulsus Paradoxus. Chest. 1999; 115:475-81.
Heitmiller, E. and Wetzel, R. Hemodynamic Monitoring: Considerations in Pediatric Critical Care. In: Rogers, M. (ed). Textbook of Pediatric Intensive Care. Williams and Wilkins, Baltimore, 1996; 609.
Hertzman A. Photoelectric Plethysmography of the Fingers and Toes in Man. Proceedings of the Society of Experimental Biology and Medicine. 1937a; 37:529.
Hertzman A. Photoelectric Plethysmography of the Nasal Septum in Man. Proceedings of the Society of Experimental Biology and Medicine. 1937b; 37:290.
Hoffstein, V. Is Snoring Dangerous to Your Health? Sleep. 1996; 506-16.
Hoppe-Seyler, F. Uber die chemischen und optischen Eigenschaffen des Blutfarbstoffs. Archives of Pathological Anatomy and Physiology. 1864; 29:233-51.
Hu, F., Willet, W., Manson, J., Colditz, G., Rimm, E., Speizer, F., Hennekens, C. and Stampfer, M. Snoring and Risk of Cardiovascular Disease in Women. Journal of the American College of Cardiology. 2000; 35:308-13.

176
Ishibe, S. and Peixoto, A. Methods of Assessment of Volume Status and Intercompartmental Fluid Shifts in HD Patients: Implications in Clinical Practice. Seminars in HD. 2004; 17(1):37-43.
Johansson, A. Neural Network for Photoplethysmographic Respiratory Rate Monitoring. Medical and Biological Engineering & Computing. 2003; 41:424-8.
Jost, C., Agarwal, R., Khair-el-Din, T., Grayburn, P., Victor, R. and Henrich, W. Effects of Cooler Temperature Dialysate on Hemodynamic Stability in ‘Problem’ HD Patients. Kidney International. 1993; 44:606-12.
Jubran, A. Pulse Oximetry. Critical Care. 1999; 3:R11-R17.
Kato, R., Sato, J., Iuchi, T. and Higuchi, Y. Quantitative Determination of Arterial Wall Mechanics with Pulse Oximetric Finger Plethysmography. Journal of Anesthesia. 1999; 13:197-204.
Katz, J., Kraemer, R. and Gjerde, G. Inspiratory Work and Airway Pressure with Continuous Positive Airway Delivery Systems. Chest. 1988; 88:519-26.
Kersh, E., Kronfield, S., Unger, A., Popper, R., Cantor, S. and Cohn, K. Autonomic Insufficiency in Uremia as a Cause of HD-Induced Hypotension. New England Journal of Medicine. 1974; 290:650-3.
Kiani, M. Noninvasive Hypovolemia Monitor. United States Patent Application 20060058691. 2006.
Kooi, E., Schokker, S., van der Molen, T. and Duiverman, E. Airway Resistance Measurements in Pre-School Children with Asthmatic Symptoms: The Interruptor Technique. Respiratory Medicine. 2006; Epub Ahead of Print.
Kooman, J., Gladziwa, U., Bocker, G., van Bortel, L., van Hooff, J. and Leunissen, K. Role of the Venous System in Hemodynamics During Ultrafiltration and Bicarbonate HD. Kidney International. 1992; 42:718-26.
Koomans, H., Geers, A. and Mees, E. Plasma Volume Recovery After Ultrafiltration in Patients with Chronic Renal Failue. Kidney International. 1984; 26:848-54.
Krepel, H., Nette, R., Akcahuseyin, E., Weimar, W. and Zietse, R. Variability of Relative Blood Volume During HD. Nephrology HD Transplant. 2000; 15:673-9.
Lawless, S. Crying Wolf: False Alarms in a Pediatric Intensive Care Unit. Critical Care Medicine. 1994; 22:981-5.
Leonard, P., Beattie, T., Addison, P. and Watson, J. Standard Pulse Oximeters can be used to Monitor Respiratory Rate. Emergency Medical Journal. 2003; 20(6):524-5.

177
Leonard, P., Grubb, N., Addison, P., Clifton, D. and Watson, J. An Algorithm for the Detection of Individual Breaths from the Pulse Oximeter Waveform. Journal of Clinical Monitoring and Computing. 2004; 18:309-12.
Leonard, P., Douglas, J., Grubb, N., Clifton, D., Addison, P. and Watson, J. A Fully Automated Algorithm for the Determination of Respiratory Rate from the Photoplethysmogram. Journal of Clinical Monitoring and Computing. 2006; 20(1):33-6.
Leunissen, K., Kooman, J., van der Sande, F and van Kuijk, W. Hypotension and Ultrafiltration Physiology in HD. Blood Purification. 2000; 18:251-4.
Leypoldt, J., Cheung, A., Steuer, R., Harris, D and Conis, J. Determination of Circulating Blood Volume by Continuously Monitoring Hematocrit During HD. Journal of the American Society of Nephrology. 1995; 6:214-9.
Lilley, J., Golden, J. and Stone, R. Adrenergic Regulation of Blood Pressure in Chronic Renal Failure. Journal of Clinical Investigation. 1976; 57:1190-1200.
Lilliefors, H. On the Kolmogorov-Smirnov test for normality with mean and variance unknown. Journal of the American Statistical Association. 1967; 64:399-402.
Lurie, K., Voelckel, W., Plaisance, P., Zielinski, T., McKnite, S., Kor, D., Sugiyama, A. and Sukhum, P. Use of an Inspiratory Impedance Threshold Valve During Cardiopulmonary Resuscitation. Resuscitation. 2000a; 44:219-30.
Lurie, K., Zielinski, T., McKnite, S. and Sukhum, P. Improving the Efficiency of Cardiopulmonary Resuscitation with an Inspiratory Impedance Threshold Valve. Critical Care Medicine. 2000b; 28:N207-9.
Lurie, K., Zielinski, T., Voelckel, W., McKnite, S. and Plaisance, P. Augmentation of Ventricular Preload During Treatment of Cardiovascular Collapse and Cardiac Arrest. Critical Care Medicine. 2002a; 30:S162-5.
Lurie, K., Zielinski, T., McKnite, S., Aufderheide, T. and Voelckel, W. Use of an Inspiratory Impedance Valve Improves Neurologically Intact Survival in a Porcine Model of Ventricular Fibrillation. Circulation. 2002; 105:124-9.
Maggiore, Q., Pizzarelli, F., Zoccali, C., Sisca, S., Nicolo, F. and Parlongo, S. Effect of Extracorporeal Blood Cooling on Dialytic Arterial Hypotension. Proceedings of the European HD Transplant Association. 1981; 18:597-602.
Middleton, P. and Henry, J. Pulse Oximetry: Evolution and Directions. International Journal of Clinical Practice, 2000; 54(7):438-44.
Millasseau, S., Kelly, R., Ritter, J. and Chowienczyk, P. Determination of Age-Related Increases in Large Artery Stiffness by Digital Pulse Contour Analysis. Clinical Science. 2002; 103:371-77.

178
Millasseau, S., Kelly, R., Ritter, J, and Chowienczyk, P. The Vascular Impact of Aging and Vasoactive Drugs: Comparison of Two Digital Volume Pulse Measurements. American Journal of Hypertension. 2003; 16:467-72.
Millikan, G., Papenheimer, J. and Rawson A. Continuous Measurement of Oxygen Saturation in Man. American Journal of Physiology. 1941; 133:390.
Miro, A. and Pinsky, M. Cardiopulmonary Interactions. In: Fuhrmann, B. and Zimmerman, J. (eds). Pediatric Critical Care. Mosby, St Louis, 1992; 256.
Mitra, S., Chamney, P., Greenwood, R. and Farrington, K. Linear Decay of Relative Blood Volume During Ultrafiltration Predicts Hemodynamic Instability. American Journal of Kidney Disease. 2002; 40:556-65.
Moller, J., Johannessen, N., Espersen, K., Ravlo, O., Pedersen, B., Jensen, P., Rasmussen, N., Rasmussen, L., Pedersen, T. and Cooper J. Randomized Evaluation of Pulse Oximetry in 20,802 Patients: 1. Design, Demography, Pulse Oximetry Failure Rate and Overall Complication Rate. Anesthesiology. 1993; 78:436-44.
Morgan, B., Crawford, E and Guntheroth, W. The Hemodynamic Effects of Changes in Blood Volume During Intermittent Positive Pressure Ventilation. Anesthesiology. 1969; 30:297-305.
Murray, W. and Foster, A. The Peripheral Pulse Wave: Information Overlooked. Journal of Clinical Monitoring. 1996; 12:365-77.
National Asthma Education and Prevention Program (NAEPP). Expert Panel Report: Guidelines for the Diagnosis and Management of Asthma. National Institutes of Health pub no. 91-3642. 1991, Bethesda, MD.
National Asthma Education and Prevention Program (NAEPP). Expert Panel Report: Guidelines for the Diagnosis and Management of Asthma. National Institutes of Health pub no. 97-4051. 1997, Bethesda, MD.
Nilsson, L., Johansson, A. and Kalman, S. Monitoring of Respiratory Rate in Postoperative Care Using a New Photoplethysmographic Technique. Journal of Clinical Monitoring and Computing. 2000; 16:309-15.
Nilsson, L., Johansson, A. and Kalman, S. Respiratory Variations in the Reflection Mode Photoplethysmographic Signal. Relationships to Peripheral Venous Pressure. Medical and Biological Engineering & Computing. 2003; 41:149-54.
Nilsson, L., Johansson, A. and Kalman, S. Respiration can be Monitored by Photoplethysmography with High Sensitivity and Specificity Regardless of Anaesthesia and Ventilatory Mode. Acta Anaesthesiologica Scandinavica. 2005; 49:1157-62.

179
Oates, J. and Martin, D. Method and Apparatus for Non-Invasive Monitoring of Respiratory Parameters in Sleep Disordered Breathing. International Patent Number WO 2006/037184. 2006.
O’Leary, R., Landon, M., and Benumof, J, Buccal Pulse Oximeter is More Accurate than Finger Pulse Oximeter in Measuring Oxygen Saturation. Anesthesia and Analgesia. 1992; 75:495-8.
Officer, T., Pellegrino, R., Brusasco, V. and Rodarte, J. Measurement of Pulmonary Resistance and Dynamic Compliance with Airway Obstruction. Journal of Applied Physiology. 1998; 85(5):1982-8
Pagani, J., Villa, M., Calcagnini, G., Alterio, A., Ambrosia, R., Censi, F and Ronchetti, R. Pulse Transit Time as a Measure of Inspiratory Effort in Children. Chest. 2003; 124(4):1487-93.
Pang, K. and Terris, D. Screening for Obstructive Sleep Apnea: An Evidence-Based Analysis. American Journal of Otolaryngology. 2006; 27:112-8.
Partridge, B. Use of Pulse Oximetry as a Noninvasive Indicator of Intravascular Volume Status. Journal of Clinical Monitoring. 1987; 3:263-268.
Patil, S., Punjabi, N., Schneider, H, O’Donnell, C., Smith, P. and Schwartz, A. A Simplified Method for Measuring Critical Pressures During Sleep in the Clinical Setting. American Journal of Respiratory Critical Care Medicine. 2004; 170:86-93.
Perel, A., Pizov, R. and Cotev, S. Systolic Blood Pressure Variation is a Sensitive Indicator of Hypovolemia in Ventilated Dogs Subjected to Graded Hemorrhage. Anesthesiology. 1987; 67(4):498-502.
Perutz, M. The Haemoglobin Molecule. Proceedings of the Royal Society of London 1969; B173:113-40.
Pfenninger, J. Akute Obstruktion der oberen Atemwege: Epiglottis und Krupp-Syndrom. Padiatr Fortbildk Praxis. 1985; 59:121-31.
Pinsky, M. and Summer, W. Cardiac Augmentation by Phasic High Intra-Thoracic Pressure Support in Man. Chest. 1983; 84:370-5.
Pizov, R., Ya’ar, Y. and Perel, A. A Systolic Pressure Variation is Greater During Hemorrhage than During Sodium Nitroprusside Induced Hypotension in Ventilated Dogs. Anesthesia and Analgesia. 1988; 67:170-4.
Reich, D., Timcenko, A., Bodian, C., Kraidin, J., Hofman, J., DePerio, M., Konstadt, S., Kurki, T. and Eisenkraft, J. Predictors of Pulse Oximetry Data Failure. Anesthesiology. 1996; 84:859-64.

180
Rooke, G., Schwid, H. and Shapira, Y. The Effect of Graded Hemorrhage and Intravascular Volume Replacement on Systolic Pressure Variation in Humans During Mechanical and Spontaneous Ventilation. Anesthesia and Analgesia. 1995; 80:925-32.
Rouby, J., Rottembourg, J., Durande, J., Basset, J. and Legrain, M. Importance of the Plasma Refilling Rate in the Genesis of Hypovolemic Hypotension During Regular HD and Controlled Sequential Ultrafiltration-HD. Proceedings of the European HD and Transplant Association. 1978; 15:239-44.
Runciman, W., Webb, R., Barker, L. and Currie, M. The Australian Incident Monitoring Study: The Pulse Oximeter: Applications and Limitations: An Analysis of 2000 Incident Reports. Anesthesia and Intensive Care. 1993; 21:543-550.
Shamir, M., Eidelman, L.A., Floman, Y., Kaplan, L and Pizov, R. Pulse Oximetry Plethysmographic Waveform During Changes in Blood Volume. British Journal of Anaethesia. 1999; 2:178-81.
Shelley, K., Silverman, D., Shelley, A. and Stout, R. Method of Assessing Blood Volume Using Photoelecric Plethysmography. International Patent Number 2004/080300. 2004.
Sherman, R. Intradialytic Hypotension: An Overview of Recent, Unresolved and Overlooked Issues. Seminars in Hemodialysis. 2002; 15(3):141-3.
Simm, F. Polyfrequent Oscillometry Measurement of Airway Resistance Including the Associated Phase Angle. Pneumologie. 1989; 43:382-6.
Solymar, L., Landser, F. and Duiverman, E. Measurement of Resistance with the Forced Oscillation Technique. European Respiratory Journal. 1989; 2:150s-3s.
SPSS Base 14.0 Users Guide. 2005, SPSS Inc., Chicago, IL.
Stojceva-Taneva, O., Masin, G., Polenakovic, M., Stojcev, S and Stojkovski, L. Autonomic Nervous System Dysfunction and Volume Non-Responsive Hypotension in HD Patients. American Journal of Nephrology. 1991; 11:123-6.
Stokes, G. On the Reduction Oxygenation of the Colouring Matter of the Blood. Philosophical Magazine. 1864; 28:391.
Tonelli, M., Astephen, P., Andreou, P., Beed, S., Lundigran, P. and Jindal K. Blood Volume Monitoring in Intermittent HD for Acute Renal Failure. Kidney International. 2002; 62:1075-80.
Topol, E., Califf, R., Isner, J., Prystowsky, E., Swain, J., Thomas, J., Thompson, P., Young, J. and Nissen, S. Textbook of Cardiovascular Medicine. 2002, Lippincott Williams & Wilkins.

181
Trivedi, N., Ghouri, A., Shah, N., Lai, E. and Barker S. Effects of Motion, Ambient Light and Hypoperfusion on Pulse Oximeter Function. Journal of Clinical Anesthesia. 1997; 9:179-183.
Van der Sande, F., Kooman, J., Konings, C. and Leunissen, K. Thermal Effects and Blood Pressure Response During Postdilution Hemodiafiltration and HD: The Effect of Amount of Replacement Fluid and Dialysate Temperature. Journal of the American Society of Nephrology. 2001; 12:1916-20.
van Oostrom, J. and Melker, R. Comparative Testing of Pulse Oximeter Probes. Anesthesia and Analgesia. 2004; 98:1354-8.
Von Neergaard, K. and Wirz, K. Die Messung des Stromungswiderstande in dem Atemwegen des menschen, Insbesondere bei Asthma und Emphysema. Z Klin Med. 1927; 105:51-82.
Wallin, C., Rossi, P., Jacobson, S and Leksell, L. Central Blood Volume, Atrial Natiuretic Peptide and Intermittent HD. Scandinavian Journal of Urology and Nephrology. 2004; 38:78-84.
Welch, P. The Use of Fast Fourier Transform for the Estimation of Power Spectra: A Method Based on Time Averaging Over Short, Modified Periodograms. IEEE Transactions on Audio Electroacoustics. 1967; 15:70-3.
Wilcoxon, F. Individual comparisons by ranking methods. Biometrics. 1945; 1:80-83.).
Wood, E. and Geraei, J. Photoelectric Determination of Arterial Saturation in Man. Journal of Laboratory and Clinical Medicine. 1949; 34:387-401.
Young, T., Peppard, P. and Gottlieb, D. Epidemiology of Obstructive Sleep Apnea: A Population Health Perspective. American Journal of Respiratory Critical Care Medicine. 2002; 165:1217-39.

BIOGRAPHICAL SKETCH
Brian Scott Fuehrlein was born in 1977 and is originally from Oceanside, NY. He
graduated with honors from the University of Central Florida (Orlando) in 2000 with a
Bachelor of Science degree in industrial engineering. He was awarded the university-
wide most outstanding thesis and was the class of 2000 graduating industrial engineering
senior of the year. In 2001, Brian enrolled in the M.D./Ph.D. program at the University
of Florida and was named a University of Florida Alumni Fellow. Brian has completed 2
years of medical school and passed the first step of the United States Medical Licensing
Exam. Under the guidance of Richard J. Melker, Brian graduated with his Ph.D. in
Biomedical Engineering in 2006 and will return to complete the final 2 years of medical
school. Brian is married to Dianna Fuehrlein and together, they have a dog, T-Bone.
182