photocatalysis: fundamentals and applications - unito.it · ed elettrochimica . tio 2 electronic...
TRANSCRIPT

Elena Selli
Effects of surface modification and doping on
the photocatalytic activity of TiO2
DIPARTIMENTO DI CHIMICA FISICA
ED ELETTROCHIMICA

TiO2 electronic excitation
A + e-CB → A-•
O2 ads + eCB O2
ads
Reduction
D + h+VB → D+•
OHads + h+
VB OHads
Oxidation
A-•
D
Conduction band
Valence band
-
+
Eg
A
D+•
En
erg
y
hn
Recombination e-
CB + h+VB → heat
Main Applications
• Down-hill reactions, e.g. oxidative
degradation
• Up-hill reactions, e.g. water splitting
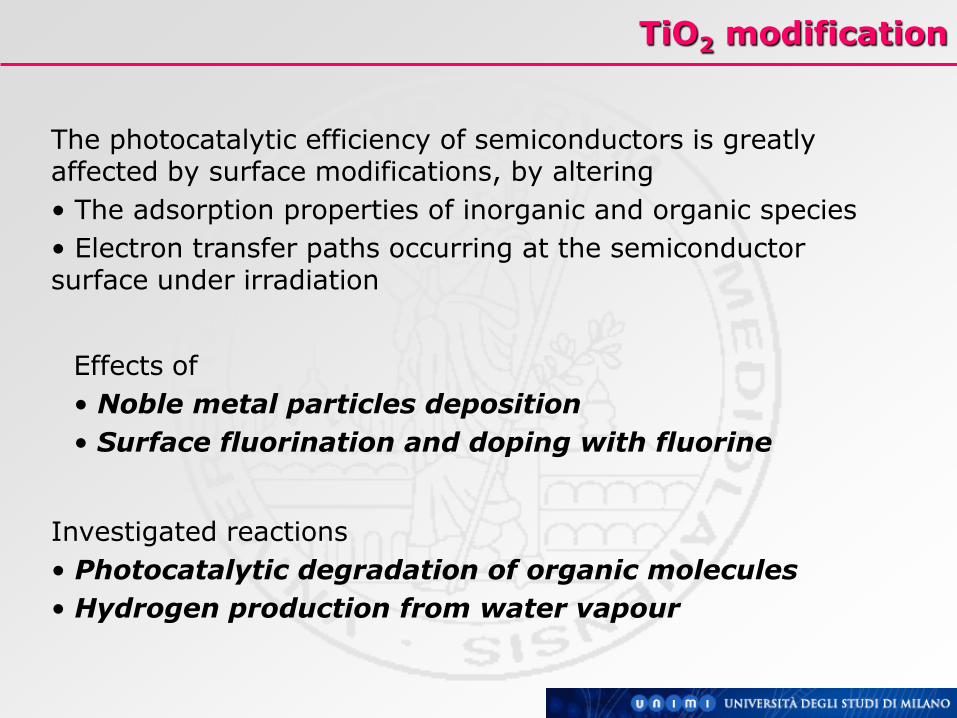
TiO2 modification
The photocatalytic efficiency of semiconductors is greatly affected by surface modifications, by altering
• The adsorption properties of inorganic and organic species
• Electron transfer paths occurring at the semiconductor surface under irradiation
Effects of
• Noble metal particles deposition
• Surface fluorination and doping with fluorine
Investigated reactions
• Photocatalytic degradation of organic molecules
• Hydrogen production from water vapour
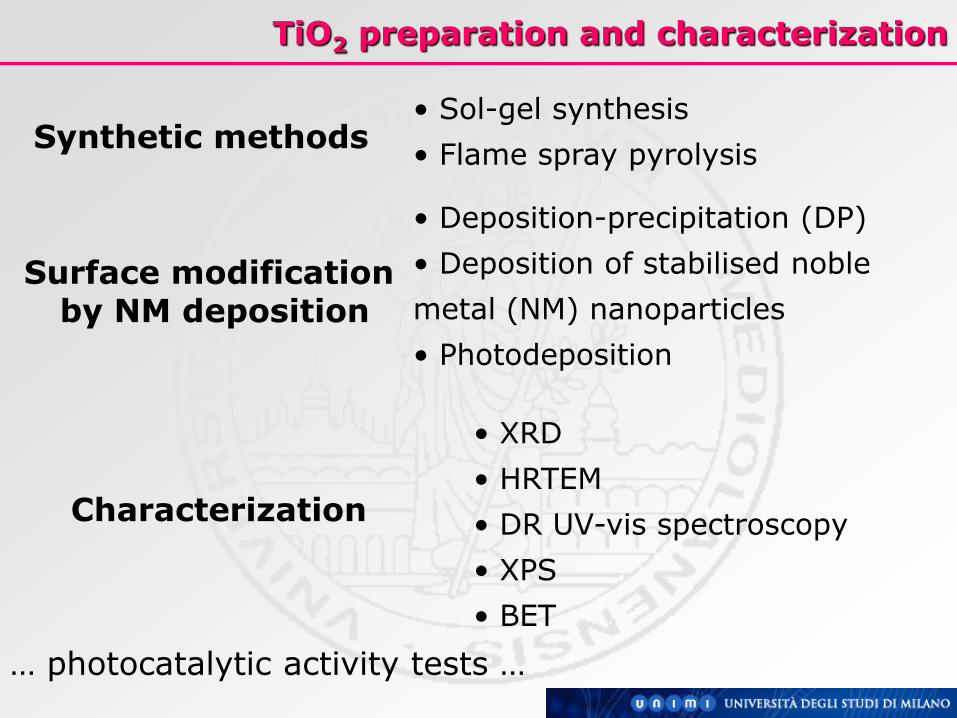
TiO2 preparation and characterization
Synthetic methods • Sol-gel synthesis
• Flame spray pyrolysis
• Deposition-precipitation (DP)
• Deposition of stabilised noble
metal (NM) nanoparticles
• Photodeposition
Characterization
• XRD
• HRTEM
• DR UV-vis spectroscopy
• XPS
• BET
… photocatalytic activity tests …
Surface modification by NM deposition
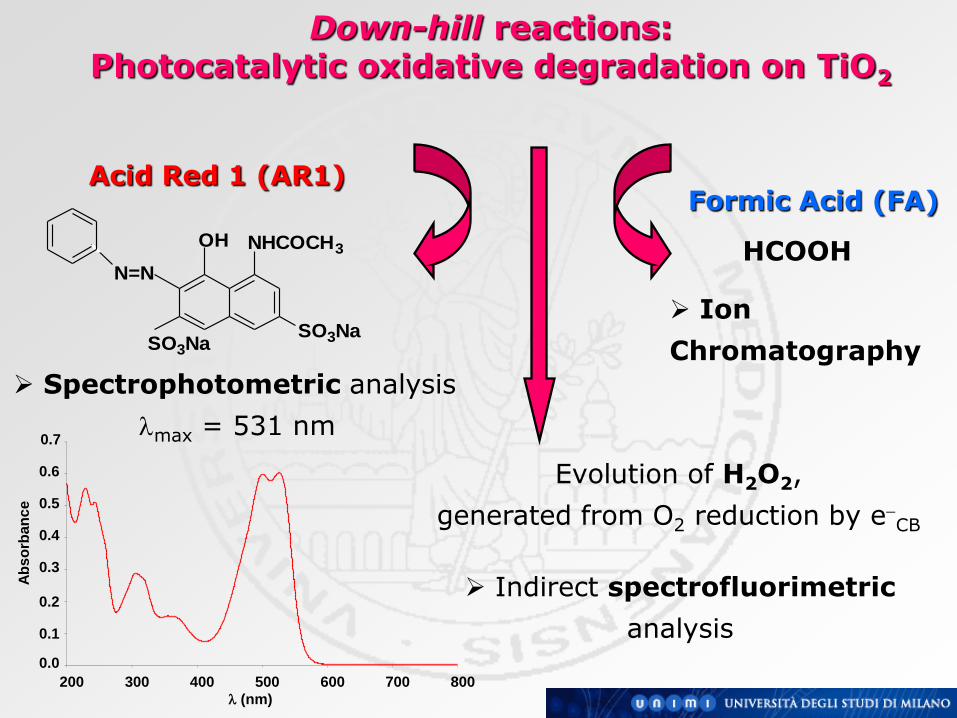
Acid Red 1 (AR1) Formic Acid (FA)
HCOOH OH NHCOCH3
SO3NaSO3Na
N=N
Evolution of H2O2,
generated from O2 reduction by eCB
Spectrophotometric analysis
lmax = 531 nm
Ion
Chromatography
Indirect spectrofluorimetric
analysis 0.0
0.1
0.2
0.3
0.4
0.5
0.6
0.7
200 300 400 500 600 700 800
l (nm)
Ab
so
rban
ce
Down-hill reactions: Photocatalytic oxidative degradation on TiO2
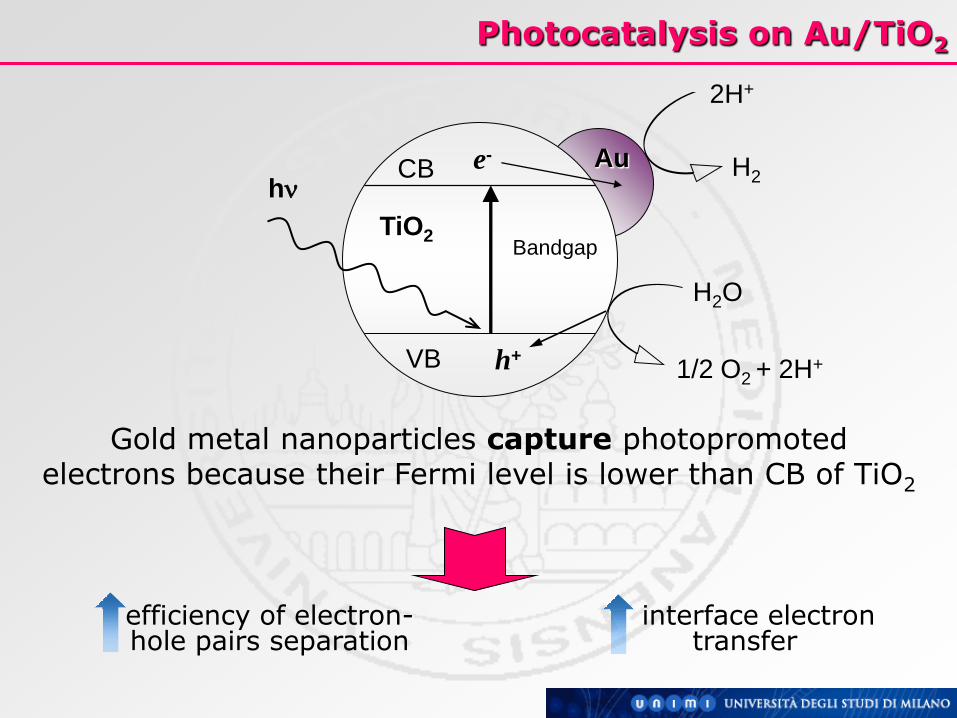
Photocatalysis on Au/TiO2
Gold metal nanoparticles capture photopromoted electrons because their Fermi level is lower than CB of TiO2
interface electron transfer
efficiency of electron-hole pairs separation
hn e-
h+ VB
CB
2H+
1/2 O2 + 2H+
H2
H2O
Au
TiO2 Bandgap

Au/TiO2 characterisation
Uv-vis diffuse reflectance spectra
PLASMONIC BAND
(550 nm)
Au weight PERCENT
Au nanoparticles DIMENSIONS
0.0
0.5
1.0
1.5
2.0
2.5
200 300 400 500 600 700 800l (nm)
ADP 2.5%
DP 0.5%
DP 0.38%
DP 0.13%
DP 0.06%
DP 0%
P25

HRTEM
H2 1.3 %
NaBH4 1%
DP UREA 0.5%
DP 0.5%

AR1 photodegradation
• No Au/TiO2 sample more efficient than P25
• Negligible Au deposition effects
1.00 0.98
0.61
0.90 0.85
0.79 0.76
0.91
0.68 0.64
0.76
0.69 0.66
0.74
0.79
0.0
0.1
0.2
0.3
0.4
0.5
0.6
0.7
0.8
0.9
1.0
P25 DP DP
0.06%
DP
0.13%
DP
0.38%
DP
0.5%
DP
2.5%
UREA
0%
UREA
0.5%
UREA
2.5%
NaBH4
0%
NaBH4
1%
H2 H2
1.3% 150°C
H2
1.3% 200°C
k0 /k0P25
DP SERIES
NaBH4 SERIES
DP urea
SERIES
H2 SERIES
0% 0%
M.V. Dozzi, L. Prati, P. Canton, E. Selli, PCCP, 2009, 11, 7171

H2O2 evolution during AR1 photodegradation
Increase in H2O2 production rate in the presence of gold
nanoparticles
Controversial effect of Au on TiO2: favored eCB- transfer to O2
leading to H2O2, but not parallel increase of AR1 photodegradation
0
2
4
6
8
10
0 2000 4000 6000 8000 10000 12000 14000 16000
time (s)
[H2O
2]. 1
05(M
)
P25
DP 0%
DPU 0%
DPN 0%
DPH 0%
DP 0.5%
DP 2.5%
DPU 2.5%

1.00
0.53
1.44
1.08
0.93
1.05 1.04
0.81
1.01
0.78 0.85
1.36
1.13
0.88
0.61
0.0
0.2
0.4
0.6
0.8
1.0
1.2
1.4
1.6
P25 DP
0%
DP 0.06%
DP 0.13%
DP 0.38%
DP 0.5%
DP 2.5%
UREA 0%
UREA 0.5%
UREA 2.5%
NaBH4
0% NaBH4
1% H2
0%
H2
1.3% 150°C
H2
1.3% 200°C
k 0
/k 0
P25
DP SERIES
NaBH4
SERIES
DP UREA
SERIES
H2 SERIES
HCOOH photocatalytic mineralization
• Best performance for NaBH4 and H2 – reduced Au/TiO2 samples
• Calcination at 450°C reduces the photocatalytic activity
• Optimal Au loading
• Beneficial role of Au in HCOOH degradation

H2O2 evolution during FA photodegradation
0
5
10
15
20
25
30
0 2000 4000 6000 8000 10000 12000 14000time (s)
[H2O
2]·
10
5 (M
)
P25
DP 0%
DP 0.06%
DP 0.13%
DP 0.38%
DP 0.5%
DP 2.5%
No H2O2 could be detected during FA mineralization on bare TiO2
Relatively high H2O2 amounts, increasing with gold content up to
0.5%, could be detected on Au/TiO2
H2O2 concentrations much higher than those detected during
AR1 degradation were attained
M.V. Dozzi, L. Prati, P. Canton, E. Selli, PCCP, 2009, 11, 7171
0.612.4DPH 1.%
25.43.3DPN 1%
26.93.8DPU 2.5%
24.47.4DP 2.5%
27.97.9DP 0.5%
21.74.1DP 0.38%
1.13.6DP 0.13%
0.523.2DP 0.06%
0.072.9P25
FAFAAR1AR1
0.612.4DPH 1.%
25.43.3DPN 1%
26.93.8DPU 2.5%
24.47.4DP 2.5%
27.97.9DP 0.5%
21.74.1DP 0.38%
1.13.6DP 0.13%
0.523.2DP 0.06%
0.072.9P25
FAFAAR1AR1
105 [H2O2]max/M

HCOOH photomineralization mechanism
Reduction path:
Prevailing photodegradation mechanism:
direct oxidation through valence band
holes at the TiO2 surface
HCOO-ads + h+
VB CO2- + H+
CO2- + O2 CO2 + O2
-
O2 + e-CB O2
-
O2- + e-
CB + 2 H+ H2O2

AR1
PHOTODEGRADATION
INHIBITED
AR1 photodegradation mechanism
PROCESS MEDIATED BY ∙OH RADICALS
RED-OX at Au/TiO2 interface
E (V) vs NHE pH 7
+2.64
+1.99
+1.68
-0.50
/AuAu0
OHOH /
VBh
CBe
-0.33
22/OO
•Au0 AuI oxidation
•AuI Au0 reduction
h+VB + H2O OH + H+
h+VB + Au Au+
OH + H+ + Au Au+ + H2O
e-CB + Au+ Au

Limiting factors of TiO2 photocatalytic efficiency
1. The band gap of TiO2 is 3.2 eV, i.e. it absorbs light in the UV
region, so that only a small portion (5%) of the sunlight can
be used for photocatalytic processes.
ANION DOPING with p-BLOCK elements (B, C, N …)
inserted in the TiO2 structure
POSSIBLE CREATION OF DIFFERENT TYPES OF INTRA BAND GAP STATES

Sol gel synthesis
S-doped TiO2 F-doped TiO2
Dopant: Thiourea Dopant: NH4F
Reference
Undoped TiO2
E_0 series
Calcination
• 500 °C
• 600 °C
• 700 °C
Dopant/Ti molar ratio
• 20
• 8
• 2
Preparation of S/F doped TiO2
M.V. Dozzi, S. Livraghi, E. Giamello, E. Selli, Photochem. Photobiol. Sci. 2011, 10, 343
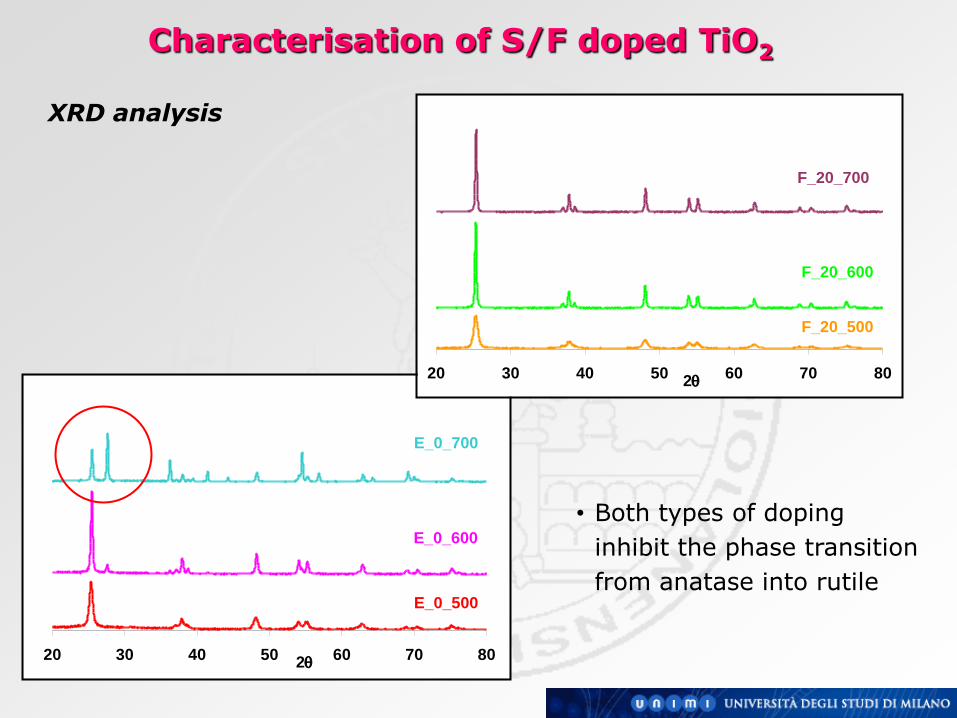
Characterisation of S/F doped TiO2
XRD analysis
20 30 40 50 60 70 802q
E_0_500
E_0_600
E_0_700
20 30 40 50 60 70 802q
F_20_700
F_20_600
F_20_500
• Both types of doping
inhibit the phase transition
from anatase into rutile

Characterisation of S/F doped TiO2
F_20_700 E_0_500
HRTEM analysis
Characterisation of S/F doped TiO2
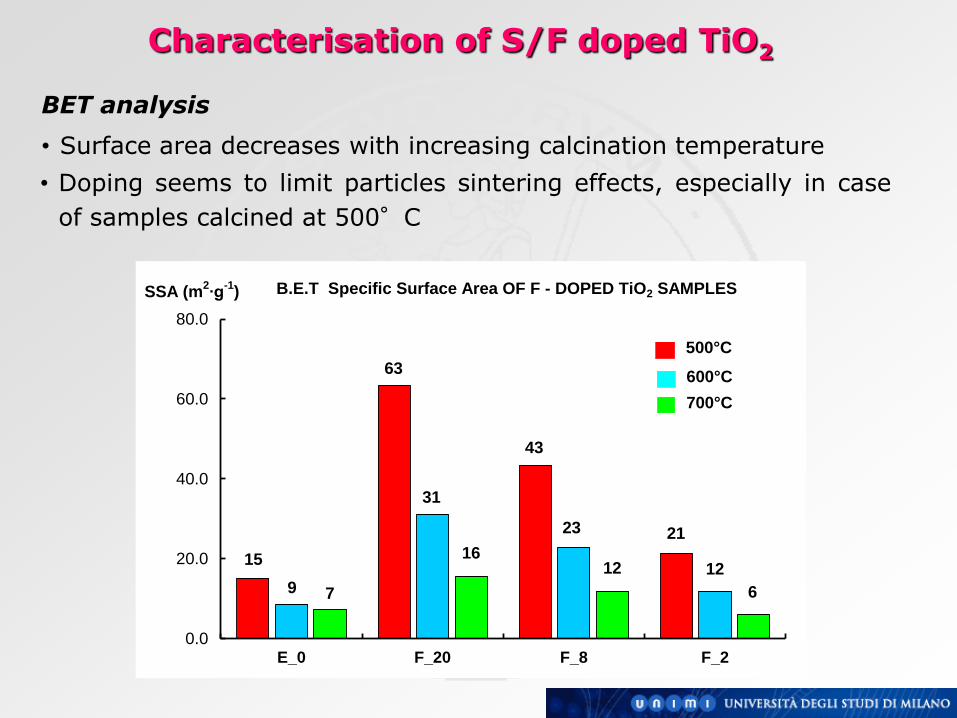
BET analysis
• Surface area decreases with increasing calcination temperature
• Doping seems to limit particles sintering effects, especially in case
of samples calcined at 500°C
B.E.T Specific Surface Area OF F - DOPED TiO2 SAMPLES
7
15
43
21
63
9
31
23
1216
6
12
0.0
20.0
40.0
60.0
80.0
E_0 F_20 F_8 F_2
SSA (m2∙g
-1)
500°C
600°C
700°C

Photoactivity of S/F doped TiO2 in FA degradation
• S-doped TiO2 show a photocatalytic activity quite similar to that of undoped materials. Insertion of S appears rather difficult
• Beneficial role of F-doping: bulk modification of TiO2
• Reaction rate increase with increasing calcination temperature: high cristallinity of F-TiO2 samples composed of pure anatase thermal energy can trigger the introduction of F- for O2-
low surface area and possible formation of Ti3+ centers
• High doping levels limit photoactivity
0.40.4
0.4
0.3
0.6
0.4
0.7
0.4 0.30.4
0.1
0.9
0.1
0.30.4
1.0
0.5
0.9
0.5
2.0 2.0
0.0
0.5
1.0
1.5
2.0
2.5
3.0
E_0 S_20 S_8 S_2 F_20 F_8 F_2
k0·10
7 (M·s
-1)
500°C
600°C
700°C
UNDOPED
TiO2
S - DOPED
TiO2
F - DOPED
TiO2

EPR characterisation
Detected species:
• nitric oxide (NO) radical in micro-voids
• nitrogen atoms (N) trapped in the bulk
•Ti3+ species
3250 3300 3350 3400 3450 3500 3550 3600
10mw 77K
S20-700
S20-600
S20-500
Ti3+
(I)
?
*10
B/Gauss
EPR spectra of S-doped samples at 77 K E
F_2
0 F_8 F_2
S_2
0 S_8 S_2
500°C -
NO
N
Ti3+
NO
Ti3+
NO
N
Ti3+
NO
N NO NO
600°C - N
Ti3+
NO
Ti3+
NO
Ti3+ NO NO
NO
Ti3+
700°C - NO
Ti3+ NO NO Ti3+
NO
Ti3+
NO
Ti3+ M.V. Dozzi, S. Livraghi, E. Giamello, E. Selli, Photochem. Photobiol. Sci. 2011, 10, 343

Photoactivity of NH4F-doped TiO2
ACETIC ACID PHOTOOXIDATION ACETALDEHYDE PHOTOOXIDATION
0.7
0.6
0.4 0.4
0.3
0.4
0.3 0.3
0.9
0.5
0.6
0.50.4
0.3
0.2
1.00.9
0.6
0.0
0.3
0.6
0.9
1.2
1.5
D_0 D_3 D_5 D_12 D_25
rate
(m
mo
l CO
2 ∙
min
-1)
500°C
600°C
700°C
P25
A45
JRC-8
Commercial
3.64.0
3.0
1.51.1
4.7
1.2 1.1
3.4
1.6
3.5
1.31.7
0.3
5.5
3.1
4.1
0
2
4
6
8
D_0 D_3 D_5 D_12 D_25
rate
∙10
2 (
min
-1)
500°C
600°C
700°C
P25
A45
Commercial
LIQUID PHASE GAS PHASE
• Beneficial effect of NH4F doping
• Reaction rate increase with increasing calcination temperature:
NH4F - doping inhibits the anatase into rutile phase transition
high crystallinity of NH4F-TiO2 samples composed of pure anatase
• Home made NH4F-doped samples more active than commercial ones
• Too high doping levels limit the TiO2 photoactivity
M.V. Dozzi, B. Ohtani, E. Selli, PCCP, 2011, 13, 18217

Action spectra analysis: AcOH photooxidation
OH 2 CO 2 O 2 COOHCH2223
Substrate: transparent acetic acid
Wavelength range: 370-460 nm
Samples: D_5, D_12 and D_25
Wavelength step: 10 nm
0
5
10
15
20
360 370 380 390 400 410 420 430 440 450 460 470
l (nm)
Fa
pp (
%)
D_5_500
D_5_600
D_5_700
0
5
10
15
20
360 370 380 390 400 410 420 430 440 450 460 470
l (nm)
Fa
pp (
%)
D_12_500
D_12_600
D_12_700
0
5
10
15
20
360 370 380 390 400 410 420 430 440 450 460 470
l (nm)
Fa
pp (
%)
D_25_500
D_25_600
D_25_700
0.0
0.2
0.4
0.6
0.8
1.0
250 300 350 400 450 500 550
l (nm)
Ab
so
rpti
on
D_5_500
D_5_600
D_5_700
0.0
0.2
0.4
0.6
0.8
1.0
250 300 350 400 450 500 550
l (nm)
Ab
so
rpti
on
D_12_500
D_12_600
D_12_700
0.0
0.2
0.4
0.6
0.8
1.0
250 300 350 400 450 500 550
l (nm)
Ab
so
rpti
on
D_25_500
D_25_600
D_25_700

DRS spectra: comparison model vs. calculation
BAND A BAND B
500°C 0 Maximum
600°C Small Small
700°C Maximum 0
Active BAND A (365 nm)
Inactive BAND B (420 nm)
0.0
0.1
0.2
0.3
300 350 400 450 500 550
l (nm)
Ab
so
rpti
on
D_5_500
D_5_600
D_5_700
0.0
0.1
0.2
0.3
300 350 400 450 500 550
l (nm)
Ab
so
rpti
on
D_12_500
D_12_600
D_12_700
0.0
0.1
0.2
0.3
300 350 400 450 500 550
l (nm)
Ab
so
rpti
on
D_25_500
D_25_600
D_25_700
BAND A
BAND B BAND A
BAND B
BAND A
BAND B
Experimental action spectra
results well fit with the
qualitative model

Correlation between DRS and action spectra
Subtraction of the action spectra obtained with samples calcined at 500°C
from those obtained with samples calcined at 600 and 700°C
-2.0
0.0
2.0
4.0
6.0
360 380 400 420 440 460
l (nm)
D F
ap
p (
%)
D_5_700 - D_5_500
D_5_600 - D_5_500
-2.0
0.0
2.0
4.0
6.0
360 380 400 420 440 460
l (nm)
D F
ap
p (
%)
D_12_700 - D_12_500
D_12_600 - D_12_500
-2.0
0.0
2.0
4.0
6.0
360 380 400 420 440 460
l (nm)
D F
ap
p (
%)
D_25_700 - D_25_500
D_25_600 - D_25_500
Band B absorption in the Vis
region is not photoactive in AcOH
decomposition
Band A is responsible for the
enhanced photoefficiency obtained
with samples calcined at 700°C
Conclusions
• Photoactivity improvement of F-doped materials must be related to
bulk modifications that ensure a better charged separation, most
probably related to high crystallinity; in fact only surface
fluorination was shown to produce a marked decrease of FA
oxidation rate
• Inactive band B, being most evident in the absorption spectra of
doped samples calcined at 500°C and decreasing in intensity with
increasing the calcination temperature, can safely be attributed to
nitrogen doping
M.V. Dozzi, B. Ohtani, E. Selli, PCCP, 2011, 13, 18217
• Band A, and the activity in acetic acid decomposition, increased
with increasing the calcination temperature. It might be attributed
to extrinsic absorption originating from surface oxygen vacancies or
surface defects

VB
CB
TiO2
Bandgap
-1
-0,5
0
0,5
1
1,5
2
2,5
Po
ten
tia
l / V
V
2H2O → O2 + 4H+ + 4e-
e-
4H+ + 4 e- → 2H2
ECB
EVB
TiO2
anatase
H2O (pH 7)
hn
-
+
e-
h+
e- 2H+
H2
1/2 O2 + 2H+
H2O
hn
ΔG = +237 kJ mol-1 222 O2
1Hh 2OH 2
TiOν
Up-hill reactions: photocatalytic water splitting
mol kJ 3.9ΔG COH 3OH OHCH
organics of Reforming
122
hν23

HRTEM analysis
5 nm
5 nm
A
B
5 nm
5 nm
5 nm
5 nm
A
B
FP-0.5%Pt/TiO2
1%Ag/TiO2
Flame-made TiO2 photocatalyst containing 0.5 wt.% Pt
1.0 wt.% Ag deposited on P25 TiO2
h
hν
e e e e e
NM
TiO2
EF

TEM investigation of Au/TiO2
FP- 1 wt% Au/TiO2 THPC 1 wt% Au/TiO2
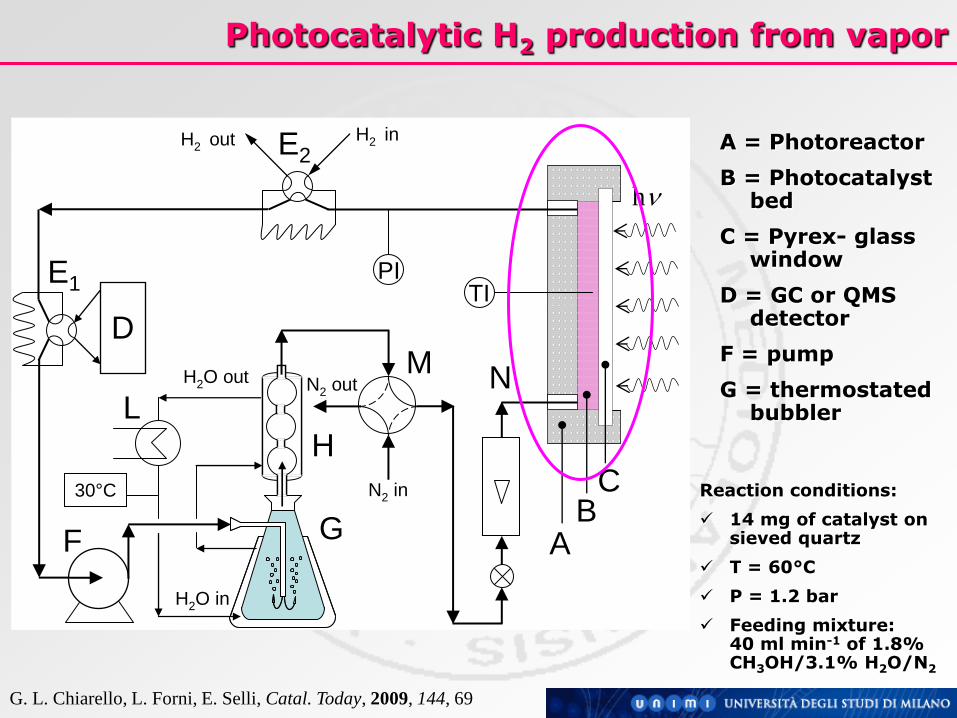
Photocatalytic H2 production from vapor
340 360 380 400 420 440 460
Co
un
ts /
a.u
.
l nm
emission spectrum
of the light source
H2 out H2 in
H2O in
H2O out
D
GF
E2
E1
N2 out
N2 in
hn
PI
AB
CH
L
30°C
MN
TI
Reaction conditions:
14 mg of catalyst on sieved quartz
T = 60°C
P = 1.2 bar
Feeding mixture: 40 ml min-1 of 1.8% CH3OH/3.1% H2O/N2
A = Photoreactor
B = Photocatalyst bed
C = Pyrex- glass window
D = GC or QMS detector
F = pump
G = thermostated bubbler
G. L. Chiarello, L. Forni, E. Selli, Catal. Today, 2009, 144, 69

Effects of methanol addition and of Au on TiO2
in H2O + 6 vol% CH3OH
7900
290
160
H2 production rate
(μmol H2 g-1 h-1)
46.8
1.7
1.0
Relative rate
151
59
56
Relative rate with respect to H2O splitting
FP-TiO2
TiO2 (P25)
Photocatalyst
FP-1%Au/TiO2
0
4
8
12
16
20
0 1 2 3 4 5 6 7 8
irradiation time / h
mm
ol H
2 /
g c
ata
lyst
purging
in the dark FP-Au/TiO2
FP-TiO2
ca 200 Nml H2 gcat-1 h-1
In the presence of methanol, the H2 production rate increased up to 60
times for FP-TiO2 and up to 150 times for FP-1% Au/TiO2 photocatalysts
22
hν
2x COHOH CH
organics of Reforming
G.L. Chiarello, L. Forni, E. Selli, Catal. Today, 2009, 144, 69

Reaction Sequence
CH3OH 2TiO ,hn H2CO + H2 (1)
H2CO + H2O 2TiO ,hn HCO2H + H2 (2)
HCO2H 2TiO ,hn CO2 + H2 (3)
H2CO 2TiO ,hn CO + H2 (4)
2 CH3OH 2TiO ,hn HCO2CH3 + 2 H2 (5)
2 CH3OH 2TiO ,hn CH3CHO + 2 H2 (6)
2 CH3OH 2TiO ,hn CH3OCH3 + H2O (7)

Time Profile of Products Evolution
0
5
10
15
20
25
0,0 0,5 1,0 1,5 2,0 2,5
H2
CO2
CO
mm
ol
gca
t-1
Irradiation time / h
0
5
10
15
20
25
0,0 0,5 1,0 1,5 2,0 2,5
H2
CO2
CO
mm
ol
gca
t-1
Irradiation time / h
0
50
100
150
200
250
300
350
0,0 0,5 1,0 1,5 2,0 2,5
H2CO
HCO2HGC
pea
k a
rea
Irradiation time / h
0
50
100
150
200
250
300
350
0,0 0,5 1,0 1,5 2,0 2,5
H2CO
HCO2HGC
pea
k a
rea
Irradiation time / h
H2, CO2 and CO accumulate at constant rate in the re-circulating gas phase
H2CO and HCOOH were identified in the gas phase, but they did not accumulate there, but in the liquid phase
G. L. Chiarello, M. H. Aguirre, E. Selli, J. Catal., 2010, 273, 182
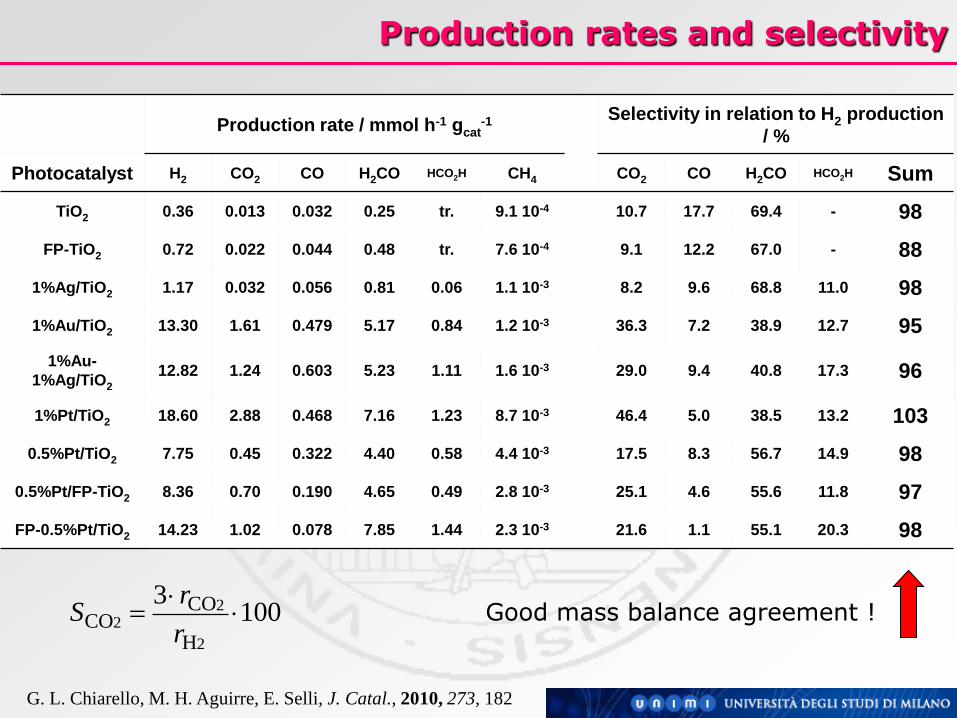
Production rates and selectivity
Production rate / mmol h-1 gcat-1
Selectivity in relation to H2 production
/ %
Photocatalyst H2 CO2 CO H2CO HCO2H CH4 CO2 CO H2CO HCO2H Sum
TiO2 0.36 0.013 0.032 0.25 tr. 9.1 10-4 10.7 17.7 69.4 - 98
FP-TiO2 0.72 0.022 0.044 0.48 tr. 7.6 10-4 9.1 12.2 67.0 - 88
1%Ag/TiO2 1.17 0.032 0.056 0.81 0.06 1.1 10-3 8.2 9.6 68.8 11.0 98
1%Au/TiO2 13.30 1.61 0.479 5.17 0.84 1.2 10-3 36.3 7.2 38.9 12.7 95
1%Au-
1%Ag/TiO2 12.82 1.24 0.603 5.23 1.11 1.6 10-3 29.0 9.4 40.8 17.3 96
1%Pt/TiO2 18.60 2.88 0.468 7.16 1.23 8.7 10-3 46.4 5.0 38.5 13.2 103
0.5%Pt/TiO2 7.75 0.45 0.322 4.40 0.58 4.4 10-3 17.5 8.3 56.7 14.9 98
0.5%Pt/FP-TiO2 8.36 0.70 0.190 4.65 0.49 2.8 10-3 25.1 4.6 55.6 11.8 97
FP-0.5%Pt/TiO2 14.23 1.02 0.078 7.85 1.44 2.3 10-3 21.6 1.1 55.1 20.3 98
G. L. Chiarello, M. H. Aguirre, E. Selli, J. Catal., 2010, 273, 182
1003
2
22
H
COCO
r
rS Good mass balance agreement !

H2 production rate and selectivities
rH2 greatly increased upon NM deposition
Ag (F = 4.74 eV) is the poorest co-catalyst, followed by Au (5.31 eV) and Pt (5.93 eV)
rH2 doubled upon doubling the Pt amount on TiO2
FP-made photocatalysts perform better than those prepared by deposition of NM nanoparticles
0
20
40
60
80
100
FP-T
iO2
TiO2
1%Ag/
TiO2
1%Au/
TiO2
Au-
Ag/
TiO2
1%Pt/T
iO2
0.5%
Pt/T
iO2
0.5%
Pt/F
P-T
iO2
FP-0
.5%
Pt/T
iO2
0
4
8
12
16
20
r H2
/ m
mo
l H2
h-1
gcat-1
Sele
cti
vit
y / %
rH2
SCO2
SCO
0
20
40
60
80
100
FP-TiO
2TiO
2
1%Ag/
TiO2
1%Au/
TiO2
Au-Ag/
TiO2
1%Pt/T
iO2
0.5%
Pt/TiO
2
0.5%
Pt/FP-T
iO2
FP-0.5
%Pt/T
iO2
0
4
8
12
16
20
r H2
/ m
mo
l H2
h-1
gcat-1
Sele
cti
vit
y / %
rH2rH2
SCO2
SCO

0
4
8
12
16
20
0.5%
Au/D
00.
5%A
u/D
50.
5%A
u/D
70.
5%A
u/D
120.
5%P
t/D
00.
5%P
t/D
50.
5%P
t/D
70.
5%P
t/D
120.
5%A
u/P
25
0.5%
Pt/P
25
H2 CO2 CO
NAKED
Au/TiO2
Pt/TiO2D0 D5 D7 D12 P25
0.0
0.2
0.4
0.6Au or Pt/P25
rate
/ m
mol h
-1g
cat-1
Effects of doping and of NM loading
The rate of H2 and CO2 production greatly increased upon 0.5 wt.% Au or Pt nanoparticles deposition
Pt is a better co-catalyst compared to Au, in agreement with the work function values Φ(Pt) = 5.93 eV and Ф(Au) = 5.31 eV
Doping of TiO2 enhanced the H2 production rate, with an identical bell-shaped trend with increasing the dopant content for the naked, Au- and Pt-modified titania series
5% NH4F-doped TiO2 (D5) was the best photocatalyst within each series
NH4F-doped TiO2

Effect of methanol molar fraction x
rH2 SCO2 SHCO2H
0
20
40
60
80
100
0.00
5
0.00
9
0.02
3
0.04
7
0.10
0
0.22
9
0.30
8
0.64
0
0.80
0
0.89
4
0.95
6
1.00
0
0
4
8
12
16
20
r H2
/ m
mo
l H2
h-1
gcat-1
Se
lec
tivit
y /
%
1%Au / TiO2
CH3OH molar fraction (x)
0
20
40
60
80
100
0.00
5
0.00
9
0.02
3
0.04
7
0.10
0
0.22
9
0.30
8
0.64
0
0.80
0
0.89
4
0.95
6
1.00
0
0
4
8
12
16
20
r H2
/ m
mo
l H2
h-1
gcat-1
Se
lec
tivit
y /
%
1%Au / TiO2
CH3OH molar fraction (x)
0
20
40
60
80
100
0.00
5
0.00
9
0.02
3
0.04
7
0.10
0
0.22
9
0.40
0
0.64
0
0.80
0
0.89
4
0.95
6
1.00
0
0
4
8
12
16
20
r H2
/ m
mo
l H2
h-1
gcat-1
Sele
cti
vit
y / %
FP-0.5%Pt / TiO2
CH3OH molar fraction (x)
0
20
40
60
80
100
0.00
5
0.00
9
0.02
3
0.04
7
0.10
0
0.22
9
0.40
0
0.64
0
0.80
0
0.89
4
0.95
6
1.00
0
0
4
8
12
16
20
r H2
/ m
mo
l H2
h-1
gcat-1
Sele
cti
vit
y / %
FP-0.5%Pt / TiO2
CH3OH molar fraction (x)
G. L. Chiarello, M. H. Aguirre, E. Selli, J. Catal., 2010, 273, 182
SSA = 70 m2 g-1
53% anatase, 47% rutile
SSA = 48 m2 g-1
80% anatase, 20% rutile
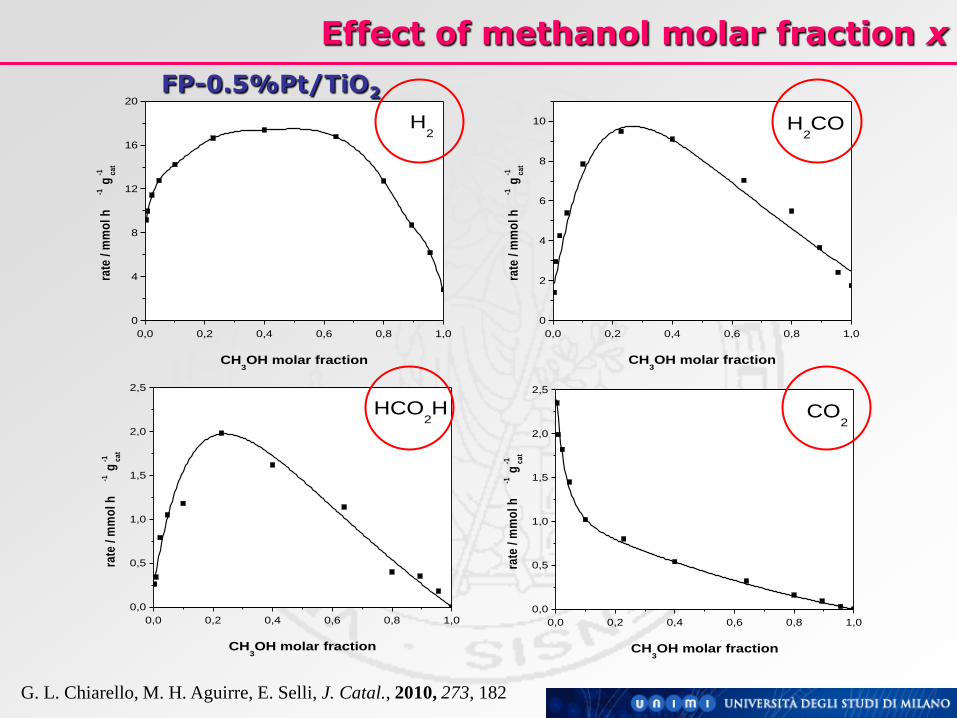
Effect of methanol molar fraction x
0,0 0,2 0,4 0,6 0,8 1,0
0
2
4
6
8
10
rate
/ m
mo
l h
-1 g
-1 ca
t
CH3OH molar fraction
H2CO
0,0 0,2 0,4 0,6 0,8 1,0
0,0
0,5
1,0
1,5
2,0
2,5
rate
/ m
mo
l h
-1 g
-1 ca
t
CH3OH molar fraction
CO2
0,0 0,2 0,4 0,6 0,8 1,0
0,0
0,5
1,0
1,5
2,0
2,5
rate
/ m
mo
l h
-1 g
-1 ca
t
CH3OH molar fraction
HCO2H
0,0 0,2 0,4 0,6 0,8 1,0
0
4
8
12
16
20
rate
/ m
mo
l h
-1 g
-1 ca
t
CH3OH molar fraction
H2
G. L. Chiarello, M. H. Aguirre, E. Selli, J. Catal., 2010, 273, 182
FP-0.5%Pt/TiO2
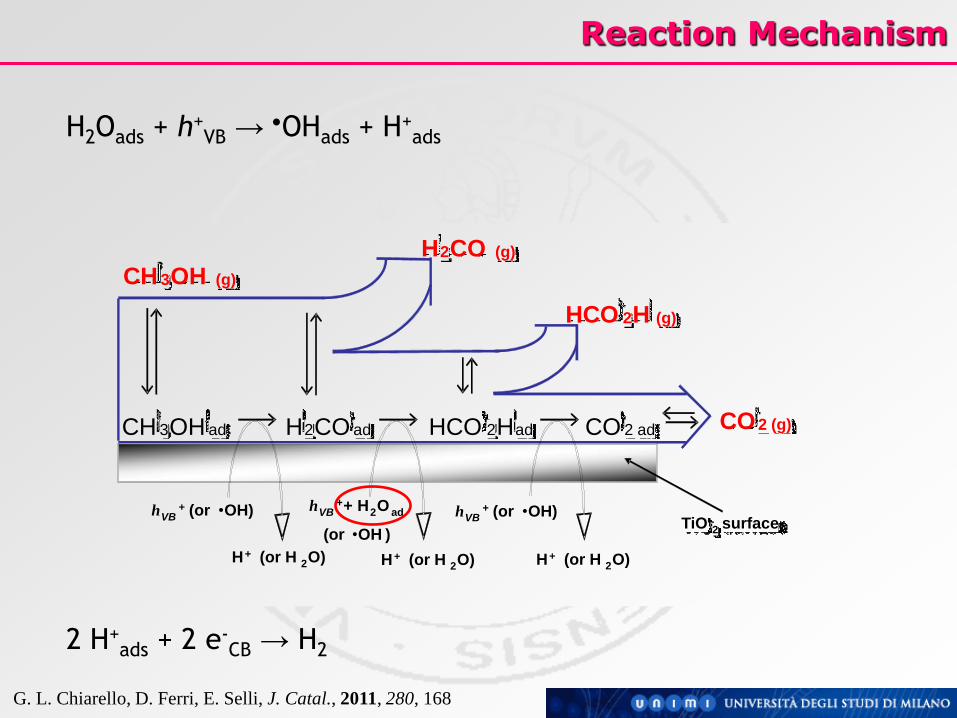
Reaction Mechanism
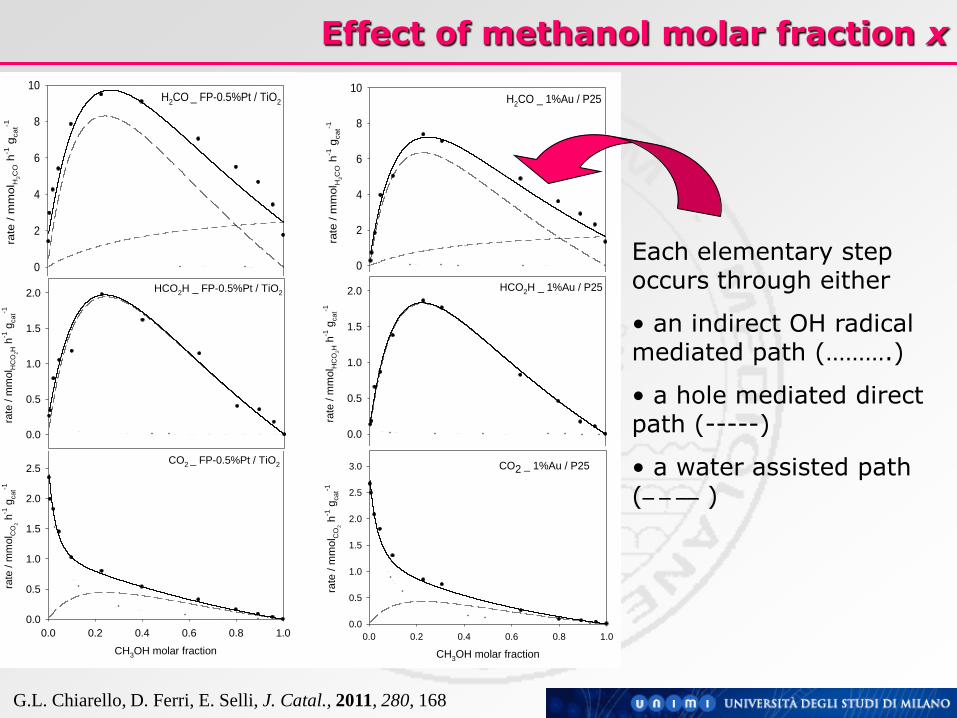
G. L. Chiarello, D. Ferri, E. Selli, J. Catal., 2011, 280, 168
H2Oads + h+VB → OHads + H+
ads
2 H+ads + 2 e-
CB → H2
CO 2 (g) CH 3 OH ad H 2 CO ad HCO 2 H ad CO 2 ad
H 2 CO (g)
HCO 2 H (g)
CH 3 OH (g)
TiO 2 surface h VB
+ (or • OH)
H + (or H 2 O)
h VB + + H 2 O ad
(or • OH )
H + (or H 2 O)
h VB + (or • OH)
H + (or H 2 O)

G.L. Chiarello, D. Ferri, E. Selli, J. Catal., 2011, 280, 168
By assuming that
• the rate of each oxidation step occurring on the photocatalyst surface is the sum of the rates of the direct and of the hydroxyl-radical mediated paths
• the steady state concentration of photopromoted electrons equals that of photoproduced holes
• the intermediate surface coverage can be expressed according to the Langmuir adsorption isotherm
• the activity coefficients can be calculated by the van Laar equation
an expression is obtained for the rate of the oxidation products’ formation via the OH radical mediated path with a maximum located at very low x values, followed by a decay trend with increasing x.
The hole-mediated oxidation path exhibits a typical saturation behaviour with increasing x.
A water-mediated path is at work!
Reaction Mechanism
rate
/ m
mol H
2C
O h
-1 g
cat-1
0
2
4
6
8
10H2CO _ FP-0.5%Pt / TiO2
CH3OH molar fraction
0.0 0.2 0.4 0.6 0.8 1.0
rate
/ m
mol C
O2
h-1
gcat-1
0.0
0.5
1.0
1.5
2.0
2.5CO2 _ FP-0.5%Pt / TiO2
rate
/ m
mol H
CO
2H h
-1 g
ca
t-1
0.0
0.5
1.0
1.5
2.0 HCO2H _ FP-0.5%Pt / TiO2
rate
/ m
mol H
2C
O h
-1 g
ca
t-1
0
2
4
6
8
10H2CO _ 1%Au / P25
rate
/ m
mol H
CO
2H h
-1 g
cat-1
0.0
0.5
1.0
1.5
2.0 HCO2H _ 1%Au / P25
CH3OH molar fraction
0.0 0.2 0.4 0.6 0.8 1.0
rate
/ m
mol C
O2
h-1
gca
t-1
0.0
0.5
1.0
1.5
2.0
2.5
3.0 CO2 _ 1%Au / P25
rate
/ m
mol H
2C
O h
-1 g
cat-1
0
2
4
6
8
10H2CO _ FP-0.5%Pt / TiO2
CH3OH molar fraction
0.0 0.2 0.4 0.6 0.8 1.0
rate
/ m
mol C
O2
h-1
gcat-1
0.0
0.5
1.0
1.5
2.0
2.5CO2 _ FP-0.5%Pt / TiO2
rate
/ m
mol H
CO
2H h
-1 g
ca
t-1
0.0
0.5
1.0
1.5
2.0 HCO2H _ FP-0.5%Pt / TiO2
rate
/ m
mol H
2C
O h
-1 g
cat-1
0
2
4
6
8
10H2CO _ FP-0.5%Pt / TiO2
CH3OH molar fraction
0.0 0.2 0.4 0.6 0.8 1.0
rate
/ m
mol C
O2
h-1
gcat-1
0.0
0.5
1.0
1.5
2.0
2.5CO2 _ FP-0.5%Pt / TiO2
rate
/ m
mol H
CO
2H h
-1 g
ca
t-1
0.0
0.5
1.0
1.5
2.0 HCO2H _ FP-0.5%Pt / TiO2
rate
/ m
mol H
2C
O h
-1 g
ca
t-1
0
2
4
6
8
10H2CO _ 1%Au / P25
rate
/ m
mol H
CO
2H h
-1 g
cat-1
0.0
0.5
1.0
1.5
2.0 HCO2H _ 1%Au / P25
CH3OH molar fraction
0.0 0.2 0.4 0.6 0.8 1.0
rate
/ m
mol C
O2
h-1
gca
t-1
0.0
0.5
1.0
1.5
2.0
2.5
3.0 CO2 _ 1%Au / P25
G.L. Chiarello, D. Ferri, E. Selli, J. Catal., 2011, 280, 168
Each elementary step occurs through either
• an indirect OH radical mediated path (……….)
• a hole mediated direct path (-----)
• a water assisted path (_ _ __ )
Effect of methanol molar fraction x

Acknowledgements
Thank you!
Cariplo Foundation for financial support