photo- and electrochromic properties of covalently … · 1 electronic supplementary information...
TRANSCRIPT
1
Electronic Supplementary Information
Photo- and Electrochromic Properties of Covalently Connected
Symmetrical and Unsymmetrical Spiropyran/Polyoxometalate
Dyads
Olivier Oms,a Khadija Hakouk,
b Rémi Dessapt,
b Philippe Deniard,
b Stéphane Jobic,
b Anne Dolbecq,
a
Thomas Palacin,a Louis Nadjo,
c Bineta Keita,
c Jérôme Marrot
a and Pierre Mialane
a
a Institut Lavoisier de Versailles, UMR 8180, Université de Versailles Saint-Quentin, 45 avenue des
Etats-Unis, 78035 Versailles Cedex,France. E-mail: [email protected]
b Institut des Matériaux Jean Rouxel, Université de Nantes, CNRS, 2 rue de la Houssinière, BP 32229,
44322 Nantes, France. E-mail: [email protected]
c Laboratoire de Chimie Physique, UMR CNRS 8000, Equipe d’Electrochimie et Photo électrochimie
Université Paris 11, Bâtiment 350, 91405 Orsay Cedex (France.)E-mail: [email protected]
S1 Synthetic procedures
S2 Solution 1H NMR
S3 IR spectra
S4 Single crystal XRD data
S5 Kubelka-Munk transformed reflectivity vs wavelength and energy of 1, 2, SPtris, and
(TBA)3[MnMo6O18{(OCH2)3CNH2}2]
S6 Evolution of the color and of Kubelka-Munk transformed reflectivity of 2 at different
365 nm-UV irradiation time
S7 Kubelka-Munk transformed reflectivity of SPtris
S8 Evolution of the photo-generated absorption Abs(t) versus the irradiation time t of 1, 2
and SPtris under UV excitation at 365 nm
S9 Optical characteristics and coloration kinetic parameters of 1, 2, and SPtris
S10 Electrochemistry and Spectroelectrochemistry data
S11 References
Electronic Supplementary Material (ESI) for Chemical CommunicationsThis journal is © The Royal Society of Chemistry 2012
2
S1 Synthetic procedures
Chemicals and reagents. All available chemicals were purchased from major chemical
suppliers and used as received: EEDQ (2-ethoxy-1-ethoxycarbonyl-1,2-dihydroquinoline),
TRIS (2-Amino-2-(hydroxyméthyl)propane-1,3-diol). The 1-(β-carboxyethyl)-3’,3’-dimethyl-
6-nitrospiro(indoline-2’,2[2H-1]benzopyran) (SPCO2H)S1.1
photochromic derivative and the
Anderson-type polyoxomolybdate (TBA)3[MnMo6O18{(OCH2)3CNH2}2]S1.2
have been
synthesized as previously described.
NMR spectra were recorded on a Bruker Advance 300 spectrometer operating at 300 MHz for
1H. Chemical shifts are expressed in parts per million (ppm) downfield from internal TMS.
The following abbreviations are used: s, singlet; d, doublet; t, triplet; m, multiplet; br., broad.
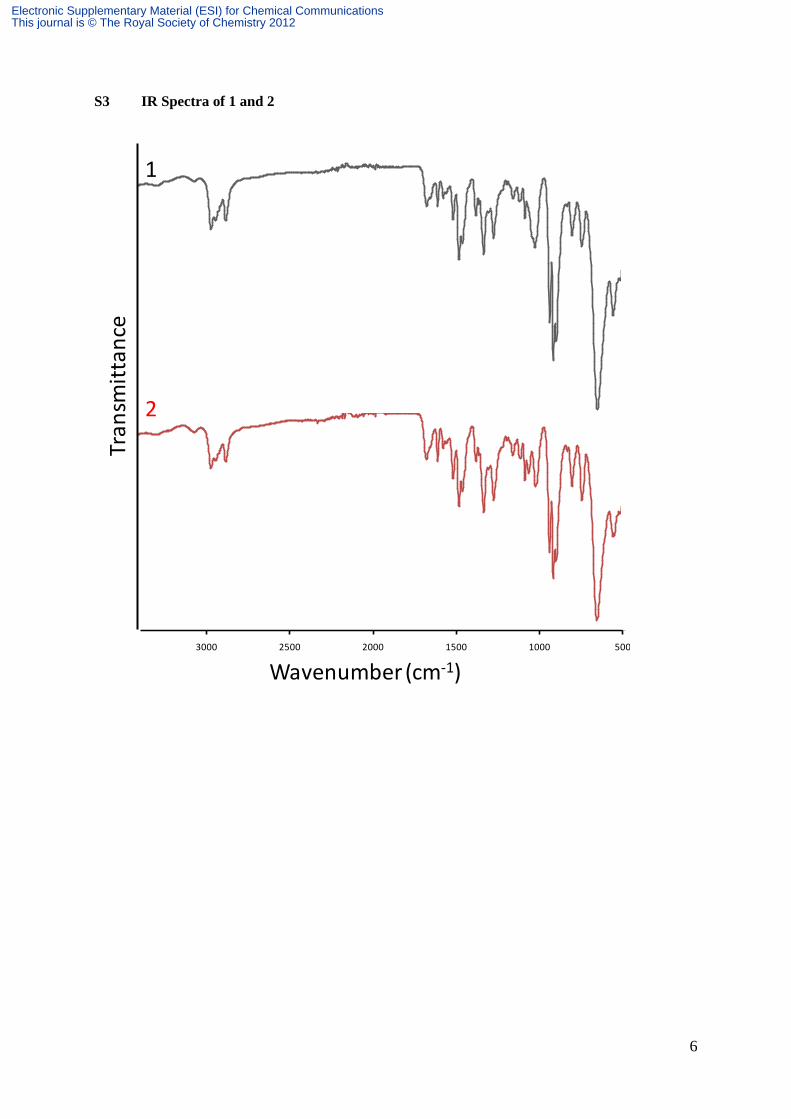
IR spectra: relative intensities are given after the wavenumber as vs = very strong, s = strong,
m = medium, w = weak, sh. = shoulder, br. = broad.
Elemental analyses were performed by the Service Central d’Analyse of CNRS, 69390
Vernaison, France.
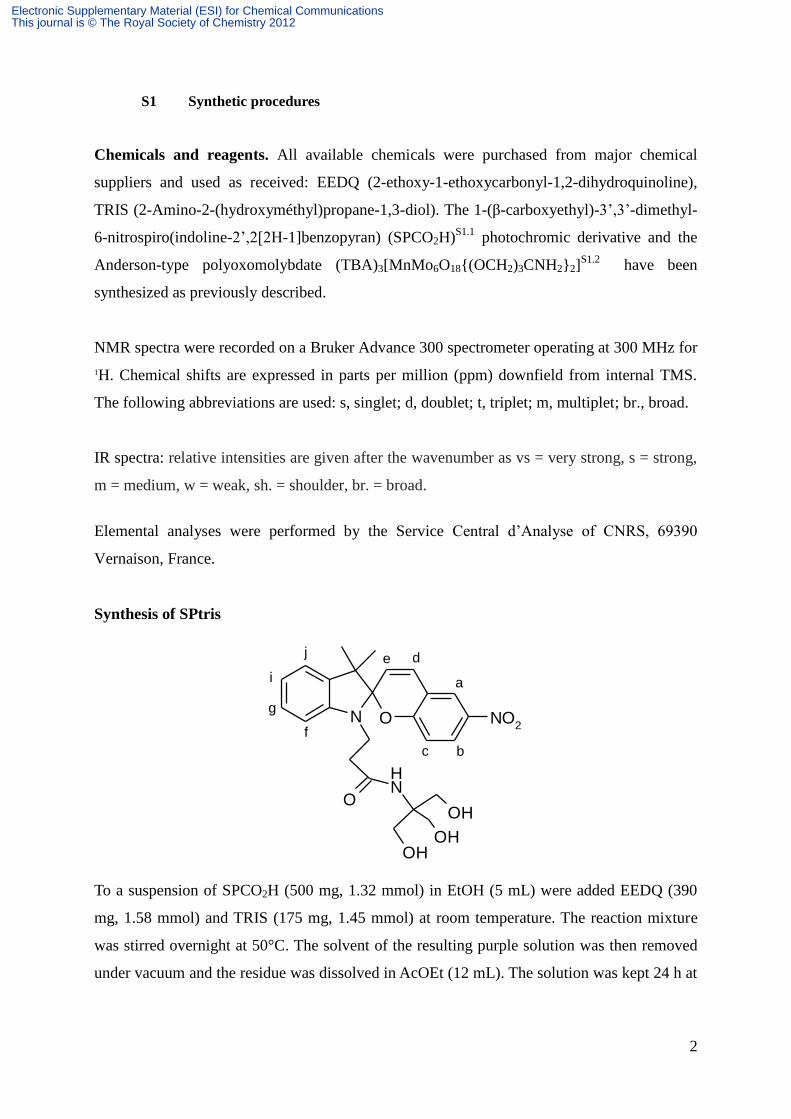
Synthesis of SPtris
ON
ONH
NO2
OH
OH
OH
a
bc
de
f
g
i
j
To a suspension of SPCO2H (500 mg, 1.32 mmol) in EtOH (5 mL) were added EEDQ (390
mg, 1.58 mmol) and TRIS (175 mg, 1.45 mmol) at room temperature. The reaction mixture
was stirred overnight at 50°C. The solvent of the resulting purple solution was then removed
under vacuum and the residue was dissolved in AcOEt (12 mL). The solution was kept 24 h at
Electronic Supplementary Material (ESI) for Chemical CommunicationsThis journal is © The Royal Society of Chemistry 2012
3
4°C and the resulting precipitate was isolated by filtration, washed with AcOEt (2*3 mL) and
Et2O (2*5 mL). SPtris (425 mg, 0.88 mmol) was obtained as a pale pink solid in 67% yield.
1H NMR (CDCl3, 300MHz, 298K) δ 8.03 (m, 2H, Ha and Hb), 7.21 (t, 1H, Hg, J = 7.7 Hz),
7.10 (d, 1H, Hj, J = 7.1 Hz), 6.92 (m, 2H, Hd and Hi), 6.84 (d, 1H, Hc, J = 8.7 Hz), 6.67 (d,
1H, Hf, J = 7.7 Hz), 6.59 (s, 1H, -NH-), 5.86 (d, 1H, He, J = 10.4 Hz), 4.54 (s, br., 3H, -OH),
3.72 (m, 1H, -CH2N-), 3.53 (m, 1H, -CH2N-), 3.48 (s, br., 6H, -CH2O-), 2.60 (m, 1H, -
CH2CO-), 2.47 (m, 1H, -CH2CO-), 1.29 (s, 3H, -CH3), 1.16 (s, 3H, -CH3). 13
C NMR (CDCl3,
75MHz, 298K) δ 173.3 (C=O), 159.3, 146.3, 141.1, 135.9, 128.5, 127.8, 126, 122.8, 121.9,
119.9, 118.6, 115.6, 106.7, 62.1, 61.3, 53.0, 39.9, 36.5, 25.8, 19.9. IR (ATR) : ν (cm-1
) 3314
(m), 2964 (νC-H, m), 2936 (νC-H, m), 2872 (νC-H, m), 1643 (νC, s), 1610 (m), 1578
(m), 1515 (s), 1480 (s), 1459 (s), 1335 (vs), 1268 (vs), 1158 (m), 1126 (m), 1088 (s), 1019
(vs), 949 (vs), 901 (m), 803 (s), 743 (vs), 680 (w), 628 (w), 520 (w). Anal. Calcd for
C25H29N3O7. 0.5 AcOEt (527.6): C, 61.47 ; H, 6.31 ; N, 7.97. Found : C, 61.17 ; H, 6.43 ; N,
8.14.
Note : Assignments of protons of spiropyran is based on information given in reference S1.3.
We could see by 1H NMR that the product contained a small amount of AcOEt that could not
be removed under vacuum overnight
Synthesis of 1, (TBA)3[MnMo6O18{(OCH2)3CNH2}{(OCH2)3CNHC21H19N2O4}]
To a solution of (TBA)3[MnMo6O18{(OCH2)3CNH2}2] (3 g, 1.6 mmol) in CH3CN (60 mL)
were added SPCO2H (365 mg, 0.96 mmol) and EEDQ (256 mg, 1.04 mmol) at room
temperature. The reaction mixture was stirred at 50°C during 18 h. The solvent was removed
under vacuum and the residue was dissolved in a minimum of CH3CN. The solution was
added to a large quantity of Et2O (45 mL). The resulting precipitate was then isolated by
filtration and placed in acetone (40 mL). The suspension was stirred during 10 minutes and
filtered. The solvent of the filtrate was removed under vacuum and the residue was dissolved
in a minimum of CH3CN. The solution was added to a large quantity of Et2O. The resulting
precipitate was then isolated by filtration. A similar treatment with 12 mL of acetone was
effectuated. 1 (503 mg, 0.22 mmol) was finally obtained as a pale pink solid in 23% yield.
1H NMR (CD3CN, 300 MHz, 298K) δ 63.7 (s, br., 12H, -CH2-O), 8.06 (s, 1H), 8.00 (d, 1H, J
= 7.9 Hz), 7.20-7.10 (m, 3H), 6.85 (t, 1H, J = 7.1 Hz), 6.71 (m, 2H), 6.46 (br., 1H), 5.89 (d,
1H, He, J = 7.1 Hz), 3.51 (m, 1H), 3.36 (m, 1H), 3.14 (m, 24H, -NCH2- (TBA)), 2.71 (m, 2H),
Electronic Supplementary Material (ESI) for Chemical CommunicationsThis journal is © The Royal Society of Chemistry 2012
4
1.63 (m, 24H, -NCH2CH2- (TBA)), 1.38 (m, 24H, -NCH2CH2CH2- (TBA)), 1.25 (s, 3H, -
CH3), 1.13 (s, 3H, -CH3), 0.98 (m, 36H, -CH3 (TBA)).13
C NMR (CD3CN, 75 MHz, 298K) δ
172.3, 159.4, 146.7, 141.1, 136.1, 128.9, 127.8, 125.6, 123.5, 122.9, 121.7, 119.4, 119.1,
115.4, 107.2, 107, 58.4, 52.6, 40.7, 33.8, 26.1, 23.5, 19.8, 19.1, 13.2. IR (ATR) : ν (cm-1
) 3285
(w), 2959 (νC-H, m), 2932 (νC-H, m ), 2872 (νC-H, m), 1672 (νC, s), 1610 (m), 1575
(m), 1514 (s), 1480 (s), 1459 (m), 1333 (m), 1273 (m), 1158 (w), 1122 (w), 1087 (m), 1026
(s), 938 (νMo=O, vs), 917 (νMo=O, vs), 899 (νMo=O, vs), 806 (m), 747 (m), 654 (νMo-O-
Mo, vs, br.), 562 (m). Anal. Calcd for MnMo6O28C77H142N7 (2244.6): Mn, 2.45 ; Mo, 25.65 ;
C, 41.21 ; H, 6.33 ; N, 4.37. Found: Mn, 2.42 ; Mo, 24.92 ; C, 41.19 ; H, 6.41 ; N, 4.33.
Synthesis of 2, (TBA)3[MnMo6O18{(OCH2)3CNHC21H19N2O4}2]
To a solution of SPCO2H (462 mg, 1.22 mmol) and EEDQ (324 mg, 1.32 mmol) in CH3CN
(15 mL), (TBA)3[MnMo6O18{(OCH2)3CNH2}2] (570 mg, 0.30 mmol) was added at room
temperature. The reaction mixture was stirred at 50°C during 48 h. The solvent was removed
under vacuum and the residue was dissolved in a minimum of CH3CN. The solution was
added to a large quantity of Et2O (40 mL). The resulting precipitate was then isolated by
filtration. This treatment was repeated three times (the last filtrate was no more coloured). 2
(558 mg, 0.21 mmol) was isolated as a pale pink solid in 71% yield.
1H NMR (CD3CN, 300 MHz, 298K) δ 65.02 (s, br., 12H, -CH2-O), 8.06 (s, 2H), 8.00 (d, 2H, J
= 8.8 Hz), 7.20-7.10 (m, 6H), 6.85 (t, 2H, J = 7.3 Hz), 6.71 (m, 4H), 6.46 (br., 2H), 5.88 (d,
2H, He, J = 7.7 Hz), 3.52 (m, 2H), 3.35 (m, 2H), 3.12 (m, 24H, -NCH2- (TBA)), 2.71 (m, 4H),
1.62 (m, 24H, -NCH2CH2- (TBA)), 1.38 (m, 24H, -NCH2CH2CH2- (TBA)), 1.24 (s, 6H, -
CH3), 1.13 (s, 6H, -CH3), 0.98 (m, 36H, -CH3 (TBA)).13
C NMR (CD3CN, 75 MHz, 298K) δ
172.3, 159.4, 146.8, 141.1, 136.1, 128.9, 127.8, 125.6, 123.5, 122.9, 121.7, 119.4, 119.1,
115.5, 107.2, 107.1, 58.4, 52.6, 36.7, 26.1, 23.5, 19.7, 19.1, 13.2. IR (ATR) : ν (cm-1
) 3294
(w), 2960 (νC-H, m), 2933 (νC-H, m ), 2871 (νC-H, m), 1673 (νC, s), 1608 (m), 1575
(m), 1514 (s), 1480 (s), 1459 (m), 1333 (m), 1273 (m), 1159 (w), 1111 (w), 1087 (m), 1063
(m), 1022 (s), 939 (νMo=O, vs), 918 (νMo=O, vs), 900 (νMo=O, vs), 806 (m), 746 (m), 657
(νMo-O-Mo, vs, br.), 562 (m). Anal. Calcd for MnMo6O32C98H160N9 (2607.0) : Mn, 2.11 ;
Mo, 22.08 ; C, 45.15 ; H, 6.19 ; N, 4.84. Found : Mn, 2.09 ; Mo, 22.13 ; C, 45.04 ; 6.13 ; N,
4.70.
Electronic Supplementary Material (ESI) for Chemical CommunicationsThis journal is © The Royal Society of Chemistry 2012

5
S2 Solution 1H NMR
PUBLI O254 300 MHZ 0612.esp
3.5 3.0 2.5 2.0 1.5 1.0 0.5
Chemical Shift (ppm)
0
0.1
0.2
0.3
0.4
0.5
0.6
0.7
0.8
0.9
1.0
No
rma
lized
In
ten
sity
33.413.143.0723.1024.012.241.781.57
PUBLI O254 300 MHZ 0612.esp
8.5 8.0 7.5 7.0 6.5 6.0 5.5
Chemical Shift (ppm)
0
0.05
0.10
0.15
No
rma
lized
In
ten
sity
0.942.111.143.221.071.13
PUBLI O256 300 MHZ 0612.ESP
3.5 3.0 2.5 2.0 1.5 1.0 0.5 0
Chemical Shift (ppm)
0
0.1
0.2
0.3
0.4
0.5
0.6
0.7
0.8
0.9
1.0
No
rma
lized
In
ten
sity
36.795.995.8023.9324.013.3923.301.871.82
PUBLI O256 300 MHZ 0612.ESP
8.5 8.0 7.5 7.0 6.5 6.0 5.5 5.0
Chemical Shift (ppm)
0
0.05
0.10
0.15
0.20
0.25
No
rma
lized
In
ten
sity
1.793.902.206.021.822.00
O254 PROTON MnMo6SP.esp
70 65 60 55 50 45 40 35 30
Chemical Shift (ppm)
0
0.01
0.02
0.03
0.04
0.05
0.06
0.07
0.08
0.09
0.10
0.11
No
rma
lized
In
ten
sity
O256 MnMo6SP2.esp
70 65 60 55 50 45 40 35 30
Chemical Shift (ppm)
0
0.01
0.02
0.03
0.04
0.05
0.06
0.07N
orm
alized
In
ten
sity
Publi O269 SPTRIS 300.esp
3.5 3.0 2.5 2.0 1.5 1.0 0.5 0
Chemical Shift (ppm)
0
0.1
0.2
0.3
0.4
0.5
0.6
0.7
0.8
0.9
1.0
No
rma
lized
In
ten
sity
2.733.061.071.146.181.431.09
Publi O269 SPTRIS 300.esp
8.5 8.0 7.5 7.0 6.5 6.0 5.5 5.0
Chemical Shift (ppm)
0
0.1
0.2
0.3
0.4
0.5
0.6
0.7
0.8
0.9
1.0
No
rma
lized
In
ten
sity
1.000.981.060.922.051.011.061.95
O254 PROTON MnMo6SP.esp
70 65 60 55 50 45 40 35 30
Chemical Shift (ppm)
0
0.01
0.02
0.03
0.04
0.05
0.06
0.07
0.08
0.09
0.10
0.11
No
rma
lized
In
ten
sity
--//----//--65 60
a)
b)
c)
8.0 7.5 7.0 6.5 6.0 1.5 1.0 0.5
Chemical shift (ppm)
Comparison of the 1H NMR spectra for a) SPtris (in CDCl3) b) 1 (in CD3CN) and c) 2 (in
CD3CN) in methyl and TBA region (0.5-1.8 ppm), aromatic region (5.75-8.2 ppm) and in the
59-67 ppm range corresponding to the methylene protons close to the MnIII
centre in the
organic-inorganic hybrids. Obviously, for 1 and 2, we observe a different ratio between the
integration relative to the TBA protons (signals at 1.62, 1.38 and 0.98 ppm integrated for 24,
24 and 36 protons respectively) and the spiropyran moiety(ies): aromatic region and signals at
1.24 and 1.13 ppm corresponding to the methyl groups (each one is integrated for 3 protons
for compound 1or 6 protons for 2).
In the spectrum of SPtris (a), indicates the presence of ethyl acetate solvent.
Electronic Supplementary Material (ESI) for Chemical CommunicationsThis journal is © The Royal Society of Chemistry 2012
6
S3 IR Spectra of 1 and 2
0
10
20
30
40
50
60
70
80
90
100
50010001500200025003000
Wavenumber (cm-1)
0
10
20
30
40
50
60
70
80
90
100
50010001500200025003000
Wavenumber (cm-1)
0
10
20
30
40
50
60
70
80
90
100
50010001500200025003000
Wavenumber (cm-1)
Tran
smit
tan
ce
Wavenumber (cm-1)
1
2
Electronic Supplementary Material (ESI) for Chemical CommunicationsThis journal is © The Royal Society of Chemistry 2012
7
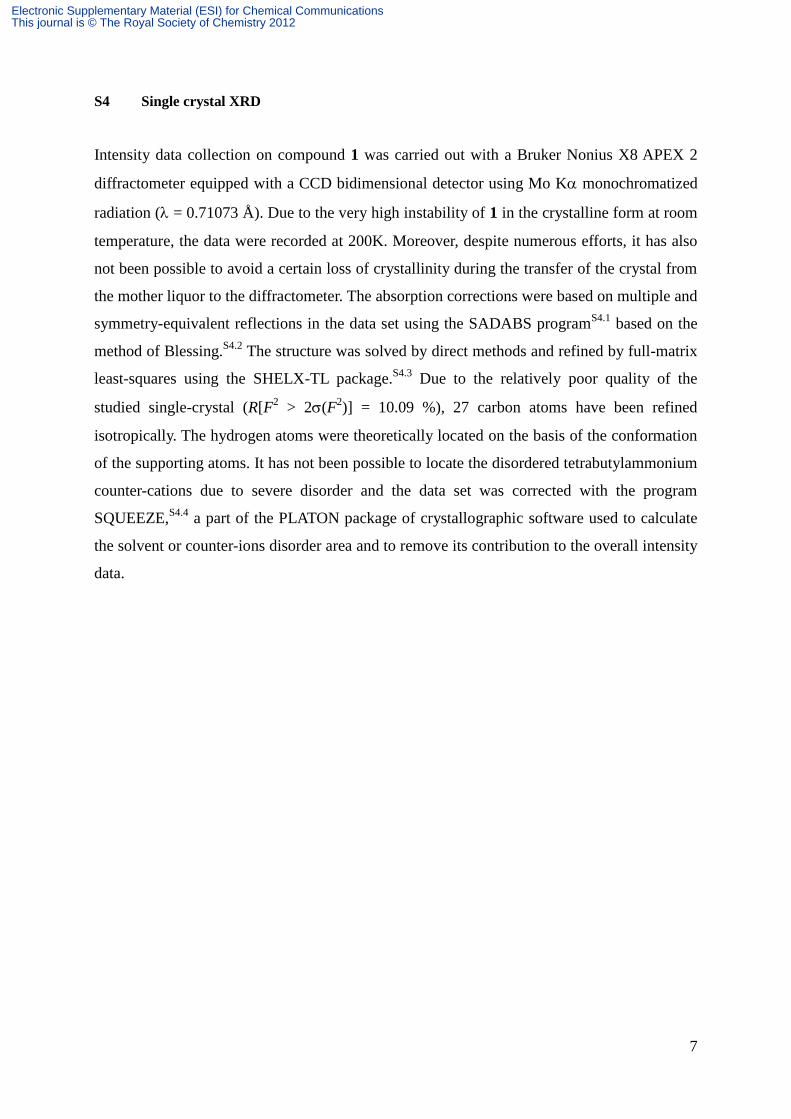
S4 Single crystal XRD
Intensity data collection on compound 1 was carried out with a Bruker Nonius X8 APEX 2
diffractometer equipped with a CCD bidimensional detector using Mo K monochromatized
radiation ( = 0.71073 Å). Due to the very high instability of 1 in the crystalline form at room
temperature, the data were recorded at 200K. Moreover, despite numerous efforts, it has also
not been possible to avoid a certain loss of crystallinity during the transfer of the crystal from
the mother liquor to the diffractometer. The absorption corrections were based on multiple and
symmetry-equivalent reflections in the data set using the SADABS programS4.1
based on the
method of Blessing.S4.2
The structure was solved by direct methods and refined by full-matrix
least-squares using the SHELX-TL package.S4.3
Due to the relatively poor quality of the
studied single-crystal (R[F2 > 2(F
2)] = 10.09 %), 27 carbon atoms have been refined
isotropically. The hydrogen atoms were theoretically located on the basis of the conformation
of the supporting atoms. It has not been possible to locate the disordered tetrabutylammonium
counter-cations due to severe disorder and the data set was corrected with the program
SQUEEZE,S4.4
a part of the PLATON package of crystallographic software used to calculate
the solvent or counter-ions disorder area and to remove its contribution to the overall intensity
data.
Electronic Supplementary Material (ESI) for Chemical CommunicationsThis journal is © The Royal Society of Chemistry 2012
8
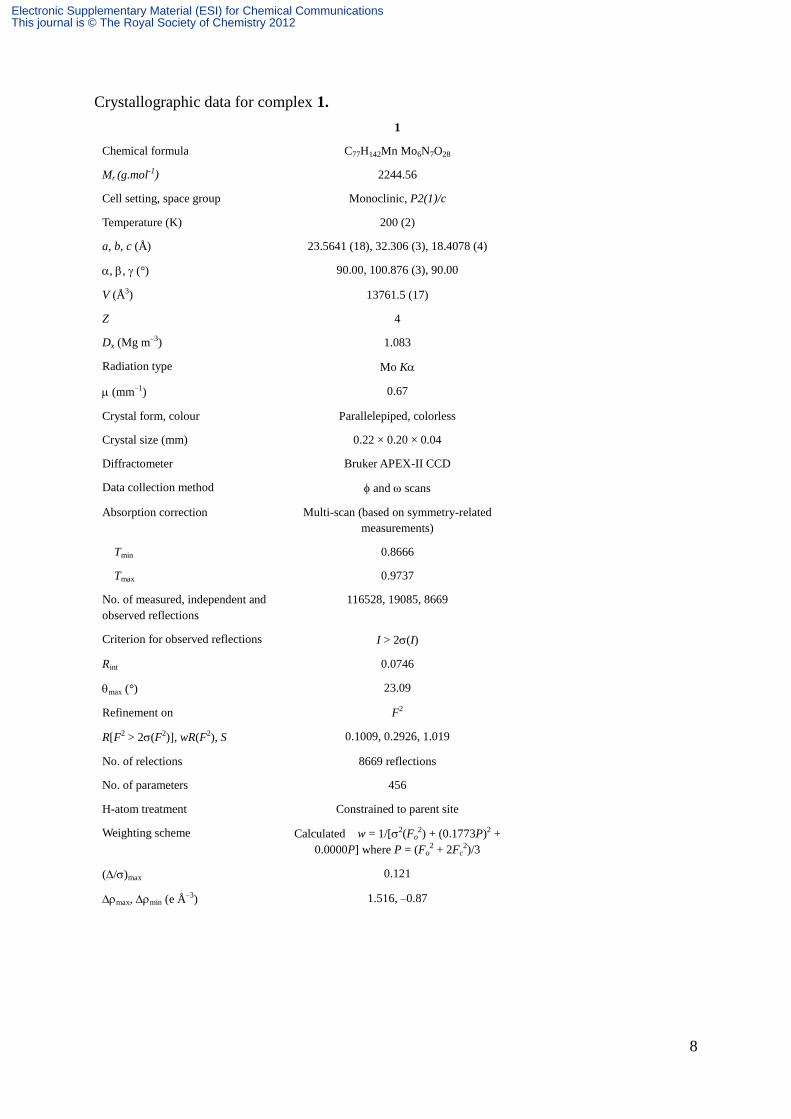
Crystallographic data for complex 1.
1
Chemical formula C77H142Mn Mo6N7O28
Mr (g.mol-1) 2244.56
Cell setting, space group Monoclinic, P2(1)/c
Temperature (K) 200 (2)
a, b, c (Å) 23.5641 (18), 32.306 (3), 18.4078 (4)
, , (°) 90.00, 100.876 (3), 90.00
V (Å3) 13761.5 (17)
Z 4
Dx (Mg m–3) 1.083
Radiation type Mo K
(mm–1) 0.67
Crystal form, colour Parallelepiped, colorless
Crystal size (mm) 0.22 × 0.20 × 0.04
Diffractometer Bruker APEX-II CCD
Data collection method and scans
Absorption correction Multi-scan (based on symmetry-related
measurements)
Tmin 0.8666
Tmax 0.9737
No. of measured, independent and
observed reflections
116528, 19085, 8669
Criterion for observed reflections I > 2(I)
Rint 0.0746
max (°) 23.09
Refinement on F2
R[F2 > 2(F2)], wR(F2), S 0.1009, 0.2926, 1.019
No. of relections 8669 reflections
No. of parameters 456
H-atom treatment Constrained to parent site
Weighting scheme Calculated w = 1/[2(Fo2) + (0.1773P)2 +
0.0000P] where P = (Fo2 + 2Fc
2)/3
(/)max 0.121
max, min (e Å–3) 1.516, –0.87
Electronic Supplementary Material (ESI) for Chemical CommunicationsThis journal is © The Royal Society of Chemistry 2012
9
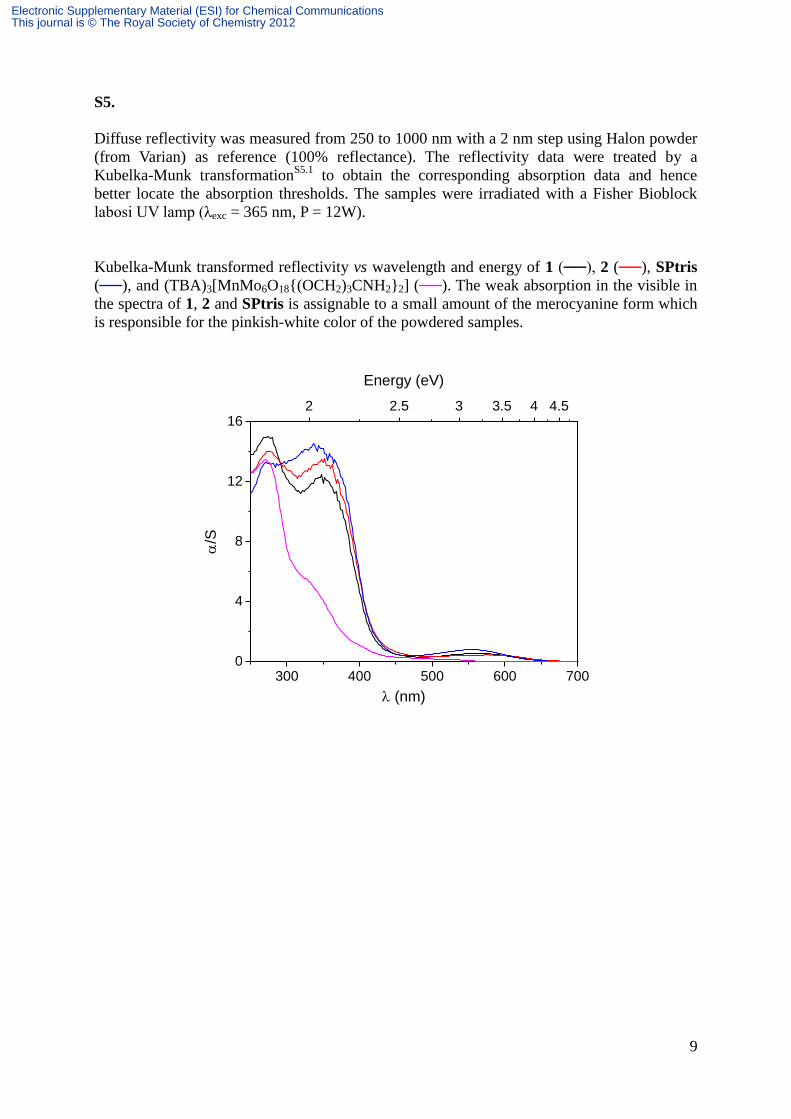
S5.
Diffuse reflectivity was measured from 250 to 1000 nm with a 2 nm step using Halon powder
(from Varian) as reference (100% reflectance). The reflectivity data were treated by a
Kubelka-Munk transformationS5.1
to obtain the corresponding absorption data and hence
better locate the absorption thresholds. The samples were irradiated with a Fisher Bioblock
labosi UV lamp (λexc = 365 nm, P = 12W).
Kubelka-Munk transformed reflectivity vs wavelength and energy of 1 (──), 2 (──), SPtris
(──), and (TBA)3[MnMo6O18{(OCH2)3CNH2}2] (──). The weak absorption in the visible in
the spectra of 1, 2 and SPtris is assignable to a small amount of the merocyanine form which
is responsible for the pinkish-white color of the powdered samples.
300 400 500 600 7000
4
8
12
16
2 2.5 3 3.5 4 4.5
(nm)
Energy (eV)
/S
Electronic Supplementary Material (ESI) for Chemical CommunicationsThis journal is © The Royal Society of Chemistry 2012

10
S6. Top: Evolution of the color of 2 powder at different 365 nm-UV irradiation time. Bottom:
Kubelka-Munk transformed reflectivity of 2 after 0, 0.333, 0.666, 1, 1.5, 2, 3, 4, 6, 10, 15, and
30 min of irradiation at 365 nm.
Electronic Supplementary Material (ESI) for Chemical CommunicationsThis journal is © The Royal Society of Chemistry 2012
11
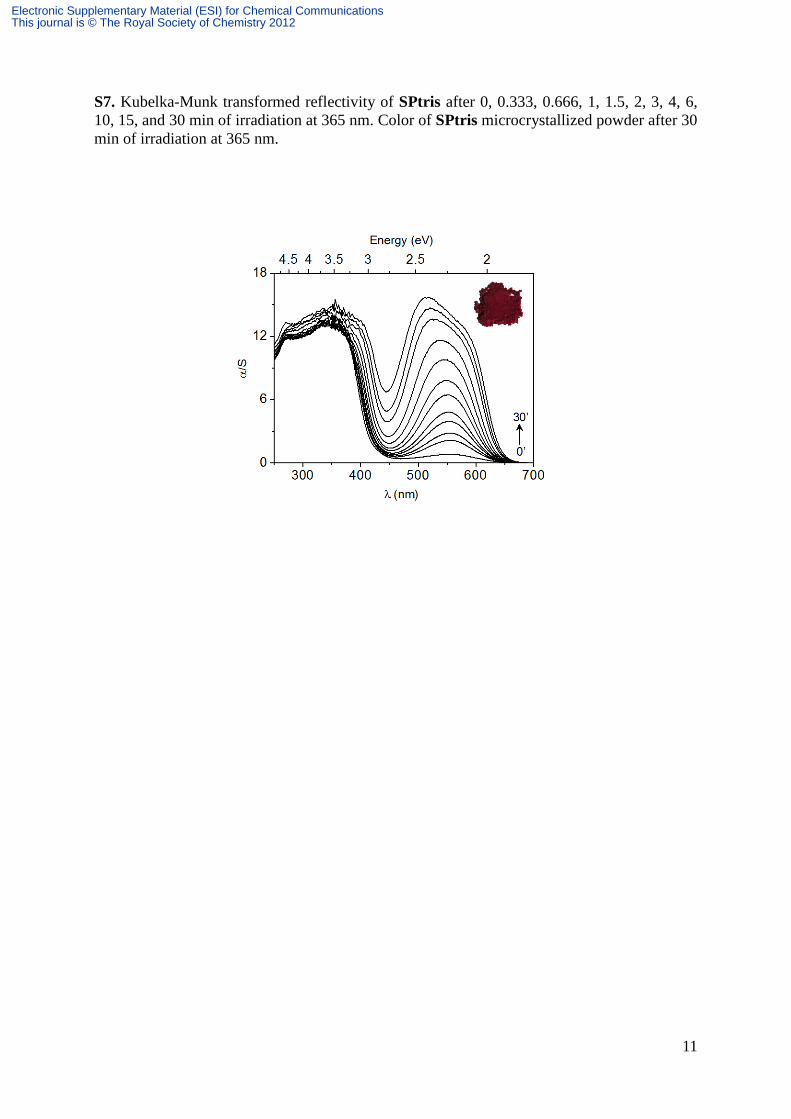
S7. Kubelka-Munk transformed reflectivity of SPtris after 0, 0.333, 0.666, 1, 1.5, 2, 3, 4, 6,
10, 15, and 30 min of irradiation at 365 nm. Color of SPtris microcrystallized powder after 30
min of irradiation at 365 nm.
Electronic Supplementary Material (ESI) for Chemical CommunicationsThis journal is © The Royal Society of Chemistry 2012
12
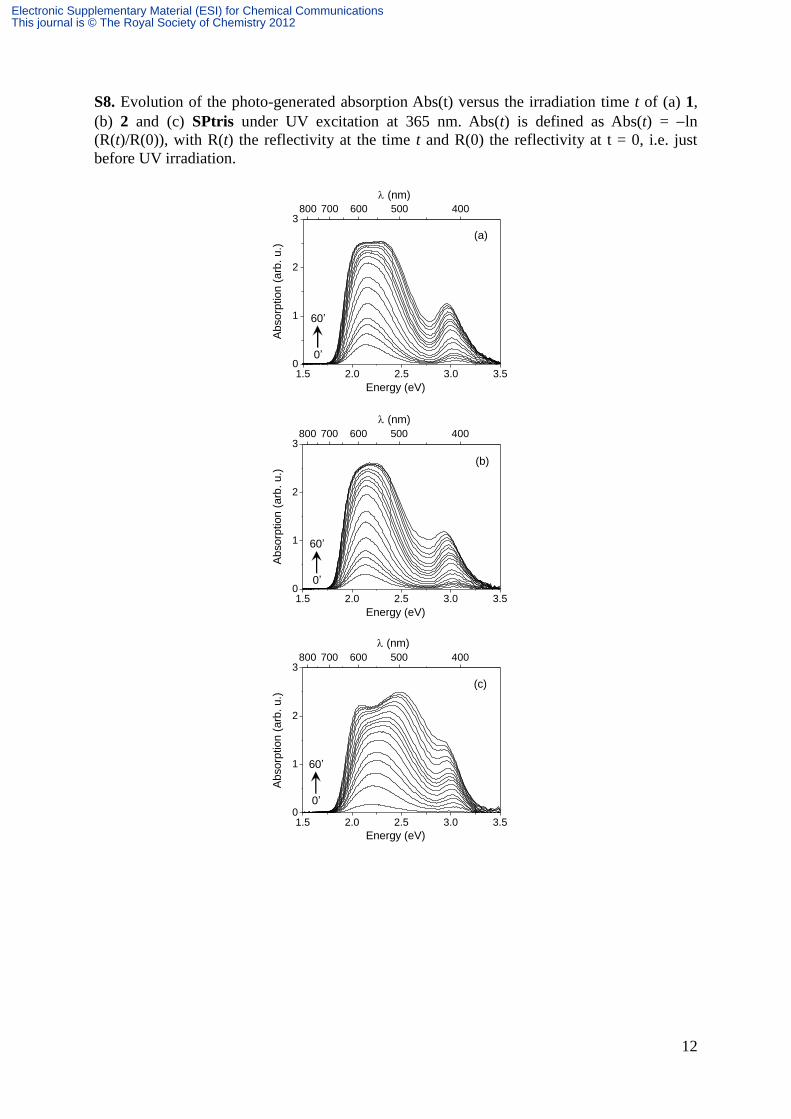
S8. Evolution of the photo-generated absorption Abs(t) versus the irradiation time t of (a) 1,
(b) 2 and (c) SPtris under UV excitation at 365 nm. Abs(t) is defined as Abs(t) = ln
(R(t)/R(0)), with R(t) the reflectivity at the time t and R(0) the reflectivity at t = 0, i.e. just
before UV irradiation.
1.5 2.0 2.5 3.0 3.50
1
2
3
800 700 600 500 400
1.5 2.0 2.5 3.0 3.50
1
2
3
800 700 600 500 400
1.5 2.0 2.5 3.0 3.50
1
2
3
800 700 600 500 400
(nm)
Energy (eV)
Ab
so
rption
(a
rb.
u.)
(a)
(nm)
Energy (eV)
Ab
so
rption
(a
rb.
u.)
(b)
(nm)
Energy (eV)
Ab
so
rption
(a
rb.
u.)
(c)
0’
60’
0’
60’
0’
60’
Electronic Supplementary Material (ESI) for Chemical CommunicationsThis journal is © The Royal Society of Chemistry 2012
13
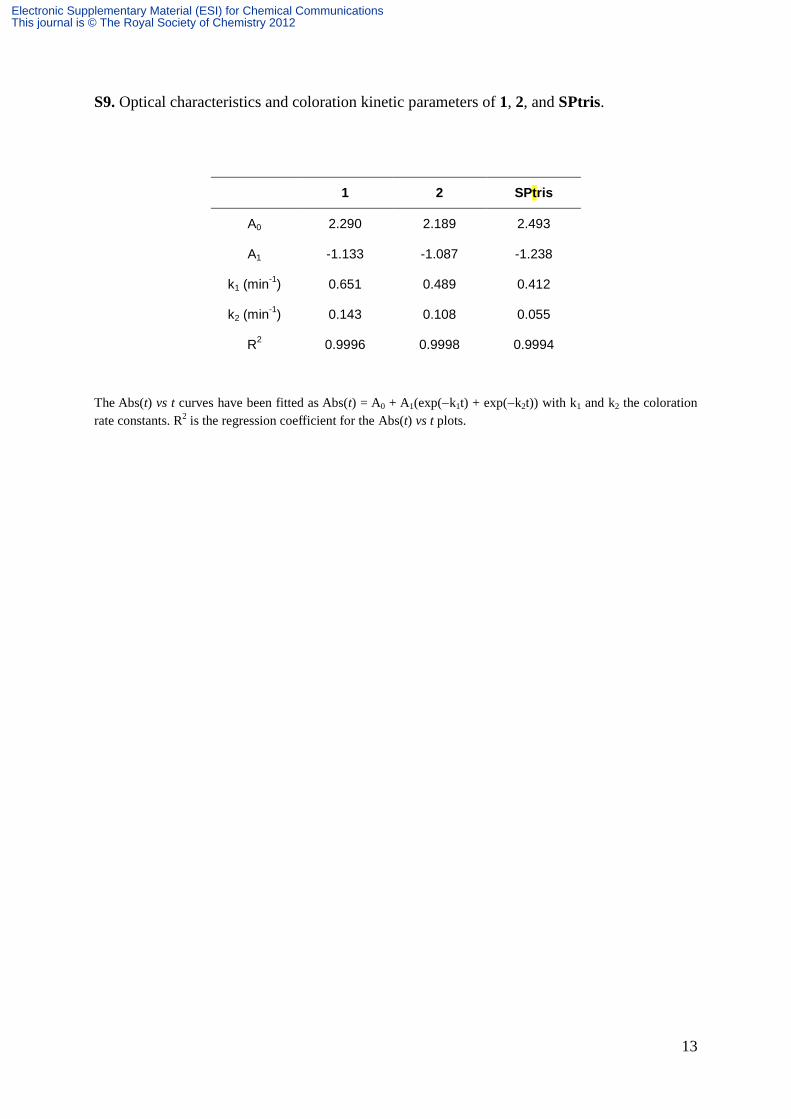
S9. Optical characteristics and coloration kinetic parameters of 1, 2, and SPtris.
1 2 SPtris
A0 2.290 2.189 2.493
A1 -1.133 -1.087 -1.238
k1 (min-1
) 0.651 0.489 0.412
k2 (min-1
) 0.143 0.108 0.055
R2 0.9996 0.9998 0.9994
The Abs(t) vs t curves have been fitted as Abs(t) = A0 + A1(exp(k1t) + exp(k2t)) with k1 and k2 the coloration
rate constants. R2 is the regression coefficient for the Abs(t) vs t plots.
Electronic Supplementary Material (ESI) for Chemical CommunicationsThis journal is © The Royal Society of Chemistry 2012
14
S10. Electrochemistry and Spectroelectrochemistry data
Electrochemistry materials, apparatus and procedures
For electrochemical experiments, the source, mounting and polishing of the glassy carbon
(GC, Le Carbone Lorraine, France) electrodes has been described previously.S10.1
The
electrochemical set-up was an EG & G 273 A driven by a PC with the M270 software.
Potentials are measured against a saturated calomel reference electrode (SCE). The counter
electrode was a platinum gauze of large surface area. Freshly distilled DMF was used
throughout. The solutions were deaerated thoroughly for at least 30 minutes with pure argon
and kept under a positive pressure of this gas during the experiments. The supporting
electrolyte was 0.2 M LiClO4 in DMF. Spectroelectrochemical experiments were performed
in a three-compartment cell comprising a 1-cm optical path quartz cuvette. The working
electrode was a sheet of GC (V25, Le Carbone Lorraine, France). The whole cell remained
inserted in the spectrophometer cavity and kept under continuous argon bubbling and stirring
during electrolyses. A second 1-cm quartz cell was matched with that of the electrochemical
cell and served as a reference. UV-Visible spectra were recorded on a Perkin-Elmer Lambda
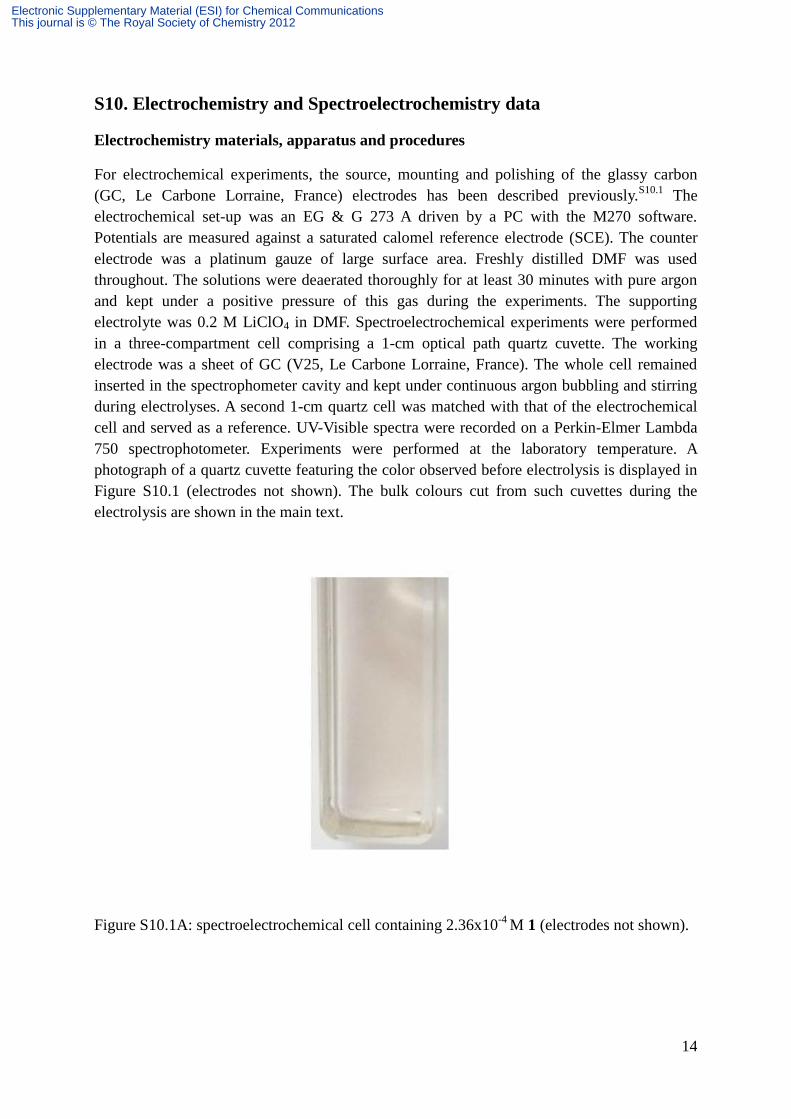
750 spectrophotometer. Experiments were performed at the laboratory temperature. A
photograph of a quartz cuvette featuring the color observed before electrolysis is displayed in
Figure S10.1 (electrodes not shown). The bulk colours cut from such cuvettes during the
electrolysis are shown in the main text.
Figure S10.1A: spectroelectrochemical cell containing 2.36x10⁻⁴
M 1 (electrodes not shown).
Electronic Supplementary Material (ESI) for Chemical CommunicationsThis journal is © The Royal Society of Chemistry 2012
15
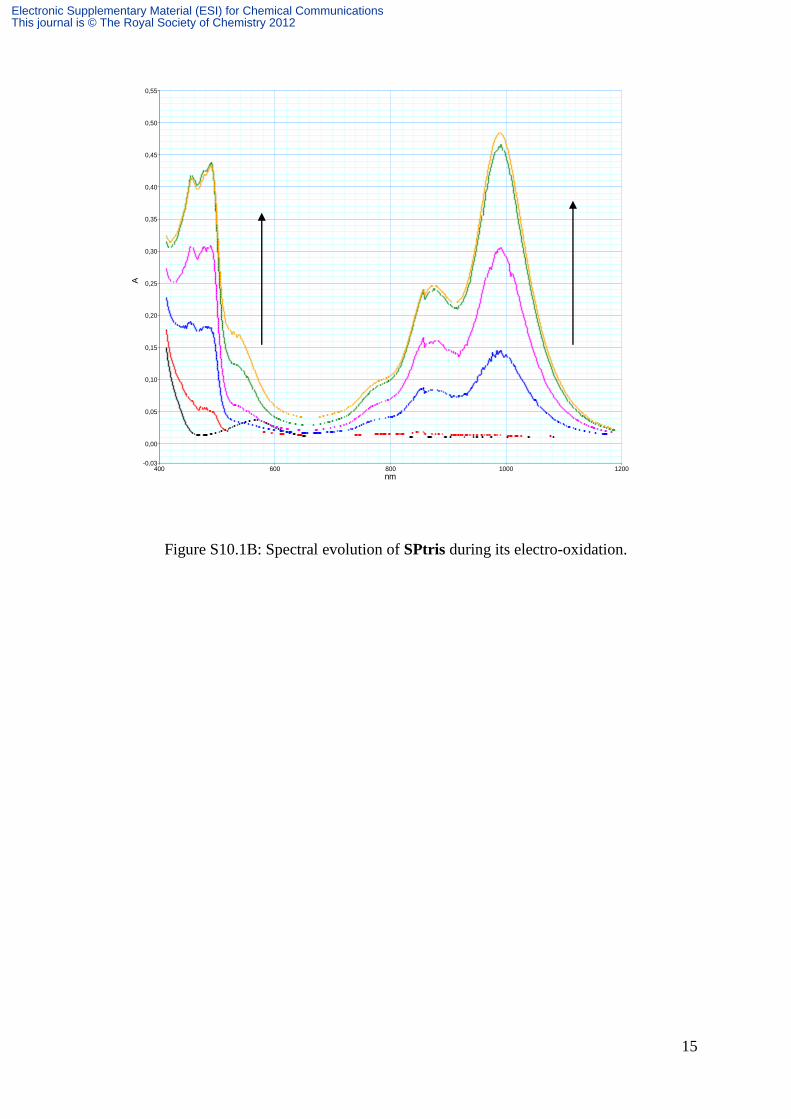
Figure S10.1B: Spectral evolution of SPtris during its electro-oxidation.
400 1200600 800 1000
0,55
-0,03
0,00
0,05
0,10
0,15
0,20
0,25
0,30
0,35
0,40
0,45
0,50
nm
A
Electronic Supplementary Material (ESI) for Chemical CommunicationsThis journal is © The Royal Society of Chemistry 2012
16
Electrochemical characterization of the various species
Note: SPtris refers to the spiropyran entity(-ies) present in 1 and 2 whereas SPtris denotes the
pure organic ligand. MnMo6(tris)2 refers to the polyoxomolybdate cluster
(TBA)3[MnMo6O18{(OCH2)3CNH2}2]S1.2
.
The electroactive centers of these molecules are both oxidisable (Mn and SPtris centers) or
reducible (Mn, SPtris and Mo centers). On the corresponding cyclic voltammograms, their
peak potentials are observed successively in that order when the potential is scanned
respectively in the positive direction for oxidation processes and in the negative direction for
reduction processes. It happens that these two groups of processes are well-separated in
potential and will therefore be sequentially studied for clarity.
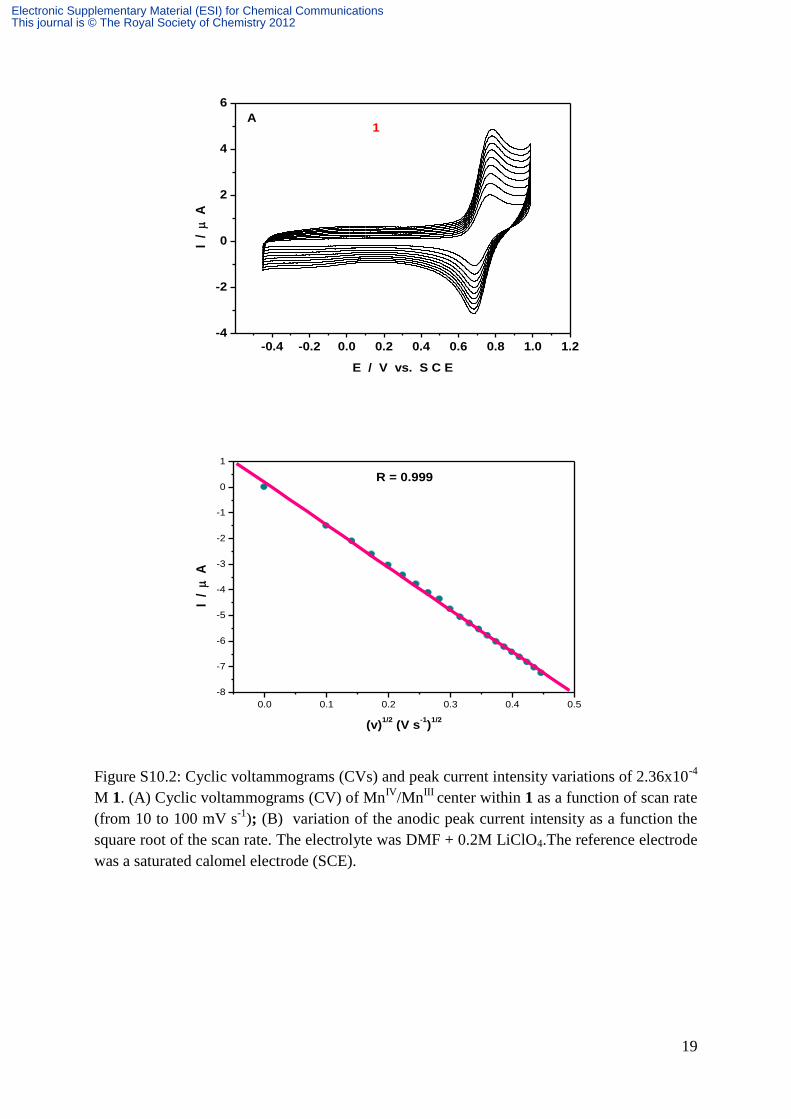
On the oxidation side, the MnIV
/MnIII
process is featured by a well-behaved cyclic
voltammogram. The results are illustrated for complex 1 selected as a representative. Figure
S10.2a shows this wave as a function of the potential scan rate. An excellent linearity is
observed for the peak current with the square root of the scan rate, thus indicating a diffusion
controlled behavior (Figure S10.2b). The oxidation peak potential is located at Ep = +0.774 V
vs SCE with the anodic to cathodic peak potential difference Ep = 80 mV at v = 0.1V s-1
.
Controlled potential coulometry at E = +0.850 V vs SCE gives a value of 1.04 electron per
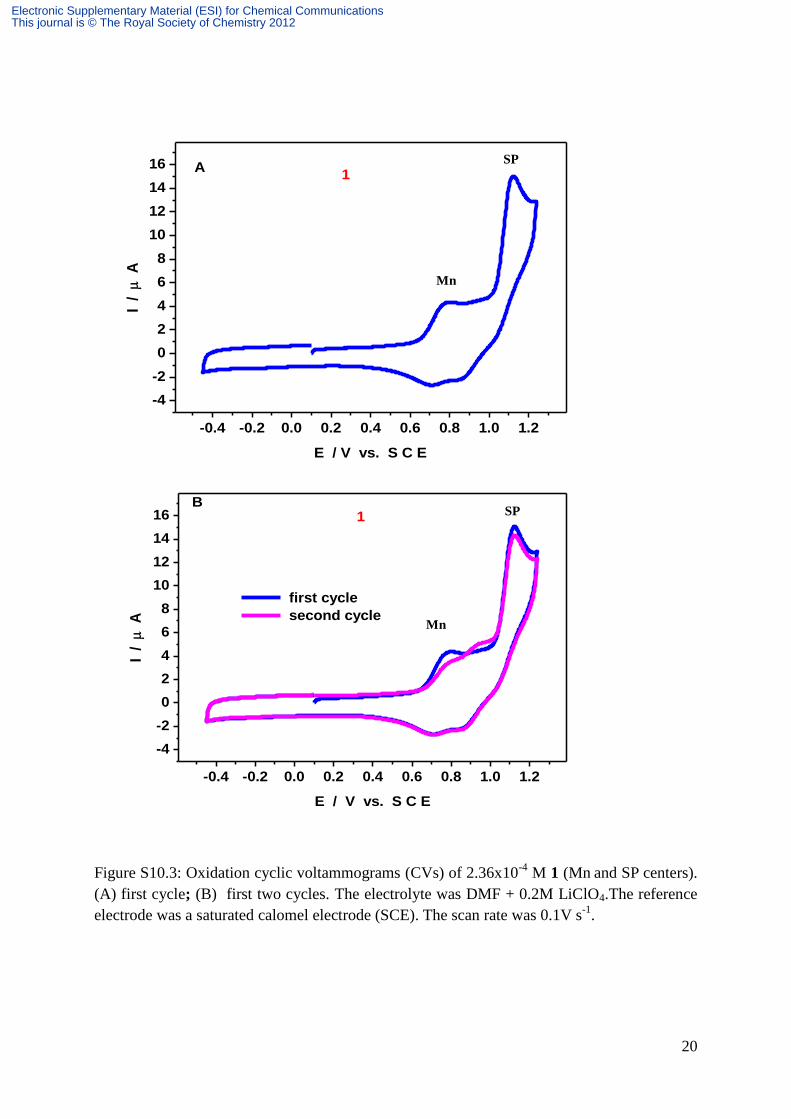
molecule, in agreement with expectations. Figure S10.3a shows the voltammetric pattern
observed when the potential is scanned more positively to reveal the SPtris oxidation wave.
The potential location of the broad overlapping reduction wave accompanying the SPtris
oxidation upon potential reversal should not be interpreted as a chemical reversibility, but is
rather indicative of formation of a new species.S11.2
In agreement with this interpretation,
Figure S10.3b confirms that during the second scan of the CV up to SPtris oxidation, a new
broad oxidation pattern was observed which can undergo reversible electrochemistry.S10.2, S10.3
However, the drop in the SPtris peak intensity indicates the apparent absence of any
electrochemical pathway back to SPtris from the oxidation species of the molecule 1. Finally,
we also compared the potential locations for 1, 2 and MnMo6(tris)2. SPtris substituents
appear to shift the oxidation potential in the positive direction based on their number. From
MnMo6(tris)2 to 2, the following values were measured E1→ MnMo6(tris)2 = 25 mV and E2→
MnMo6(tris)2 = 50 mV. At the very least, this observation would feature an electron withdrawing
ability of the SPtris substituent from the MnIII
center.
On the reduction side, Figure S10.4 shows the superposition of the voltammetric patterns of
MnMo6(tris)2 and 1. Considering MnMo6(tris)2 and scanning the potential in the negative
direction, the reduction of MnIII
to MnII is observed first (Ep = - 1 V vs SCE), followed by
that of Mo centers (Ep = -1.745 V vs SCE). On potential reversal, the MnIII
/MnII process
assumes a quasi reversible behavior and the re-oxidation of Mo centers is represented by two
broad oxidation waves. The chemical reversibility of the voltammetric pattern of Mo centers
should be noted because a contradictory claim is found in the literature: as a matter of fact, the
reduction of d0 Mo centers to the d
1 state within Anderson-type anions is expected to be
irreversible.S10.4
However, the present observation was repeatedly confirmed (vide infra). It is
worth noting that the CV of MnMo6(tris)2 was not published previously. Consequently,
Electronic Supplementary Material (ESI) for Chemical CommunicationsThis journal is © The Royal Society of Chemistry 2012
17
further work is planned to understand this behavior. As expected, a multielectron process is
observed for the Mo center.S10.4
In the case of 1, the voltammetric pattern displays an
additional broad wave featuring the reduction the SPtris center and located between the Mn
and Mo reduction centers. Actually, the potential locations of the Mn and Mo centers within 1
are slightly more positive than in MnMo6(tris)2. This observation is in agreement with the
parallel behavior described for the oxidation process of the Mn center in 1. Controlled
potential coulometry at E = -1.1 V vs SCE gives a value of 1.02 electron per molecule for
MnIII
→ MnII reduction within 1 and 1.08 electron per molecule in MnMo6(tris)2 . During
these electrolyses, a very pale yellow color was observed for MnII. As concerns Mo centers
within 1, a decrease in their reversibility is noted. Furthermore, comparison of the oxidation
waves of MnMo6(tris)2 and 1 suggests that the presence of the Anderson POM imparts some
stability to 1 relative to MnMo6(tris)2 (vide infra). Finally, it is worth noting by comparison
of the patterns of MnMo6(tris)2 and 1, that the Mo wave within 1 is partly engulfed in the
SPtris wave, a behavior tentatively attributable to the very large peak of SPtris (vide infra).
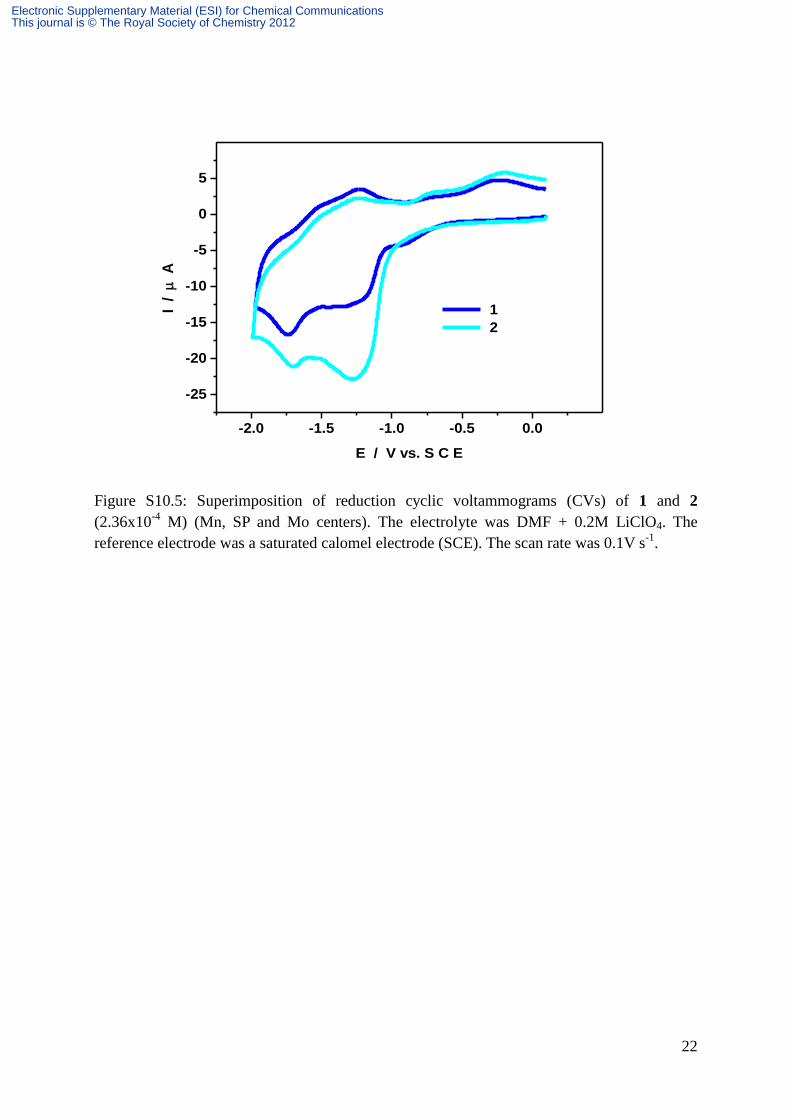
Figure S10.5 compares the voltammetric patterns of 1 and 2. The salient feature is that the
current intensity of the SPtris center within 2 is twice as large as the corresponding wave of 1,
as expected. This behavior of 2 renders the Mn wave less separated from the SPtris wave.
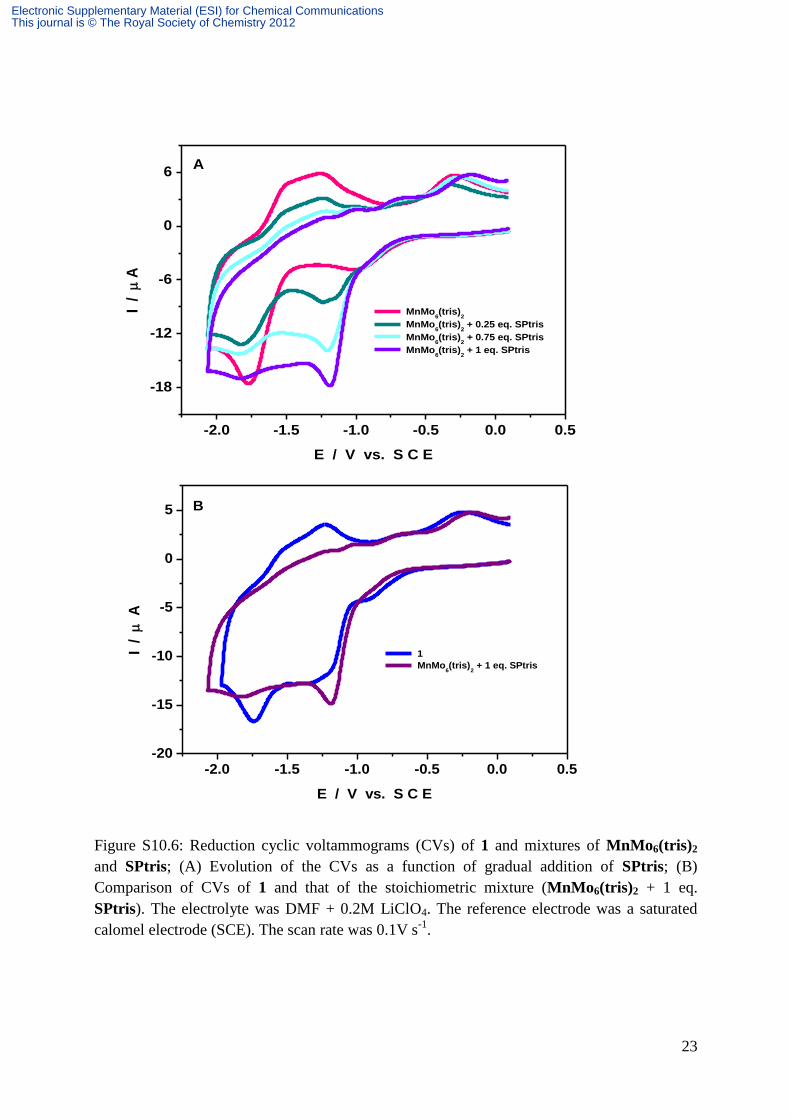
Finally, we set out to check whether mere stepwise addition up to the appropriate
stoichiometry of the POM and SPtris would simulate 1 and show the same voltammetric
pattern. Figure S10.6a sketches the main patterns of interest. It is worth noting that the two
species should display different diffusion coefficients. Starting with the POM, the striking
observation following gradual addition of SPtris is that the Mo wave is well-separated from
the SPtris wave and well-behaved. Then, the mixing up of the two waves begins. Ultimately,
when the stoichiometry is reached, partial engulfment of the Mo wave is obtained. Strikingly,
this Mo wave is irreversible, clearly at variance with the voltammetric behavior of 1. Figure
S10.6b shows in superposition the cyclic voltammograms of 1 and simulated 1. Our
observations would indicate that covalently bonding the SPtris and the POM to create 1
generates voltammetric behaviors not present in the mixture of the components.
Spectroelectrochemical characterization of SPtris,1 and 2 in the reductive domain
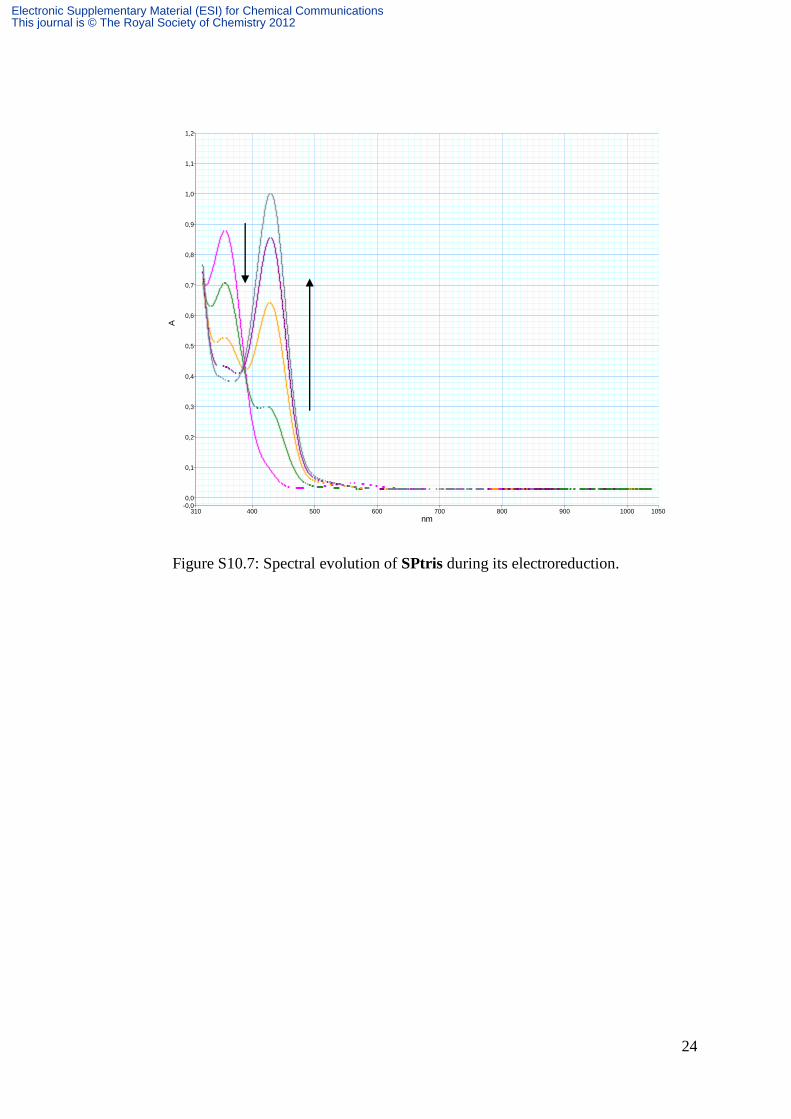
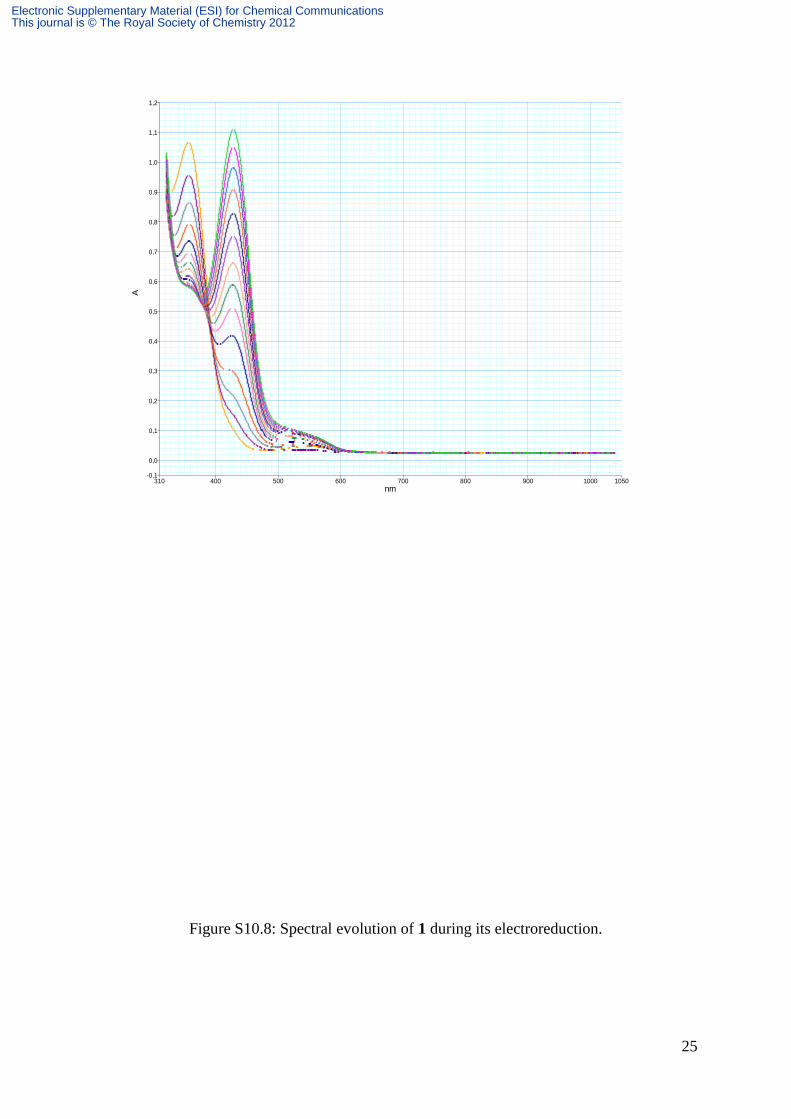
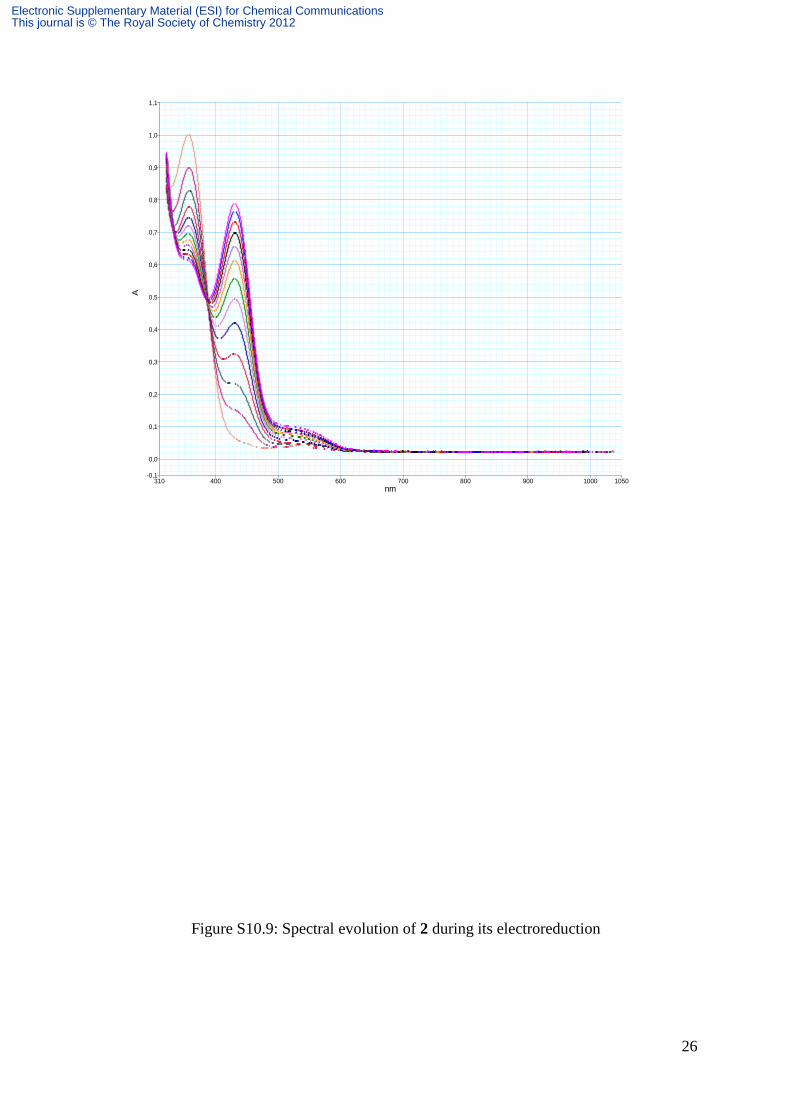
Detailed evolution of spectra during reduction processes is represented on Figures S10.7,
S10.8 for SPtris, S10.9 and S10.10 respectively for 1 and 2. All these spectra display a peak
at 420 nm followed by a shoulder around 550 nm associated with the color of reduced MC.
This shoulder is hardly visible on the spectrum of SPtris during the electrolysis of the latter.
However, as soon as the system is switched to open circuit, this band appears and its intensity
increases at the expense of the peak at 420 nm, up to a saturation point from which its gradual
decrease was observed in favor of the peak at 420 nm (Figure S10.8). Consequently, for
SPtris, in contrast with 1 and 2, the electrolysis must be stopped before observing the color of
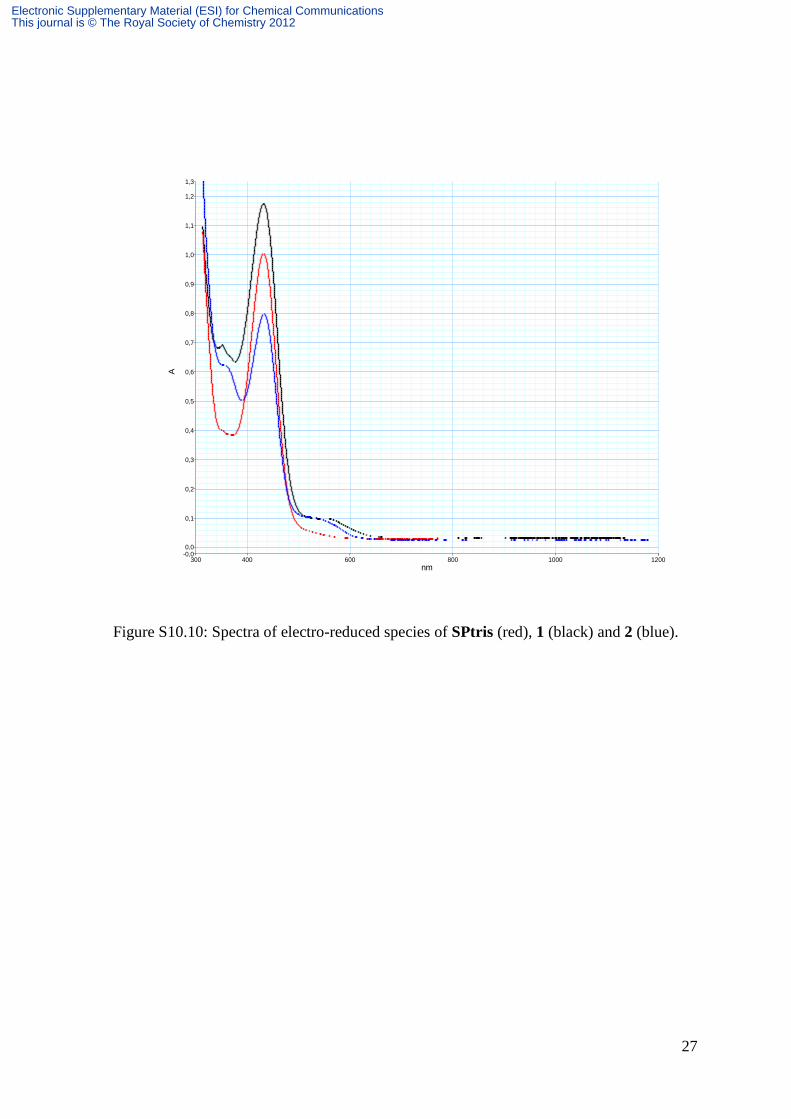
reduced MC. Figure S10.11 compares the spectra of the reduced forms of SPtris, 1 and 2
during the electrolysis. It must be noted that the shoulder around 550 nm in 1 is shifted to the
red related to that in 2.
Electronic Supplementary Material (ESI) for Chemical CommunicationsThis journal is © The Royal Society of Chemistry 2012
18
Remarks on electrochromism
The favorable redox properties of the MnMo6(tris)2/spiropyran hybrids induce distinct
electrochromic states in the same molecule. In particular, the different redox states of the Mn
center generate a set of colors associated or not to those of the SP centers. The nuances of
colors described in this work were obtained during partial electrolyses (ca 60 % relative to
Mn). Thus pure yellow (MnII), or brown (Mn
IV) and their mixtures with respectively reduced
MC and oxidised MC colors were obtained. The reduction of Mo centres deepens the red
color of the MnII and reduced MC mixture. Due to the observed redox potentials of Mn and
SP, the Mn center is able to capture electrons from the reduced SP (or vice versa for oxidation
process) thus providing a straightforward pathway for the fading processes. It is worth noting
that the fading process of the mixture of colors observed after reduction of Mo centres is very
slow.
Both for electro-oxidation and electro-reduction, more detailed investigations of the
mechanistic pathways of formation of the species which induce the color sets remain a future
challenge. For example, the influence of key parameters such as solution temperature will be
studied.
.
Electronic Supplementary Material (ESI) for Chemical CommunicationsThis journal is © The Royal Society of Chemistry 2012
19
Figure S10.2: Cyclic voltammograms (CVs) and peak current intensity variations of 2.36x10⁻⁴
M 1. (A) Cyclic voltammograms (CV) of MnIV
/MnIII
center within 1 as a function of scan rate
(from 10 to 100 mV s-1
); (B) variation of the anodic peak current intensity as a function the
square root of the scan rate. The electrolyte was DMF + 0.2M LiClO4.The reference electrode
was a saturated calomel electrode (SCE).
-0.4 -0.2 0.0 0.2 0.4 0.6 0.8 1.0 1.2-4
-2
0
2
4
6
1A
I / A
E / V vs. S C E
0.0 0.1 0.2 0.3 0.4 0.5
-8
-7
-6
-5
-4
-3
-2
-1
0
1
I / A
(v)1/2
(V s-1)
1/2
R = 0.999
Electronic Supplementary Material (ESI) for Chemical CommunicationsThis journal is © The Royal Society of Chemistry 2012
20
Figure S10.3: Oxidation cyclic voltammograms (CVs) of 2.36x10⁻⁴
M 1 (Mn and SP centers).
(A) first cycle; (B) first two cycles. The electrolyte was DMF + 0.2M LiClO4.The reference
electrode was a saturated calomel electrode (SCE). The scan rate was 0.1V s-1
.
-0.4 -0.2 0.0 0.2 0.4 0.6 0.8 1.0 1.2
-4
-2
0
2
4
6
8
10
12
14
161
A
I / A
E / V vs. S C E
-0.4 -0.2 0.0 0.2 0.4 0.6 0.8 1.0 1.2
-4
-2
0
2
4
6
8
10
12
14
16B
1
I / A
E / V vs. S C E
first cycle
second cycle
Mn
SP
SP
Mn
Electronic Supplementary Material (ESI) for Chemical CommunicationsThis journal is © The Royal Society of Chemistry 2012

21
Figure S10.4: Reduction cyclic voltammograms (CVs) of 2.36x10⁻⁴
M 1 (Mn, SP and Mo
centers). The electrolyte was DMF + 0.2M LiClO4. The reference electrode was a saturated
calomel electrode (SCE). The scan rate was 0.1V s-1
.
-2.0 -1.5 -1.0 -0.5 0.0
-20
-15
-10
-5
0
5
I /
A
E / V vs. S C E
MnMo6(tris)
2
1
SP Mn
Mo
Electronic Supplementary Material (ESI) for Chemical CommunicationsThis journal is © The Royal Society of Chemistry 2012
22
Figure S10.5: Superimposition of reduction cyclic voltammograms (CVs) of 1 and 2
(2.36x10⁻⁴
M) (Mn, SP and Mo centers). The electrolyte was DMF + 0.2M LiClO4. The
reference electrode was a saturated calomel electrode (SCE). The scan rate was 0.1V s-1
.
-2.0 -1.5 -1.0 -0.5 0.0
-25
-20
-15
-10
-5
0
5
1
2
I /
A
E / V vs. S C E
Mn SP
Mo
Electronic Supplementary Material (ESI) for Chemical CommunicationsThis journal is © The Royal Society of Chemistry 2012
23
Figure S10.6: Reduction cyclic voltammograms (CVs) of 1 and mixtures of MnMo6(tris)2
and SPtris; (A) Evolution of the CVs as a function of gradual addition of SPtris; (B)
Comparison of CVs of 1 and that of the stoichiometric mixture (MnMo6(tris)2 + 1 eq.
SPtris). The electrolyte was DMF + 0.2M LiClO4. The reference electrode was a saturated
calomel electrode (SCE). The scan rate was 0.1V s-1
.
-2.0 -1.5 -1.0 -0.5 0.0 0.5
-18
-12
-6
0
6A
I / A
E / V vs. S C E
MnMo6(tris)
2
MnMo6(tris)
2 + 0.25 eq. SPtris
MnMo6(tris)
2 + 0.75 eq. SPtris
MnMo6(tris)
2 + 1 eq. SPtris
-2.0 -1.5 -1.0 -0.5 0.0 0.5-20
-15
-10
-5
0
5
B
I / A
E / V vs. S C E
1
MnMo6(tris)
2 + 1 eq. SPtris
Electronic Supplementary Material (ESI) for Chemical CommunicationsThis journal is © The Royal Society of Chemistry 2012
24
Figure S10.7: Spectral evolution of SPtris during its electroreduction.
310 1050400 500 600 700 800 900 1000
1,2
-0,00,0
0,1
0,2
0,3
0,4
0,5
0,6
0,7
0,8
0,9
1,0
1,1
nm
A
Electronic Supplementary Material (ESI) for Chemical CommunicationsThis journal is © The Royal Society of Chemistry 2012
25
Figure S10.8: Spectral evolution of 1 during its electroreduction.
310 1050400 500 600 700 800 900 1000
1,2
-0,1
0,0
0,1
0,2
0,3
0,4
0,5
0,6
0,7
0,8
0,9
1,0
1,1
nm
A
Electronic Supplementary Material (ESI) for Chemical CommunicationsThis journal is © The Royal Society of Chemistry 2012
26
Figure S10.9: Spectral evolution of 2 during its electroreduction
310 1050400 500 600 700 800 900 1000
1,1
-0,1
0,0
0,1
0,2
0,3
0,4
0,5
0,6
0,7
0,8
0,9
1,0
nm
A
Electronic Supplementary Material (ESI) for Chemical CommunicationsThis journal is © The Royal Society of Chemistry 2012
27
Figure S10.10: Spectra of electro-reduced species of SPtris (red), 1 (black) and 2 (blue).
300 1200400 600 800 1000
1,3
-0,00,0
0,1
0,2
0,3
0,4
0,5
0,6
0,7
0,8
0,9
1,0
1,1
1,2
nm
A
Electronic Supplementary Material (ESI) for Chemical CommunicationsThis journal is © The Royal Society of Chemistry 2012
28
S11 References
S1.1 A. Fissi, O. Pieroni, G. Ruggeri and F. Ciardelli, Macromolecules, 1995, 28,
302.
S1.2 P.R. Marcoux, B. Hasenknopf, J. Vaissermann and P. Gouzerh, Eur. J. Inorg.
Chem., 2003, 2406.
S1.3 A. Nayak, H. Liu and G. Belfort, Angew. Chem. Int. Ed., 2006, 45, 4094.
S4.1 G. M. Sheldrick, SADABS, program for scaling and correction of area detector
data, University of Göttingen, Germany, 1997.
S4.2 R. Blessing, Acta Crystallogr. 1995, A51, 33.
S4.3 G. M. Sheldrick, SHELX-TL version 5.03, Software Package for the Crystal
Structure Determination, Siemens Analytical X-ray Instrument Division,
Madison, WI USA, 1994.
S4.4 P. van der Sluis and A. L. Spek, Acta Crystallogr., Sect. A., 1990, 46, 194.
S5.1 P. Kubelka and F. Munk, Z. Techn. Physik 1931, 12, 593-601.
S10.1 B. Keita and L. Nadjo J. Electroanal. Chem. 1988, 243, 87-103.
S10.2 K. Wagner, R. Byrne, M. Zanoni, S. Gambhir, L. Dennany, R. Breukers, M.
Higgins, P. Wagner, D. Diamond, G. G. Wallace and D. L. Officer, J. Am.
Chem. Soc., 2011, 133, 5453.
S10.3 R. T. F. Jukes, B. Bozic, F. Hartl, P. Belser and L. De Cola, Inorg. Chem. 2006,
45, 8326.
S10.4 M. T. Pope Heteropoly and Isopoly Oxometalates, Springer-Verlag, Berlin,
1983.
Electronic Supplementary Material (ESI) for Chemical CommunicationsThis journal is © The Royal Society of Chemistry 2012