phosphorus use efficiency in production agriculture - firt · phosphorus use efficiency in...
TRANSCRIPT
Phosphorus Use Efficiency in Production Agriculture
Paul Fixen
2007 Fertilizer Outlook and Technology 2007 Fertilizer Outlook and Technology ConferenceConferenceNov. 7, 2006

Better Crops, Better Environment ... through ScienceBetter Crops, Better Environment ... through Science
A new, not-for-profit organization
Purpose: To help provide a coordinated scientific foundation for fertilizer nutrient use and to
scientifically address the associated environmental issues

IPNI Founding Members

A key challenge for agriculture
1.561.56Predicted increase in global demand for corn, rice, and wheat from 1995 to 2025*
Annual Annual %%
ParameterParameter
* Rosegrant et al. (2002, Food Policy Research Institute) as modified by Cassman(2006) to include 5% of global grain supply in 2025 used for production of biofueland bio-based industrial feedstocks.** All rates of gain in cereal yields are decidedly linear over the past 40 yrs (Cassman, 2006); proportional rates of gain are based on 2004 yields.
Kg/ha/yr**
1.421.42Wheat, 41Wheat, 411.361.36Rice, 54Rice, 541.241.24Global rate of yield increase, 1966-2004: Corn, 61Corn, 61

U.S. corn yields, 1964 to 2006
y = 1.836x - 3536.3R2 = 0.84
0
20
40
60
80
100
120
140
160
180
1960 1965 1970 1975 1980 1985 1990 1995 2000 2005
Cor
n yi
eld,
bu/
A
43 years of 1.84 43 years of 1.84 bubu/A/yr/A/yr
Concept by Cassman, 2006
Genetic Genetic
improvement improvement
Expansion ofExpansion of
irrigation irrigation
Increase inIncrease in
N fertilization N fertilization
Soil testing & balanced
Soil testing & balanced
NPK fertilization
NPK fertilization
IPM IPM TransgenicTransgenic
traits traits Cons.Cons.
tillagetillage
Breaking this line while meeting environmental Breaking this line while meeting environmental expectations will be a huge challengeexpectations will be a huge challenge
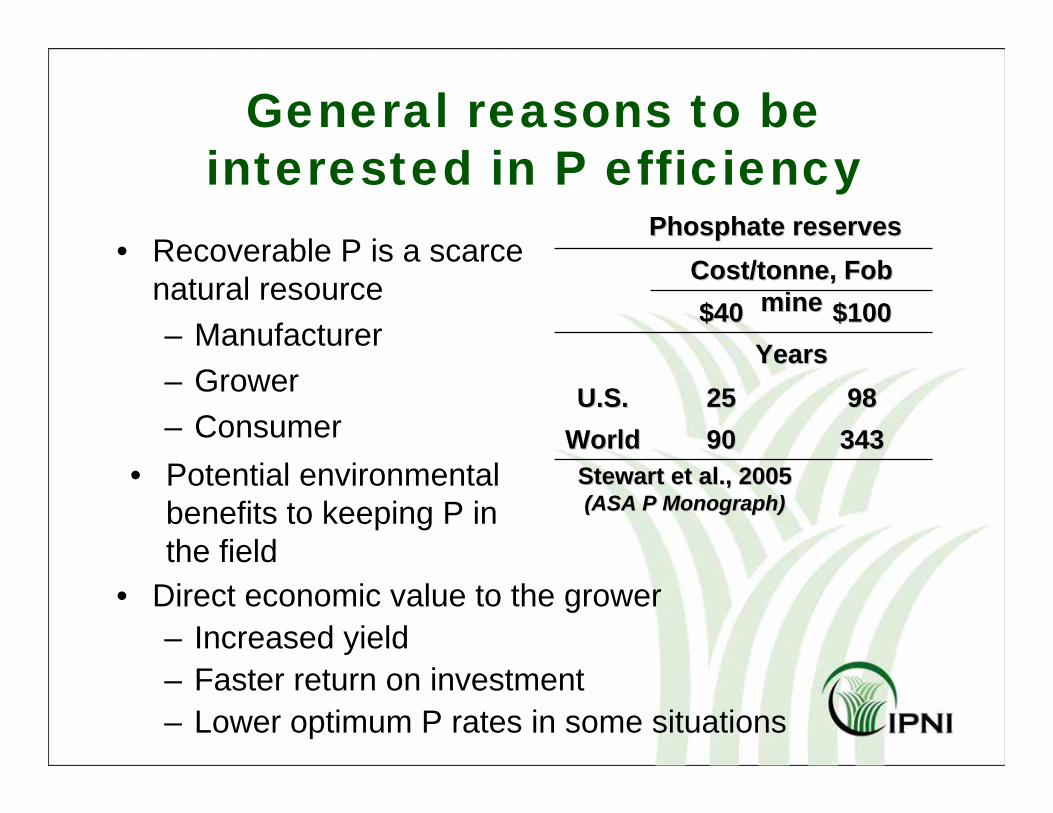
General reasons to be interested in P efficiency
• Recoverable P is a scarce natural resource– Manufacturer– Grower– Consumer
• Potential environmental benefits to keeping P in the field
3433439090WorldWorld98982525U.S.U.S.
YearsYears$100$100$40$40
Cost/Cost/tonnetonne, Fob , Fob minemine
Stewart et al., 2005Stewart et al., 2005(ASA P Monograph)(ASA P Monograph)
• Direct economic value to the grower– Increased yield– Faster return on investment– Lower optimum P rates in some situations
Phosphate reservesPhosphate reserves
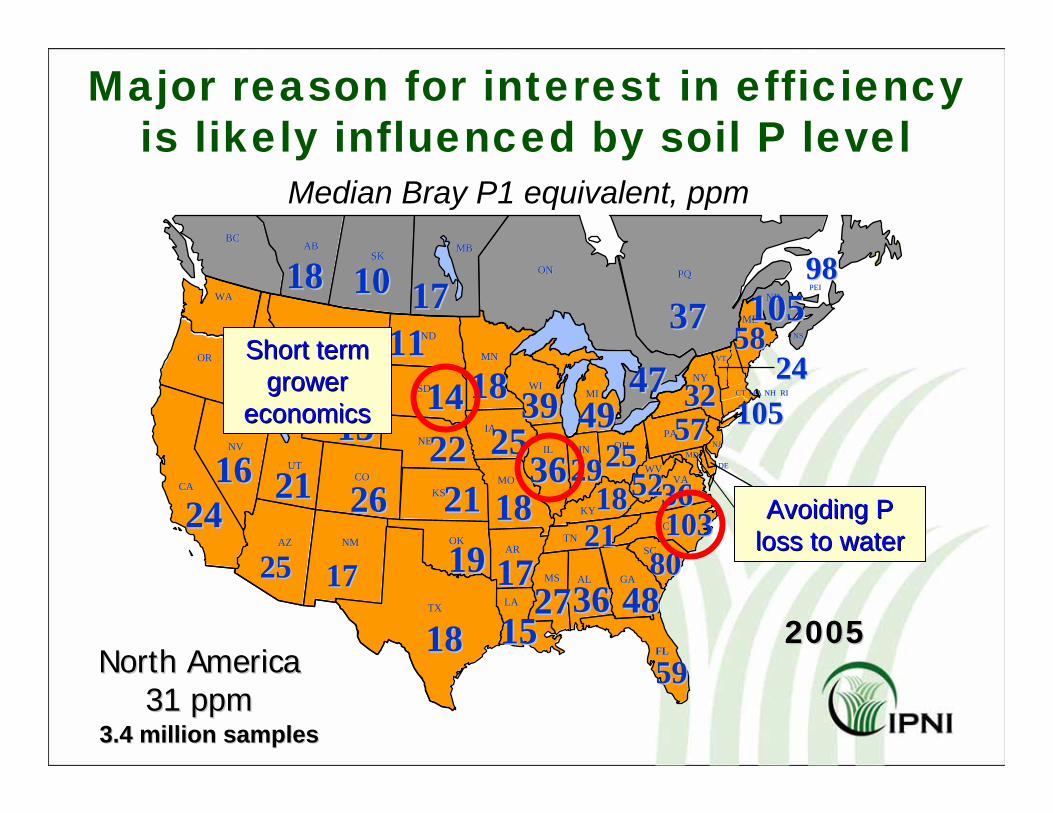
Major reason for interest in efficiency is likely influenced by soil P level
20052005
NDND
SKSKMBMB
ONON
BCBCABAB
WAWA
OROR
MTMT
IDIDSDSD
MNMN
PQPQ
NYNY
PAPAOHOHININILIL
IAIA
WIWIMIMI
WYWY
UTUT
NVNV
CACA
AZAZ NMNM
NBNB
NSNS
PEIPEI
MEME
VTVT
MAMA NHNHCTCT RIRI
NENE
KSKSMOMO
KYKY
WVWVVAVA
MDMDDEDE
NJNJ
NCNCTNTN
ARAROKOK
TXTX LALA
MSMS ALAL GAGA
SCSC
FLFL
COCO
North AmericaNorth America31 31 ppmppm
9898
24245858
1717
3232494939395757
1101105858
36362525
103103
292936361818
80804848
5959
3636272715151717
1818
19192121
2222 2525
181824241616 2121
25251414 1111
1414
1818 1010
1818
2525
1515
2626
3737 105105
1717
4747
5252
105105
2121
3.4 million samples3.4 million samples
Median Bray P1 equivalent, ppm
Short termShort termgrower grower
economicseconomics
Avoiding P Avoiding P loss to waterloss to water

The appropriate definition of P efficiency depends on the intended use of the result
Yield increaseYield increaseP appliedP applied
Fertilized uptake Fertilized uptake –– check uptakecheck uptakeP appliedP applied
Removed by cropRemoved by cropP appliedP applied Removal efficiencyRemoval efficiency
Recovery efficiencyRecovery efficiency(Single yr or long(Single yr or long--term)term)
Agronomic efficiencyAgronomic efficiency
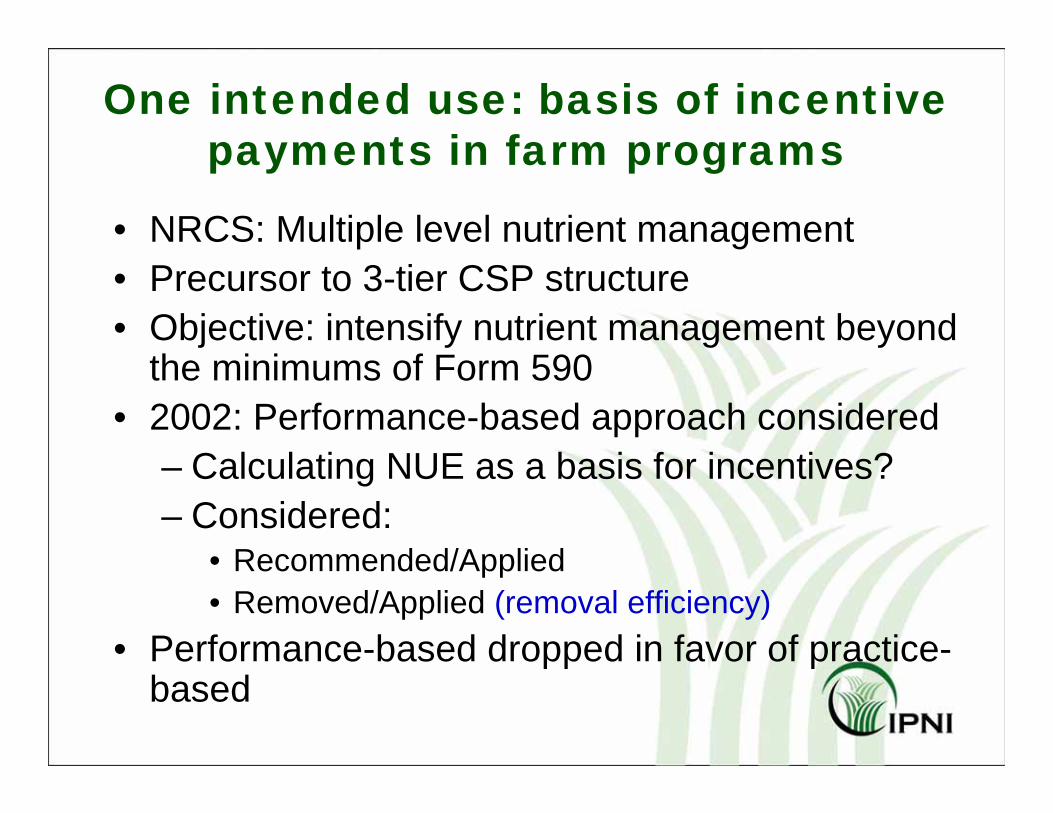
One intended use: basis of incentive payments in farm programs
• NRCS: Multiple level nutrient management• Precursor to 3-tier CSP structure• Objective: intensify nutrient management beyond
the minimums of Form 590• 2002: Performance-based approach considered
– Calculating NUE as a basis for incentives?– Considered:
• Recommended/Applied• Removed/Applied (removal efficiency)
• Performance-based dropped in favor of practice-based

Efficiency vs. effectiveness:a single-season crop response example
Yie
ld re
spon
se
Applied P
Lowest effectivenessGreatest efficiencyLowest effectivenessGreatest efficiency
Greatest effectivenessLowest efficiencyGreatest effectivenessLowest efficiency
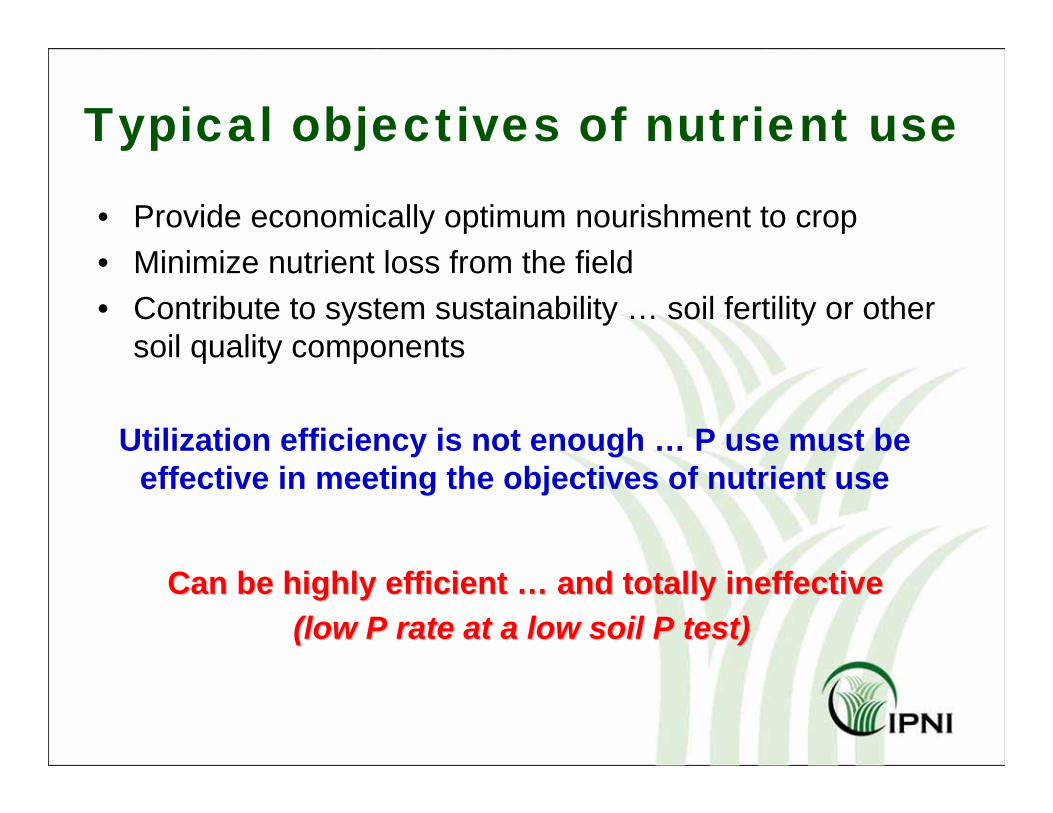
Typical objectives of nutrient use
• Provide economically optimum nourishment to crop• Minimize nutrient loss from the field• Contribute to system sustainability … soil fertility or other
soil quality components
Utilization efficiency is not enough … P use must be effective in meeting the objectives of nutrient use
Can be highly efficient Can be highly efficient …… and totally ineffectiveand totally ineffective(low P rate at a low soil P test)(low P rate at a low soil P test)
(lb w
heat
/lb a
pplie
d P)
(lb w
heat
/lb a
pplie
d P)
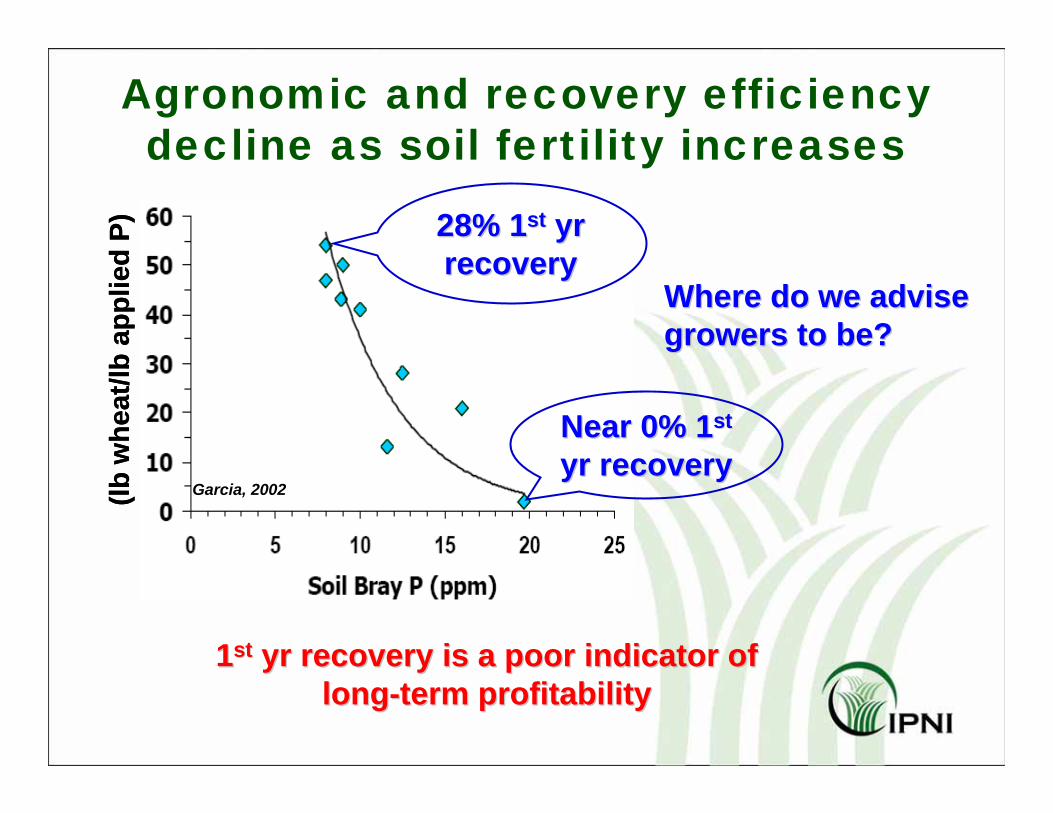
Garcia, 2002
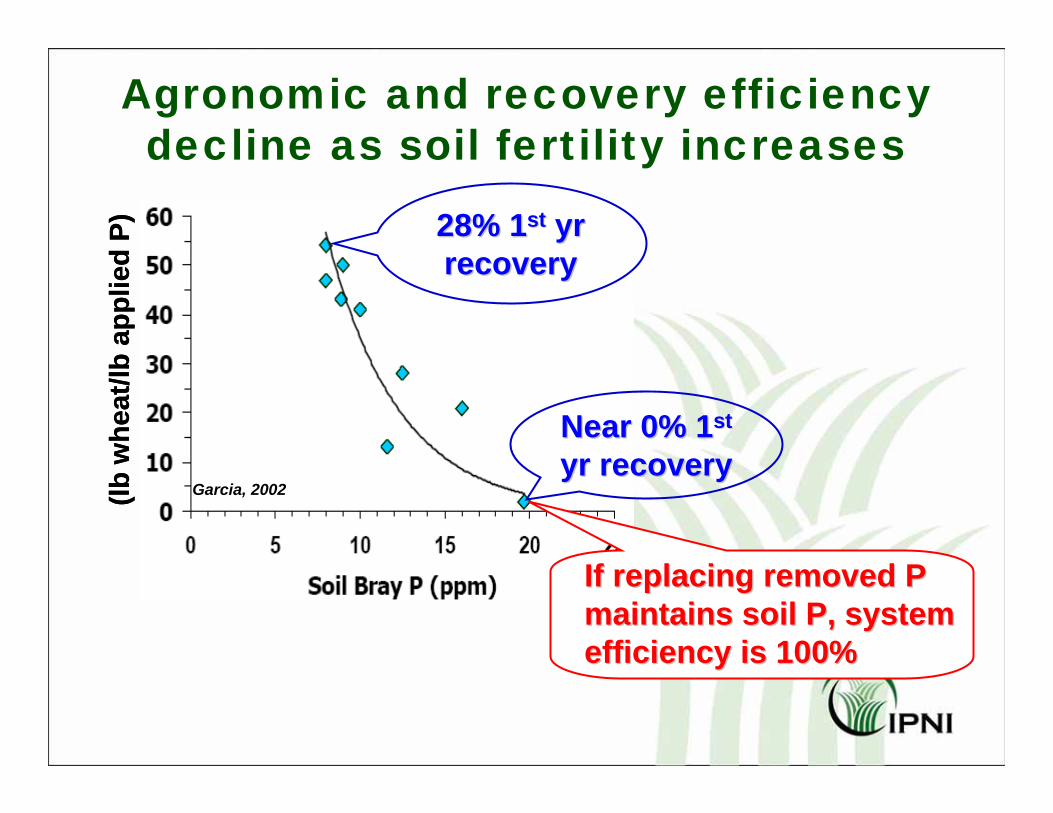
Agronomic and recovery efficiency decline as soil fertility increases
28% 128% 1stst yr yr recovery recovery
Near 0% 1Near 0% 1stst
yr recoveryyr recovery
Where do we advise Where do we advise growers to be? growers to be?
11stst yr recovery is a poor indicator of yr recovery is a poor indicator of longlong--term profitability term profitability
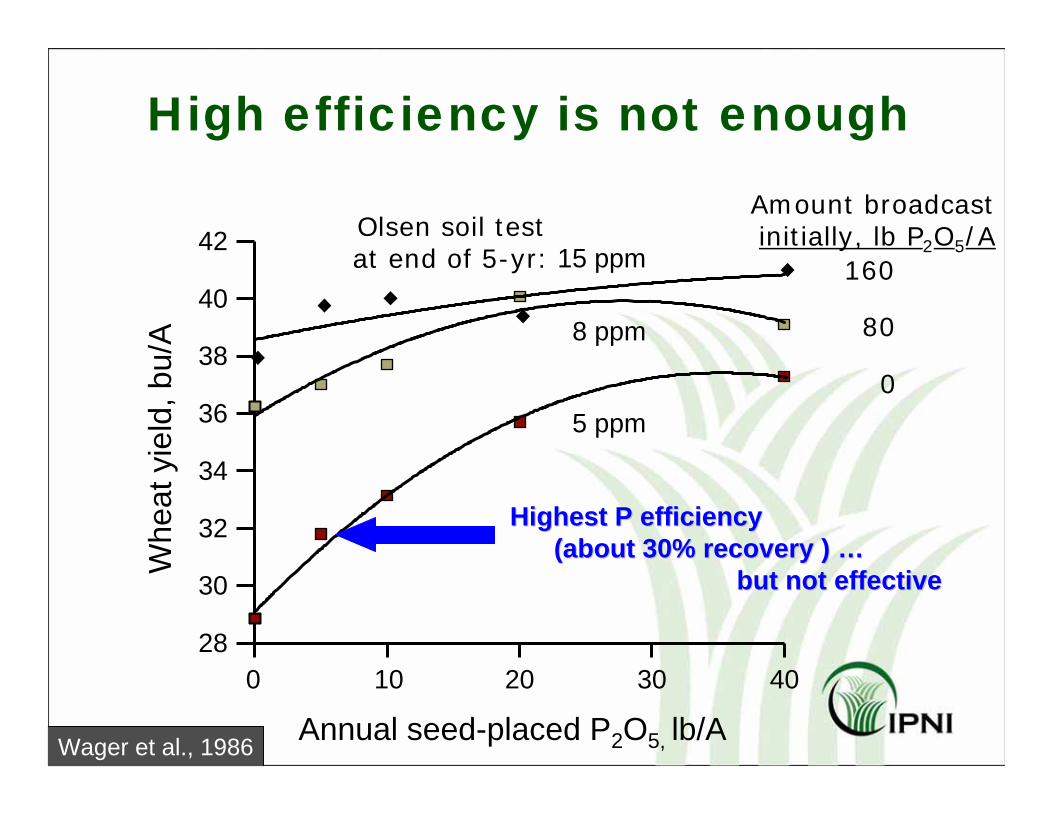
High efficiency is not enough
Annual seed-placed P2O5, lb/A0 10 20 30 40
28
30
32
34
36
38
40
42
Whe
at y
ield
, bu/
A
5 ppm
8 ppm
15 ppm
Amount broadcastinitially, lb P2O5/A
160
80
0
Olsen soil testat end of 5-yr:
Wager et al., 1986
Highest P efficiency Highest P efficiency (about 30% recovery ) (about 30% recovery ) ……
but not effectivebut not effective
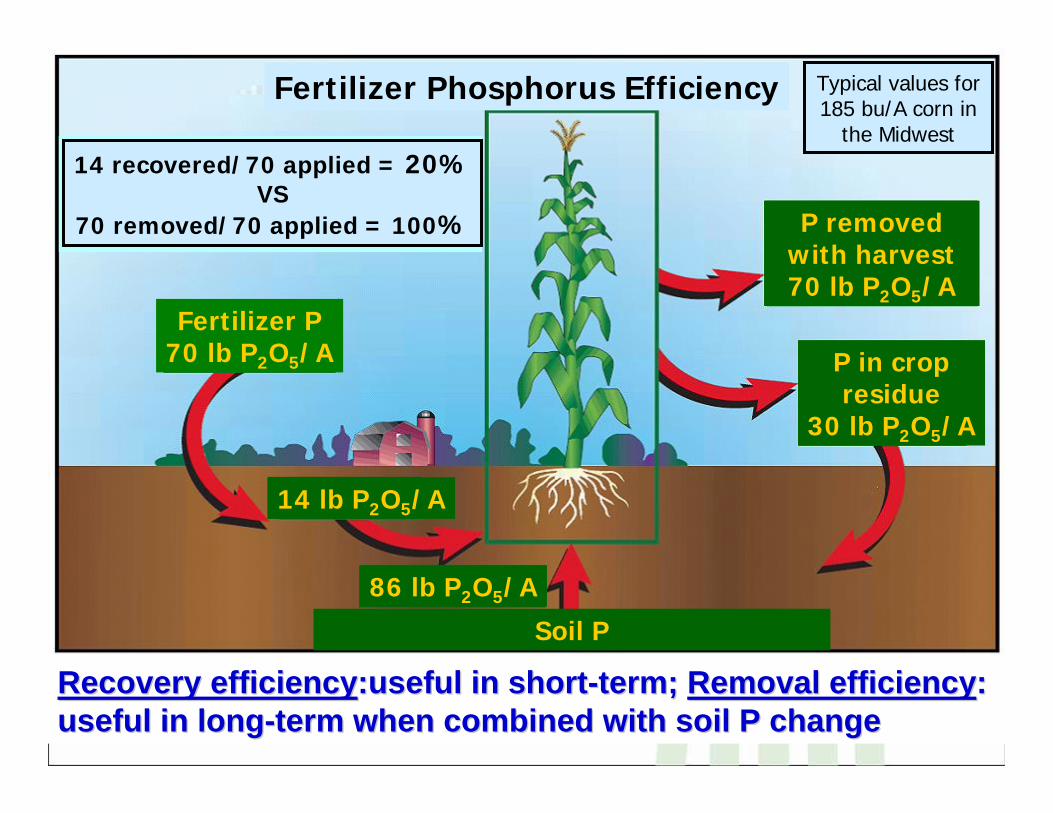
Recovery Recovery efficiencyefficiency:useful:useful in shortin short--term; term; Removal efficiencyRemoval efficiency: : useful in longuseful in long--term when combined with soil P changeterm when combined with soil P change
Fertilizer Phosphorus Efficiency
Fertilizer P70 lb P2O5/A
14 lb P2O5/A
86 lb P2O5/A
Soil P
P removedwith harvest70 lb P2O5/A
P in cropresidue
30 lb P2O5/A
Typical values for 185 bu/A corn in
the Midwest14 recovered/70 applied = 20%
VS70 removed/70 applied = 100%
System level efficiency
Nutrients recovered in the crop plus the net change in available soil nutrients
Dobermann et al, 2005
(lb w
heat
/lb a
pplie
d P)
(lb w
heat
/lb a
pplie
d P)
Garcia, 2002
28% 128% 1stst yr yr recovery recovery
Agronomic and recovery efficiency decline as soil fertility increases
Near 0% 1Near 0% 1stst
yr recoveryyr recovery
If replacing removed P If replacing removed P maintains soil P, system maintains soil P, system efficiency is 100%efficiency is 100%
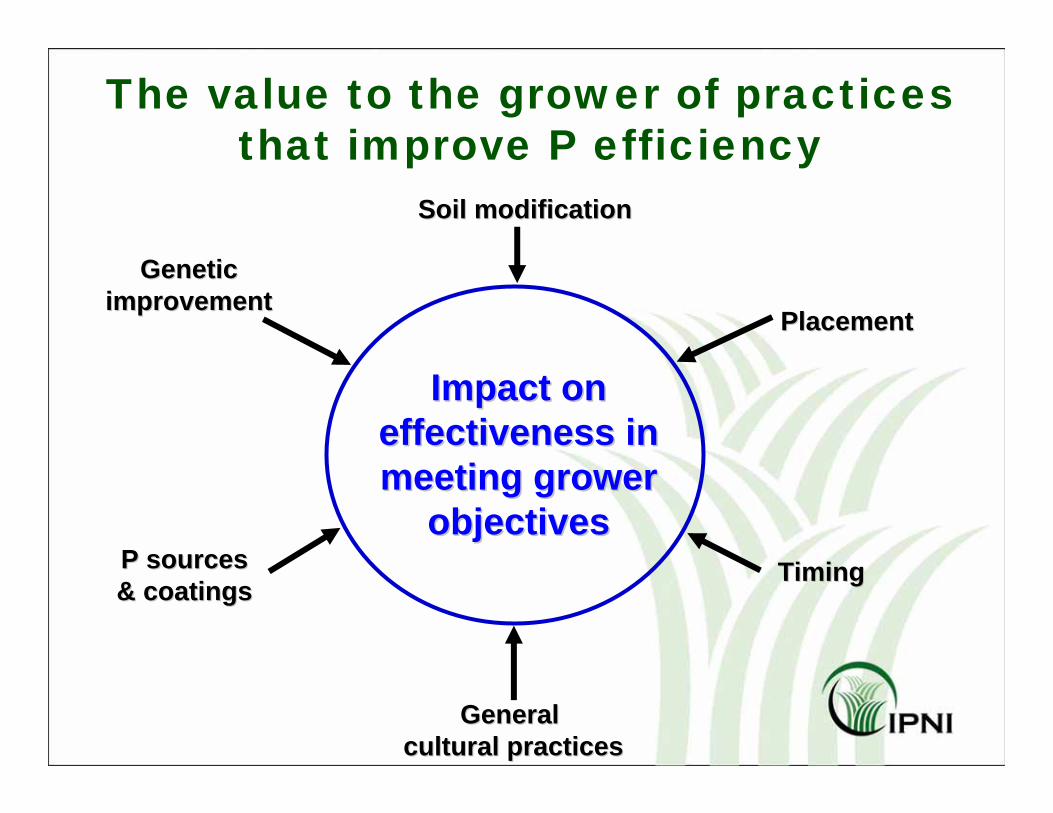
The value to the grower of practices that improve P efficiency
Impact on Impact on effectiveness in effectiveness in meeting grower meeting grower
objectivesobjectives
Soil modificationSoil modification
PlacementPlacement
TimingTiming
General General cultural practicescultural practices
P sourcesP sources& coatings& coatings
GeneticGeneticimprovementimprovement
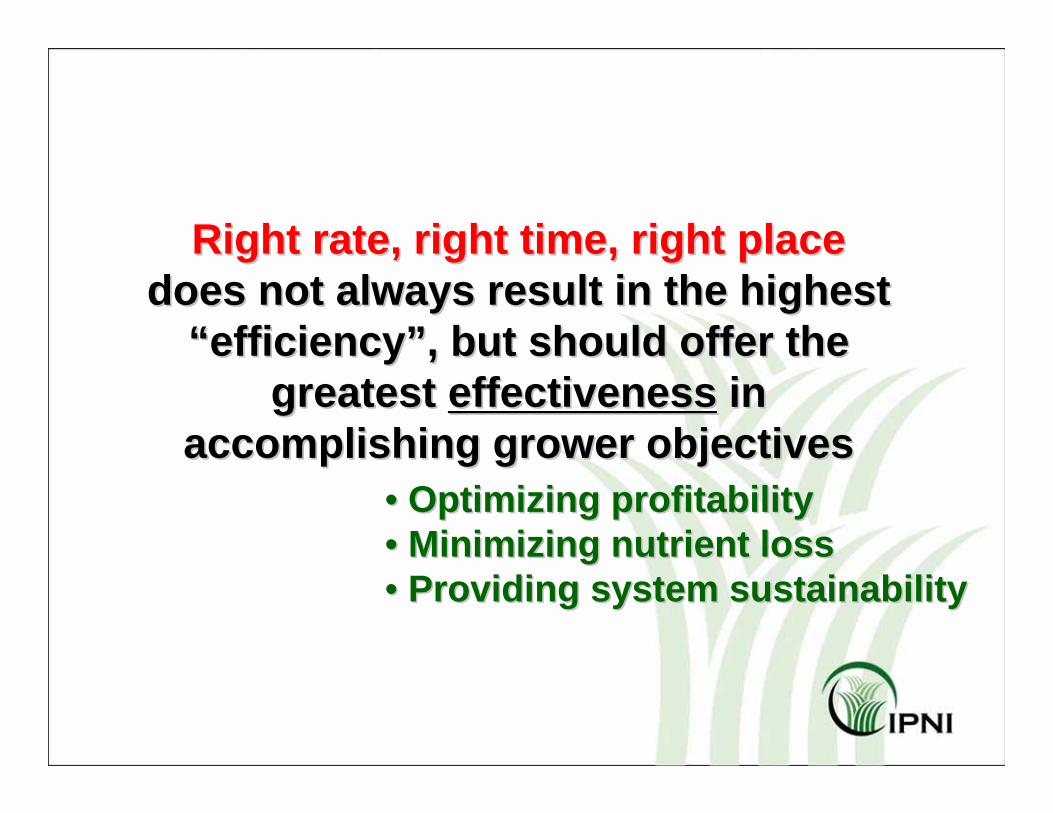
Right rate, right time, right placeRight rate, right time, right placedoes not always result in the highest does not always result in the highest
““efficiencyefficiency””, but should offer the , but should offer the greatest greatest effectivenesseffectiveness in in
accomplishing grower objectives accomplishing grower objectives •• Optimizing profitabilityOptimizing profitability•• Minimizing nutrient lossMinimizing nutrient loss•• Providing system sustainabilityProviding system sustainability

Recovery and removal efficiencies for P
PPI, 2002**; partial budget
87(removal efficiency)
AnnualUS
Smil, 2000; survey*
50-90(recovery efficiency)
ManyWorld
Smil, 2000; survey
15-25 (recovery efficiency)
1World
Source & method
P NUE (%)Term (years)
Area
* A global literature review is underway by Syers, Johnston and Curtin; funded byFAO, IFA, IMPHOS, PPI/PPIC, and TFI that will offer more detailed information.** 0.35 lb P2O5/bu used for removal by corn.

R Crop removal for 2004 and 2005 corn and soybean yields.
Phosphorus use compared to crop removal for a corn-soybean rotation (2 yrs)
(avg of 2004 & 2005)
0
20
40
60
80
100
120
lb P
2O5/A
F R
IowaIowa
MM
M Annual recoverable manure P for 1997 x 2 (NRCS, 2000).F Fertilizer P consumption/A planted to principle crops in 200F Fertilizer P consumption/A planted to principle crops in 2004 + 2005.4 + 2005.
RemovalRemovalefficiencyefficiency 139%139% 168%168% 121%121%
0
20
40
60
80
100
120
lb P
2O5/A
F R
MM
Illinois
0
20
40
60
80
100
120
lb P
2O5/A
F R
MM
Indiana
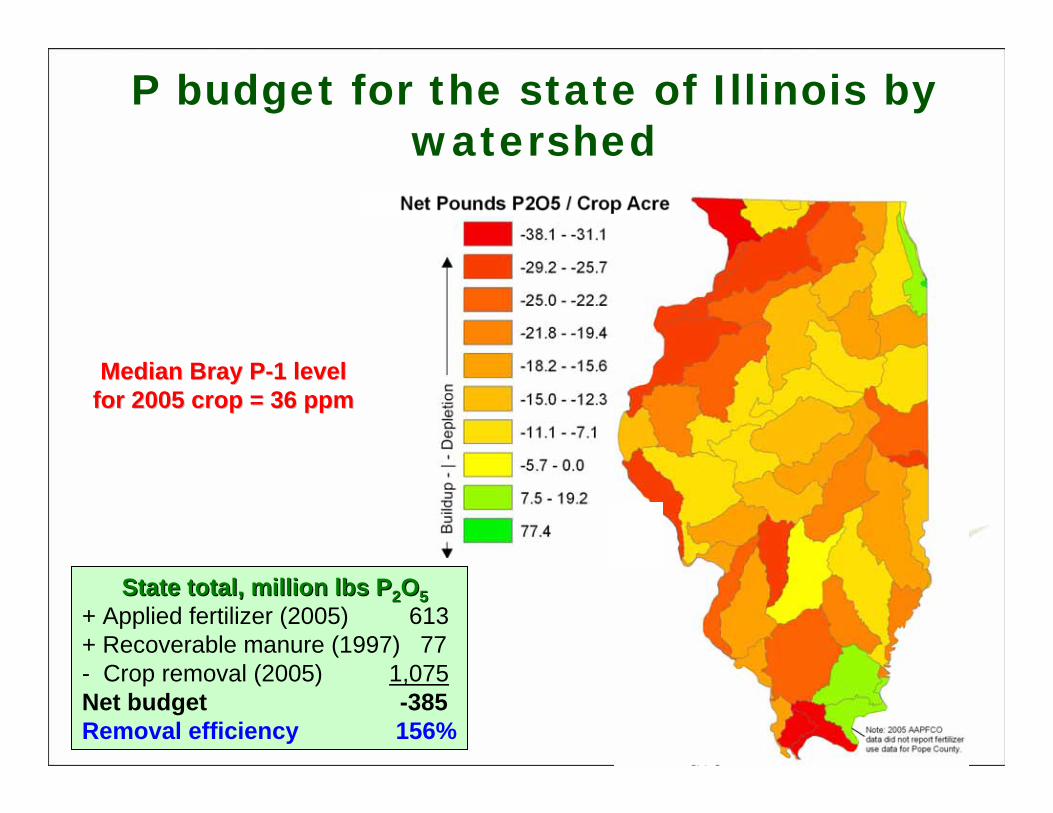
P budget for the state of Illinois by watershed
State total, million lbs PState total, million lbs P22OO55+ Applied fertilizer (2005) 613+ Recoverable manure (1997) 77- Crop removal (2005) 1,075Net budget -385Removal efficiency 156%
Median Bray PMedian Bray P--1 level 1 level for 2005 crop = 36 for 2005 crop = 36 ppmppm
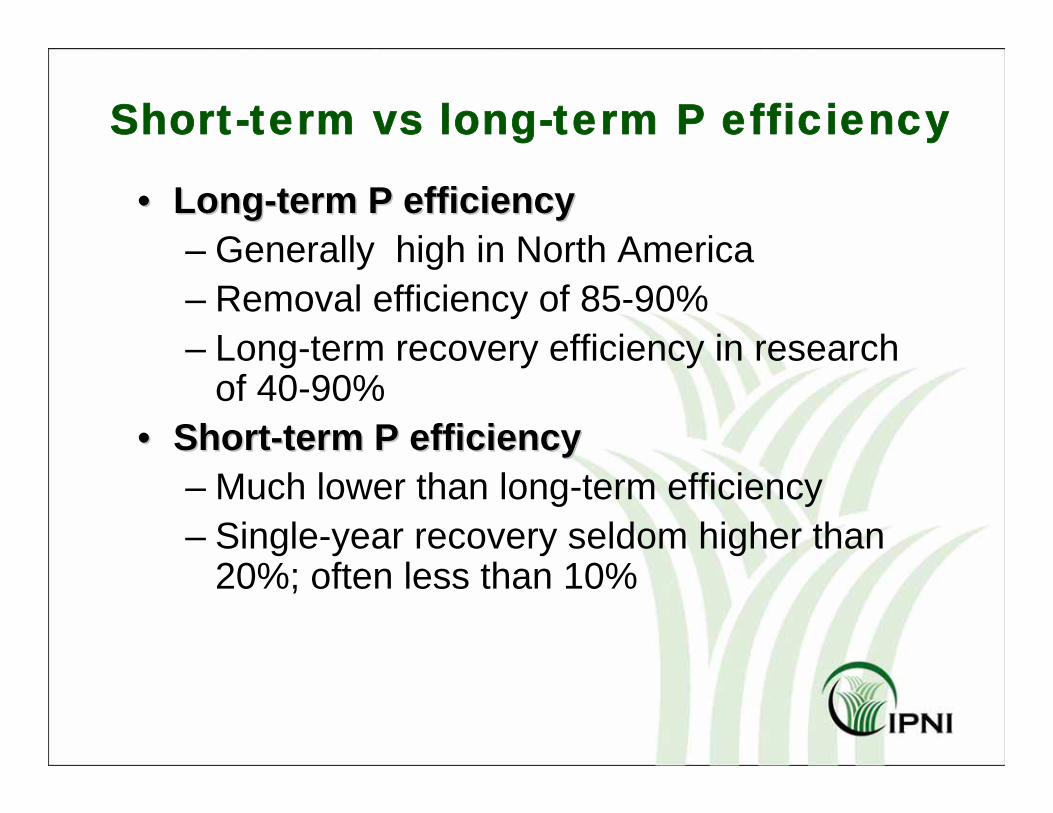
Short-term vs long-term P efficiency
•• LongLong--term P efficiencyterm P efficiency– Generally high in North America– Removal efficiency of 85-90%– Long-term recovery efficiency in research
of 40-90%•• ShortShort--term P efficiencyterm P efficiency
– Much lower than long-term efficiency– Single-year recovery seldom higher than
20%; often less than 10%
Where short term recovery is important
• Time value of money … always has some importance
• Short land tenure
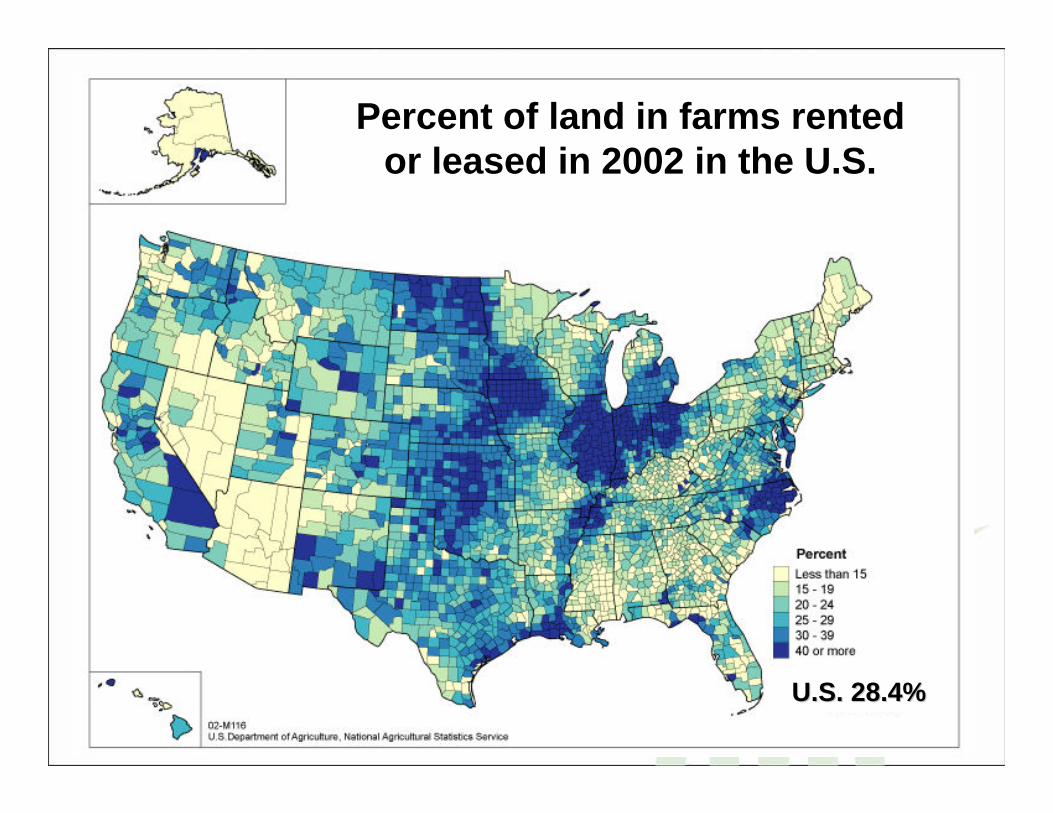
Percent of land in farms rented or leased in 2002 in the U.S.
U.S. 28.4%U.S. 28.4%
Where short term recovery is important
• Time value of money … always has some importance
• Short land tenure• Limited operating capital and sub-optimal
soil test levels
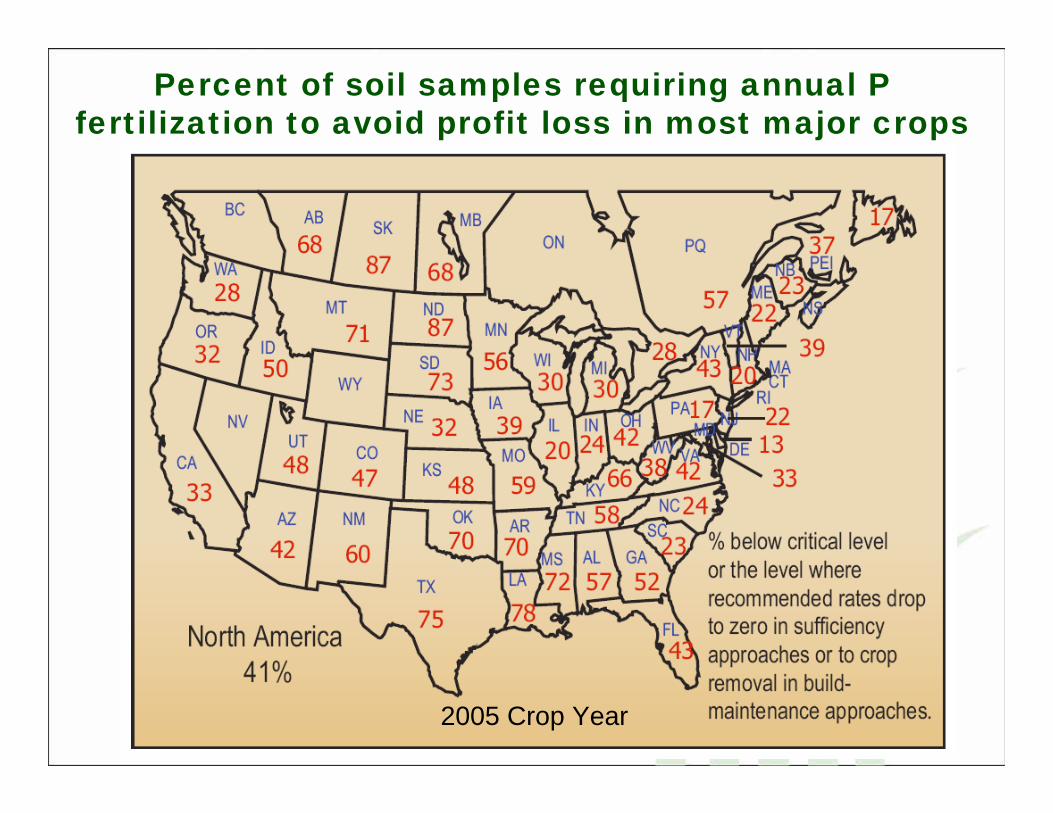
Percent of soil samples requiring annual P fertilization to avoid profit loss in most major crops
2005 Crop Year
Where short term recovery is important
• Time value of money … always has some importance
• Short land tenure• Limited operating capital and sub-optimal
soil test levels• Soils with severe P fixing potential • Threat to water quality
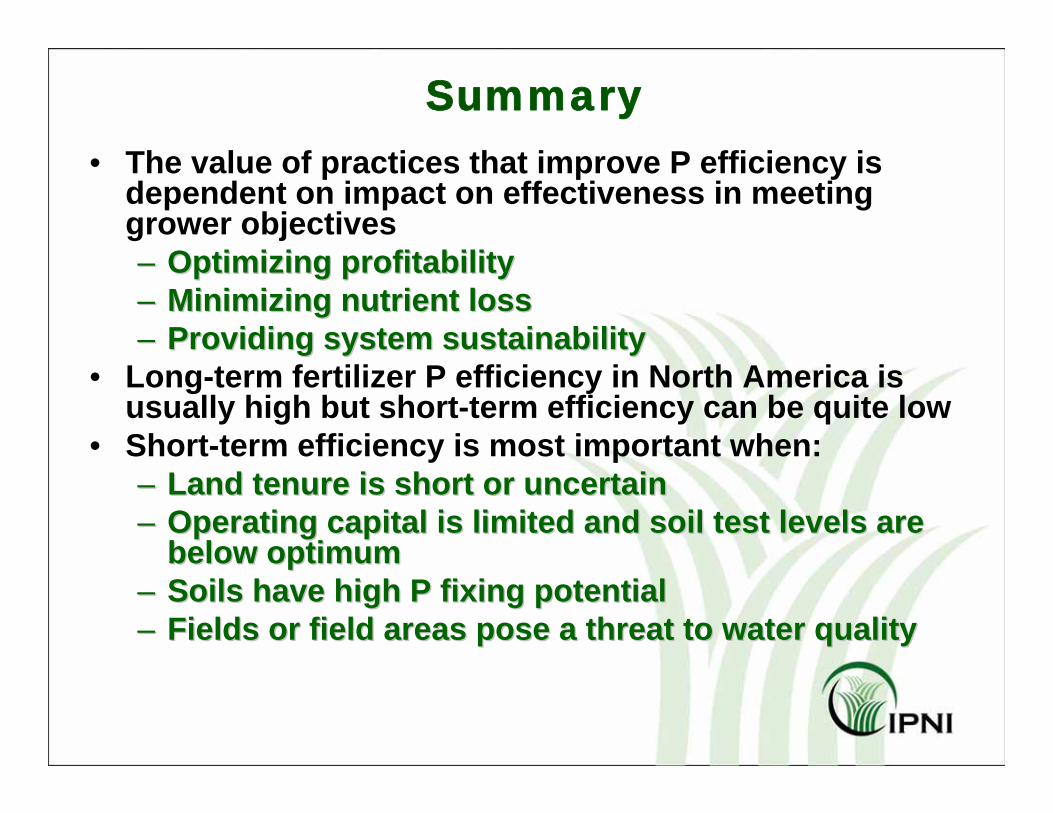
Summary• The value of practices that improve P efficiency is
dependent on impact on effectiveness in meeting grower objectives–– Optimizing profitabilityOptimizing profitability–– Minimizing nutrient lossMinimizing nutrient loss–– Providing system sustainabilityProviding system sustainability
• Long-term fertilizer P efficiency in North America is usually high but short-term efficiency can be quite low
• Short-term efficiency is most important when:–– Land tenure is short or uncertain Land tenure is short or uncertain –– Operating capital is limited and soil test levels are Operating capital is limited and soil test levels are
below optimumbelow optimum–– Soils have high P fixing potential Soils have high P fixing potential –– Fields or field areas pose a threat to water qualityFields or field areas pose a threat to water quality

Phosphorus Use Efficiency in Production Agriculture
2007 Fertilizer Outlook and Technology 2007 Fertilizer Outlook and Technology ConferenceConferenceNov. 7, 2006