phosphorus basics - soil science at uw-madisonsoils.wisc.edu/extension/materials/p_basics.pdf ·...
TRANSCRIPT

PHOSPHORUS BASICS
Larry G. Bundy
Dept. of Soil Science
University of Wisconsin

Phosphorus Terminology
• Phosphorus (P) = element name and symbol
• P2O5 = phosphate (oxide)
Amount of P in fertilizers
Rate of P to apply in recommendations
Lb P2O5/acre
• H2PO4-, HPO4
2-= ionic forms of P that plants
use

Forms & Concentrations of
Phosphorus (P) in Soils
Form Concentration (ppm)
Total 1000
Soil test P (available) 20-50
Soil solution 0.01-0.30


Adsorption and Desorption of Phosphorus
• Adsorption: removal of ionic P (H2PO4-,
HPO42-
) from solution by reaction with solid phase of soil.
• Solid phase: clays, oxides or hydroxides of Fe and Al, calcium carbonates, organic matter.
• Desorption (labile P): Portion of adsorbed P available for plant uptake, extraction, or measured by soil test.
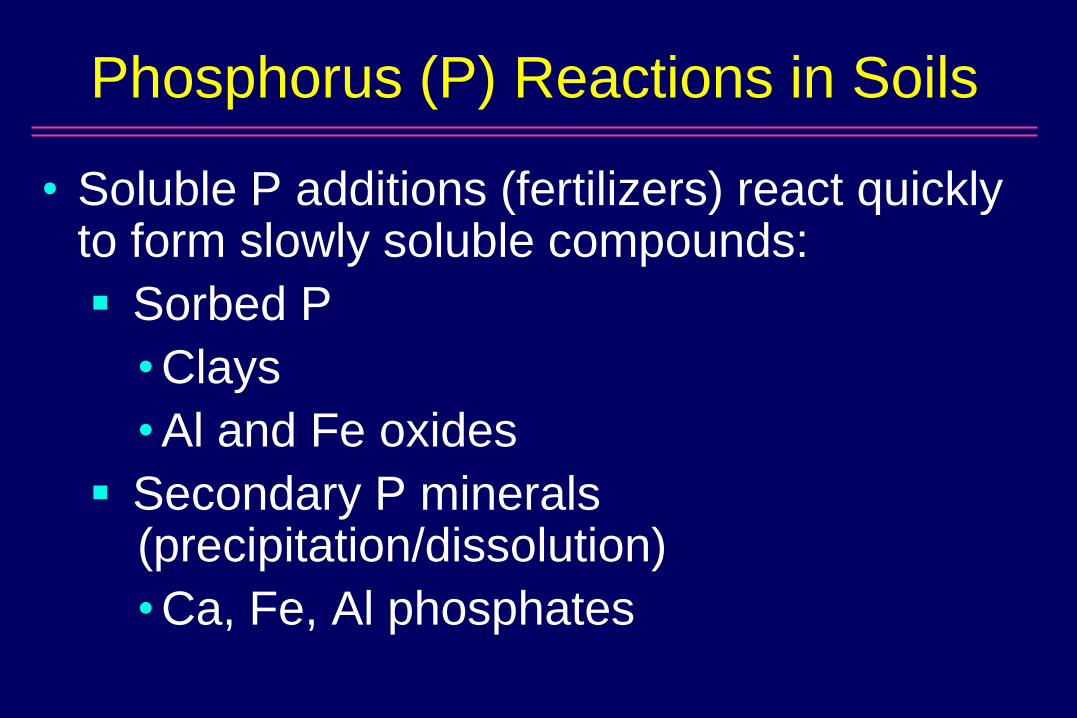
Phosphorus (P) Reactions in Soils
• Soluble P additions (fertilizers) react quickly to form slowly soluble compounds:
Sorbed P
• Clays
• Al and Fe oxides
Secondary P minerals (precipitation/dissolution)
• Ca, Fe, Al phosphates
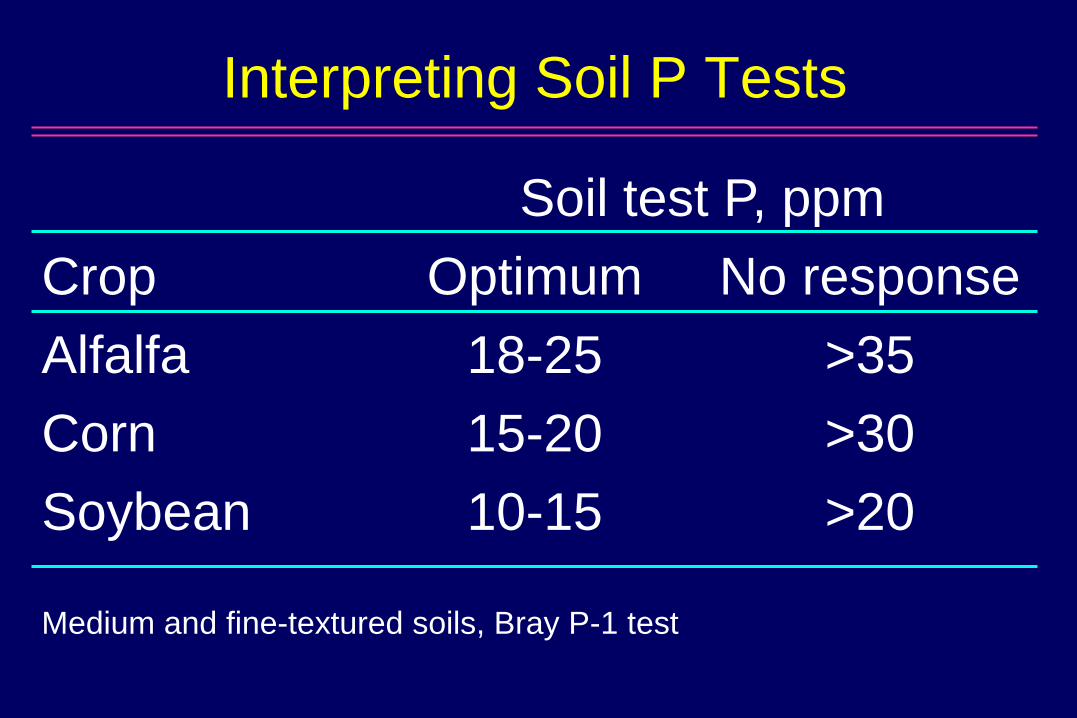
Interpreting Soil P Tests
Soil test P, ppm
Crop Optimum No response
Alfalfa 18-25 >35
Corn 15-20 >30
Soybean 10-15 >20
Medium and fine-textured soils, Bray P-1 test

Average Soil Test P in Wisconsin
3436
4044
4850 52
0
10
20
30
40
50
60
Av
era
ge
P T
es
t, p
pm
1968-73 1974-77 1978-81 1982-85 1986-90 1991-94 1995-99
Period
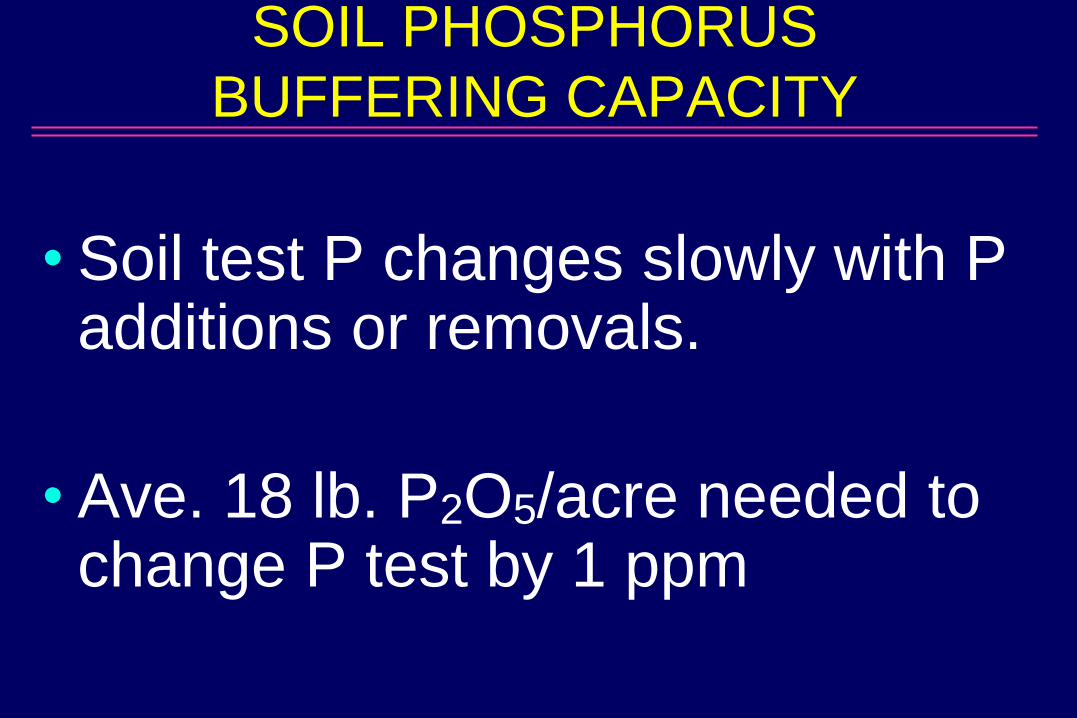
SOIL PHOSPHORUS
BUFFERING CAPACITY
• Soil test P changes slowly with P additions or removals.
• Ave. 18 lb. P2O5/acre needed to change P test by 1 ppm

Soil Test P Changes Slowly
• Example:
–Soil P test = 100 ppm = EH
–Optimum soil test = 20 ppm
–Removal needed for EH to Opt. = 18 lb P2O5/acre x 80 ppm = 1440 lb P2O5
–Corn grain removes 60 lb P2O5/acre/year
–1440/60 = 24 yrs with no added P for EH change to optimum.


Relationship between P soil test and
phosphorus fertilizer recommendation
Soil Test Recommendation
Low, very low Crop removal +
Optimum Crop removal
High ½ Crop removal
Excessively High None
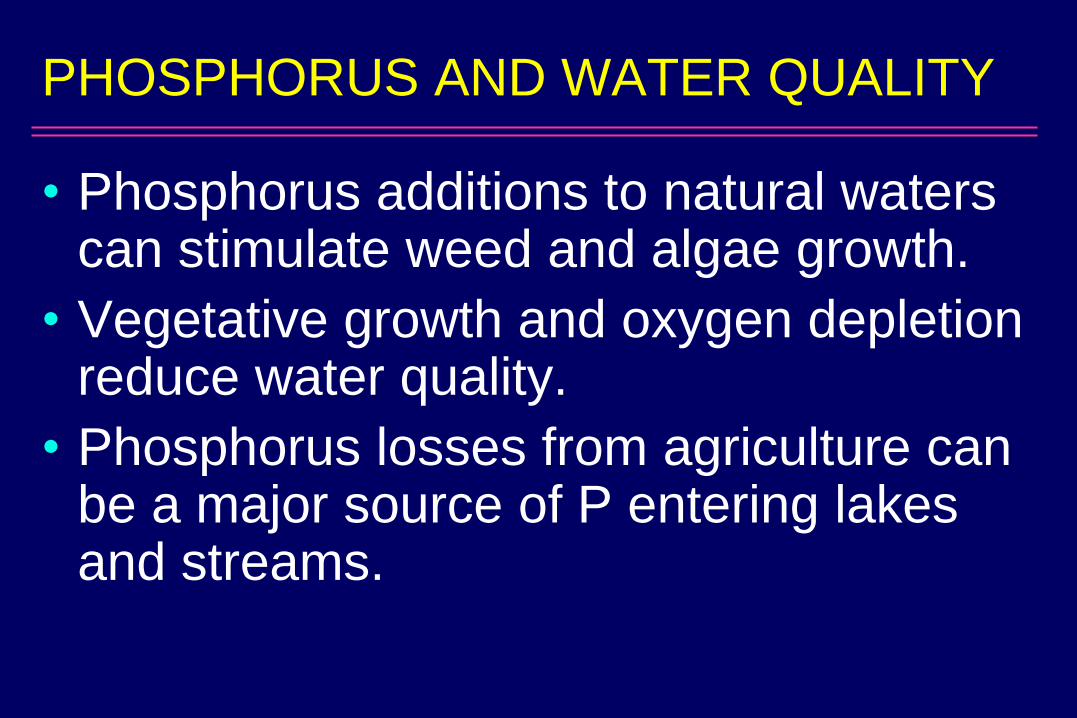
PHOSPHORUS AND WATER QUALITY
• Phosphorus additions to natural waters can stimulate weed and algae growth.
• Vegetative growth and oxygen depletion reduce water quality.
• Phosphorus losses from agriculture can be a major source of P entering lakes and streams.
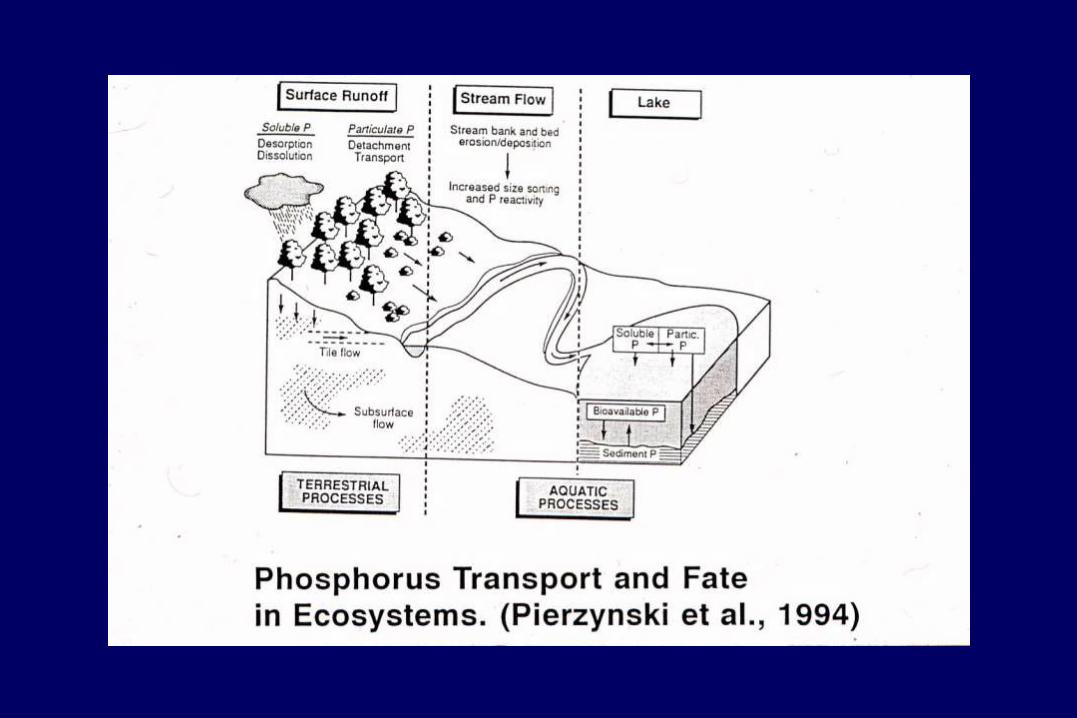

Phosphorus (P) Loss Processes
• In surface runoff:
Soluble (dissolved) P
Particulate P (soil particles)
• By leaching
Does phosphorus leach?

PHOSPHORUS (P) IN RUNOFF
• Dissolved (soluble P) (DP)
• Total P (TP)
• Particulate P (PP)
• Bioavailable P (BAP)
DP + part of PP
• Bioavailable particulate P (BPP)
BAP – DP = BPP


Critical Phosphorus Concentrations for
Surface Waters
Type of
water
Form of P P conc.
(ppm)
Lakes Soluble P 0.01
Streams Total P 0.10
Lakes Total P 0.05

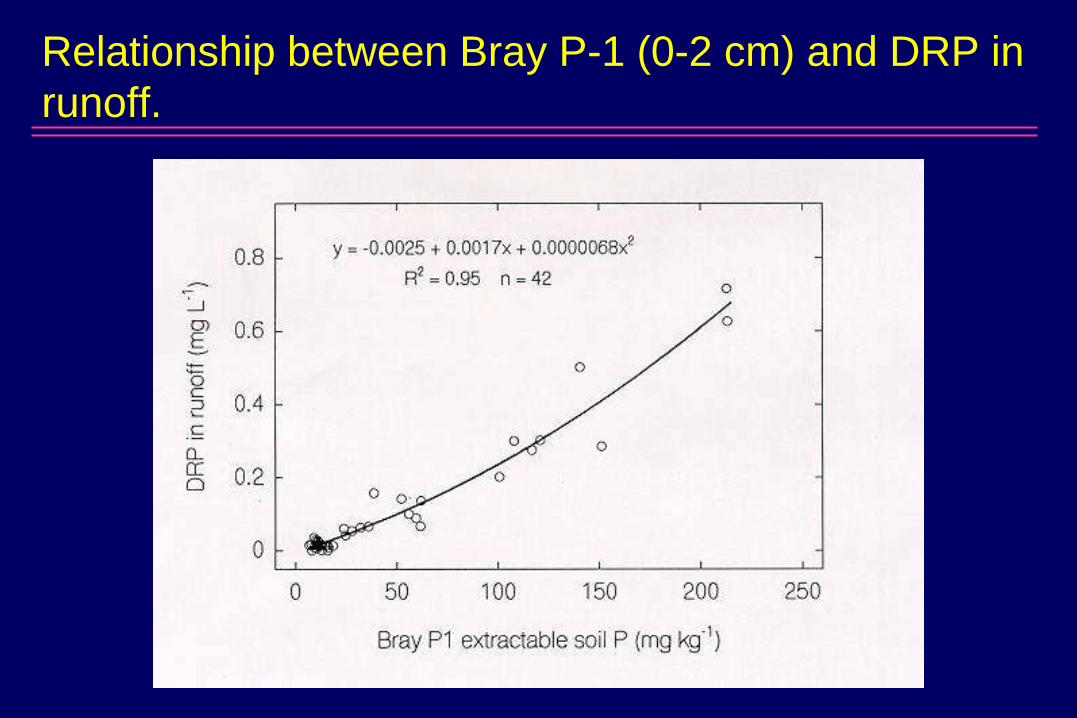
Relationship between Bray P-1 (0-2 cm) and DRP in
runoff.

Phosphorus Saturation Percentage
• Method of measuring the soil’s ability to hold P
• Indicates the % of the soil’s P holding capacity that is occupied
• Netherlands work indicates that 25% saturation is the threshold or critical value for unacceptable P loss

Relationship between Bray P-1 extractable soil P (0-
15 cm) and soil P saturation (0-2 cm).

Relationship between soil P saturation (0-2 cm) and
DRP in runoff.
Phosphorus Leaching
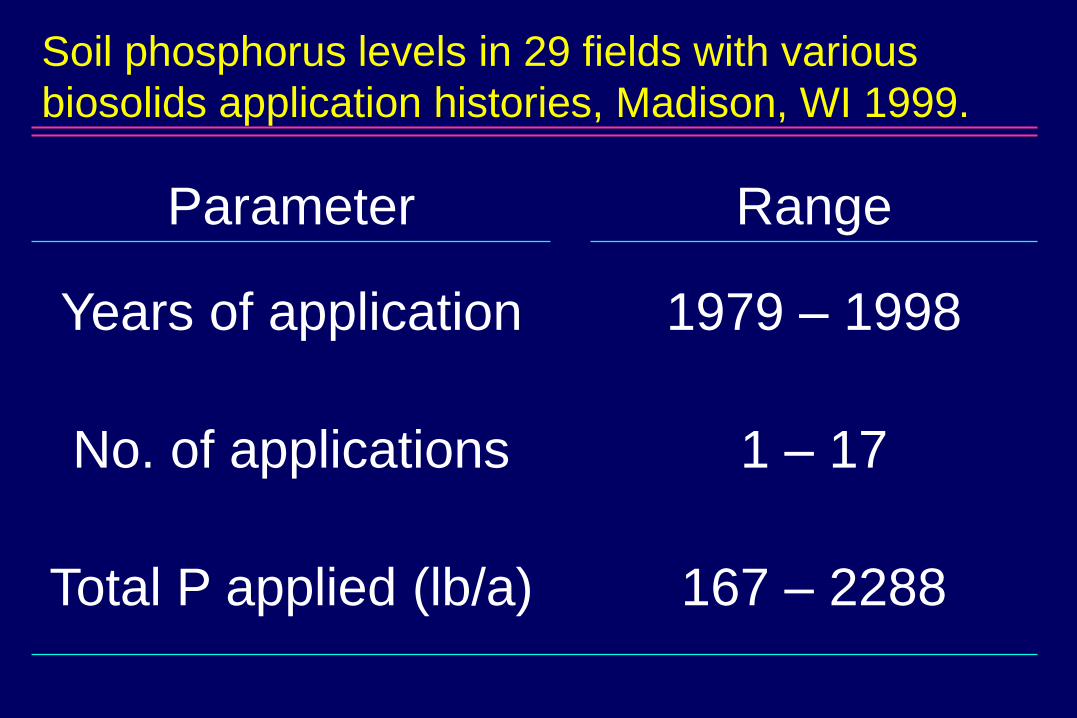
Soil phosphorus levels in 29 fields with various
biosolids application histories, Madison, WI 1999.
Parameter Range
Years of application 1979 – 1998
No. of applications 1 – 17
Total P applied (lb/a) 167 – 2288

Soil test P values at various soil depths, biosolids
survey, Madison, WI, 1999.
Soil depth Range of Bray-1 P
(inches) (ppm)
0 – 1 31 – 198
0 – 6 27 – 201
6 – 12 11 – 168
12 – 18 9 – 67
18 – 24 4 – 67
24 – 36 12 – 63

Biosolids P rate effect on soil test P (12-18 in.),
Madison, WI, 1999.

Phosphorus leaching in a prairie and in corn
production at Arlington, Wis., 1998-2000.
Soluble P in leachate
System Soil test P Concentration Load
---------------- ppm -------------- - lb/acre -
Prairie 25 0.02 0.04
No-till corn 80 0.09 0.42
Chisel
plow corn
90 0.05 0.38
Leachate collected in pan lysimeters at 5 ft depth.
Brye et al. (2001)

Critical Phosphorus Concentrations for
Surface Waters
Type of
water
Form of P P conc.
(ppm)
Lakes Soluble P 0.01
Streams Total P 0.10
Lakes Total P 0.05

60
70
80
90
100
10 20 30 40 60
BUFFER WIDTH (ft)
% S
ED
IME
NT
RE
MO
VE
D
7 % slope
12 % slope
EFFECT OF BUFFER WIDTH AND SLOPE
ON SEDIMENT DEPOSITION
Smith, 1992
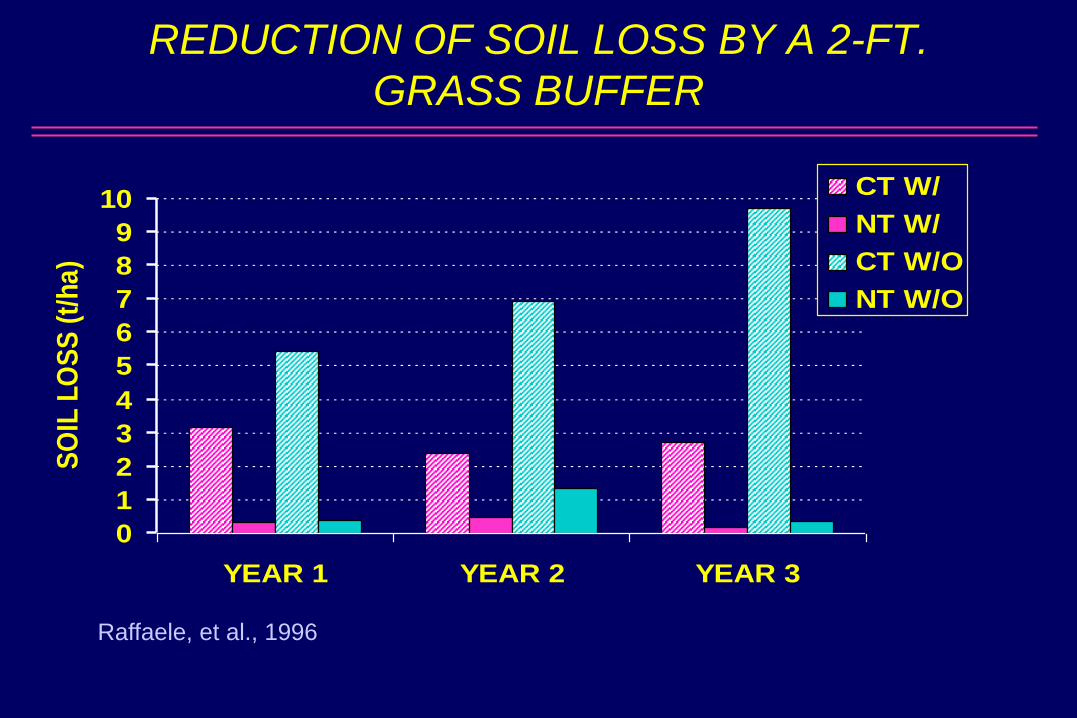
REDUCTION OF SOIL LOSS BY A 2-FT.
GRASS BUFFER
0
1
2
3
4
5
6
7
8
9
10
YEAR 1 YEAR 2 YEAR 3
SO
IL L
OS
S (
t/h
a)
CT W/
NT W/
CT W/O
NT W/O
Raffaele, et al., 1996
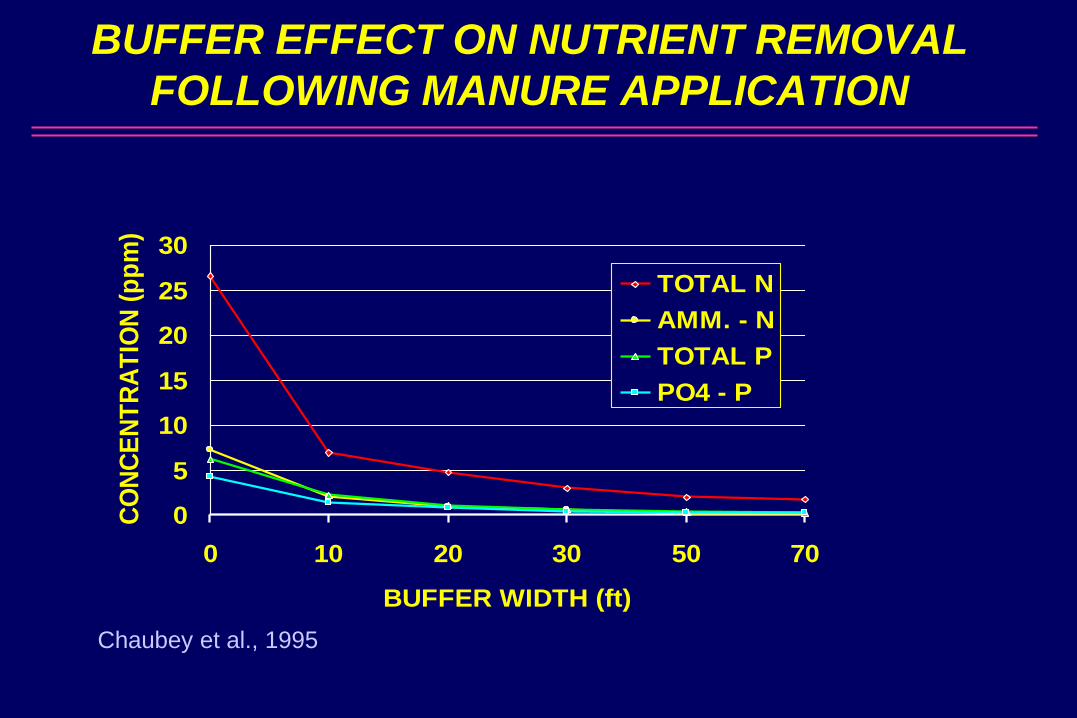
BUFFER EFFECT ON NUTRIENT REMOVAL
FOLLOWING MANURE APPLICATION
NUTRIE
NT
TOT
AL N
AM
M.-N
TOT
AL P
PO4-
P
0
5
10
15
20
25
30
0 10 20 30 50 70
BUFFER WIDTH (ft)
CO
NC
EN
TR
AT
ION
(p
pm
)
TOTAL N
AMM. - N
TOTAL P
PO4 - P
Chaubey et al., 1995

MANURE AND PHOSPHORUS
ISSUES
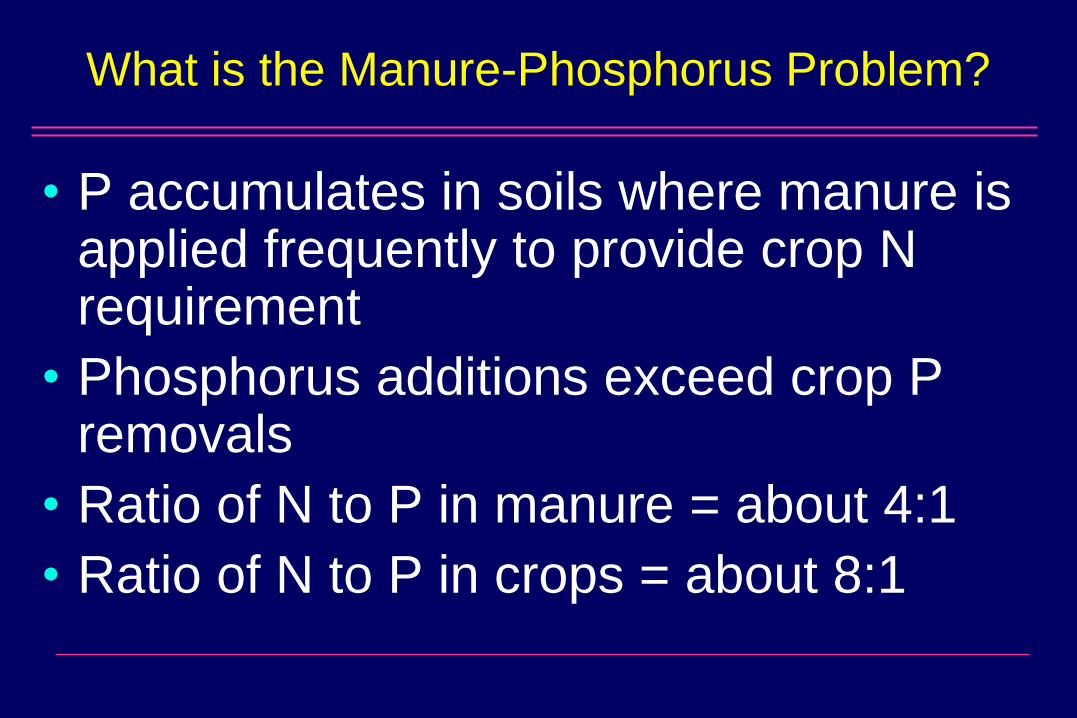
What is the Manure-Phosphorus Problem?
• P accumulates in soils where manure is applied frequently to provide crop N requirement
• Phosphorus additions exceed crop P removals
• Ratio of N to P in manure = about 4:1
• Ratio of N to P in crops = about 8:1

Relative amount of nitrogen and phosphorus in
manure and used by crops
0
1
2
3
4
5
6
7
8
Manure Crop Use
Am
ou
nt
of
N &
P
Nitrogen
Phosphorus

Ratio of First-Year Available N&P in
Manures
Manure N:P ratio
Dairy 3.1
Beef 1.8
Poultry 2.5
Swine 3.8
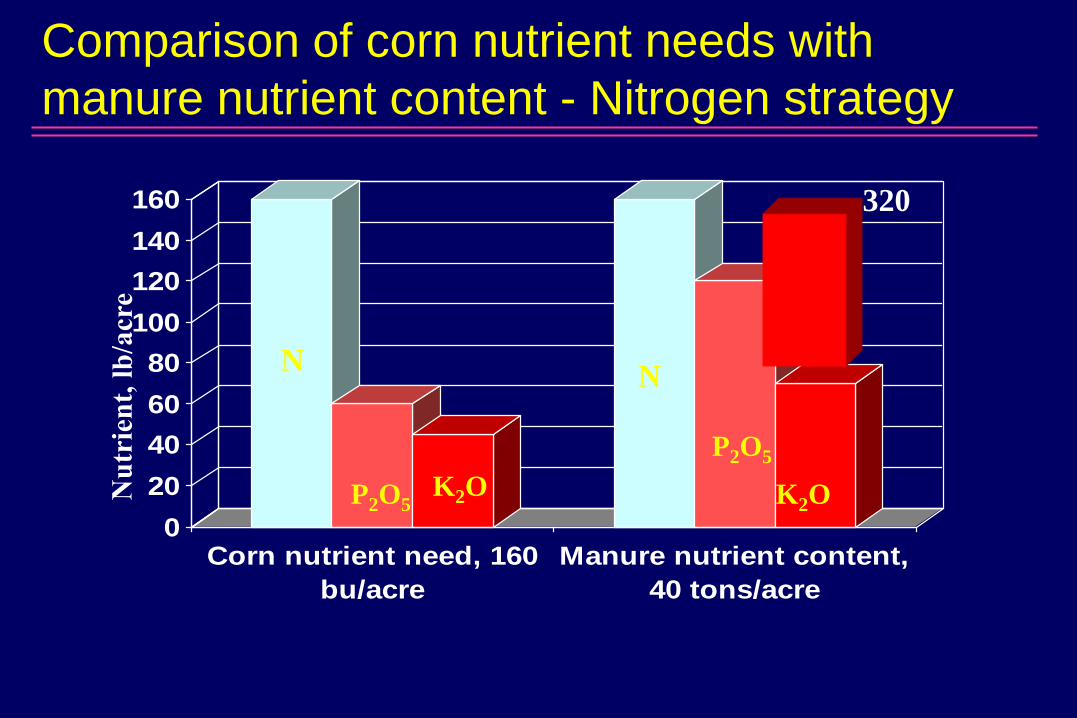
Comparison of corn nutrient needs with
manure nutrient content - Nitrogen strategy
0
20
40
60
80
100
120
140
160
Corn nutrient need, 160
bu/acre
Manure nutrient content,
40 tons/acre
N
P2O5K2O
N
P2O5
K2O
320

Phosphorus in runoff from simulated rainfall applied
to corn systems at Arlington, Wis., Sept. 1999
Location/ P in runoff
management Soil test P Soluble ,DRP Total P
-------------------- ppm -------------------
Chisel plow
corn17 0.04 4.2
No-till corn 11 0.03 3.2
Chisel plow +
manure38 0.07 3.0
No-till +
manure29 0.16 1.8

Phosphorus (P) and Environmental
Concerns
• P losses from cropland can cause surface water quality problems.
• Soil P levels have increased.
• Manure P is a major contributor to soil P buildup.
• Land application of manure is often the only practical management option.