ph.d. student attrition in the eecs department at the ...wicse/index.php/papers/lindareport2.pdf1...
TRANSCRIPT

1
Ph.D. Student Attrition in the EECS Departmentat the University of California, Berkeley
Linda Kamas* Caroline PaxsonAmy Wang Ricki Blau
ABSTRACT
We report on results of a survey conducted to study attrition of Ph.D. graduate students in the ElectricalEngineering and Computer Science (EECS) Department at the University of California at Berkeley. Wesurveyed Berkeley alumni who entered the department between 1981 and 1991 and left the EECS Ph.D.program before obtaining their degree. The respondents returned an extensive questionnaire about theirbackgrounds, motivations for choosing a Ph.D., and factors that resulted in their leaving. Many alsoresponded to an open-ended question that sought further comments and suggestions for improvement. Themost common reasons for leaving the program involved changed career goals and personal reasons. Not farbehind were departmental, advisor, and academic concerns, the length of time it takes to obtain the degreeand the number of academic as well as emotional “hoops” a student is expected to jump through during theprocess of earning a Ph.D. More ambiguous concerns were expressed such as not feeling integrated in thedepartment academically. This issue involves problems ranging from finding an advisor or research groupto feeling isolated amongst colleagues and in research interests. Even when research compatibility wasachieved, lack of guidance from advisors contributed to a number of students’ decision to leave. When weseparated respondents by gender, we found little overall difference in response between females and males,but we discuss those areas where differences were observed. We provide recommendations for departmen-tal impr ovement. These include integrating first year students, continuing evaluation of preliminaryexams, rewarding faculty for mentoring, and supporting diversity.
1.0 Introduction
Of students who entered the Electrical Engineering and Computer Science (EECS) doctoral program at Berkeley in
1981-1986, 43% of the women and 61% of the men obtained a Ph.D.**1 What drives talented students from a doctoralprogram despite their desire to achieve a Ph.D.? It would be easy to attribute attrition to the failure to meet academicrequirements, but we found that the reasons are usually much more complex. In 1993, the graduate student group
Women in Computer Science and Engineering (WICSE*** ) at the University of California at Berkeley sought to iden-tify reasons for Ph.D. attrition rates among graduate students in the EECS department at Berkeley. The goals of thestudy were to:
• draw attention to the problem of graduate EECS attrition,• identify the reasons for attrition,• give feedback to the department encouraging continuation of positive influences and suggesting
changes to improve the department,• determine if women and men leave for different reasons.
Our approach was to survey former Berkeley students who entered the graduate program intending to obtain a Ph.D.
* Linda Kamas will receive her Ph.D. from Berkeley in EE in 1996, Caroline Paxson received her M.S.from Berkeley in CS in 1993, Amy Wang is a Ph.D. candidate in EE at Berkeley, and Ricki Blau receivedher Ph.D. from Berkeley in CS in 1992. Please address correspondence to [email protected].
** For those entering in 1981-83, these rates are 50% from women and 64% from men, and are close to thecampus average Ph.D. completion rates of 51% for women and 64% for men.
** * WICSE is a student-run group for women graduate students in electrical engineering and computer science.

2
in EECS, but who left without earning the degree. Although the study focuses on one campus, we believe this campusis an important example. In the 1994-95 academic year, Berkeley graduated 79 Ph.D.s in EECS. The program is a sig-nificant source of Ph.D.s for both academia and industry. We propose that our results may also apply to other graduateprograms, making this work important in ensuring that, nationwide, industry and academia are not denied the talentsof potential contributors.
Several factors distinguish our attrition study from previous research. We address student attrition at the Ph.D. level,
which receives little attention in the science education literature. Barber et al.2 address the decision to pursue a Ph.D.in engineering, but they do not follow up on students who eventually leave the Ph.D. program. We consider the prob-lem for EECS Ph.D. students in particular. EECS is different from many other scientific fields, because the master’s isa viable terminal degree. Almost all of our respondents received the master’s degree, which helped them pursue chal-lenging careers in the field. Most research on student attrition from engineering or science focuses on undergraduates,
especially those in the first two years of college.3,4,5,6,7 These reports study students who remain in school but leavethe sciences for other fields. In contrast, most of our respondents left school but remained in the fields of electricalengineering or computer science. Although some respondents did switch fields, about three-quarters are working inrelated careers.
In the past, most educators attributed attrition from scientific majors to the difficulty of the subject matter. Theyassumed that students who left these fields lacked the ability or motivation to perform well. We discovered that ourrespondents did not leave school primarily because of problems with academic performance. These findings are con-sistent with the results of undergraduate attrition studies. In the last decade, researchers including Tobias, Seymourand Hewitt, and Strenta et al. have studied the large proportion of students who transfer from the sciences into other
majors during or following their lower-division pre-requisite courses.3,4,5,6 Many students leave the sciences becauseof changes in their career plans, dissatisfaction with classes and teaching, and negative reactions to the prevalent“weeding-out” system. Similarly, our survey found that career choices, opportunities outside of academia, and dissat-isfaction with the academic environment influenced the decision to leave graduate school. Problems with academicperformance less frequently factored into the respondents’ decisions.
The number of women in science and engineering is disproportionately small and decreases in each stage of the aca-
demic pipeline.8,9 To some extent, most researchers discuss the attrition of women from the sciences as a specific
sub-problem. Seymour7,10 and Felder et al.11 address the attrition of women in more depth and discuss problemswomen face in adapting to the culture of academic science, mathematics, and engineering. Although we did not spe-cifically set out to investigate the problems women encounter in science, we have compared responses by gender. Toour surprise, we found only a few areas of significant difference.
EECS Department BackgroundThe University of California at Berkeley has a relatively large and prominent department, with about seventy-fivecombined EE and CS faculty. About 500 students are pursuing Ph.D. degrees at any given time, and about 100 new
Ph.D. students enroll each year. The Berkeley campus is a Research University I,12 highly ranked and with competi-tive admissions standards. The graduate programs in EE and CS are highly regarded, ranking among the top four in
the National Research Council’s 1995 report on Research-Doctorate programs in the U.S.13 Less than one in fiveapplicants to the department are accepted, with the vast majority having GPA’s of 3.8 or higher, near perfect GREquantitative scores, and very good references. For Berkeley EECS graduates, the current mean time to obtain a Ph.D.is 5 and a half years, one of the shortest times to degree compared to other departments at Berkeley and comparable toother top ten universities. Mean times to degree do not appear to differ significantly between women and men.Nationwide, a Ph.D. in EE or CS has traditionally led to industrial research as well as academic positions. Because ofthe department’s reputation, graduates of Berkeley, both those receiving the Ph.D. and those deciding to leave with amaster’s degree, can be assured of rewarding positions with good salaries. (For 1994-95 graduates, median salaries in
EECS were $40,000 for a B.S. degree, $48,000 for an M.S. degree, and $66,500 for a Ph.D.14)

3
2.0 Survey Methodology
The survey was sent to former Berkeley EECS students who, according to university records, had marked an inten-tion to get a Ph.D. on their applications and left the department without obtaining one. Despite the length of the sur-vey, 97 out of 190 surveys sent were returned without prompting. This high return rate for a non-follow-up surveysuggests that former Ph.D. students had a strong desire to share their opinions of the Berkeley program.
The survey (Appendix A) comprised 141 questions divided into two main sections. The first section addressed theeducational background of the respondents and their motivation for pursuing the Ph.D. The second section listed pos-sible reasons, or “factors,” for leaving the Ph.D. program. Respondents were asked to identify each factor as a “majorfactor,” “a factor,” or “not a factor” in their decision to leave the Ph.D. program. The questions were generated frominterviews with a focus group of former Berkeley EECS graduate students who left without attaining a Ph.D., andfrom commonly-held beliefs about why graduate students leave. The list of factors was quite extensive because wefound interviewees reluctant to state a definite response unless the question specifically addressed their concerns. Forexample, people were reluctant to say they had a “bad advisor match,” but did respond to more specific descriptionssuch as “lack of guidance from advisor,” or “my advisor did not provide any specific timeline for progress.”
Question responses were analyzed individually and grouped into themes. Individual questions were analyzed in twoways. For each question, or factor, we calculated the percentage of respondents who answered either “a major factor”or “a factor,” and also the percentage of respondents who answered only “a major factor.” In order to understandmajor trends in our data, we categorized factors into ten groups by general theme; we refer to these as “aggregates.”An affirmative response to an aggregate was recorded if the respondent chose at least one factor in the aggregate as a“major factor”; thus the aggregate groupings are summaries of more strongly held perceptions. Although this methodof analysis serves to illuminate general themes, we found that at times it could also mask results within the groupings.Consequently, in our analysis, we refer to results from both the aggregates and individual questions and comments.With this technique, we hope to identify the common reasons for Ph.D. attrition, while also examining reasons thatmight not be reflected by the majority of the respondent population.
We have, in addition, analyzed responses by gender. Among the statistics we have used are thet-test for the differ-ence between the sexes in the means and the Chi-square test for the difference between the sexes in proportions. Todetermine if a statistically significant difference between female and male response existed, we calculated the signifi-cance level, referred to here as the “p-value” (probability value). A p-value represents the probability that chancevariation would have produced a difference as large or larger than the one observed in the data. In other words, a lowp-value means there is a significant difference between the data being compared. A p-value of 0.05 is always consid-ered significant and a value of 0.10 is often considered significant. All data were analyzed through a statistical analy-
sis package, SPSS.15
3.0 Survey Respondents
3.1 Respondent Demographics.Respondents entered the EECS department between 1981 and 1991 and left between 1982 and 1994, staying an aver-age of 2.2 years. The respondent breakdown (Fig. 1) introduces many of the issues to be addressed in this paper.Women were better represented in our sample than in the graduate population as a whole. (This will be discussed fur-ther in section 5.0.) A large proportion had fellowship support, but the vast majority stayed less than three years, sug-gesting that a significant amount of fellowship support fails to keep students in school. The minority population ofour respondents was relatively small, but comments indicated some disagreement as to what “under-represented”meant in this department. (This is discussed in section 4.5.) Less than a third were able to work in the area of their ini-tial strong interest. Although almost half failed prelims, we will see that fewer than this number considered this thereason they left (see section 4.2). Many of the respondents may not even have attempted prelims. Most of those wholeft are still doing technical work, some even in an academic or research environment. Six respondents went on toobtain an EECS Ph.D. elsewhere. Respondents were also asked what their current occupations are. About 75% arenow pursuing technical careers; two are now professors; nine are conducting industrial or government research, andfive others achieved degrees in other professional areas such as law and medicine.

4
Respondents were asked, regardless of what they stated on their graduate application, how sure they were that theywanted to obtain a Ph.D. in EECS. Figure 2 summarizes their responses, and shows that on a scale from 1 to 5,respondents’ certainty is weighted towards being “sure” that they wanted a Ph.D.
3.2 Motivation for choosing a Ph.D. in EECS at Berkeley.Respondents were asked to rank in order of importance a list of possible reasons to pursue a Ph.D. in EECS (Table 1).The survey listed nine possible reasons. Respondents were allowed to repeat a number if they couldn’t decide theorder of importance of two choices and they could write in one “other” reason. Respondents were also asked to indi-
0
20
40
60
80
100
Worked in �
firm areaFirm areaDirect from
undergrad�FellowshipMinorityU.S.citizenGender
0
20
40
60
80
100
Academically successful
EECS career now
EECS Phd from elsewhere
Passed all prelims�
At Berkeley 3 or less yrs
male�
yes�
no�
no
no
no
no�
no
no�
no�
no�
female�
no�
not �
stated
yes�
yes� yes�
yes�
yes�
yes�
yes�
yes�
yes�
yes�
no
not stated
not statednot stated�
not statednot stated
not stated not stated not stated
Figure 1: Statistics on respondents’ backgrounds.
21 23
29
13 10
1 2 3 4 5
Sure Not Sure
# of
Res
pond
ents
Figure 2: Survey respondents’ certainty of wanting a Ph.D.in EECS upon entrance to the Ph.D. program.

5
cate if a reason did not play any part in their decision by marking it with an “X.” These data are shown in order ofaverage ranking across the respondent population. We chose this method of representing the data because it takes intoaccount respondents’ subsidiary reasons for pursuing the Ph.D. as well as their number one reason. Items markedwith an “X” were assigned a ranking of ten. Respondents were also asked to rank a list of eleven reasons for choosingBerkeley for graduate school (Table 2). These data are also shown by average ranking.
Our findings in Table 1 agree well with a study done by Barber et al.2 in which graduate students planning on gettingthe doctorate degree were asked to rank reasons that influenced their decision to pursue the Ph.D. The most importantreason cited in Barber’s study pertained to interesting and challenging subject matter and a desire to learn more aboutthe field. Second and third reasons dealt with improving career opportunities and wanting a career in research. Eventhe fourth and fifth ranked reasons in our study, “prestige of the Ph.D.” and “enhancement of earning potential,”ranked a similar fifth and sixth in the Barber study.
Respondents were asked what their reasons were for choosing the graduate program specifically at Berkeley. Many ofthese reasons might also generalize to the choice of any EECS graduate program. Clearly Berkeley’s “great reputa-tion” attracts students (Table 2). The gap in mean rank between reputation and the next reason (“best program I wasaccepted into”) emphasizes how important Berkeley’s reputation is compared to other reasons. Ironically, it is alsoBerkeley’s reputation that allows students to leave the program without a Ph.D. and find top-notch work. It is interest-ing to note that choosing Berkeley because it was the best program which accepted them, a natural and obvious rea-son, was essentially tied in importance with Berkeley’s desirable location in the San Francisco Bay Area. The fourthmost important reason, “specific faculty,” combines two elements: those students who actually were acquainted witha member of the faculty who wanted to work with them and those who were attracted by a prominent faculty member,without knowing him or her personally. The importance of personal acquaintance or prominent faculty extends tomany EECS programs, but the attraction to particular Berkeley faculty points again to what this department specifi-cally has to offer. The early retirement of some of Berkeley’s well-known faculty does not bode well for Berkeley’scontinued ability to attract graduate students in EECS. The other reasons given for the choice of Berkeley ranked toolow to draw any specific conclusions. The relative unimportance of financial considerations probably reflects the
*. In Tables 1 and 2, mean overall rank is not exactly the weighted average of women and men because onerespondent declined to specify gender.
Table 1: Reasons for Pursuing a Ph.D.*
Overall Women Men
ReasonMean Rank
ReasonMean Rank
ReasonMean Rank
1. Fascinated by subject 3.39 1. Fascinated by subject 4.48 1. Fascinated by subject 2.92
2. Improve career opportunities 4.40 2. Prestige of the Ph.D. degree 4.76 2. Improve career opportunities 4.13
3. Preparation for research inEECS
5.00 3. Improve career opportuni-ties
4.96 3. Preparation for research inEECS
4.80
4. Prestige of the Ph.D. degree 5.74 4. Preparation for research inEECS
5.36 4. Enhance earning potential 5.55
5. Enhance earning potential 5.88 5. Default next step 5.44 5. Prestige of the Ph.D. degree 6.03
6. Default next step 6.07 6. Enhance earning potential 6.64 6. Default next step 6.24
7. Wanted to become aprofessor
6.84 7. Wanted to become aprofessor
7.08 7. Wanted to become aprofessor
6.70
8. Important to my family 7.97 8. Important to my family 7.24 8. Important to my family 8.20
9. Didn’t like work in industry 8.94 9. Didn’t like work in industry 8.68 9. Didn’t like work in industry 9.01

6
nature of EECS education: most EECS students are funded while in graduate school through fellowships or workingas a teaching or research assistant. Students can also find outside programming work and well-paid summer jobs inindustry. As can be seen in Table 2, the reasons are ranked differently for women and men. We discuss these differ-ences in the section on gender differences (section 5.0).
4.0 Reasons for Leaving the Ph.D. Program
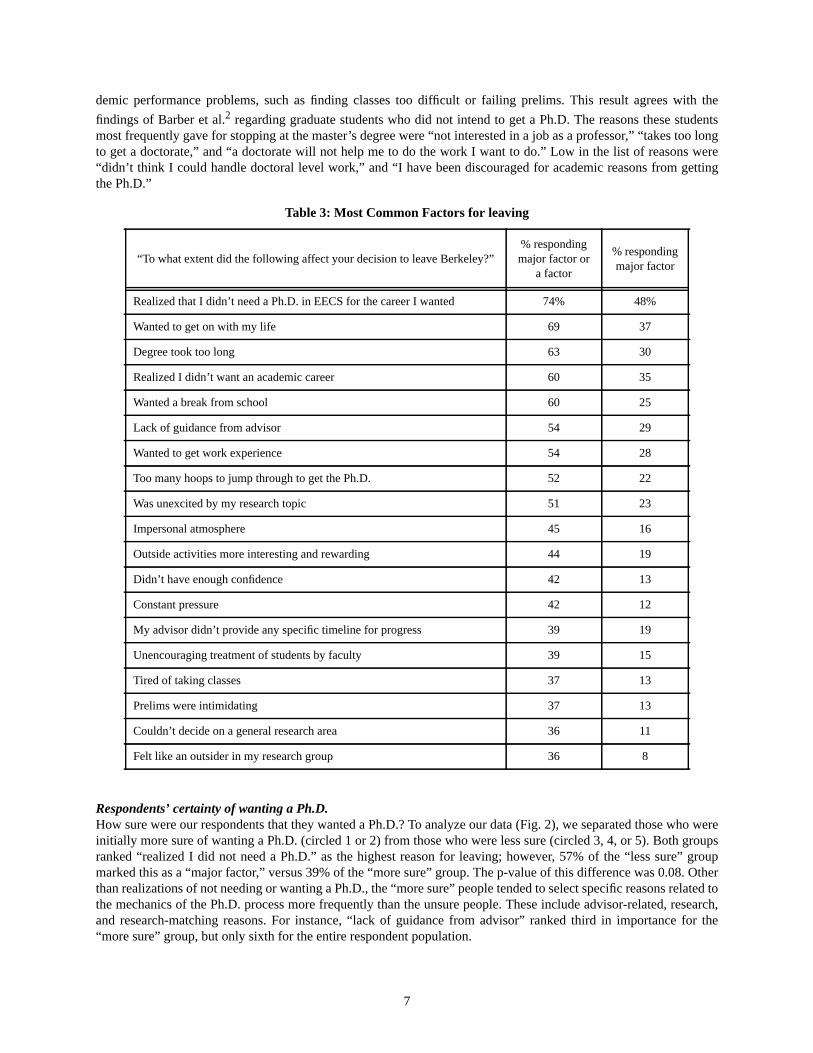
OverviewRespondents were questioned on 90 specific factors and asked, “To what extent did the following affect your decisionto leave Berkeley?” They were given three choices of response for each factor: “major factor,” “a factor,” or “not afactor.” About half the respondents chose seven or fewer of the possible factors as a “major factor.” Table 3 lists thereasons that were either a “major factor” or “a factor” for at least 35% of the respondents. We have ranked the reasonsfor leaving in two ways. The first column shows the percentage of respondents who answered “major factor” or “afactor” for the given reason. The second column shows the percentage who answered “major factor.”
A cursory glance at Table 3 shows that the most frequently stated factors for leaving the program are related to careerchoices, being tired of school, the time commitment of the degree, and problems with research advisors. This under-scores the fact that attrition is not due simply to the difficulty of the subject matter, which would be reflected by aca-
Table 2: Reasons for Choosing Berkeley
Overall Women Men
ReasonMean Rank
ReasonMean Rank
ReasonMeanRank
1. Great Reputation 3.14 1. Great reputation 2.80 1. Great reputation 3.14
2. Best program I was acceptedinto
5.04 2. Liked the atmosphere 6.44 2. Best program I wasaccepted into
4.31
3. Liked the Bay Area 5.05 3. Liked the Bay Area 6.48 3. Liked the Bay Area 4.45
4. Specific faculty 7.08 4. Best research facilities 6.64 4. Specific faculty 6.87
5. Best research facilities 7.21 5. Best program I wasaccepted into
6.84 5. Best research Facilities 7.34
6. Most affordable school/gave best financial support
7.95 6. Specific faculty 7.48 6. Most affordable school 7.85
7. Liked the atmosphere 8.00 7. Most affordable school 8.08 7. Liked the atmosphere 8.49
8. Wanted a change from myundergraduate school
8.53 8. Wanted a change from myundergraduate school
8.36 8. Wanted a change from myundergraduate school
8.54
9. Geographic area was goodfor my significant other
10.05 9. Friends recommended it tome
9.36 9. Geographic area was goodfor my significant other
9.76
10. Friends recommended it tome
10.13 10. Other 10.28 10. It was the only school Iapplied to /was accepted into
10.11
11. It was the only school Iapplied to /was accepted into
10.44 11. Geographic area wasgood for my significant other
10.80 11. Friends recommended itto me
10.38
12. Other 11.05 12. It was the only school Iapplied to /was accepted into
11.32 12. Other 11.31
7
demic performance problems, such as finding classes too difficult or failing prelims. This result agrees with the
findings of Barber et al.2 regarding graduate students who did not intend to get a Ph.D. The reasons these studentsmost frequently gave for stopping at the master’s degree were “not interested in a job as a professor,” “takes too longto get a doctorate,” and “a doctorate will not help me to do the work I want to do.” Low in the list of reasons were“didn’t think I could handle doctoral level work,” and “I have been discouraged for academic reasons from gettingthe Ph.D.”
Respondents’ certainty of wanting a Ph.D.How sure were our respondents that they wanted a Ph.D.? To analyze our data (Fig. 2), we separated those who wereinitially more sure of wanting a Ph.D. (circled 1 or 2) from those who were less sure (circled 3, 4, or 5). Both groupsranked “realized I did not need a Ph.D.” as the highest reason for leaving; however, 57% of the “less sure” groupmarked this as a “major factor,” versus 39% of the “more sure” group. The p-value of this difference was 0.08. Otherthan realizations of not needing or wanting a Ph.D., the “more sure” people tended to select specific reasons related tothe mechanics of the Ph.D. process more frequently than the unsure people. These include advisor-related, research,and research-matching reasons. For instance, “lack of guidance from advisor” ranked third in importance for the“more sure” group, but only sixth for the entire respondent population.
Table 3: Most Common Factors for leaving
“To what extent did the following affect your decision to leave Berkeley?”% respondingmajor factor or
a factor
% respondingmajor factor
Realized that I didn’t need a Ph.D. in EECS for the career I wanted 74% 48%
Wanted to get on with my life 69 37
Degree took too long 63 30
Realized I didn’t want an academic career 60 35
Wanted a break from school 60 25
Lack of guidance from advisor 54 29
Wanted to get work experience 54 28
Too many hoops to jump through to get the Ph.D. 52 22
Was unexcited by my research topic 51 23
Impersonal atmosphere 45 16
Outside activities more interesting and rewarding 44 19
Didn’t have enough confidence 42 13
Constant pressure 42 12
My advisor didn’t provide any specific timeline for progress 39 19
Unencouraging treatment of students by faculty 39 15
Tired of taking classes 37 13
Prelims were intimidating 37 13
Couldn’t decide on a general research area 36 11
Felt like an outsider in my research group 36 8

8
Aggregate resultsTable 4 shows both female and male responses to the ten aggregates that represent the main themes into whichrespondents’ reasons for leaving were grouped. This aggregating technique was used to study the relative importanceamong these ten themes. Also shown in Table 4 is the p-value that indicates if there is a statistically significant differ-ence between female and male responses. A lower p-value reflects more difference in response between genders.
We summarize some of the more notable results of the aggregate data. About 80% of both genders cited what wehave defined as “career and personal reasons” as major factors for leaving; more than 60% objected to degree require-ments; and over half could not find a clear research fit with the department. Only a few aggregates elicited discrepantresponses between males and females. Four respondents (4% of the sample) cited as a major factor in their decision toleave problems with a perceived bias against minorities in the department, some naming particular professors andadministrators. Although this is a small proportion of the total population, we believe that it is a large proportion ofthe minorities who responded. Two women (of 25 in the sample) and one man (out of 71) found problems with thestatus of women in the department to be a major factor in their leaving. Unfortunately the sample size of under-repre-sented minorities was too small to draw any statistically significant conclusions; however, the comments from minor-ity respondents clearly indicate a problem. We discuss this in section 4.5.
In the following sections, we examine the six aggregates that elicited the most response from respondents and alsoexplore the differences in response between males and females. We also look at responses to the individual questionsthat made up the aggregates. As we noted previously, respondents typically chose several “major” factors that con-tributed to their decision to leave. Thus, even when career or personal reasons were a major factor, respondents oftenhad department-specific frustrations that were major factors in their decisions to leave.
4.1 Career and Personal Reasons Most Important
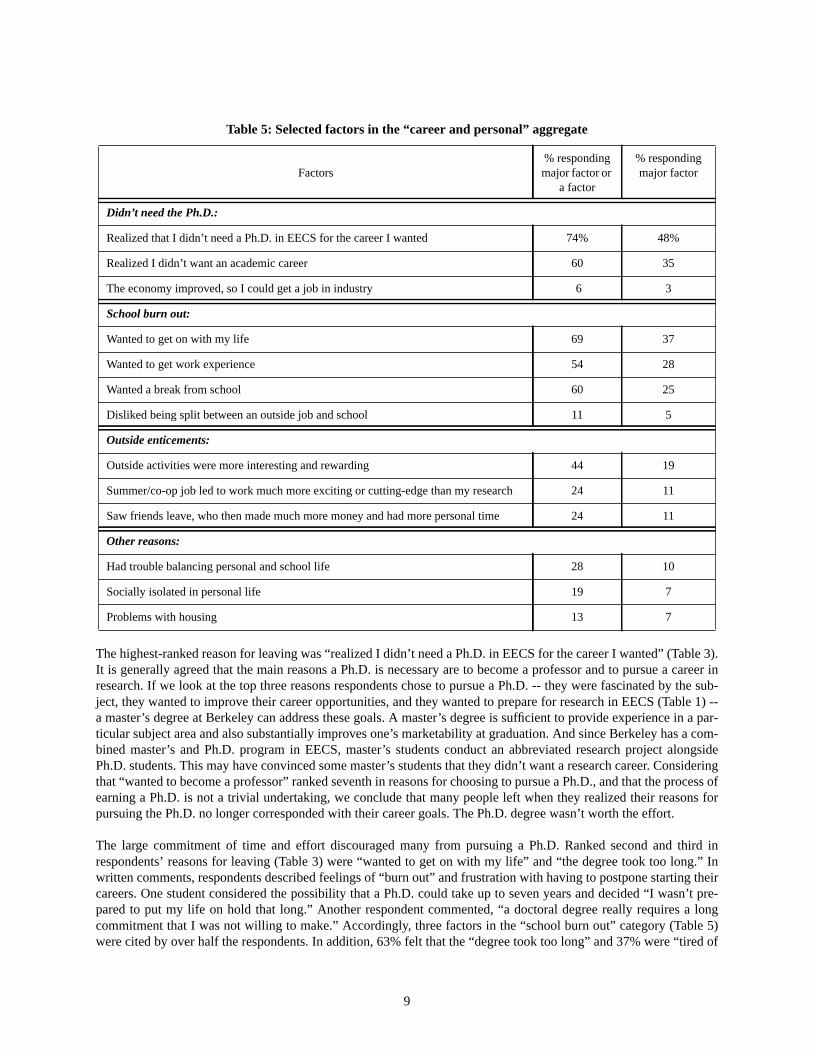
The “career and personal” aggregate received responses from about 80% of those surveyed. Factors within this aggre-gate can be grouped into four broad categories: didn’t need the Ph.D.; school burn out; outside enticements; and otherreasons. We list the reasons that garnered the most responses within the categories in Table 5 in order to illustrate therange of career and personal concerns to which people responded.
Table 4: Ranking of Response to Aggregate Themes
Aggregate Major Factors % of allrespondents
% of femalerespondents
% of malerespondents
P-value ofdifference
Career and personal reasons 79% 80% 79% 1.00
Degree requirements 64 52 68 0.25
No research match 53 68 48 0.13
Advisor-related reasons 41 44 39 0.87
Department atmosphere 39 36 39 0.95
Confidence 26 24 27 1.00
Guidance 20 16 21 0.77
Academic performance 16 20 14 0.53
Treatment of minorities 4 4 4 1.00
Treatment of women 3 8 1 0.17
9
The highest-ranked reason for leaving was “realized I didn’t need a Ph.D. in EECS for the career I wanted” (Table 3).It is generally agreed that the main reasons a Ph.D. is necessary are to become a professor and to pursue a career inresearch. If we look at the top three reasons respondents chose to pursue a Ph.D. -- they were fascinated by the sub-ject, they wanted to improve their career opportunities, and they wanted to prepare for research in EECS (Table 1) --a master’s degree at Berkeley can address these goals. A master’s degree is sufficient to provide experience in a par-ticular subject area and also substantially improves one’s marketability at graduation. And since Berkeley has a com-bined master’s and Ph.D. program in EECS, master’s students conduct an abbreviated research project alongsidePh.D. students. This may have convinced some master’s students that they didn’t want a research career. Consideringthat “wanted to become a professor” ranked seventh in reasons for choosing to pursue a Ph.D., and that the process ofearning a Ph.D. is not a trivial undertaking, we conclude that many people left when they realized their reasons forpursuing the Ph.D. no longer corresponded with their career goals. The Ph.D. degree wasn’t worth the effort.
The large commitment of time and effort discouraged many from pursuing a Ph.D. Ranked second and third inrespondents’ reasons for leaving (Table 3) were “wanted to get on with my life” and “the degree took too long.” Inwritten comments, respondents described feelings of “burn out” and frustration with having to postpone starting theircareers. One student considered the possibility that a Ph.D. could take up to seven years and decided “I wasn’t pre-pared to put my life on hold that long.” Another respondent commented, “a doctoral degree really requires a longcommitment that I was not willing to make.” Accordingly, three factors in the “school burn out” category (Table 5)were cited by over half the respondents. In addition, 63% felt that the “degree took too long” and 37% were “tired of
Table 5: Selected factors in the “career and personal” aggregate
Factors% respondingmajor factor or
a factor
% respondingmajor factor
Didn’t need the Ph.D.:
Realized that I didn’t need a Ph.D. in EECS for the career I wanted 74% 48%
Realized I didn’t want an academic career 60 35
The economy improved, so I could get a job in industry 6 3
School burn out:
Wanted to get on with my life 69 37
Wanted to get work experience 54 28
Wanted a break from school 60 25
Disliked being split between an outside job and school 11 5
Outside enticements:
Outside activities were more interesting and rewarding 44 19
Summer/co-op job led to work much more exciting or cutting-edge than my research 24 11
Saw friends leave, who then made much more money and had more personal time 24 11
Other reasons:
Had trouble balancing personal and school life 28 10
Socially isolated in personal life 19 7
Problems with housing 13 7

10
taking classes” (see section 4.2).
“Realized I didn’t want an academic career” was also ranked highly (fourth) by respondents as a reason for leaving.For some, this realization was simply a change in career choice; however, for others the decision to leave academiawas a negative reaction to experiences that turned them away from academic or research careers. One respondentremarked “I was very turned off by the competitiveness, combativeness, egotism, and self-aggrandizement I saw inacademic computer science as a whole.” The student also indicated that this negative atmosphere was experienced atconferences as well as within the department. Another respondent observed “if the idea was to select only people whothrived in an atmosphere of intellectual hostility, I figured I didn’t want to be a part of it.” This remark suggests anunsettling, inherent self-elimination process in present-day academics, and we submit that these comments reflectproblems with the structure and atmosphere of academics today.
The EECS department at Berkeley seems to be able to support most students adequately, with only 10% of respon-dents marking “not enough financial support” as a major factor and another 16% considering it a contributing factor.“Always had to TA to support myself” was a major factor for 5% and a contributing factor for another 6%. Althoughthe percentage of respondents who considered funding to be a major factor was relatively low, we acknowledge thatfor those who had funding problems, the impact on their lives was pervasive. Although the two department fundingfactors are not part of the “career and personal” aggregate, we mention them here because they pertain to financially-related career decisions.
One factor that evoked surprisingly different responses between women and men was “problems with housing.” Nota single woman cited this as a reason for leaving, while 10% of men considered it a “major factor,” and another 8%considered it a contributing factor. This suggests some bias against men in the housing market. In recent years, thedepartment has developed relationships with local landlords and posted housing opportunities to EECS graduate stu-dents by email, possibly alleviating some of these problems. Nevertheless, this issue should be looked into furtheramong recently admitted students to see if this is still a problem.
4.2 Academic Factors: Degree Requirements and Academic Performance
The aggregates listed in Table 4 include two academic categories. The “degree requirements” aggregate covers frus-trations with the objective requirements for the Ph.D. degree. In contrast, the “academic performance” aggregate con-sists of both self-perceived and objective academic problems. In this section we will describe academic requirementsand then discuss survey responses to degree requirements and academic performance. Because prelims are the big-gest initial hurdle for graduate students, we discuss them in detail.
The doctoral program in EECS has many academic requirements, including a relatively heavy courseload and prelim-inary exams (“prelims”). Students take about 8-12 graduate and upper division courses, including breadth require-ments, a major emphasis, and minors both within and outside of the College of Engineering. Prelims include an oralcomponent and are normally taken in the first and second year of graduate school. They test both general backgroundand preparation in the proposed research area. Studying for and taking prelims is time-consuming and usually stress-ful. Concurrently with taking courses and preparing for prelims, the typical doctoral student also has a substantialtime commitment to a research project or thesis for the master’s degree. The qualifying examination (“quals”) is anoral exam normally taken after the third year of graduate school. It covers a student’s dissertation research.
Factors Related to Degree RequirementsDegree requirements caused more respondents to leave than actual academic performance problems. Table 6 detailsthe factors in the requirements aggregate. Nine reasons for leaving dealt with the requirements of the Ph.D. program.This group ranked second among the ten aggregates with 64% of respondents considering requirements a major fac-tor in their decision to leave the program. These data demonstrate the students’ frustration with the length of the doc-toral program and their subjective response to its requirements. Specific, more objective complaints aboutcoursework were much less frequent. As section 4.4 will discuss, respondents commonly complained that theirresearch advisors failed to provide sufficient guidance (54%) or a specific timeline for progress (39%) (Table 3). Con-sidering this, the frustrations that so many students felt with the program’s requirements may reflect as much on their

11
desire for more guidance in progressing through the Ph.D. as on their evaluation of the specific requirements.
Men and women show some differences in their attitudes towards degree requirements. In general, men more fre-quently cited factors in the degree requirements group as major reasons for their leaving (68% of men vs. 52% ofwomen). As major factors for leaving, the “degree requirements” aggregate was second only to the “career or per-sonal” aggregate for men, but it ranked third for women (problems finding a research match ranked second). Whenwe consider problems with degree requirements as either major or contributing reasons, women tended to cite thedegree requirements factors more frequently than men. One large difference was for “prelims were intimidating,” amajor or contributing factor for 54% of the women who answered the question, but only 34% of the men (p-value of0.10). Among those who answered the question, another factor received a larger response from the men (35% of menvs. 13% of women, p-value not usable due to small sample size): “I could have the same or better research possibili-ties in industry without all the other requirements (prelims, etc.).” Why did women choose this reason so much lessfrequently than men? Their response may indicate not so much a willingness to put up with requirements as a beliefthat their research opportunities in industry will be weaker without a Ph.D.
Academic Performance and Attrition
Few respondents left the program primarily because of problems with their academic performance, but almost all
Table 6: Factors in the “degree requirements” aggregate
Factors% responding
major factor or afactor
% respondingmajor factor
Degree took too long 63% 30%
Too many hoops to jump through to get the Ph.D. 52 22
Prelims were intimidating 37 13
Tired of taking classes 37 13
Process of finding an advisor difficult 33 14
Disliked work hanging over my head 31 12
Better research possibilities in industry without all therequirements
28 12
Too many classes required 22 6
Classes too difficult/too much work 18 5
Table 7: Factors in the “academic performance” aggregate
Factors% responding major
factor or a factor% respondingmajor factor
Did not pass prelims 24% 11%
Classes were too difficult or too much work 18 5
My G.P.A. wasn’t high enough to continue for the Ph.D. 7 1
Did not pass the qualifying exam 2 1
12
who left for academic reasons had problems with prelims. Not passing prelims was a “major factor” for 12% of thosewho responded to the question and “a factor” for another 13%. Because of the wording of the questionnaire, it is notclear whether all of these individuals actually failed prelims; some may have left without attempting all of the prelimrequirement. Low grades were a major factor for only one individual (1% of those who answered the question) and acontributing factor for six others (6%). Two individuals cited not passing the qualifying exam as a factor in their leav-ing, one as a major factor and one as a factor.
PrelimsEECS graduate students commonly perceive preliminary exams as a “weeding” process or a rite of passage. Althoughthe structure and content of the exams have changed over the years, prelims have always demanded a considerabletime commitment and are generally a stressful experience. Prelims eliminate students from the program in two ways.Some students fail prelims and are not allowed to continue past the master’s degree. Other students are discouragedby prelims; they decide not to attempt the exams or do not put forth enough effort to pass all required exams.
More than one-third of the people responding to our survey passed all of their prelim requirements before leaving theprogram. In unsolicited comments, nineteen respondents (20%) told us either that they did not try to take prelims orthat they passed all that they attempted, but had not attempted all of the exams. Unfortunately, we do not know howmany of the rest attempted prelims unsuccessfully and how many did not seriously try. Relatively few people in thesample left the program largely because they did not pass prelims; only 11% of respondents gave this as a major rea-son, and an additional 12% said it was a secondary factor. Of these, we do not know how many actually attempted allthe exams and failed. Somewhat more students found prelims intimidating; 13% gave this as a major factor in theirleaving and 24% considered it a secondary factor. When respondents described prelims as intimidating, we inter-preted this to indicate frustration with the requirements of the Ph.D., rather than academic problems. One studentviewed prelims as “1 or 2 years of garbage to get out of the way,” and another was “not sufficiently motivated to passprelims.” Others described feeling stressed or demoralized.
If prelims are used to “weed” students from the Ph.D. program, who is being weeded out? Among the eleven individ-uals who left the program largely because they failed prelims, four achieved a Ph.D. at a different university (two atStanford). Ten out of the eleven are currently working in an EECS-related field, with six pursuing careers in industrialresearch or teaching. Some may consider that prelims succeed in discouraging candidates who are less qualified aca-demically, yet it is questionable whether prelims are an accurate measure of potential success. (Seymour argues thatsimilar “weeding-out” systems in undergraduate engineering, science, and mathematics rest on untested theories
about attrition and do not, in practice, eliminate the less capable students.4)
4.3 No Research Match
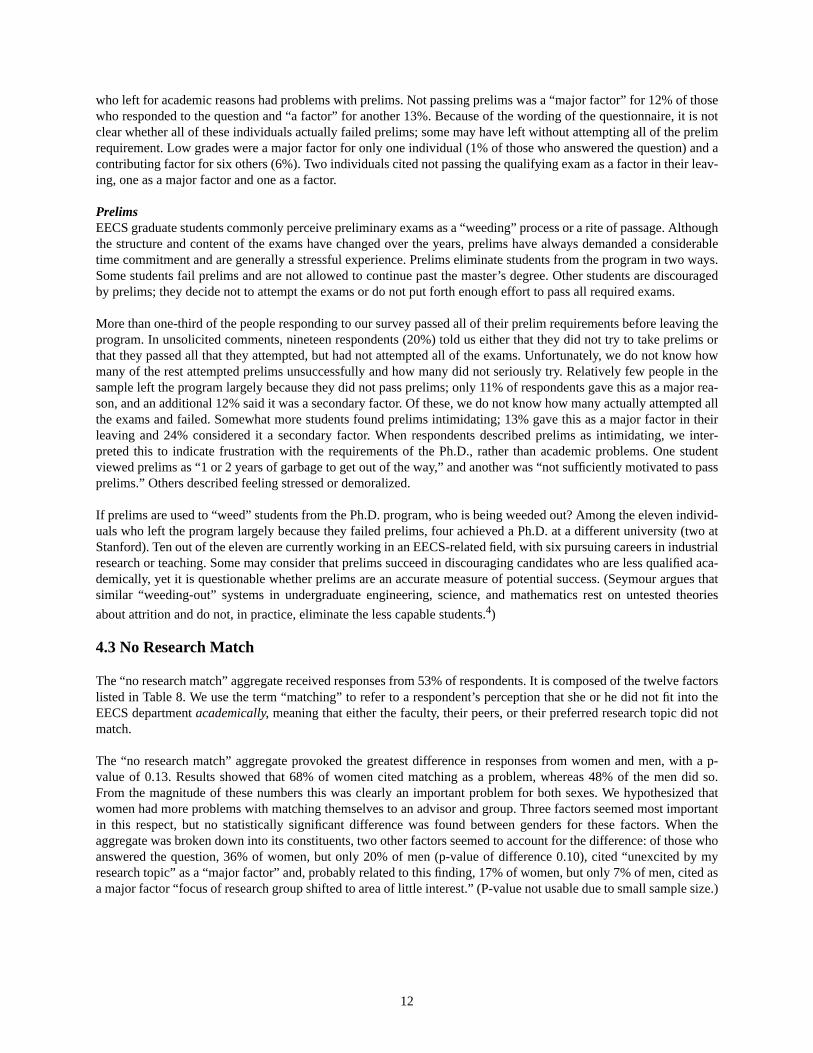
The “no research match” aggregate received responses from 53% of respondents. It is composed of the twelve factorslisted in Table 8. We use the term “matching” to refer to a respondent’s perception that she or he did not fit into theEECS departmentacademically, meaning that either the faculty, their peers, or their preferred research topic did notmatch.
The “no research match” aggregate provoked the greatest difference in responses from women and men, with a p-value of 0.13. Results showed that 68% of women cited matching as a problem, whereas 48% of the men did so.From the magnitude of these numbers this was clearly an important problem for both sexes. We hypothesized thatwomen had more problems with matching themselves to an advisor and group. Three factors seemed most importantin this respect, but no statistically significant difference was found between genders for these factors. When theaggregate was broken down into its constituents, two other factors seemed to account for the difference: of those whoanswered the question, 36% of women, but only 20% of men (p-value of difference 0.10), cited “unexcited by myresearch topic” as a “major factor” and, probably related to this finding, 17% of women, but only 7% of men, cited asa major factor “focus of research group shifted to area of little interest.” (P-value not usable due to small sample size.)
13
The dissertation is a formidable undertaking. Barber et al.2 found that the dissertation requirement discouraged manyengineering graduate students from pursuing a Ph.D. Among their respondents, about two-thirds of those who optedto leave with a master’s degree cited the dissertation as a discouraging factor. Although our survey does not askdirectly about the dissertation requirement, many of the research match factors indicate problems with beginning thethesis. Finding an enjoyable topic in an appropriate group with an advisor who will accept you into the group requiresmany steps, any of which require compromise. To alleviate these problems, we encourage the department to continueefforts in its research seminars to give new students an idea of what research is being done and by whom.
4.4 Advisor-related Factors
Advisor-related issues (Table 9) ranked prominently among the factors affecting respondents’ decisions to leave, with41% of respondents expressing a problem with advising as a major factor in leaving. This is not surprising, since theresearch advisor plays an important role in the professional development of a graduate student. “Lack of guidancefrom advisor” was a highly ranked factor affecting respondents’ decision to leave (Table 3). Before analyzing advi-sor-related factors, we briefly examine what roles an advisor plays and how these fit into the Ph.D. process.
“...the two main things that make graduate school hard are the unstructured nature of the process, and the lack of
information about what you should spend your time on.” So writes desJardins,16 a Berkeley EECS Ph.D. now con-ducting industrial research. She goes on to list the roles of an advisor, including: “guiding students’ research; gettingthem involved in the wider research community; finding financial support; and finding a position after graduation.”Since 78% of respondents came to graduate school straight from an undergraduate program, they were left withcoursework, summer jobs, and undergraduate research experiences as a basis from which to embark on a Ph.D.research project. An advisor clearly has a great impact on students’ choice of research topic and research progress,especially in the first few years of graduate school.
Considering that a primary role of the advisor is guidance, the basic expectations listed by desJardins should be metfor all students. 31% of respondents cited “my advisor was uncaring about students’ professional development” as at
Table 8: Factors in the “no research match” aggregate
Factors% responding major
factor or a factor% respondingmajor factor
Was unexcited by my research topic 51% 23%
Couldn’t decide on a general research area 36 11
I felt like an outsider in my research group 36 8
Could not find a research project 33 14
Process of finding an advisor difficult 33 14
No peers to discuss my work with 33 12
My research area was marginal to my advisor’s core interest 33 8
Could not find a match on the faculty for my research interests 30 18
Changing research group/project was too difficult 30 12
Couldn’t get into the research group doing the work I was interested in 22 10
The focus of my research group shifted to an area of little interest to me 20 9
My advisor left or didn’t get tenure 4 3

14
least “a factor” in leaving. We propose that the advisor’s concern and involvement in students’ professional develop-ment is really a minimal expectation, and as such any response should be looked upon critically. On two question-naires, however, respondents attempted to soften their responses with comments such as “uncaring is too strong--unaware would be more accurate.” We suggest the department should publicize to both students and faculty theexpected roles of an advisor. A quarter of respondents listed “my advisor never encouraged me or complimented me”as at least “a factor.” These respondents expected some form of encouragement from their advisor, and the lack of itcontributed to their decision to leave.
In looking only at “major factors,” there is a distinct gap between the first two responses “lack of guidance from advi-sor” and “my advisor didn’t provide a timeline for progress” (29% and 19%, respectively), and the rest of the advisor-related reasons (9% or less). The factors that could be viewed as specific to a particular advisor’s personality, such as“my advisor was hard to work with” were much lower in response frequency as major factors, indicating that mostmajor advisor problems were in basic bottom-line student expectations that were not being met.
Of course, the advisor-student relationship is a two-way street, with students bearing part of the responsibility for
making it work. desJardins16 provides advice to graduate students for finding the right advisor, urging students toread research summaries of a potential advisor and talk to other graduate students of the group. Other considerationsinclude average time to degree and the dropout rate for their students, and how long they have been on the faculty. AsdesJardins points out “the most important thing is to ask for (i.e. politely demand) what you need.”
Respondents’ suggestions for improving advisor effectivenessA few respondents listed very specific suggestions for improving the advisor relationship. Two relevant responses tothe survey question “Do you have suggestions for how to improve the environment for graduate students in the EECSdepartment?” are listed below.
“I think making the process of finding an advisor more structured would help. Admitting students with a bet-ter match with available research opportunities would make the process easier. The Ph.D. program is toolong already. If finding an advisor takes 1-2 years, there is no way anyone can be expected to finish in 4years, which to me seems like the right amount of time for a doctorate degree.”
“The single most important factor is for the advisors to act as managers and play a major role in movingtheir students through the program. I think there are some profs that do this well, others that do it poorly. I
Table 9: Factors in the “advisor” aggregate
Factors% a factor ormajor factor
% major factor
Lack of guidance from advisor 54% 29%
My advisor didn’t provide any specific timeline for progress 39 19
My research area was marginal to my advisor’s core interest 33 8
My advisor was uncaring about student’s professional development 31 8
My advisor never encouraged me or complimented me 25 9
My advisor was hard to work with 23 7
My advisor expected too much grunt work 18 3
My advisor and I didn’t get along 13 5
My advisor didn’t treat me with respect 8 2
My advisor left or didn’t get tenure 4 3
My advisor discouraged me from getting a Ph.D. 3 1
15
firmly believe the ‘sink or swim’ approach is counterproductive to all. The cost to UCB of accepting a prom-ising candidate and having them suffer for 3, 4, or 5 years before deciding to leave must be very high, not tomention the cost to the student. Some ideas for improvement:
1. recognition to professors who a) have a high rate of Ph.D. successes b) get students through the program in normative time or less2. compensation e.g. a bonus a) for each Ph.D. earned b) for exceptional performance in getting students through
“Getting the Ph.D. is a matter of perseverance. This requires support and encouragement through the inevita-ble difficult times. This in turn requires that advisors take a more active role in actually managing the stu-dents. The way to get professors to devote energy to this management process is to a) train them; b)recognize them; c) reward them....”
4.5 Department Atmosphere
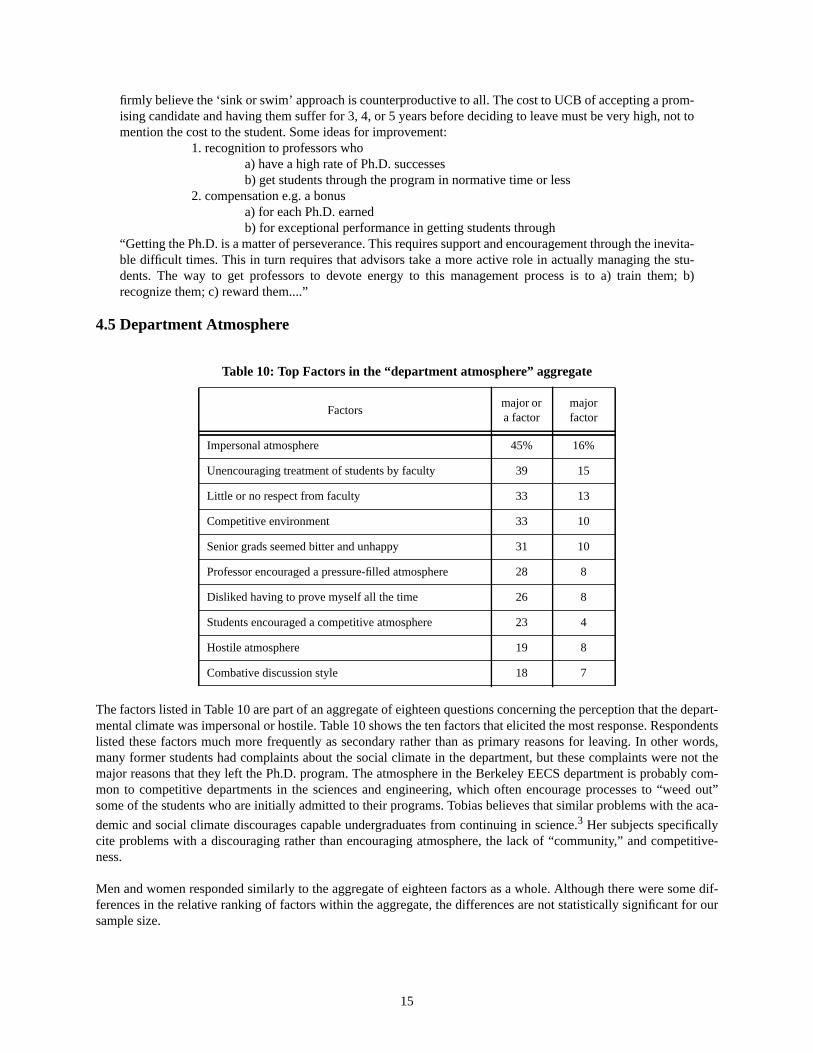
The factors listed in Table 10 are part of an aggregate of eighteen questions concerning the perception that the depart-mental climate was impersonal or hostile. Table 10 shows the ten factors that elicited the most response. Respondentslisted these factors much more frequently as secondary rather than as primary reasons for leaving. In other words,many former students had complaints about the social climate in the department, but these complaints were not themajor reasons that they left the Ph.D. program. The atmosphere in the Berkeley EECS department is probably com-mon to competitive departments in the sciences and engineering, which often encourage processes to “weed out”some of the students who are initially admitted to their programs. Tobias believes that similar problems with the aca-
demic and social climate discourages capable undergraduates from continuing in science.3 Her subjects specificallycite problems with a discouraging rather than encouraging atmosphere, the lack of “community,” and competitive-ness.
Men and women responded similarly to the aggregate of eighteen factors as a whole. Although there were some dif-ferences in the relative ranking of factors within the aggregate, the differences are not statistically significant for oursample size.
Table 10: Top Factors in the “department atmosphere” aggregate
Factorsmajor ora factor
majorfactor
Impersonal atmosphere 45% 16%
Unencouraging treatment of students by faculty 39 15
Little or no respect from faculty 33 13
Competitive environment 33 10
Senior grads seemed bitter and unhappy 31 10
Professor encouraged a pressure-filled atmosphere 28 8
Disliked having to prove myself all the time 26 8
Students encouraged a competitive atmosphere 23 4
Hostile atmosphere 19 8
Combative discussion style 18 7

16
Diversity and BelongingThe most important problem with the department’s atmosphere, as can be seen from Table 10, was its perceivedimpersonal nature. This quality may help explain the surprising and disquieting finding that a large number of stu-dents felt like they did not belong. In addition to the “department atmosphere” aggregate, feeling like an outsider inone’s research group was mentioned by 36% of the respondents, and 33% complained of isolation in their research.
Several students experienced problems related to the diversity of students and faculty in the department. Some expe-rienced discrimination on the basis of ethnicity or sex, while others felt excluded or had problems adjusting to a pop-ulation that includes many international students. The survey asked, “Are you in an ethnic/racial group under-represented in EECS?” without specifying which groups are under-represented or asking respondents to state theirrace or ethnicity. Because several respondents volunteered their ethnicity, inconsistencies in the self-definition ofminority status became apparent. White and Asian students, both male and female, described themselves as under-represented minorities, while others of the same groups stated they were not minorities.
The University of California defines under-represented minorities as members of the following groups: African-American, Filipino-American, Mexican-American, Native American, Pacific Islander, and Puerto Rican. University-wide, Asian Americans, Latinos, and women are also considered to be minorities in disciplines in which they areunder-represented. Among the eight respondents who potentially fit the department’s definition of ethnic minorities,three considered “bias against racial or ethnic minorities” to be “a major factor” in leaving, with one respondent con-sidering it “a factor.” An additional non-minority respondent also cited bias a “major factor.” This is an unacceptablylarge proportion, even though taken from a small sample. A few surveys contained specific comments about minori-ties and discrimination, the mildest of which states, “I could have the same or better research possibilities in industrywithout all the discrimination.” Other comments named specific professors and support programs as condescending,unhelpful, or antagonistic towards minorities. According to one respondent, “Other grad students I spoke to sharedthis view. We were usually quiet since there were too many other things to worry about. I think the students wouldhave been much better off without such questionable help.” Because the number of minorities in the sample is sosmall, it is difficult to draw statistically significant conclusions about the differences between minorities and non-minorities. However, the responses indicate some strong feelings about discrimination that the department shouldinvestigate.
Several non-minority respondents commented on problems with ethnicity and belonging that affected their workingrelationships with faculty and with other students. One student said, “... I felt a large cultural and generational gapbetween [my advisor] and myself. He seemed to get more excited and involved when working with [students of hisnationality] (in fact they often spoke [a language other than English] when discussing research.)” Another student feltexcluded from study groups dominated by international students. A third student responded to the question ofwhether he was a minority by stating “No, but I am gay, which is not under-represented, but it is more closeted inCS...” Comments such as these, and the inconsistent responses to the question about minority status, indicate unre-solved problems about ethnicity and belonging in the department. These problems are not unique to our department,however. Tobias interprets the “weeding-out” process as a mechanism that selects new scientists who can assimilate
into the existing “in-group” of scientists.3 Including more women and minorities will, she claims, require expandingthe notion of good scientist material to include those previously in the “out-groups.”
Problems with impersonal treatment or a competitive atmosphere are felt by many students. Although these problemsmay not on their own determine whether people stay or go, they affect the quality of life in the department and thefeelings that people take with them after leaving. Helping new students become integrated into the department withbetter orientation programs is one way to improve the atmosphere. The administration must also take a leadership rolein increasing the sensitivity of faculty and students towards problems related to ethnic, racial, and sexual diversity.
4.6 Confidence
Eight factors listed in the questionnaire (Table 11) covered the topic of self-confidence. About one-quarter of allrespondents cited at least one of these eight as a major factor in the decision to leave the Ph.D. program.

17
Data for the “confidence” aggregate as a whole show no statistically significant difference between men and women,but this result is misleading. A closer examination of the components of the aggregate reveals that the confidenceproblems differ both qualitatively and quantitatively between the sexes. The women’s problems with self confidencetend to be more general and pervasive than the men’s. The men are typically more self-assured, but their confidencefalls in response to a specific, objective academic problem.
Fifty-six percent of the female respondents cited “did not have enough confidence” as either a major or a secondaryfactor, ranking it in a tie for fifth place among the women. However, only sixteen percent of the women cited this as amajor factor. Thus the aggregate, which counts only major factors, seriously underestimates confidence problemsamong women. In comparison, only 38% of the men selected this factor, ranking it in a tie for fourteenth place amongthe men. Men (13%) were almost as likely as women (16%) to cite this reason as a major factor. However, women(40%) were more likely than men (25%) to cite this reason as a secondary factor. Our results are consistent with thefindings of other researchers, which show that women students tend to have more problems with self-confidence thanmen, even when their academic performance and preparation are comparable to, or better than, men’s. For example,
Strenta et al.6 found women in the sciences were significantly less confident and more depressed about their academicprogress than their male peers, even when their grades were the same as the men’s. (See also the review by Kim-
ball.17)
The question of prelims and confidence reveals an interesting difference between the sexes. Although the numbersare relatively small, men were more likely than women to agree that “failing prelims shook my confidence.” Overone-third of the men counted in the “confidence” aggregate considered this a major factor in their leaving. For themen there is a strong and highly significant correlation (correlation coefficient of 0.66, p-value of less than 0.001)between the factors “did not pass prelims” and “failing prelims shook my confidence.” For the women, there is nosignificant correlation between these two factors. Because the men generally have more confidence, an academicproblem such as failing prelims may be more of a blow to their self-esteem. Alternatively, men who fail prelims mayfocus on prelims as the specific reason for lost confidence, while women view the entire graduate school experienceas a cause for lost confidence.
5.0 Gender Differences
During the first six years covered by this survey, the attrition rate for women EECS Ph.D. students was 57%, com-pared with 39% for the men. (More recent statistics are not yet available due to the potential length of a student’sPh.D. studies.) Considering both the large difference in the attrition rates and the historical under-representation ofwomen in EECS, we expected to find significant gender differences in reasons for leaving graduate school without
Table 11: Factors in the “confidence” aggregate
Factorsmajor ora factor
majorfactor
Didn’t have enough confidence 42% 13%
Lost confidence as graduate school progressed 30 7
Felt inadequate to PhD standards 27 14
I wasn’t creative enough 24 8
Felt my academic background was too weak 21 4
Didn’t have the broad background I thought a doctoralstudent should have before entering graduate school
19 6
I was too shy 19 4
Failing prelims shook my confidence 14 7

18
the Ph.D. Our results surprised us. We found few strong, statistically significant differences in how women and menexplained their decisions to abandon Ph.D. studies. We did find that women and men were, at the outset, equally surethat they wanted the Ph.D. Women and men were also equally likely to think that their academic preparation for grad-uate school was as good as their peers’. It seems that although women leave the program in greater proportions thanmen, they leave for approximately the same reasons. We suggest that gender problems are now seldom overt; thisdoes not mean that subtle or specific issues do not exist. This section discusses the differences that we did find.
During the ten-year period examined by this study, women represented between 8% and 17% of the EECS Ph.D.graduate student population. Because of the higher attrition rates for women, we estimate that women constituted11% to 23% of the survey’s target population. Our response pool had proportionately more women (26%, with oneperson declining to state).
Here we summarize our most important gender-related findings within the aggregates. Out of the ten aggregates, twoaggregates -- “no research match” and “degree requirements”-- suggested some gender differences. We also look atdifferences in the order that women and men ranked individual factors. Finally, we explore gender differences inresponses to rankings of reasons to pursue a Ph.D. and reasons to choose Berkeley.
The “no research match” aggregate provoked the most strikingly different responses from women and men. Two fac-tors within that group seemed to account for the difference: of those who answered the question, significantly morewomen than men cited “unexcited by my research topic” as a “major factor,” and more women cited “focus of myresearch group shifted to area of little interest” as a major factor.
In general, men more frequently cited factors in the “degree requirements” aggregate as major reasons for leaving.When contributing factors are included, differences are less obvious. However, there were two statistically significantdifferences. Women were much more likely to say “prelims were intimidating.” Men ascribed more importance to thefactor “I could have the same or better research possibilities in industry without all the other requirements (prelims,etc.).”
A comparison of the ranking of factors for women and men uncovers gender differences that were not made apparentby our previous analysis. Table 12 shows the ten most commonly cited factors for leaving, ordered separately forwomen and men. As noted in the previous section, “didn’t have enough confidence” was ranked highly by women,but not by men; however, men were much more likely to lose confidence as a result of failing prelims. Men, unex-pectedly, disliked the “impersonal atmosphere.” This was their tenth most-commonly cited factor, but for women itwas in a nine-way tie for twenty-first place. “Realized I didn’t want a career in academics” and “unexcited by myresearch topic” both ranked among the top seven for men, compared with the top sixteen for women.
If we look at only the three most common factors in Table 12, we notice a subtle difference in the reasons given bywomen and men. For the men, the two most frequently cited reasons are clearly career-related -- deciding that theydid not care for an academic career; thus, the Ph.D. was not needed. The two reasons tied for third speak of somedegree of “burn out” for the men, expressing a dislike for the time commitment necessary to obtain the degree. Forwomen the most prominent reason is “wanted to get on with my life,” while career-related choices ranked a close sec-ond and third.
A possible interpretation of this result is that women may be unconsciously more pressed by societal constraints interms of a life timeline. Some may choose to view this pressure as a “biological clock,” but we would like to expandthe concept beyond that of having children and suggest that women require more integration of their career and lifegoals. Thus, career choices must fit into a larger picture. For men, it is more acceptable to segregate the two. Seymour
observed this same phenomenon in a study of undergraduates10: “young men... are more willing to place career goalsabove considerations of personal satisfaction. By contrast, young women show a greater concern to make their educa-tion, their career goals, and their personal priorities, fit coherently together.” Another important concept is the idea ofthe science “mold.” If there are no role-models, no women faculty within the academic mold that appear to enjoy thelife graduate student women aspire to achieve, women will seek a career option in which it is easier to integrate career

19
and personal goals.
Women and men differed in the reasons they chose to pursue the Ph.D. (Table 1) and why they chose the program atBerkeley (Table 2). Both sexes said their main reason for pursuing a Ph.D. was fascination with the subject of EECS,though the mens’ average ranking of this reason was significantly higher than the women’s. The means for thewomen’s reasons were clustered more tightly, suggesting that women tended to find the reasons closer in importancethan the men. At least two possible reasons for the women’s higher ranking of prestige seem plausible: perhapswomen tend to perceive the prestige of their graduate program as more important in ensuring that they will find inter-esting work afterwards, or perhaps women value more highly the recognition of their accomplishments that a presti-gious degree confers.
Both women and men chose Berkeley primarily because it “has a great reputation” (Table 2). However, this is theonly reason the women substantially agreed upon. For women, there is a large gap in the mean rankings between thefirst reason and all the others (from 2.80 to 6.44). Men were more evenly split between their top three reasons (from3.14 to 4.45): the reputation; their belief that it was the best program they were accepted into; and their liking the BayArea. Women agreed less among themselves about reasons besides the reputation, and their rankings differed fromthe men’s. Women cited liking the atmosphere of the EECS department at Berkeley as their second most importantreasons for choosing the school. The department atmosphere influenced the men much less; they ranked it seventh inimportance. Since women found their initial impressions of the department atmosphere so important as a reason tochoose Berkeley, we conjectured that later finding the atmosphere hostile might have been an important reason theyleft. Contrary to our conjecture, we found no correlation between initially liking and valuing the atmosphere and laterfinding it hostile. From this we conclude that women who found the atmosphere pleasant in the beginning continuedto find it acceptable and did not leave because of it. If we compare valuing the good atmosphere initially with findingit hostile later, gender blind, we find that there is a correlation between not initially caring about the atmosphere andfinding it hostile later, though the correlation is not particularly strong or significant. Similar to the men, women citedliking the Bay Area as their third reason for choosing Berkeley, but they also cited “wanting to live elsewhere” morefrequently (28% vs. 8%) as a reason for leaving.
Table 12: Most common factors in leaving for women and men
Women Men
Factorsmajor ora factor
major Factorsmajor ora factor
major
1. Wanted to get on with my life 80% 48% 1. Realized I didn’t need the Ph.D. 77% 49%
2. Realized I didn’t need the Ph.D. 68 48 2. Realized I didn’t want a career inacademics
66 37
3. Wanted work experience 64 36 3. Degree took too long3. Wanted to get on with my life
6666
3434
4. Wanted a break from school 64 20
5. Lack of guidance from advisor 56 32 5. Wanted a break from school 59 27
6. Degree took too long 56 20 6. Lack of guidance from advisor 54 28
7. Didn’t have enough confidence 56 16 7. Unexcited by my research topic 54 20
8. Outside activities more rewarding 52 28 8. Too many hoops to jump through 52 25
9. Constant pressure 52 16 9. Wanted work experience 51 25
10. Prelims were intimidating10. Too many hoops to jump through
5252
1212
10. Impersonal atmosphere 49 17

20
6.0 Conclusions
The decision to pursue a doctoral degree is a personal choice that must match with one’s ultimate career and lifegoals. We have found that a large number of EECS students leave the Ph.D. program because they find that theircareer goals can be achieved without a Ph.D. The object of this survey and the following recommendations (section7.0) is to address the possibility that students are driven away from the doctoral program despite their desire toachieve a Ph.D. because of departmental factors or the present structure of academia.
It is encouraging to see from our survey results that the most commonly given reasons graduate students leave thePh.D. program at Berkeley can be described as career and personal reasons. Seventy-four percent of respondents indi-cated that they left the Ph.D. program because they realized that they no longer needed a Ph.D. for their chosencareer. This suggests that the compelling reasons that students leave the department are because they have simplyaltered or more finely focused their goals after entering the Ph.D. program. However, respondents also indicate thatdepartmental factors do play a definite role in students’ decision to leave. Furthermore, several respondents indicatedin their comments that their experience in the program soured them on academia.
We propose that one major cause of attrition is a lack of integration. Students who fit into the academic “culture” aremore likely to stay in the program, while those who do not, have a higher probability of leaving despite their contin-ued interest in the subject matter. One’s personal perception of not fitting into the culture of academics can originatefrom many sources, and has emotional as well as professional ramifications. The main sources expressed by therespondents of this survey concerned dissatisfaction with the structure of the Ph.D. program and the nature of aca-demics as seen in this department. Specific problems with the program included the length of time it takes to obtainthe degree (63% of respondents thought the “degree took to long”); the number of academic as well as emotional“hoops” a student is expected to jump through during the process of becoming a Ph.D. candidate (52% indicated “toomany hoops to jump through to get the Ph.D.”); and the stressful and combative nature of preliminary exams (37%thought “prelims were intimidating”). Others indicated concerns such as not feeling integrated in the department aca-demically. This issue involves problems ranging from finding an advisor or research group to feeling isolatedamongst colleagues and in research interests. A third of respondents had trouble finding a research project and foundthe process of finding an advisor to be difficult. Others said they felt like an outsider in their research group or feltthey had no peers with whom to discuss their work. Other students were able to find a research group, but advisor-related problems contributed to their decision to leave. For instance, 54% of respondents indicated a “lack of guid-ance” from their advisor. Respondents also found unencouraging treatment in an impersonal, competitive, and pres-sure-filled atmosphere to be factors in their decision to leave.
A student who is well-integrated in the system, who understands the academic progression through graduate school,who has a good relationship with a mentor/advisor and sufficient guidance in research, will develop the necessarysense of belonging to persevere and pursue the Ph.D. The remaining students are left to flounder and are made to feelinadequate because they do not fit into the academic mold. They are not mentored, guided, or encouraged, and do notrecognize the steps necessary to fit the mold. They conclude that they do not belong. And if they perceive that otherenvironments, such as industry, will provide guidance and reward for their efforts, they will probably leave academ-ics and go where they do feel integrated and appreciated.
We also suggest that minorities and women are less likely to fit the academic mold. Responses indicate under-repre-sented minorities had strong feelings about discrimination that should be looked into further by the department (sec-tion 4.5). Several non-minority respondents commented on problems with ethnicity and belonging that affected theirworking relationship with students and other faculty. Surprisingly, when we compared the response from female andmale respondents, we found few strong differences in their responses. Because of this unexpected result, it is interest-ing to note those aggregates and factors that did elicit different responses: a higher percentage of women reported dif-ficulty finding a research match between themselves and the department, and men had more complaints about thedepartment requirements.
Because of the similarity between female and male responses to our questionnaire, the reasons behind the higher attri-
tion statistic for women remain unexplained. Seymour10 offers a theory that explains the difficulty some women have

21
fitting into the academic culture. She views the weeding-out process as a typically male rite-of-passage. Men, shesuggests, recognize from their previous socialization that they must prove themselves before being accepted into the“fraternity” where they will receive the mentorship and reward that they need. Women do not tend to recognize theweeding process for what it is; they become discouraged and tend to blame themselves for the hardships that the pro-cess imposes. Seymour points out that, “As studies of graduate and professional women in science have indicated,women who successfully decode the meaning of the undergraduate testing process do not automatically receive this
reward. They are not accepted into the fraternity, except as tokens, and are not mentored by it.” Tobias3 also discussesthe sociology of weeding and hypothesizes that science “selects students for fitting into the ‘culture of science,’”resulting in a survival of the most similar, rather than of the fittest.
We have identified problems with the graduate student experience for those who left the program. These same prob-lems may also affect the productivity and well-being of those who remain. For future work, we suggest that a similarsurvey be performed on graduate students who do attain the Ph.D. to compare differences between the two groups.What are the differences between students who persist and those who leave? Are the differences in personality, back-ground, or simply situation? We have noted that women students have been less likely to complete the Ph.D. thanmen, but the survey results do not explain this difference. Comparing students who stay with those who leave maygive us more insight into this issue.
7.0 Recommendations
We realize that attrition in Ph.D. programs is a difficult issue to address. There is obviously no comprehensive solu-tion to the problem because individuals are involved, and every student’s background, goals, needs, concerns, andpersonality is unique. The path to a Ph.D. is an arduous one that is a unique process for each individual. Because ofthis, we would like to underscore desJardins’ characterization of the “unstructured” nature of getting the Ph.D.Although there is no recipe for obtaining a Ph.D., there exists amongst students a perceived timeline of progressregarding a suitable number of publications, amount of research progress, and number of conferences attended. Wewould like to strongly encourage the administration, professors, and even senior graduate students to help graduatestudents progress, but through encouragement, rather than the threat of being “behind” in a perceived imaginary time-line. We must find ways other than a sequence of traumatic checkpoints to provide direction and a sense of progress tostudents.One respondent commented, “The process seems oriented to keeping people from succeeding, rather thanhelping them succeed.”
Integrate first year students: finding a research group. Help students find an advisor and research group. Althoughthe department has made an effort to create research presentations for first year students to help them choose an advi-sor, the process can still be an intimidating.Programs such as voluntary, short-term research rotations in labs wouldgive students a more accurate taste of the work done by specific groups.Indeed, incoming students are often moreanxious to find any group and advisor who will take them and do not consider that funding and the type of workinvolved in a project will have a profound effect on them. All efforts to integrate new students in other ways shouldalso be greatly encouraged and continued. Some existing examples at Berkeley are academic advising from moreadvanced graduate students, and prelim practice and study sessions. Recent suggestions have also been made at stu-dent feedback sessions to distribute a list of “tips” for both new students and for advisors regarding the types of issuesthat should be discussed between student and advisor before they choose to work together. These include funding, theamount of research activity expected of a student who is TA-ing or taking classes, and the nature of current and antic-ipated projects in the group.
Evaluate prelims: The department has also made changes to the preliminary exam in recent years.A continued lookat the preliminary exam would be beneficial to evaluate its accuracy in predicting the ability of a student to obtain aPh.D. We must evaluate if these “weeding” techniques are really valid methods of predicting academic success or ifthey are simply driving away talented students. Four out of eleven respondents who considered failing prelims a“major factor” in leaving went on to obtain Ph.D.’s in other graduate engineering programs, including three in EECS.Others who failed prelims went on to successful careers in industrial research.

22
Guide students in the dissertation topic choice.With the large response to having “no research match,” we must alsoacknowledge the difficulty of finding a research project for the Ph.D. dissertation. Since the research project requiresa substantial commitment of a student’s time while obtaining the degree, it is disturbing to see the large number ofstudents who were unexcited by their research topic or couldn’t find a research project or match on the faculty fortheir research interests. Even if advisors believe that students should find their own projects, they can help guide them
through theprocess of finding a dissertation topic. Some ideas suggested by desJardins16 are: to encourage studentsto read papers and point out interesting articles to them, to help students to break down projects into smaller goals sothe prospect of finding a project is not so daunting, to work with all students -- not just those who are working on petprojects, or those with whom the advisor is comfortable. The department can also help students by continuing withmaterials such as the research summary of all projects in the department. This gives students a realistic view ofprojects that are actually in existence, since a professor’s research interests can sound a lot broader than they actuallyare. The department can also support student sponsored seminars. For example WICSE, a department-supportedorganization, has started seminars giving students advice on how to begin the Ph.D. project.
Reward faculty for mentoring. Faculty must be reminded of the influence they have on students both emotionally andprofessionally. Students do not enter with the ability to perform independent research. An essential element of gradu-ate school is learning the research process. Many advisors make a concerted effort to initiate students to the methodof research, aid students in finding a research project of interest, make themselves available for students, and haveconcern professionally for their students in terms of encouraging publications, getting their students out in a reason-able amount of time, and helping them to find jobs. These advisors should be rewarded for their efforts. The Com-puter Science Division at Berkeley is currently setting up a system of feedback for advisors. The feedback will alsogive the department a basis on which to evaluate and distinguish those professors who are putting extra effort intomentoring students. These evaluations should also be made available to new students who are deciding on a researchgroup. This will aid them in choosing a research group not only for the project, but also for best fitting their workstyle and personality.
Interacting with students.Pinpointing the causes of attrition is exceedingly difficult largely because a great deal ofthe graduate experience depends on individual interaction between students and faculty, in particular the interactionbetween students and their advisors. It is essential for advisors to realize that each student is unique and has a differ-ent communication and work style. Thus, it is helpful for advisors to gear their mentoring approaches towards indi-viduals. Advisors should differentiate between undergraduate, beginning graduate, and senior graduate students.Their needs and required amount of mentoring are very different. We reiterate desJardins’ suggestion that advisorsshould make an effort to work withall students, not just those with whom they are most comfortable.
Provide structure before quals. The electrical engineering department at Berkeley has made a recent effort to restruc-ture its qualifying exams, encouraging students to take them earlier in the graduate program so that the exam is moreof a research proposal rather than a dissertation defense. This is believed to reduce the time to degree by getting stu-dents to think seriously about their research project earlier. The intent is to match students up with faculty membersother than their research advisor so that throughout their academic career they have a committee of professors whoare knowledgeable about their research to whom they can turn for advice. The motivation is admirable and necessary,since it is earlier in the academic career that students need more direction and guidance with their research; however,there are other, less confrontational methods of achieving the same goal. While the process of preparing for the qual-ifying exam is valuable in forcing a student to generate a research plan and giving them more direction, the burden ofensuring steady progress in research should not fall solely upon the students’ shoulders. We believe adequate mentor-ing and guidance from the faculty greatly aids students in reducing their time to degree. Without guidance from fac-ulty, students are apt to flounder and become discouraged.
Break the academic mold -- promote diversity. The “sink or swim” attitude is often professed to be the desired
method of finding the star students who, in Tobias’ words, “rise to the top like cream.”3 We support Tobias’ view thatthis process allows only a certain type of student to flourish while other equally capable students are simply turned offby the competitive climate. In effectively ostracizing these “other” students from the field, we lose valuable intellectthat can only expand and further the field.To enlarge the definition of a successful Ph.D. student, we urge the admin-istration to take a leadership role to increase faculty and peer sensitivity of minority and women’s issues. Henes et
23
al.18 suggest workshops for faculty led by student panels to heighten faculty awareness and sensitivity. Such work-shops were held at the University of California at Davis and among faculty responses, “60% were surprised by the
information presented, and 72% felt their views had changed as a result of attending.”18 We would also like to com-ment that these “other” students are not only women and minorities. Indeed, the lack of statistically significant differ-ences between women and men in our results indicates that men who leave are equally dissatisfied with the currentacademic culture. A heightened sensitivity and acceptance of all cultures, genders, and personalities would be benefi-cial to all. Faculty must be reminded that there is more than one way to approach research, and just because a studentdiffers in her or his approach, does not mean she or he is not equally likely of success.
Conduct exit interviews.We also suggest that as a constant source of feedback to the department, graduating studentsbe asked to fill out exit interviews or surveys. In hindsight perhaps these students will be able to identify the attributesof their experience that helped them to persevere. With these suggestions, the department can better improve policiesto create a productive environment for all types of students.
AcknowledgmentsThis work has been funded by the EECS department at Berkeley. It would not have been possible without the unflag-ging support of Dr. Sheila Humphreys, the Academic Coordinator for Student Matters in EECS, who helped us securefunding and served as liaison with other parts of the university. Several members of the women in engineering groupWICSE, chiefly Drs. Mor Harchol-Balter, Sherry Lee, and Dawn Tilbury contributed significant amounts of time andimportant ideas. We also thank the participants of our initial focus group, whose experiences were invaluable in creat-ing the questionnaire. Gregg Thomson, Director of the Office of Student Research, Division of UndergraduateAffairs, made suggestions for our survey design and approaches to analysis. Guenther Walther of the statistics gradu-ate student consulting service, provided initial statistical help. Prof. Paul W. Holland of the Graduate School of Edu-cation provided insightful comments on survey analysis. Dr. Maresi Nerad of the Graduate Division shared herknowledge in graduate retention research. Pat McPeak, Suzanne Pierce and Michael Dahl provided us with invalu-able database help in tracking down former students, as did Harry Rubin, Chris Black, and Paul Hansen. Mary Bre-unig from the alumnae society also helped with addresses of former students. Harry Case introduced us to SPSS andhelped us focus our use of this software. Cara Warburton and Karen Fu performed our data entry work. Ruth Gjerde’shelp made our mailing task considerably easier.
References[1] 1981-1983 completion data from the Graduate Division of the University of California, Berkeley. 1984-1986 datavia personal communication with Maresi Nerad of the Graduate Division of the University of California, Berkeley.[2] E. G. Barber, R. P. Morgan, W. P Darby, L. J. Sallmen-Smith, “To pursue or not pursue a graduate engineeringdegree,”J. of Engineering Education, v. 79, no. 5, pp. 550-555, 1989.[3] S. Tobias, “They’re not dumb, they’re different; a new ‘tier of talent’ for science,” Change, v. 22, no. 4, pp. 10-30, 1990.[4] E. Seymour “ ‘The problem iceberg’ in science, mathematics, and engineering education: student explanationsfor high attrition rates,” J. of College Science Teaching, v. 21, no. 4, pp. 230-238, 1992.[5] E. Seymour, “Revisiting ‘the problem iceberg’: science, mathematics, and engineering students still chilled out,”J. of College Science Teaching, v. 24, no. 6, pp. 392-400, 1995.Reprinted in E. Seymour, N. M. Hewitt, “Talking about leaving: factors contributing to high attrition rates among sci-ence, mathematics, and engineering undergraduate majors,”Bureau of Sociological Research, University of Colo-rado, 1994.[6] A. C. Strenta, R. Elliot, R. Adair, M. Matier, J. Scott, “Choosing and leaving science in highly selective institu-tions,” Research in Higher Education, v. 35, no. 5, pp. 513-547, 1994.[7] E. Seymour, “Undergraduate problems with teaching and advising in SME majors -- explaining gender differ-ences in attrition rates,” J. of College Science Teaching, v. 21, no. 5, pp. 284-292, 1992.[8] E. Baum “Why so few women in engineering?”J. of Engineering Education, v. 79, no. 5, pp. 556-557, 1989.[9] S. Widnall, “AAAS presidential lecture: voices from the pipeline,”Science, v. 241, pp. 1740-1745, 1988.[10] E. Seymour, “The loss of women from science, mathematics and engineering undergraduate majors: an explan-atory account,”Science Education, v. 79, no. 4, pp. 437-473, 1995.[11] R. M. Felder, G. N. Felder, M. Mauney, C. E. Hamrin, Jr., E. J. Dietz, “A longitudinal study of engineering stu-
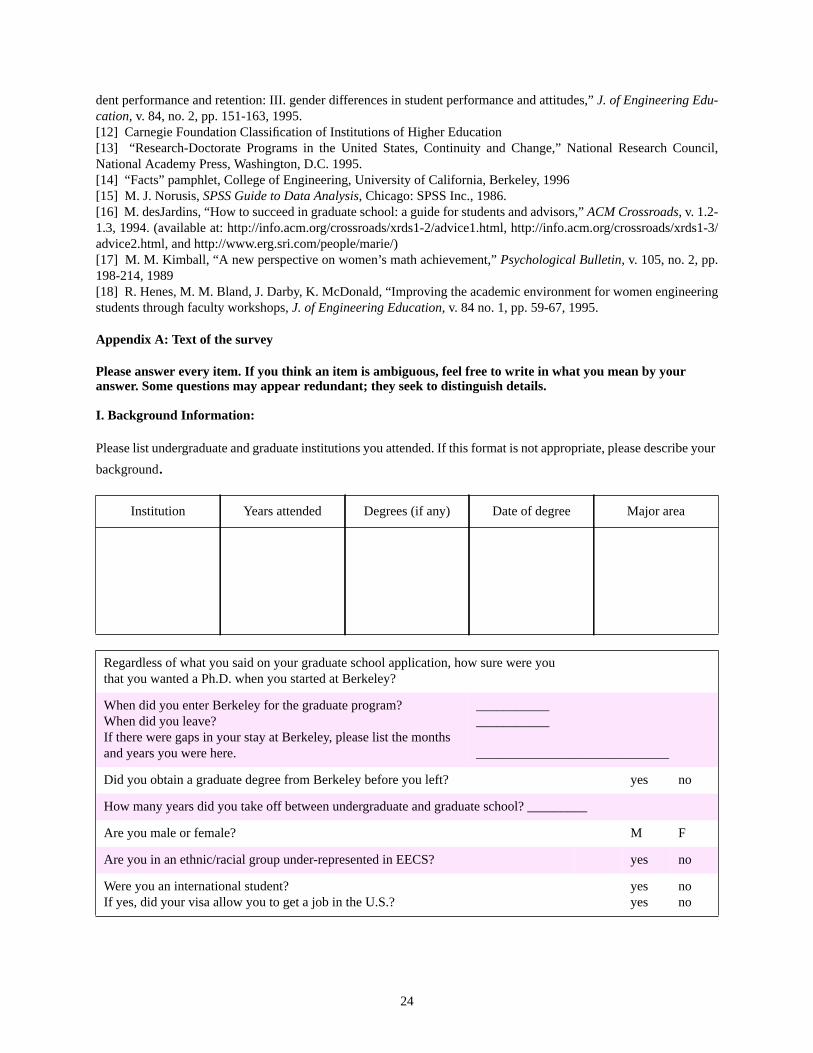
24
dent performance and retention: III. gender differences in student performance and attitudes,”J. of Engineering Edu-cation, v. 84, no. 2, pp. 151-163, 1995.[12] Carnegie Foundation Classification of Institutions of Higher Education[13] “Research-Doctorate Programs in the United States, Continuity and Change,” National Research Council,National Academy Press, Washington, D.C. 1995.[14] “Facts” pamphlet, College of Engineering, University of California, Berkeley, 1996[15] M. J. Norusis,SPSS Guide to Data Analysis, Chicago: SPSS Inc., 1986.[16] M. desJardins, “How to succeed in graduate school: a guide for students and advisors,”ACM Crossroads, v. 1.2-1.3, 1994. (available at: http://info.acm.org/crossroads/xrds1-2/advice1.html, http://info.acm.org/crossroads/xrds1-3/advice2.html, and http://www.erg.sri.com/people/marie/)[17] M. M. Kimball, “A new perspective on women’s math achievement,”Psychological Bulletin, v. 105, no. 2, pp.198-214, 1989[18] R. Henes, M. M. Bland, J. Darby, K. McDonald, “Improving the academic environment for women engineeringstudents through faculty workshops,J. of Engineering Education, v. 84 no. 1, pp. 59-67, 1995.
Appendix A: Text of the survey
Please answer every item. If you think an item is ambiguous, feel free to write in what you mean by youranswer. Some questions may appear redundant; they seek to distinguish details.
I. Background Information:
Please list undergraduate and graduate institutions you attended. If this format is not appropriate, please describe your
background.
Institution Years attended Degrees (if any) Date of degree Major area
Regardless of what you said on your graduate school application, how sure were youthat you wanted a Ph.D. when you started at Berkeley?
When did you enter Berkeley for the graduate program?When did you leave?If there were gaps in your stay at Berkeley, please list the monthsand years you were here.
______________________
_____________________________
Did you obtain a graduate degree from Berkeley before you left? yes no
How many years did you take off between undergraduate and graduate school? _________
Are you male or female? M F
Are you in an ethnic/racial group under-represented in EECS? yes no
Were you an international student?If yes, did your visa allow you to get a job in the U.S.?
yesyes
nono
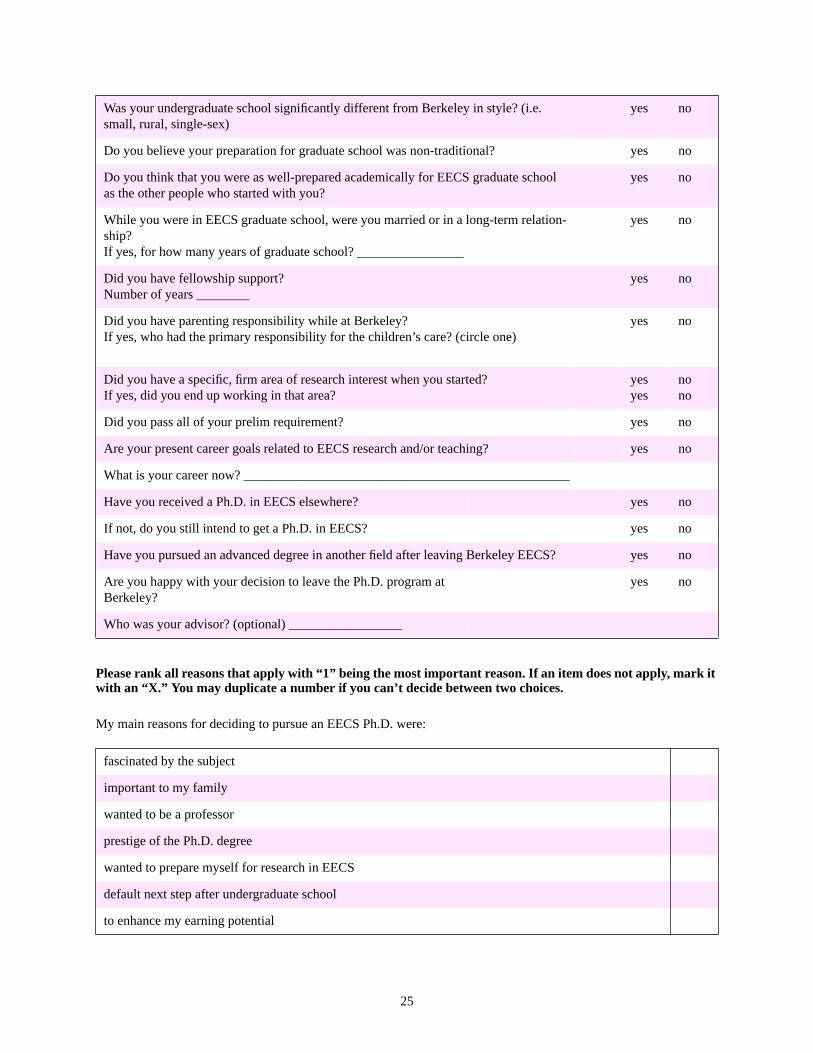
25
Please rank all reasons that apply with “1” being the most important reason. If an item does not apply, mark itwith an “X.” Y ou may duplicate a number if you can’t decide between two choices.
My main reasons for deciding to pursue an EECS Ph.D. were:
Was your undergraduate school significantly different from Berkeley in style? (i.e.small, rural, single-sex)
yes no
Do you believe your preparation for graduate school was non-traditional? yes no
Do you think that you were as well-prepared academically for EECS graduate schoolas the other people who started with you?
yes no
While you were in EECS graduate school, were you married or in a long-term relation-ship?If yes, for how many years of graduate school? ________________
yes no
Did you have fellowship support?Number of years ________
yes no
Did you have parenting responsibility while at Berkeley?If yes, who had the primary responsibility for the children’s care? (circle one)
yes no
Did you have a specific, firm area of research interest when you started?If yes, did you end up working in that area?
yesyes
nono
Did you pass all of your prelim requirement? yes no
Are your present career goals related to EECS research and/or teaching? yes no
What is your career now? _________________________________________________
Have you received a Ph.D. in EECS elsewhere? yes no
If not, do you still intend to get a Ph.D. in EECS? yes no
Have you pursued an advanced degree in another field after leaving Berkeley EECS? yes no
Are you happy with your decision to leave the Ph.D. program atBerkeley?
yes no
Who was your advisor? (optional) _________________
fascinated by the subject
important to my family
wanted to be a professor
prestige of the Ph.D. degree
wanted to prepare myself for research in EECS
default next step after undergraduate school
to enhance my earning potential

26
My main reasons for choosing Berkeley were:
To what extent did the following affect your decision to leave Berkeley? (Please rank from 1 to 3 where 1means it was a major factor, 2 means it was a contributing factor, and 3 means it was not a factor.) Indicate themost important factor by circling the item.
II. Berkeley environment:
to improve my career opportunities
didn’t like work in industry
other _________________
it was the best program I was accepted into
it had faculty with whom I wanted to work
it has a great reputation
geographic area was good for my significant other
it was the only school I applied to/was accepted into
liked the Bay Area
liked the atmosphere of the EECS department at Berkeley
wanted a change from my undergraduate school
friends recommended it to me
it was the most affordable school I got into/gave the best financial support
it had the best research facilities
other _________________
majorfactor
afactor
not afactor
did not pass prelims 1 2 3
did not pass qualifying exam 1 2 3
my G.P.A. wasn’t high enough to continue for the Ph.D 1 2 3
prelims were intimidating 1 2 3
process of finding an advisor difficult at Berkeley 1 2 3
too many hoops to jump through to get the Ph.D 1 2 3
degree took too long 1 2 3
too many classes required 1 2 3
classes were too difficult or too much work 1 2 3

27
frustrating trying to get credit for classes I took at otherschools or in other areas
1 2 3
changing research group/project to improve the situation was too difficult 1 2 3
not enough financial support 1 2 3
always had to TA to support myself 1 2 3
problems getting integrated in first year(no office/copy card/workstation)
1 2 3
no one to help students to clarify requirements and deadlines 1 2 3
little or no respect from other students 1 2 3
little or no respect from faculty 1 2 3
little or no respect from staff 1 2 3
a particular professor made my life miserable 1 2 3
a faculty member discouraged me from getting a Ph.D. 1 2 3
unencouraging treatment of students by faculty 1 2 3
hostile atmosphere 1 2 3
competitive environment 1 2 3
impersonal atmosphere 1 2 3
combative discussion style 1 2 3
professors encouraged a pressure-filled atmosphere 1 2 3
students encouraged a competitive atmosphere 1 2 3
disliked having to prove myself all the time 1 2 3
bad office situation 1 2 3
friends in other EECS Ph.D. programs were treated much better 1 2 3
bias against racial/ethnic minorities 1 2 3
EECS department was unsupportive/unaware of issues of women students 1 2 3
uncomfortable with skewed ratio of men to women 1 2 3
senior grads seemed bitter and unhappy 1 2 3
few good role models among the more senior students 1 2 3
didn’t see senior students get jobs I would be interested in 1 2 3
problems with housing 1 2 3
problems with transportation/parking 1 2 3
majorfactor
afactor
not afactor
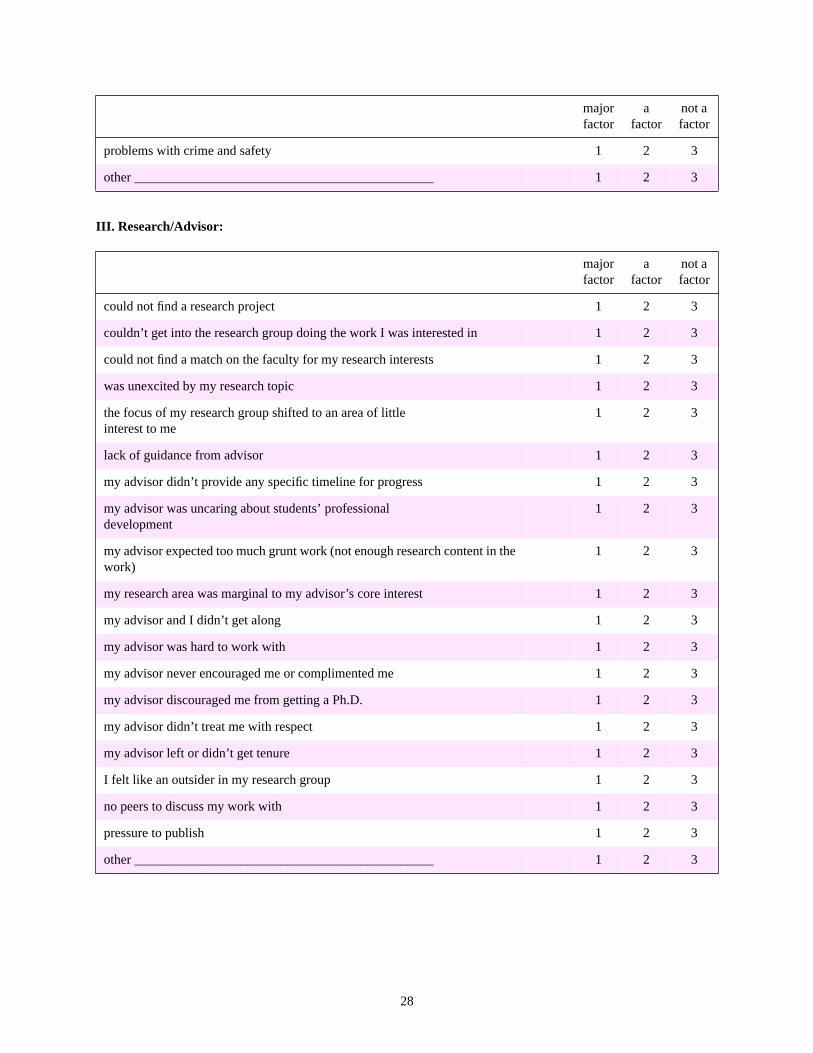
28
III. Research/Advisor:
problems with crime and safety 1 2 3
other _____________________________________________ 1 2 3
majorfactor
afactor
not afactor
could not find a research project 1 2 3
couldn’t get into the research group doing the work I was interested in 1 2 3
could not find a match on the faculty for my research interests 1 2 3
was unexcited by my research topic 1 2 3
the focus of my research group shifted to an area of littleinterest to me
1 2 3
lack of guidance from advisor 1 2 3
my advisor didn’t provide any specific timeline for progress 1 2 3
my advisor was uncaring about students’ professionaldevelopment
1 2 3
my advisor expected too much grunt work (not enough research content in thework)
1 2 3
my research area was marginal to my advisor’s core interest 1 2 3
my advisor and I didn’t get along 1 2 3
my advisor was hard to work with 1 2 3
my advisor never encouraged me or complimented me 1 2 3
my advisor discouraged me from getting a Ph.D. 1 2 3
my advisor didn’t treat me with respect 1 2 3
my advisor left or didn’t get tenure 1 2 3
I felt like an outsider in my research group 1 2 3
no peers to discuss my work with 1 2 3
pressure to publish 1 2 3
other _____________________________________________ 1 2 3
majorfactor
afactor
not afactor
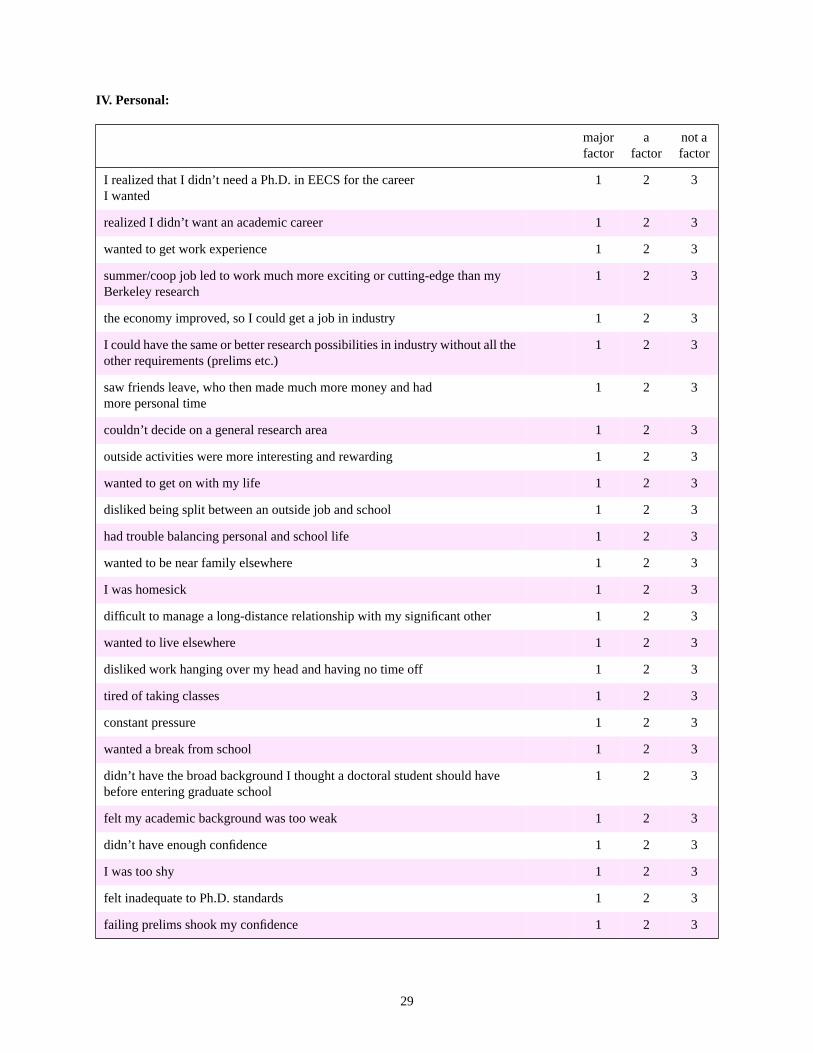
29
IV. Personal:
majorfactor
afactor
not afactor
I realized that I didn’t need a Ph.D. in EECS for the careerI wanted
1 2 3
realized I didn’t want an academic career 1 2 3
wanted to get work experience 1 2 3
summer/coop job led to work much more exciting or cutting-edge than myBerkeley research
1 2 3
the economy improved, so I could get a job in industry 1 2 3
I could have the same or better research possibilities in industry without all theother requirements (prelims etc.)
1 2 3
saw friends leave, who then made much more money and hadmore personal time
1 2 3
couldn’t decide on a general research area 1 2 3
outside activities were more interesting and rewarding 1 2 3
wanted to get on with my life 1 2 3
disliked being split between an outside job and school 1 2 3
had trouble balancing personal and school life 1 2 3
wanted to be near family elsewhere 1 2 3
I was homesick 1 2 3
difficult to manage a long-distance relationship with my significant other 1 2 3
wanted to live elsewhere 1 2 3
disliked work hanging over my head and having no time off 1 2 3
tired of taking classes 1 2 3
constant pressure 1 2 3
wanted a break from school 1 2 3
didn’t have the broad background I thought a doctoral student should havebefore entering graduate school
1 2 3
felt my academic background was too weak 1 2 3
didn’t have enough confidence 1 2 3
I was too shy 1 2 3
felt inadequate to Ph.D. standards 1 2 3
failing prelims shook my confidence 1 2 3

30
Thank you for taking the time to complete this survey. Please write any final thoughts or comments below oron the back of this sheet. Do you have suggestions for how to improve the environment for graduate studentsin the EECS department?
lost confidence as graduate school progressed 1 2 3
I wasn’t creative enough 1 2 3
no home support for being in grad school 1 2 3
no emotional support from family, friends, and others 1 2 3
socially isolated in personal life 1 2 3
health problems 1 2 3
other ______________________________________________ 1 2 3
majorfactor
afactor
not afactor