pharmacokinetic interpretation of the plasma levels of clonidine following transdermal delivery
TRANSCRIPT

COMMUNICATIONS
Pharmacokinetic Interpretation of the Plasma Levels of Clonidine Following Transdermal Delivery
To The Editor: The use of transdermal drug delivery to elicit a sustained
systemic effect is a subject of considerable current interest. The scopolamine and nitroglycerin therapeutic systemsx4 have recently been joined by a transdermal device containing clonidine, a potent antihypertensive agent.5 Clonidine meets many of the criteria necessary for a drug to be delivered successfully via the skin: it is highly efficacious at low doses, it has both reasonable oil and water solubilities, and it possesses a well-balanced lipid-aqueous phase partition coef- ficient. The purpose of this communication is to show that, through the use of a biophysically-based model of percutane- ous absorption, the physicochemical properties of the drug may be related to the design of the transdermal delivery system (i.e., its release characteristics) to predict plasma levels following topical administration of the agent. The approach is illustrated using clonidine for which pharmaco- kinetic data following transdermal delivery have recently been p~bl ished.~
We have previously reported a straightforward linear pharmacokinetic model for the interpretation of in vivo percutaneous absorption data.6 This simulation established rate constants which could be related to basic physicochemi- cal properties of the penetrant. The initially simple approach has been extended to include specific input kinetics to the skin surface from a topical device7 and now concentrates upon plasma concentration information rather than urinary excretion rate data. We intend to demonstrate that the successful ability of the model to simulate clonidine transder- ma1 kinetics implies significant predictive potential. In other words, that the approach may be used prospectively both to assess potential transdermal drug candidates and to estab- lish appropriate input rate characteristics necessary to main- tain a sustained therapeutic effect.
Figure 1 illustrates the model schematically. Input kinet- ics from the device are described by f(k’); for a membrane- controlled patch such as that described for Cl~nidine,~ f(k’) consists of two parts: a first-order component (k’) represent- ing release from the contact adhesive8 and a zero-order contribution (KO) representing the membrane-controlled leaching of drug from the reservoir. The parameter k, is included into the model for completeness. It reflects the fact that there will be competition for the drug between the patch and the skin surface. In most cases, if the system is well- designed, the partitioning will favor the skin and k, will be negligibly small. The first-order rate constants kl and k2 describe drug transport across the stratum corneum and viable epidermal tissue, respectively. Thus, kl and k2 are directly proportional to the corresponding diffusion coeffi- cients through these layers of skin and are, most simplistical- ly, therefore, inversely dependent upon penetrant molecular weight (via the Stokes-Einstein equationg). The kl and k2 values for benzoic acid (kTA, k!A) have been established by previous work6 and may be used, with the appropriate molecular weight correction, to calculate kl and k2 parame- ters for other penetrants (e.g., clonidine) via eqs. 1 and 2:
where MBA and MC are the molecular weights of benzoic acid and clonidine, respectively. The k3 rate constant describes the affinity of the penetrant for the stratum corneum com- pared to the viable epidermis. Thus, k3 compensates for the simplistic evaluation of kl and allows for greater interaction between the penetrant and the stratum corneum (thereby producing slower rates of transport out of the horny layer). The ratio k3/k2 may be viewed as an “effective partition coefficient” between stratum corneum and viable epidermis; the greater the ratio, the longer the penetrant transit time across the outermost skin layer. For many of the compounds analyzed with the initial kinetic approach,6J0 k3/kz appears to be linearly correlated with the octanol-water partition coefficient ( K ) and the relationship:
k3ik2 21 Ki5 (3) describes this dependence empirically. Hence, if K is known, eqs. 1-3 can be used to estimate k l - k3 for any penetrant on the basis of physicochemical properties alone. Finally, k4 is the elimination rate constant of the drug from the blood. More complicated excretion behavior can be incorporated if warranted. The value of k4 cannot be predicted but must be measured following intravenous administration of the sub- strate.
For the model as described (and shown in Fig. l), it is possible to write down a series of differential equations that determine the kinetics of the transdermal absorption process. For delivery from a membrane-controlled patch, we expect both zero-order and first-order contributions to f (k’) and, on this basis, we solve the kinetic expressions for the concentra- tion of drug in the blood (C3) to obtain:
101 6 / Journal of Pharmaceutical Sciences Vol. 74, No. 9, September 7985
0022-3549/85/0900- 10 16$0 I . OO/O 0 1985, American Pharmaceutical Association
Viable Blood -+ epidilmis 1 - k4 -
Figure 1-Schematic representation of the transdermal delivery phar- macokinetic model.
The first series of terms, collected in braces, is the zero-order contribution, the second is the first-order component. In eq. 4, A is the surface area of the delivery system, M, is the amount of drug in the "priming" contact adhesive, V d is the volume of distribution of the drug, and a, p, E , o, and p are defined as follows:
(5 )
(6)
(7)
To predict the plasma concentration versus time profile for clonidine, we use eq. 4 with the appropriate values for the parameters required. First, as stated,' we assume that k , is small: k , = 1 x h-l. The values of kl and k2 are found from eqs. 1 and 2, res ectively, using known MBA and MC and published and k f k i.e., kl = 0.15 h-', kz = 2.4 h-l. The k3 value is found from the octanol-water partition coefficient for clonidine (K = 6.7)" and eq. 3; thus, k3 = 3.2 h-l. The volume of distribution of clonidine (Vd = 147 L) and the systemic elimination kinetics of the drug (kq = 0.08 h-') have been reported.12 For the most efficient membrane- controlled patch described recently5 (which contains 2.5 mg of clonidine), A = 5 cm', ko = 1.6 pg/cm2/h, and the ratio of drug in the reservoir to drug in the adhesive is 4.3:l. Lastly, although k' (the release kinetics of the priming clonidine dose in the patch adhesive) has not been reported, it is assumed that its value will be comparable to that exhibited by the similarly designed scopolamine therapeutic system,' i.e., k' = 1.3 h-l.
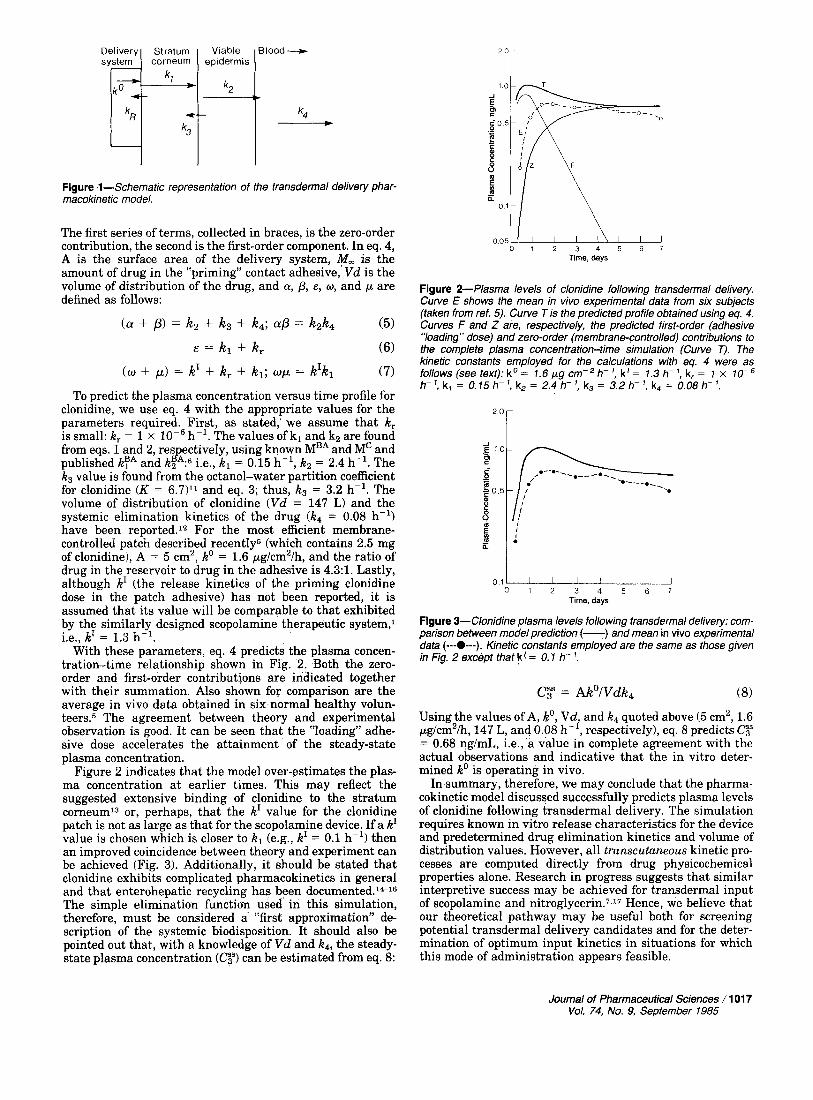
With these parameters, eq. 4 predicts the plasma concen- tration-time relationship shown in Fig. 2. Both the zero- order and first-order contributions are indicated together with their summation. Also shown for comparison are the average in vivo data obtained in six normal healthy volun- t e e r ~ . ~ The agreement between theory and experimental observation is good. It can be seen that the "loading" adhe- sive dose accelerates the attainment of the steady-state plasma concentration.
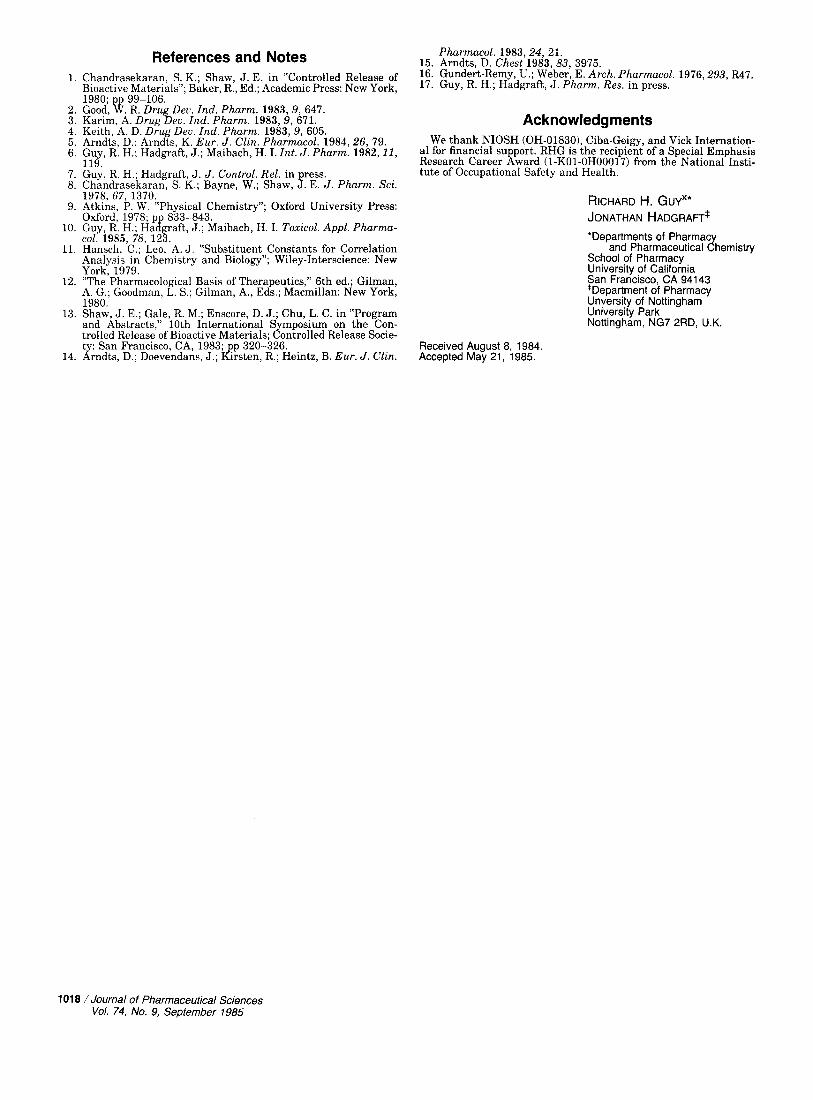
Figure 2 indicates that the model over-estimates the plas- ma concentration at earlier times. This may reflect the suggested extensive binding of clonidine to the stratum corneum13 or, perhaps, that the k' value for the clonidine patch is not as large as that for the scopolamine device. If a k' value is chosen which is closer to kl (e.g., k' = 0.1 h-') then an improved coincidence between theory and experiment can be achieved (Fig. 3). Additionally, it should be stated that clonidine exhibits complicated pharmacokinetics in general and that enterohepatic recycling has been documented.l6l6 The simple elimination function used in this simulation, therefore, must be considered a "first approximation" de- scription of the systemic biodisposition. It should also be pointed out that, with a knowledge of V d and kq, the steady- state plasma concentration (CF) can be estimated from eq. 8:
( a + p) = kz + k3 + k,; = k2k4 F = k l + k ,
( w + p) = k' + k , + k,; w p = k'kl
0 1 2 3 4 5 6 7 Time, days
Figure 2- Plasma levels of clonidine following transdermal delivery. Curve E shows the mean in vivo experimental data from six subjects (taken from ref. 5). Curve T is the predicted profile obtained using eq. 4. Curves F and Z are, respectively, the predicted first-order (adhesive "loading" dose) and zero-order (membrane-Controlled) contributions to the complete plasma concentration-time simulation (Curve r). The kinetic constants employed for the calculations with eq. 4 were as follows (see text): ko = 7.6 pg cm-'h- ', k' = 7.3 h- ', k, = 7 x 70- h- ', k, = 0.75 h- ', k, = 2.4 h- ', k3 = 3.2 h- ', k4 = 0.08 h- '.
2'o i
0 1 0 1 2 3 4 5 6 7
Time. days
Figure 3-Clonidine plasma levels following transdermal delivery: com- parison between model prediction (-) and mean in vivo experimental data (---O---). Kinetic constants employed are the same as those given in Fig. 2 except that k' = 0.7 h- '.
Cg = Ako/Vdk4 (8)
Using the values of A, ko, V d , and k4 quoted above (5 cm', 1.6 pg/cm2/h, 147 L, and 0.08 h-', respectively), eq. 8 predicts C y = 0.68 ng/mL, i.e., a value in complete agreement with the actual observations and indicative that the in vitro deter- mined ko is operating in vivo.
In summary, therefore, we may conclude that the pharma- cokinetic model discussed successfully predicts plasma levels of clonidine following transdermal delivery. The simulation requires known in vitro release characteristics for the device and predetermined drug elimination kinetics and volume of distribution values. However, all transcutaneous kinetic pro- cesses are computed directly from drug physicochemical properties alone. Research in progress suggests that similar interpretive success may be achieved for transdermal input of scopolamine and n i t rog ly~e r in .~ .~~ Hence, we believe that our theoretical pathway may be useful both for screening potential transdermal delivery candidates and for the deter- mination of optimum input kinetics in situations for which this mode of administration appears feasible.
Journal of Pharmaceutical Sciences / 101 7 Voi. 74, No. 9, September 7985
References and Notes 1. Chandrasekaran, S. K.; Shaw, J. E. in “Controlled Release of
Bioactive Materials”; Baker, R., Ed.; Academic Press: New York, 1980: DD 99-106.
2. Good, ‘W. R. Drug Deu. Ind. Pharm. 1983,9, 647. 3. Karim, A. Drug Deu. Ind. Pharm. 1983,9,671. 4. Keith, A. D. DruE Deu. Ind. Pharm. 1983,9, 605. 5. Arndts, D.; Arnd‘is, K. Eur. J . Clin. Pharmacol. 1984,26, 79. 6. Guy, R. H.; Hadgraft, J.; Maibach, H. I. Int. J . Pharm. 1982,11,
7. Guy, R. H.; Hadgraft, J. J . Control. Rel. in press. 8. Chandrasekaran, S. K.; Bayne, W.; Shaw, J. E. J . Pharm. Sci.
1978, 67, 1370. 9. Atkins. P. W. “Phvsical Chemistrv”: Oxford Universitv Press:
119.
* , Oxford: 1978; p 853-843
10. Guy, R. H.; Halgraft, J.; Maibach, H. I. Toxicol. Appl. Pharma- col. 1985, 78, 123.
11. Hansch, C.; Leo, A. J. “Substituent Constants for Correlation Analvsis in Chemistrv and Biolom”: Wilev-Interscience: New -“ I
York: 1979. 12. “The Pharmacological Basis of Therapeutics,” 6th ed.; Gilman,
A. G.; Goodman, L. S.; Gilman, A., Eds.; Macmillan: New York, 1980.
13. Shaw, J. E.; Gale, R. M.; Enscore, D. J.; Chu, L. C. in “Program and Abstracts,” 10th International Symposium on the Con- trolled Release of Bioactive Materials; Controlled Release Socie- ty: San Francisco, CA, 1983; pp 320-326.
14. Arndts, D.; Doevendans, J.; Kirsten, R.; Heintz, B. Eur. J . Clin.
Pharmacol. 1983,24, 21. 15. Arndts, D. Chest 1983, 83, 3975. 16. Gundert-Remy, U.; Weber, E. Arch. Pharmacol. 1976,293, R47. 17. Guy, R. H.; Hadgraft, J. Pharm. Res. in press.
Acknowledgments We thank NIOSH (OH-018301, Ciba-Geigy, and Vick Internation-
al for financial support. RHG is the recipient of a Special Emphasis Research Career Award (l-K01-OH00017) from the National Insti- tute of Occupational Safety and Health.
RICHARD H. GUY‘* JONATHAN HADGRAFT* *Departments of Pharmac
School of Pharmacy University of California San Francisco, CA 94143 *Department of Pharmacy Unversity of Nottingham University Park Nottingham, NG7 2RD, U.K.
and Pharmaceutical &emistry
Received August 8, 1984. Accepted May 21, 1985.
101 8 / Journal of Pharmaceutical Sciences Vol. 74, No. 9, September 1985