pharma r&d annual review 2018/media/in... · pharma r&d annual review 2018 pharmaprojects...
TRANSCRIPT

Pharma R&D Annual Review 2018
PharmaprojectsPharma intelligence |

2 / February 2018 © Informa UK Ltd 2018 (Unauthorized photocopying prohibited.)
Welcome to Pharmaprojects’ 2018 review of trends in pharmaceutical R&D. For over a quarter of a century now, I’ve been taking an annual look at the evolution of pharma R&D, and in this report, I’ll look at how things are sounding for the industry at the start of 2018. We’ll assess the industry trends by examining the pipeline by company, therapeutic area, disease, target and drug type, using data from Informa Pharma Intelligence’s Pharmaprojects, part of the Citeline suite of products, which has been tracking global drug development since 1980. This report will be followed up by our annual supplement reviewing the New Active Substance launches for the year just gone. But here, we will be focusing on research and development as it is now, how it is changing, fluctuating and being fine-tuned, and where it has been headed during 2017.
As a lifelong music lover and sometime DJ, I’ve chosen a musical theme for this year’s review. Drug development itself can be likened to a symphony, album, mixtape or DJ mix: it’s not enough to just have all the individual parts in place; for a really harmonious journey, each element needs to flow into the next in a way which is coordinated, balanced and mellifluous. The instruments need to be in tune and the constituent parts must be moving at sympathetic rhythms. This report will look at the hits and misses currently flooding the pharma airwaves. Is the industry’s top tune The Edge of Glory, or is it more a case of I Will Survive, or even worse, The End?
Music, like pharma R&D, always evolves over time. I often wonder what the 14-year-old me, surrounded by disco, punk, new wave and Abba in 1978, would have made of the music I listen to now in 2018. Would it have sounded strange and futuristic, or would I have been surprised by how little the fundamentals had changed? And what I wouldn’t give to hop into a time machine and sample the sounds of a further 40 years hence! Just like the pop world, the pharma industry is in a constant state of flux, evolution, and progress, but I suspect in many ways, similarly, the fundamentals haven’t really changed as much as we might imagine. The song remains the same.
However, there’s no doubting that science and technology continue to march to the beat of
progress, and over 40 years, techniques for compound identification, patient screening, and drug delivery have changed beyond recognition. In the music world too, techniques for delivery have rapidly changed; in my lifetime alone, vinyl gave way first to cassette tape, then to CDs, which have themselves been replaced first by digital downloading that is now giving way to streaming. But still in pharma, some classical techniques, like vinyl records, stubbornly refuse to die.
One of the most common criticisms of the current pop charts is how homogenous they have become. There is an argument that streaming, with the ease it provides of skipping to the next track after just a few seconds’ listening, is leading popular artists to avoid anything which sounds jarring or stands out too much from the crowd. This is leading to a narrowing of the musical palette. Some parts of pharma stand accused of succumbing to a similar artistic conservatism, as companies abandon high-risk areas and focus on where they feel more comfortable – witness Pfizer’s recent decision to exit the notoriously failure-prone neuroscience arena. The big stars are increasingly moving MOR (middle-of-the-road), leaving the experimentalism more to outsiders and emerging talents.
All this is taking place to a background of political discord more atonal than an orchestra playing a Schönberg piece in a wind tunnel. The freestyle jazz-like tweets squeaking out from President Trump’s Twitter account have led many to want to stick their fingers in their ears, while his emissions on pharma have sent mixed messages to say the least – the populist impulse to bash the industry often tonally clashing with his business-focused actions, like reducing the corporate income tax rate. Meanwhile, in the UK, everything appears to have been drowned out by the cacophony that is Brexit. Elsewhere in Europe, there are further Wagnerian rumblings as far-right parties continue to make advances in national elections, a trend likely to continue in Italy and Hungary this year. In Europe, where once it seemed all were in harmony, there have been “musical differences” which now threaten to split the band. Against this inharmonious soundtrack, can pharma continue to expand its soundscape and score some genuine global number one megahits?
Ian Lloyd, Senior DirectorPharmaprojects & Data Integration
Introduction
February 2018 / 3© Informa UK Ltd 2018 (Unauthorized photocopying prohibited.)
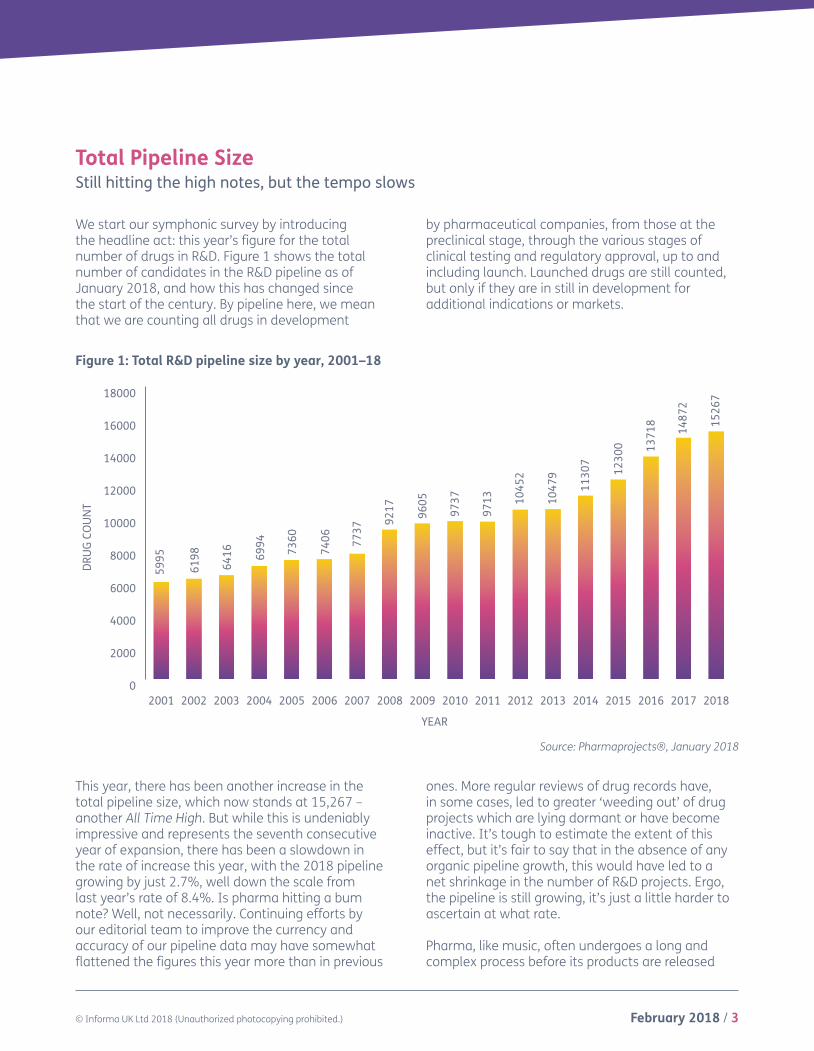
Total Pipeline Size Still hitting the high notes, but the tempo slows
We start our symphonic survey by introducing the headline act: this year’s figure for the total number of drugs in R&D. Figure 1 shows the total number of candidates in the R&D pipeline as of January 2018, and how this has changed since the start of the century. By pipeline here, we mean that we are counting all drugs in development
by pharmaceutical companies, from those at the preclinical stage, through the various stages of clinical testing and regulatory approval, up to and including launch. Launched drugs are still counted, but only if they are in still in development for additional indications or markets.
This year, there has been another increase in the total pipeline size, which now stands at 15,267 – another All Time High. But while this is undeniably impressive and represents the seventh consecutive year of expansion, there has been a slowdown in the rate of increase this year, with the 2018 pipeline growing by just 2.7%, well down the scale from last year’s rate of 8.4%. Is pharma hitting a bum note? Well, not necessarily. Continuing efforts by our editorial team to improve the currency and accuracy of our pipeline data may have somewhat flattened the figures this year more than in previous
ones. More regular reviews of drug records have, in some cases, led to greater ‘weeding out’ of drug projects which are lying dormant or have become inactive. It’s tough to estimate the extent of this effect, but it’s fair to say that in the absence of any organic pipeline growth, this would have led to a net shrinkage in the number of R&D projects. Ergo, the pipeline is still growing, it’s just a little harder to ascertain at what rate.
Pharma, like music, often undergoes a long and complex process before its products are released
Source: Pharmaprojects®, January 2018
Figure 1: Total R&D pipeline size by year, 2001–18
0
2000
4000
6000
8000
10000
12000
14000
16000
18000
201820172016201520142013201220112010200920082007200620052004200320022001
YEAR
DRU
G CO
UN
T
5995
6198
6416 69
94 7360
7406 77
37
9217 96
05
9737 10
452
9713 10
479
1130
7
1230
0 1371
8
1487
2
1526
7

4 / February 2018 © Informa UK Ltd 2018 (Unauthorized photocopying prohibited.)
to consumers. The US rock band Guns N’ Roses famously took 15 years to record their album Chinese Democracy, allegedly spending around $13m in the process (other groups have reportedly taken even longer, but may not have been officially together throughout the period). Drug development can take just as long, can cost up to 1,000 times as much, and can similarly undergo changes of focus, content and production along the way. Finally, after countless remixes, both industries must release their products to their markets and see how many units they can shift. Poor album sales can see an act rapidly dropped from their label’s roster; similarly, disappointing productivity or prescription levels place a pharma company in peril. Lack of success for both industries will lead to trimming of pipelines. Ultimately, for both pharma and for pop, it’s about the dollars, euros and yen.
So, the continuing growth of the pharma pipeline would seem to be intrinsically linked to its output. Early reports on the 2017 pharma new releases indicate that it was a good year. In 2016, the number of new active substance (NAS) launches was lower than the preceding year (41 in 2016 versus 46 in 2015), but early indications are that the 2017 number will exceed that – certainly US new drug approvals, at least, have hit a 21-year high. We are in the process of carefully curating our data to produce the definitive global figure, and will report this and highlight other NAS trends and innovative drugs in our “NAS Supplement” to this report, which will be published in the spring. But so far, the fact that the overall pipeline numbers continue to grow is a positive sign, even if the industry hasn’t exactly turned the volume up to eleven.
The 2018 Pipeline by PhasePlenty of debut singles, but the middle-eight is sounding a bit flat
Breaking the pharma pipeline down its phases – the separate movements of pharma’s symphony – gives a bit more insight into the shape of the pharma industry in 2018. Figure 2 does just this, looking at the global status of each drug in the pipeline so that each is counted only once. There are some interesting variations in pitch across the pharma album this year. The number of drugs at the preclinical stage of development, the figure that one would expect to be most prone to the effects of internal editorial actions, actually shot up by 7.3%, far outpacing the pipeline’s average growth rate to move beyond 8,000 for the first time. This was fuelled by a massive 3,807 new drugs debuting in development, although this figure itself fell slightly short of 2016’s record 4,005. Many of these preclinical projects are coming out of tiny start-ups, the pharmaceutical equivalent of a teenager
uploading their bedroom crooning to YouTube for the first time.
At the other end of the scale, we unearth a big contributor as to why the overall pipeline expansion rate appeared to slow this year. Included in our figures are drugs which are launched, but still under active development for additional markets or additional indications. But once a drug is no longer being rolled out further and its development is essentially complete, we move these drugs over to the Fully-Launched status and they no longer count in our pipeline figures. As Figure 2 shows, despite around 100 drugs being launched in 2017, the number of active launched drugs fell by around 200 – indicating that around 300 launched drugs must have exited the active space in this manner.

February 2018 / 5© Informa UK Ltd 2018 (Unauthorized photocopying prohibited.)
Figure 2: Pipeline by development phase, 2018 versus 2017
Source: Pharmaprojects®, January 2018
However, it is at the clinical development stages, where the data are usually considered the most robust due to integration with our sister product Trialtrove, that the tune begins to hit a minor key. The number of drugs currently at the Phase I stage has increased slightly above the overall rate (up
3.0%), but the figure for Phase II appears to be flat, while there is actually a decline of 1.9% at Phase III (Figure 2). To put this into more context, Figure 3 looks further back down the years to get a better handle on emerging trends over time.
0
1000
2000
3000
4000
5000
6000
7000
8000
9000
SuspendedLaunched RegisteredPre-regPhase IIIPhase IIPhase IPreclin
2017 2018
7493
8040
2064
2127
2357
2360
1025
220
214
116
150
1395
1199
79 52
1006
DRU
G CO
UN
T
6 / February 2018 © Informa UK Ltd 2018 (Unauthorized photocopying prohibited.)
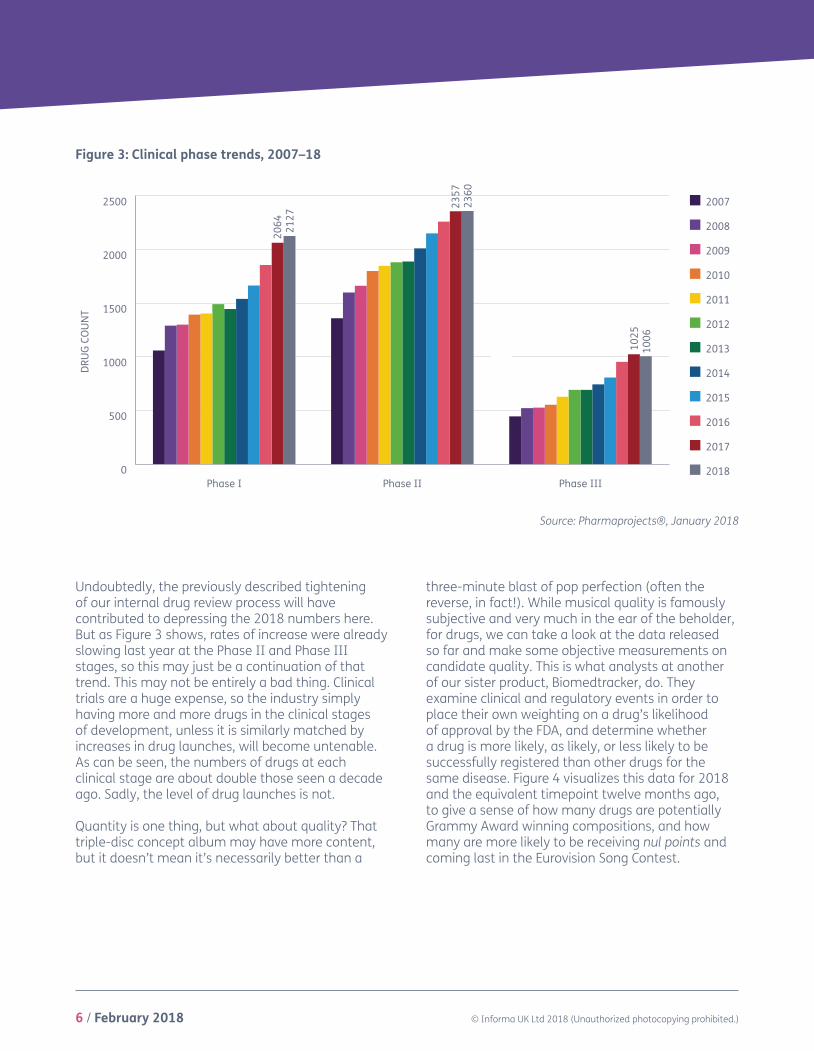
Undoubtedly, the previously described tightening of our internal drug review process will have contributed to depressing the 2018 numbers here. But as Figure 3 shows, rates of increase were already slowing last year at the Phase II and Phase III stages, so this may just be a continuation of that trend. This may not be entirely a bad thing. Clinical trials are a huge expense, so the industry simply having more and more drugs in the clinical stages of development, unless it is similarly matched by increases in drug launches, will become untenable. As can be seen, the numbers of drugs at each clinical stage are about double those seen a decade ago. Sadly, the level of drug launches is not.
Quantity is one thing, but what about quality? That triple-disc concept album may have more content, but it doesn’t mean it’s necessarily better than a
three-minute blast of pop perfection (often the reverse, in fact!). While musical quality is famously subjective and very much in the ear of the beholder, for drugs, we can take a look at the data released so far and make some objective measurements on candidate quality. This is what analysts at another of our sister product, Biomedtracker, do. They examine clinical and regulatory events in order to place their own weighting on a drug’s likelihood of approval by the FDA, and determine whether a drug is more likely, as likely, or less likely to be successfully registered than other drugs for the same disease. Figure 4 visualizes this data for 2018 and the equivalent timepoint twelve months ago, to give a sense of how many drugs are potentially Grammy Award winning compositions, and how many are more likely to be receiving nul points and coming last in the Eurovision Song Contest.
Figure 3: Clinical phase trends, 2007–18
Source: Pharmaprojects®, January 2018
2018
2017
2016
2015
2014
2013
2012
2011
2010
2009
2008
2007
DRU
G CO
UN
T
0
500
1000
1500
2000
2500
Phase IIIPhase IIPhase I
2064 21
27
2357
2360
1025
1006
February 2018 / 7© Informa UK Ltd 2018 (Unauthorized photocopying prohibited.)
0% 10% 20% 30% 40% 50% 60% 70% 80% 90% 100%
2017 All
2018 All
2017 Pre-registration
2018 Pre-registration
2017 Phase III
2018 Phase III
2017 Phase II
2018 Phase II
16.6%
16.6%
52.5% 33.5% 13.9%
73.9%
73.9%
9.5%
9.5%
% ABOVE % AVERAGE % BELOW
49.3% 42.7% 8.0%
10.9% 82.8% 6.3%
10.4% 83.1% 6.5%
24.2% 59.6% 16.3%
25.3% 58.2% 16.5%
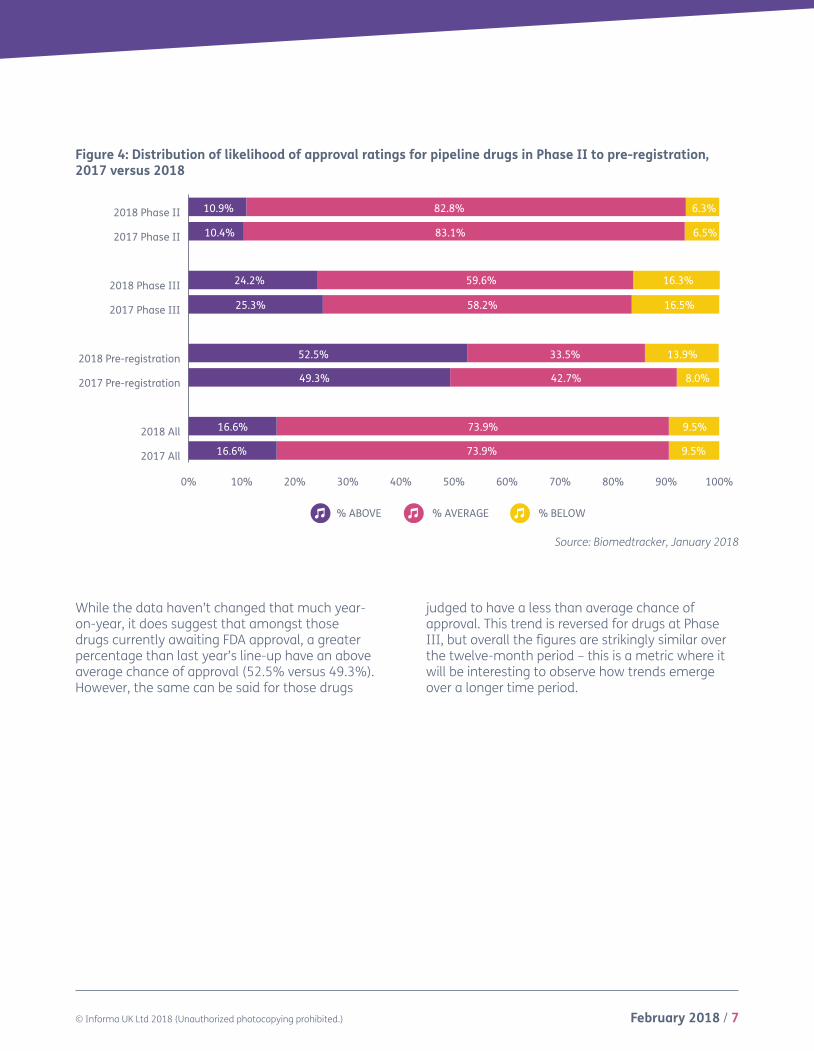
While the data haven’t changed that much year-on-year, it does suggest that amongst those drugs currently awaiting FDA approval, a greater percentage than last year’s line-up have an above average chance of approval (52.5% versus 49.3%). However, the same can be said for those drugs
judged to have a less than average chance of approval. This trend is reversed for drugs at Phase III, but overall the figures are strikingly similar over the twelve-month period – this is a metric where it will be interesting to observe how trends emerge over a longer time period.
Source: Biomedtracker, January 2018
Figure 4: Distribution of likelihood of approval ratings for pipeline drugs in Phase II to pre-registration, 2017 versus 2018
8 / February 2018 © Informa UK Ltd 2018 (Unauthorized photocopying prohibited.)
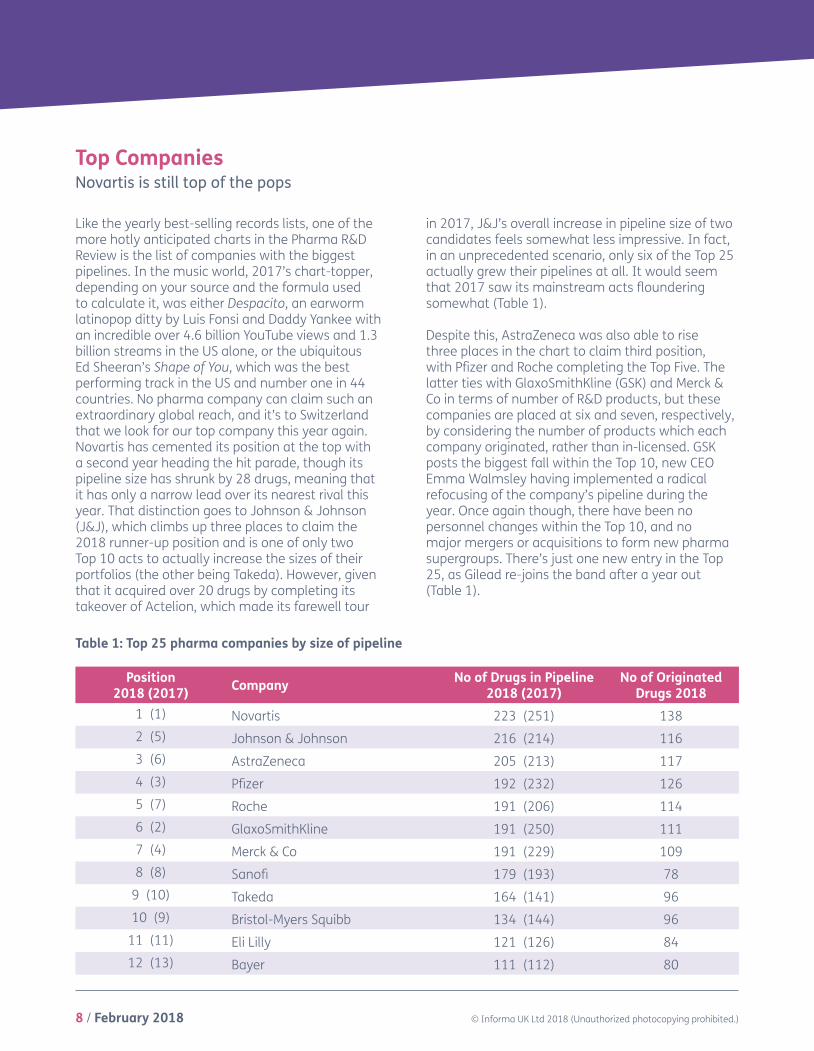
Top CompaniesNovartis is still top of the pops
Like the yearly best-selling records lists, one of the more hotly anticipated charts in the Pharma R&D Review is the list of companies with the biggest pipelines. In the music world, 2017’s chart-topper, depending on your source and the formula used to calculate it, was either Despacito, an earworm latinopop ditty by Luis Fonsi and Daddy Yankee with an incredible over 4.6 billion YouTube views and 1.3 billion streams in the US alone, or the ubiquitous Ed Sheeran’s Shape of You, which was the best performing track in the US and number one in 44 countries. No pharma company can claim such an extraordinary global reach, and it’s to Switzerland that we look for our top company this year again. Novartis has cemented its position at the top with a second year heading the hit parade, though its pipeline size has shrunk by 28 drugs, meaning that it has only a narrow lead over its nearest rival this year. That distinction goes to Johnson & Johnson (J&J), which climbs up three places to claim the 2018 runner-up position and is one of only two Top 10 acts to actually increase the sizes of their portfolios (the other being Takeda). However, given that it acquired over 20 drugs by completing its takeover of Actelion, which made its farewell tour
in 2017, J&J’s overall increase in pipeline size of two candidates feels somewhat less impressive. In fact, in an unprecedented scenario, only six of the Top 25 actually grew their pipelines at all. It would seem that 2017 saw its mainstream acts floundering somewhat (Table 1).
Despite this, AstraZeneca was also able to rise three places in the chart to claim third position, with Pfizer and Roche completing the Top Five. The latter ties with GlaxoSmithKline (GSK) and Merck & Co in terms of number of R&D products, but these companies are placed at six and seven, respectively, by considering the number of products which each company originated, rather than in-licensed. GSK posts the biggest fall within the Top 10, new CEO Emma Walmsley having implemented a radical refocusing of the company’s pipeline during the year. Once again though, there have been no personnel changes within the Top 10, and no major mergers or acquisitions to form new pharma supergroups. There’s just one new entry in the Top 25, as Gilead re-joins the band after a year out (Table 1).
Table 1: Top 25 pharma companies by size of pipeline
Position 2018 (2017) Company No of Drugs in Pipeline
2018 (2017)No of Originated
Drugs 20181 (1) Novartis 223 (251) 1382 (5) Johnson & Johnson 216 (214) 1163 (6) AstraZeneca 205 (213) 1174 (3) Pfizer 192 (232) 1265 (7) Roche 191 (206) 1146 (2) GlaxoSmithKline 191 (250) 1117 (4) Merck & Co 191 (229) 1098 (8) Sanofi 179 (193) 78
9 (10) Takeda 164 (141) 9610 (9) Bristol-Myers Squibb 134 (144) 96
11 (11) Eli Lilly 121 (126) 8412 (13) Bayer 111 (112) 80
February 2018 / 9© Informa UK Ltd 2018 (Unauthorized photocopying prohibited.)
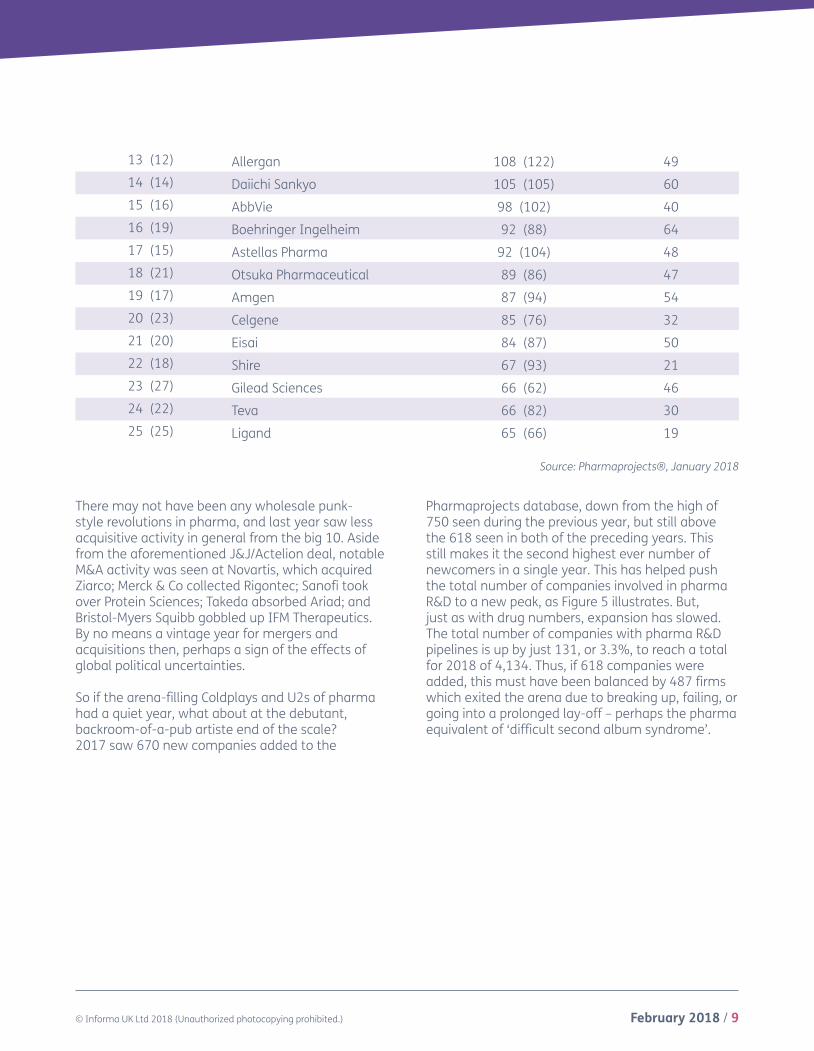
There may not have been any wholesale punk-style revolutions in pharma, and last year saw less acquisitive activity in general from the big 10. Aside from the aforementioned J&J/Actelion deal, notable M&A activity was seen at Novartis, which acquired Ziarco; Merck & Co collected Rigontec; Sanofi took over Protein Sciences; Takeda absorbed Ariad; and Bristol-Myers Squibb gobbled up IFM Therapeutics. By no means a vintage year for mergers and acquisitions then, perhaps a sign of the effects of global political uncertainties.
So if the arena-filling Coldplays and U2s of pharma had a quiet year, what about at the debutant, backroom-of-a-pub artiste end of the scale? 2017 saw 670 new companies added to the
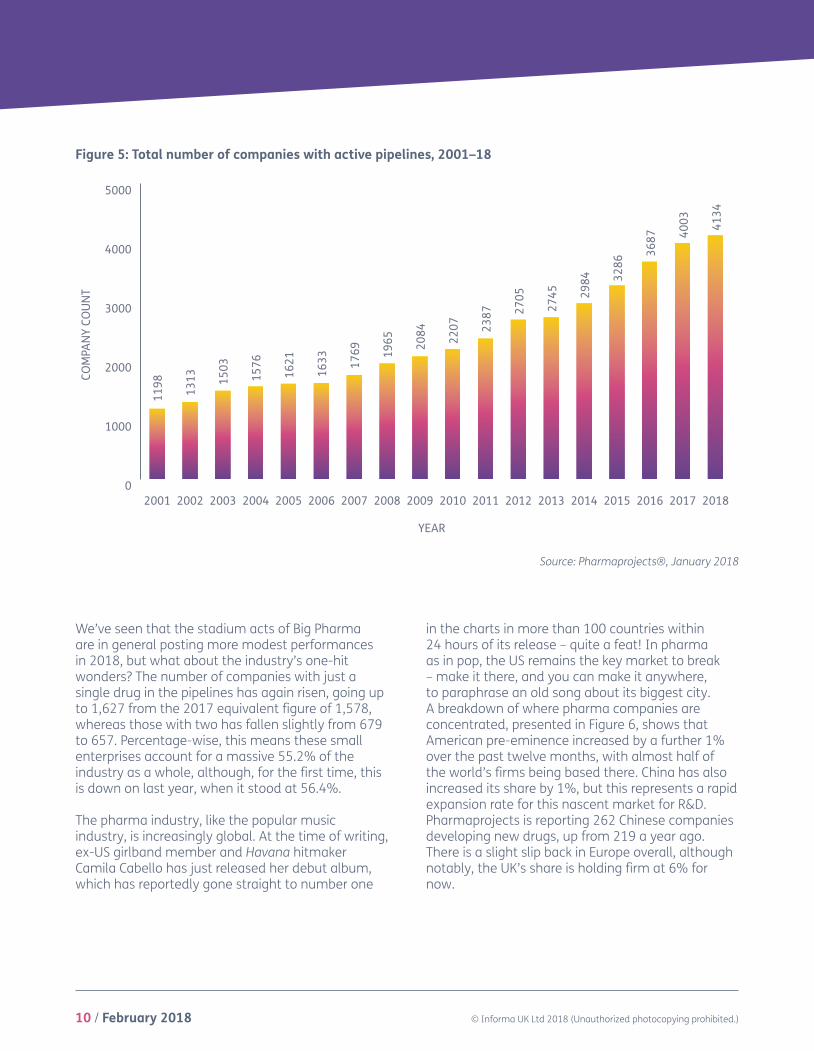
Pharmaprojects database, down from the high of 750 seen during the previous year, but still above the 618 seen in both of the preceding years. This still makes it the second highest ever number of newcomers in a single year. This has helped push the total number of companies involved in pharma R&D to a new peak, as Figure 5 illustrates. But, just as with drug numbers, expansion has slowed. The total number of companies with pharma R&D pipelines is up by just 131, or 3.3%, to reach a total for 2018 of 4,134. Thus, if 618 companies were added, this must have been balanced by 487 firms which exited the arena due to breaking up, failing, or going into a prolonged lay-off – perhaps the pharma equivalent of ‘difficult second album syndrome’.
Source: Pharmaprojects®, January 2018
13 (12) Allergan 108 (122) 4914 (14) Daiichi Sankyo 105 (105) 6015 (16) AbbVie 98 (102) 4016 (19) Boehringer Ingelheim 92 (88) 6417 (15) Astellas Pharma 92 (104) 4818 (21) Otsuka Pharmaceutical 89 (86) 4719 (17) Amgen 87 (94) 5420 (23) Celgene 85 (76) 3221 (20) Eisai 84 (87) 5022 (18) Shire 67 (93) 2123 (27) Gilead Sciences 66 (62) 4624 (22) Teva 66 (82) 3025 (25) Ligand 65 (66) 19
10 / February 2018 © Informa UK Ltd 2018 (Unauthorized photocopying prohibited.)
COM
PAN
Y CO
UN
T
0
1000
2000
3000
4000
5000
201820172016201520142013201220112010200920082007200620052004200320022001
YEAR
1198 1313 15
03
1576
1621
1633 17
69 1965 20
84 2207
2705
2387 27
45 2984 32
86
3687 40
03 4134
Figure 5: Total number of companies with active pipelines, 2001–18
Source: Pharmaprojects®, January 2018
We’ve seen that the stadium acts of Big Pharma are in general posting more modest performances in 2018, but what about the industry’s one-hit wonders? The number of companies with just a single drug in the pipelines has again risen, going up to 1,627 from the 2017 equivalent figure of 1,578, whereas those with two has fallen slightly from 679 to 657. Percentage-wise, this means these small enterprises account for a massive 55.2% of the industry as a whole, although, for the first time, this is down on last year, when it stood at 56.4%.
The pharma industry, like the popular music industry, is increasingly global. At the time of writing, ex-US girlband member and Havana hitmaker Camila Cabello has just released her debut album, which has reportedly gone straight to number one
in the charts in more than 100 countries within 24 hours of its release – quite a feat! In pharma as in pop, the US remains the key market to break – make it there, and you can make it anywhere, to paraphrase an old song about its biggest city. A breakdown of where pharma companies are concentrated, presented in Figure 6, shows that American pre-eminence increased by a further 1% over the past twelve months, with almost half of the world’s firms being based there. China has also increased its share by 1%, but this represents a rapid expansion rate for this nascent market for R&D. Pharmaprojects is reporting 262 Chinese companies developing new drugs, up from 219 a year ago. There is a slight slip back in Europe overall, although notably, the UK’s share is holding firm at 6% for now.

February 2018 / 11© Informa UK Ltd 2018 (Unauthorized photocopying prohibited.)
Figure 6: Distribution of R&D companies by HQ country/region, 2017 and 2018
Source: Pharmaprojects®, January 2018
C And S America/Africa
France
Germany
Japan
Canada
UK
China
Rest Of Asia Pacific
Rest Of Europe
USA
48%
15%
11%
6%
6%
4%
3%3% 3%
1%
2018
C And S America/Africa
France
Germany
Japan
Canada
UK
China
Rest Of Asia Pacific
Rest Of Europe
USA
2017
47%
16%
11%
5%
5%
3%3% 3%
1%
6%
C And S America/Africa
France
Germany
Japan
Canada
UK
China
Rest Of Asia Pacific
Rest Of Europe
USA
48%
15%
11%
6%
6%
4%
3%3% 3%
1%
2018
C And S America/Africa
France
Germany
Japan
Canada
UK
China
Rest Of Asia Pacific
Rest Of Europe
USA
2017
47%
16%
11%
5%
5%
3%3% 3%
1%
6%
12 / February 2018 © Informa UK Ltd 2018 (Unauthorized photocopying prohibited.)
0
1000
2000
3000
4000
5000
6000
Antiparasitic
Hormonal
Blood & Clotting
Genitourinary
Sensory
Respiratory
Cardiovascular
Immunological
Dermatological
Musculoskeletal
Reformulations
Alimentary/Metabolic
Anti-Infective
Neurological
Biotechnology
Anticancer
2017 2018
DRU
G CO
UN
T
4845 52
12
4481 47
51
2542
2604
2468
2238
2237
2132
2073
1574
911
929
917
916
962
893
845
859
797
828
630
643
652
630
275
271
128
124
1597
2149
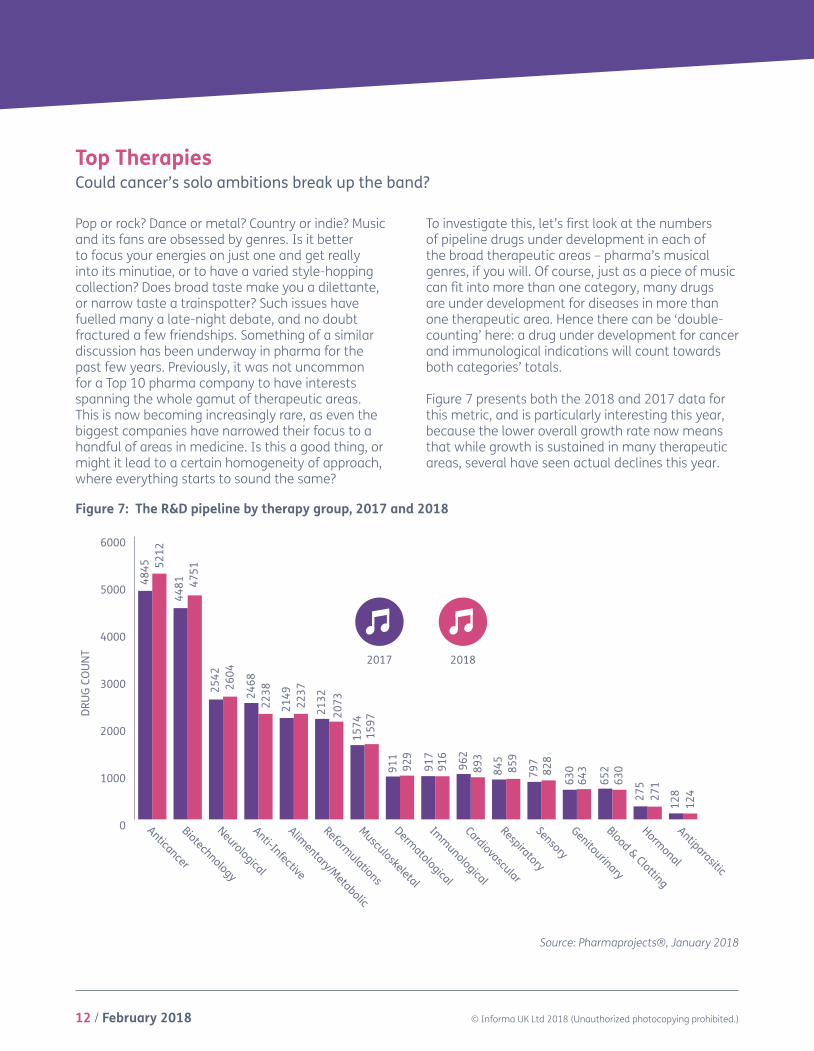
Pop or rock? Dance or metal? Country or indie? Music and its fans are obsessed by genres. Is it better to focus your energies on just one and get really into its minutiae, or to have a varied style-hopping collection? Does broad taste make you a dilettante, or narrow taste a trainspotter? Such issues have fuelled many a late-night debate, and no doubt fractured a few friendships. Something of a similar discussion has been underway in pharma for the past few years. Previously, it was not uncommon for a Top 10 pharma company to have interests spanning the whole gamut of therapeutic areas. This is now becoming increasingly rare, as even the biggest companies have narrowed their focus to a handful of areas in medicine. Is this a good thing, or might it lead to a certain homogeneity of approach, where everything starts to sound the same?
To investigate this, let’s first look at the numbers of pipeline drugs under development in each of the broad therapeutic areas – pharma’s musical genres, if you will. Of course, just as a piece of music can fit into more than one category, many drugs are under development for diseases in more than one therapeutic area. Hence there can be ‘double-counting’ here: a drug under development for cancer and immunological indications will count towards both categories’ totals.
Figure 7 presents both the 2018 and 2017 data for this metric, and is particularly interesting this year, because the lower overall growth rate now means that while growth is sustained in many therapeutic areas, several have seen actual declines this year.
Top TherapiesCould cancer’s solo ambitions break up the band?
Source: Pharmaprojects®, January 2018
Figure 7: The R&D pipeline by therapy group, 2017 and 2018

February 2018 / 13© Informa UK Ltd 2018 (Unauthorized photocopying prohibited.)
20
22
24
26
28
30
32
34
36
201820172016201520142013201220112010
34.1
32.6
30.4
29.329.330.129.5
28.0
26.8
% o
f pip
elin
e w
hich
is O
ncol
ogy
YEAR
Still chart-topping, cancer posts a 7.6% increase in the number of candidates this year, a growth rate which is close to three times that of the overall pipeline. It’s instructive to put this into the wider context of how its share is increasing year-on-year. In Figure 8, you can see that now, over a third of all drugs in development have at least one oncology indication attached to them, whereas it was just over a quarter at the decade’s start. That is a fairly
extraordinary statistic, and is akin to when the lead singer of a band starts to garner all the attention, usually producing general disgruntlement among the other members (US group Blondie famously started a ‘Blondie is a band’ campaign in the late 70s, after lead singer Debbie Harry started getting a disproportionate amount of the press coverage). So, if cancer is hogging the limelight, what is at the expense of?
Figure 8: Proportion of the pipeline which is focused against cancer, 2010–18
Well, the biggest decline is seen in anti-infectives, which with 2,238 candidates reports a 9.3% shrinkage in its pipeline, at a time when, arguably, there has never been a greater need for new drugs in this area. This almost entirely reverses the big increase of 11.1% seen in this group of drugs in 2017. The other therapeutic area to majorly lose out was cardiovascular, down 7.2%, while immunological and blood & clotting also posted
declines. For those worried that cancer’s power within the band is becoming disproportionate, there was some comfort in that second-placed neurologicals also grew, at around the average rate of 2.4%. This is despite underperforming last year and no sign yet of the breakthroughs needed in Alzheimer’s and other tough-to-crack CNS diseases (Figure 7).

14 / February 2018 © Informa UK Ltd 2018 (Unauthorized photocopying prohibited.)
Source: Pharmaprojects®, January 2018
Table 2: Top 25 therapeutic categories
Position 2018 (2017) Therapy No of R&D products
2018 (2017) Trend
1 (1) Anticancer, other 2,374 (2,231) ↑2 (2) Anticancer, immunological 2,345 (2,001) ↑3 (3) Prophylactic vaccine, anti-infective 711 (848) ↓4 (6) Monoclonal antibody, other 658 (589) ↑5 (5) Ophthalmological, other 637 (615) ↑6 (7) Gene therapy 633 (547) ↑7 (4) Antidiabetic 605 (624) ↓8 (8) Anti-inflammatory 487 (513) ↓
9 (14) Neurological 479 (426) ↑10 (10) Immunosuppressant 476 (478) ←→11 (9) Antiviral, other 459 (488) ↓
12 (16) Musculoskeletal 444 (417) ↑13 (13) Cognition enhancer 435 (430) ←→14 (15) GI inflammatory/bowel disorders 435 (422) ↓15 (11) Reformulation, fixed-dose combinations 434 (457) ↓16 (18) Monoclonal antibody, human 425 (414) ↑17 (22) Monoclonal antibody, humanized 418 (377) ↑18 (12) Recombinant vaccine 410 (437) ↓19 (17) Biosimilar 408 (417) ←→20 (19) Analgesic, other 407 (409) ←→21 (21) Reformulation, other 395 (400) ←→22 (20) Cardiovascular 379 (408) ↓23 (23) Recombinant, other 364 (358) ←→24 (25) Antiparkinsonian 327 (318) ←→25 (24) Anticancer, vaccine 323 (332) ←→
Just as all musical genres have subgenres, each of the therapeutic areas has within it several therapeutic categories, which we use to classify drugs at a more specific level. There are 234 of these, and Table 2 shows the Top 25. As has been the case for a number of years, two cancer
categories take the leading two positions, both posting increases year-on-year. Anti-infective prophylactic vaccines complete the top three, although it is here that it would appear a lot of decline for anti-infectives in general seems to have taken place.

February 2018 / 15© Informa UK Ltd 2018 (Unauthorized photocopying prohibited.)
Elsewhere in the table, the continued rise of monoclonal antibodies is evidenced, with three categories gracing the Top 25 and each moving up. The past year also saw Pharmaprojects create new therapeutic categories to specifically capture the emerging fields of bispecific and trispecific monoclonals, with there being almost 200 of the former in active development already. Also climbing is the gene therapy category, which now seems to have had more comebacks than Cher. After initial excitement and a proliferation of projects in the nineties, setbacks including deaths in clinical trials sent the approach into retreat, but it bounced back and saw its first EU approval with Glybera (alipogene tiparvovec; uniQure) in 2015. However, this product came up against a different problem – price. At over $1m per treatment, the therapy for hyper-rare lipoprotein lipase deficiency was only ever used once before lack of demand led to its shelving. But 2017 saw another victory, with the US FDA’s approval of its first gene therapy in December, Spark Therapeutics’ Luxturna (voretigene neparvovec) for an inherited form of blindness, being heralded by industry as a landmark moment. Additionally, progress on cracking the funding issue seems to have been made, with the UK’s NICE finding a way to pay for GlaxoSmithKline’s ‘bubble baby’ gene therapy product, Strimvelis. All this helped to push the category as high as number six in our chart.
But it’s by zooming in even further, to the disease level, where our charts get really interesting. By now, you’ll have noticed that this report, much like the music industry, is obsessed with charts. In the US, Billboard published its first ‘hit parade’ as early as 1936, but it was in the fifties that the obsession with weekly charts really took off internationally. For over 50 years, generations have pored over the weekly singles sales charts in particular, seeing them as the best way to independently judge the relative popularity of the day’s tuneage. But as physical sales began to decline from the mid-noughties,
things began to change. To adapt to music-buyers’ changing methods of consumption, chart compilers had to abandon the traditional sales-based method of assessing popularity, by coming up with a complicated formula to include contributions from physical sales, digital downloads, airplay, and plays via streaming services. For many, the golden age of the pop charts had gone with these changes, along with, to an extent, the concept of the single. TV chart-based shows, such as the BBC’s long-running weekly music programme Top of the Pops (1964–2006), also began disappearing from the airwaves.
This change reached its apotheosis in February 2017 with the by now infamous ‘Ed Sheeran moment’. When the world-beating British singer-songwriter released his new album Divide, it was so popular that tracks from it took nine out of the top 10 places in the UK ‘singles’ chart. Cue a lot of wailing and gnashing of teeth, newspaper op-eds calling it ‘the day the music died’, and a further charts rule change. The idea of a single artist dominating the charts seemed so utterly anathema to those raised on the purity of twentieth century countdowns.
I mention this because this year’s chart of the Top 25 diseases seems to be having something of an ‘Ed Sheeran moment’ itself. Table 3 lists the 25 diseases which have the most drugs in development, out of a total of over 1,400 diseases included in our classification. The previously noted ongoing growth of oncology-focused R&D has this year led to cancer indications accounting for 13 of the top 20 places, seven of the top 10, and for the first time, all of the top five. Never has the syndrome showed such Sheeranesque chart domination. Ovarian cancer (up 12.4%), brain cancer (12.1%), and acute myelogenous leukaemia (14.4%) have all made significant advances, but the top two of breast and non-small cell lung cancer both demonstrated double-digit percentage increases themselves (up 11.2% and 14.0%, respectively). Significantly, all of the cancer indications in the Top 25 grew their pipelines.

16 / February 2018 © Informa UK Ltd 2018 (Unauthorized photocopying prohibited.)
Such chart dominance can only mean that others are missing out. Falling down the chart this year are three diseases all with an autoimmune/inflammation component: rheumatoid arthritis, psoriasis, and asthma. Elsewhere in the top 10, both type 2 diabetes and Alzheimer’s disease stuttered. But some pharma trends, like those in pop, are
cyclical, and nothing ever really goes away – just ask any of the current crop of eighties revivalist bands. The question is whether or not the overwhelming dominance of cancer will ultimately prove to have a beneficial or a stifling effect on developments in other areas.
Table 3: Top 25 diseases/indications
Source: Pharmaprojects®, January 2018
Position 2018 (2107) Disease* No. of active drugs
2018 (2107) Trend
1 (1) Cancer, breast 727 (654) ↑2 (2) Cancer, lung, non-small cell 544 (477) ↑3 (3) Cancer, colorectal 503 (476) ↑4 (6) Cancer, ovarian 434 (386) ↑5 (4) Cancer, pancreatic 430 (416) ↑6 (5) Diabetes, Type 2 407 (415) ←→7 (9) Cancer, prostate 381 (362) ↑8 (7) Alzheimer’s disease 381 (376) ←→
9 (10) Cancer, brain 361 (322) ↑ 10 (8) Arthritis, rheumatoid 352 (372) ↓
11 (11) Cancer, melanoma 346 (312) ↑12 (12) Cancer, leukaemia, acute myelogenous 326 (285) ↑13 (15) Cancer, liver 272 (264) ←→14 (14) Pain, nociceptive, general 262 (268) ←→15 (19) Cancer, head and neck 258 (227) ↑16 (13) Psoriasis 256 (283) ↓17 (17) Cancer, myeloma 254 (246) ←→18 (18) Parkinson’s disease 252 (246) ←→19 (21) Cancer, gastrointestinal, stomach 242 (213) ↑20 (16) Asthma 224 (254) ↓21 (22) Cancer, renal 218 (197) ↑22 (20) Cancer, lymphoma, non-Hodgkin’s 215 (217) ←→23 (23) Chronic obstructive pulmonary disease 179 (192) ←→24 (25) Pain, neuropathic, general 178 (169) ←→25 (24) Infection, HIV/AIDS 177 (183) ←→
*Excludes the more generalized indications which include the term ‘unspecified’ to focus in solely on counting drugs where precise target diseases have been identified.

February 2018 / 17© Informa UK Ltd 2018 (Unauthorized photocopying prohibited.)
Types of Pipeline DrugsNew technologies call the tune
Having thoroughly dissected the pipeline by therapeutic focus, we now switch to examining the kinds of drugs in development and how they are produced. Here the battleground of traditional synthetic chemistry versus biotechnology resembles the ongoing revolution in music production of real instruments being replaced by computer-generated sounds. For those of you who are still getting over the shock of Bob Dylan ‘going electric’, let me bring you up to speed. From the early adopters of synthesized sounds in the seventies like Kraftwerk onwards, technology and computing power have
advanced rapidly to the point where a teenager in their bedroom can produce on their laptop a piece of music which sounds like the performance of an orchestra or an eight-piece band in a couple of hours. Virtually no music production is untouched by technology these days, yet real instruments do still have a vital part to play. This mirrors how biotechnological methods have marched through pharma, but have left traditional medicinal chemistry very much still at the heart of drug R&D. Table 4 shows how these changes are reflected via Pharmaprojects’ Origin of Material field.
Table 4: Top 25 origins of pipeline drugs
Position 2018 (2107) Origin No. of active drugs
2018 (2107) Trend
1 (1) Chemical, synthetic 7,992 (7,855) ↑2 (2) Biological, protein, antibody 1,809 (1,687) ↑3 (3) Biological, protein, recombinant 826 (861) ↓4 (4) Biological, protein 508 (545) ↓5 (5) Chemical, synthetic, peptide 438 (468) ↓6 (7) Biological, cellular 418 (352) ↑7 (8) Biological, nucleic acid, viral vector 351 (329) ↑8 (6) Biological, virus particles 350 (367) ←→9 (9) Chemical, synthetic, nucleic acid 338 (323) ←→
10 (10) Biological, cellular, autologous 304 (251) ↑11 (12) Natural product, plant 248 (198) ↑12 (11) Biological, peptide 231 (226) ←→13 (13) Biological 187 (181) ←→14 (15) Biological, nucleic acid 151 (130) ↑15 (16) Biological, cellular, heterologous 147 (129) ↑16 (17) Biological, peptide, recombinant 133 (124) ←→17 (14) Biological, bacterial cells 129 (135) ←→
18 / February 2018 © Informa UK Ltd 2018 (Unauthorized photocopying prohibited.)
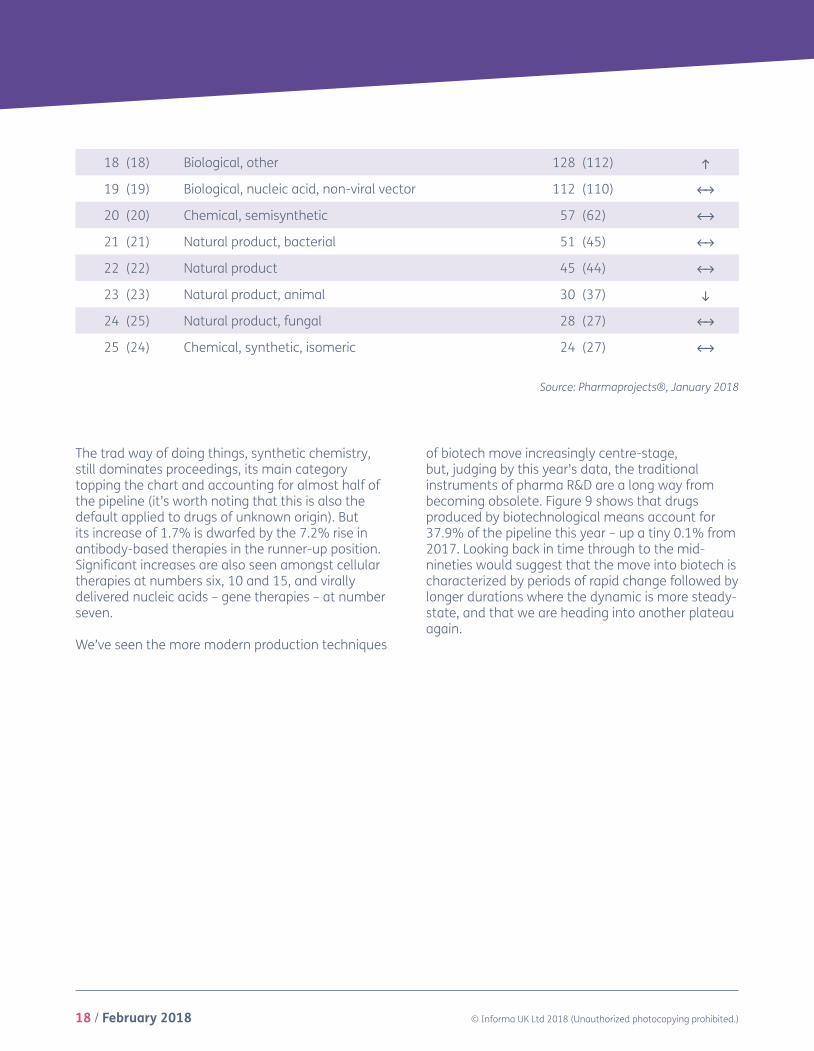
The trad way of doing things, synthetic chemistry, still dominates proceedings, its main category topping the chart and accounting for almost half of the pipeline (it’s worth noting that this is also the default applied to drugs of unknown origin). But its increase of 1.7% is dwarfed by the 7.2% rise in antibody-based therapies in the runner-up position. Significant increases are also seen amongst cellular therapies at numbers six, 10 and 15, and virally delivered nucleic acids – gene therapies – at number seven.
We’ve seen the more modern production techniques
of biotech move increasingly centre-stage, but, judging by this year’s data, the traditional instruments of pharma R&D are a long way from becoming obsolete. Figure 9 shows that drugs produced by biotechnological means account for 37.9% of the pipeline this year – up a tiny 0.1% from 2017. Looking back in time through to the mid-nineties would suggest that the move into biotech is characterized by periods of rapid change followed by longer durations where the dynamic is more steady-state, and that we are heading into another plateau again.
18 (18) Biological, other 128 (112) ↑19 (19) Biological, nucleic acid, non-viral vector 112 (110) ←→20 (20) Chemical, semisynthetic 57 (62) ←→21 (21) Natural product, bacterial 51 (45) ←→22 (22) Natural product 45 (44) ←→23 (23) Natural product, animal 30 (37) ↓24 (25) Natural product, fungal 28 (27) ←→25 (24) Chemical, synthetic, isomeric 24 (27) ←→
Source: Pharmaprojects®, January 2018

February 2018 / 19© Informa UK Ltd 2018 (Unauthorized photocopying prohibited.)
Figure 9: Biological versus non-biological drugs as a percentage of the pipeline, 1995–2018
Source: Pharmaprojects®, January 2018
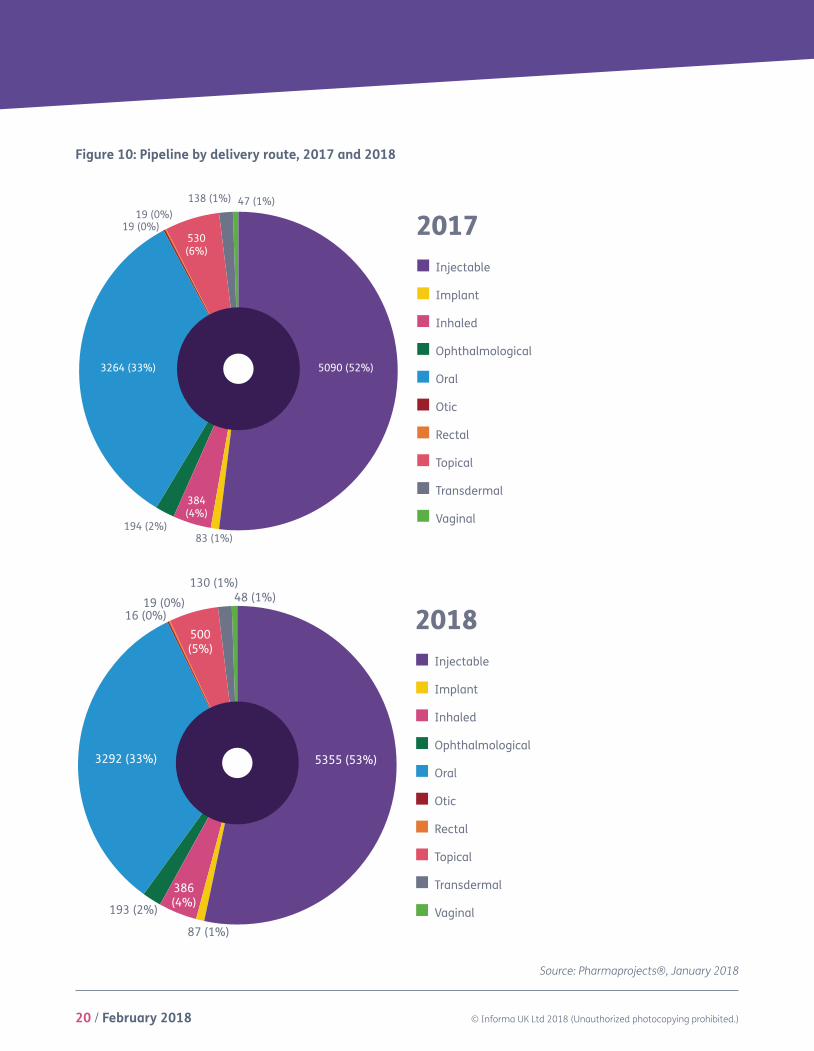
With little change in the small molecules/biologicals split this year, there’s not much shift in the breakdown of the pipeline by drug route of administration, illustrated in Figure 10. The
percentage of drugs delivered by injection has gained a further 1% to move it up to 53%, with implants losing 1% in return. The complexion of the mix is otherwise unchanged from 2017 to 2018.
0%
10%
20%
30%
40%
50%
60%
70%
80%
90%
100%
201820172016201520142013201220112010200920082007200620052004200320022001200019991998199719961995
Non-Biotech Biotech
YEAR
20 / February 2018 © Informa UK Ltd 2018 (Unauthorized photocopying prohibited.)
Figure 10: Pipeline by delivery route, 2017 and 2018
Source: Pharmaprojects®, January 2018
2017Injectable
Implant
Inhaled
Ophthalmological
Oral
Otic
Rectal
Topical
Transdermal
Vaginal
2018Injectable
Implant
Inhaled
Ophthalmological
Oral
Otic
Rectal
Topical
Transdermal
Vaginal
5090 (52%)
83 (1%)
384(4%)
194 (2%)
3264 (33%)
19 (0%)530(6%)
138 (1%) 47 (1%)
5355 (53%)
87 (1%)
386(4%)193 (2%)
3292 (33%)
16 (0%)19 (0%)
500(5%)
130 (1%)48 (1%)
19 (0%)

February 2018 / 21© Informa UK Ltd 2018 (Unauthorized photocopying prohibited.)
Mechanisms and TargetsRemixes and some brand new sounds
Next we move to how drugs work. This, perhaps more than any other area, reveals the current industry hot topics. Pharma, like the music industry, is somewhat prone to fads and fashions. In the latter, the pop/dance interface exhibits particularly sheep-like tendencies, with the current ‘sound’ dominating the charts being so-called ‘tropical house’. Developed by artists such as Norwegian producer Kygo around three years ago, this form of house music is characterized by a slower tempo, and a sunny feel, often including steel drum, marimba or pan pipe-like sounds. Over the next couple of years, the sound went massively mainstream with everybody copying its tropes, with ‘rock’ bands like Maroon Five and The Script suddenly producing records incorporating the sound. Former teen poppet Justin Bieber’s 2015 megahits What Do You Mean? and Sorry also utilized it, and it reached saturation point in 2017 in the aforementioned Ed Sheeran’s Shape of You. By the end of 2017, the signs were that the related sounds of reggaetón and latinopop where muscling in on the action. Of course, those of us a little longer in the tooth have seen many such crazes come and go – who can forget the late seventies, when everyone, even The Beach Boys(!), briefly, ‘went disco’.
Exhibiting similar levels of ubiquity to tropical house in the pharma R&D world currently is immuno-oncology (IO). Its growth continues to be operatic in scale. Only created in Pharmaprojects three years ago, this collective term is applied to a group of related strategies which aim to activate the body’s own immune system components to attack cancer cells, rather than directly attacking tumours as with traditional chemotherapy. From 2016 through to
2017, there was a colossal 123% increase in drugs of this type. This year, while the percentage increase is lower at 50%, the actual number of candidates added is pretty similar (up by 443 to a total of 1,332, whereas it rose by 490 the previous year). So there is no sign of the immuno-oncology bubble bursting yet – despite the fact that it remains relatively unproven. As Table 5 shows, a mere 1.6% of IO drugs (denoted here as “anticancer immunotherapy”) have made it through the clinical stages of development as yet.
The mechanism of action (MOA) classification used in Pharmaprojects is both hierarchical, and also includes useful ‘catch-all’ terms like the anticancer immunotherapy category applied to IO drugs. This, added to the fact that a drug’s precise mode of action may not be disclosed or identified during the earliest stages of development, means that the higher level, broader categories are naturally favoured in the chart, often only later replaced with more precise MOAs. Thus the top five also includes some broad categories, such as immunostimulant, immunosuppressant, and angiogenesis inhibitor. These old familiar tunes are joined this year by a new entry in the top three, immune checkpoint inhibitor. This is another part of the immuno-oncology story. This category was created to cover all drugs using this strategy, the immune checkpoints themselves including molecules such as CD27, CD28, CD40, CD137, and OX40, among others. Inhibitors can play roles in treating inflammatory conditions, as well as boosting antitumour responses. A related category for immune checkpoint stimulants makes its debut at number 22.

22 / February 2018 © Informa UK Ltd 2018 (Unauthorized photocopying prohibited.)
Source: Pharmaprojects®, January 2018
Abbreviations used in table: PR = pre-registration; R = registered; L = launched
Table 5: Top 25 mechanisms of action (pharmacologies)
Position 2018 (2017) Mechanism of action (pharmacology)
No. of active compounds 2018
(2017)
% of compounds
PR/R/L1 (1) Immunostimulant 1,501 (1,736) 10.0
2 (2) Anticancer immunotherapy 1,332 (889) 1.6
3 (-) Immune checkpoint inhibitor 211 (-) 3.3
4 (3) Immunosuppressant 208 (215) 26.4
5 (4) Angiogenesis inhibitor 169 (179) 17.8
6 (5) Vascular endothelial growth factor (VEGF) receptor antagonist 138 (123) 14.5
7 (7) Apoptosis stimulant 116 (115) 14.7
8 (6) DNA inhibitor 111 (120) 20.7
9 (9) Opioid mu receptor agonist 110 (114) 40.9
10 (-) Radiopharmaceutical 108 (-) 10.2
11 (12) T cell stimulant 106 (87) 4.7
12 (8) Tumour necrosis factor alpha antagonist 102 (114) 28.4
13 (10) Cyclooxygenase 2 inhibitor 93 (102) 34.4
14 (11) Glucocorticoid agonist 88 (95) 39.8
15 (17) ErbB-2 antagonist 82 (71) 14.6
16 (13) Glucagon-like peptide 1 agonist 82 (84) 13.4
17 (15) Gene expression inhibitor 78 (74) 0
18 (18) Cell wall synthesis inhibitor 70 (69) 30.0
19 (19) DNA topoisomerase II inhibitor 67 (67) 28.4
20 (41) Microbiome modulator 66 (49) 0
21 (20) Insulin secretagogue 64 (67) 53.1
22 (-) Immune checkpoint stimulant 63 (-) 0
23 (22) Histone deacetylase inhibitor 62 (59) 8.1
24 (34) Microtubule stimulant 62 (54) 14.5
25 (26) Taxane 61 (57) 14.8

February 2018 / 23© Informa UK Ltd 2018 (Unauthorized photocopying prohibited.)
Another newly created category, however, made it straight into the top 10. Based on customer feedback, a new term to cover all radiopharmaceuticals was developed. These are radioactive isotopes, frequently conjugated to targeting agents such as monoclonal antibodies, used as therapeutics or diagnostics, again primarily in oncology. In fact, all of the top 10 mechanisms of action have a cancer component, with the one exception of ninth-placed opioid mu receptor agonists, which are used in the treatment of pain (Table 5).
The ongoing importance of this mechanism is highlighted further if we move on to look at the leading physiological proteins targeted by drugs. Here the opioid mu1 receptor subtype stays at the summit for another year, but it is the breast cancer target HER-2 which this year moves into the second spot following a decline for the inflammation target, the glucocorticoid receptor. The top five is completed by another inflammation/pain protein and another cancer target, tumour necrosis factor, and VEGF-A, respectively.
Table 6: Top 25 drug protein targets
Position 2018 (2017) Target*
No. of active compounds 2018 (2017)
Trend
1 (1) opioid receptor, mu 1 140 (143) ←→2 (4) erb-b2 receptor tyrosine kinase 2 [HER-2] 120 (113) ←→3 (6) vascular endothelial growth factor A 119 (105) ↑4 (2) nuclear receptor subfamily 3, group C, member 1
(glucocorticoid receptor) 113 (123) ↓5 (3) tumour necrosis factor 113 (123) ↓6 (5) prostaglandin-endoperoxide synthase 2 (prostaglandin G/H
synthase and cyclooxygenase) [COX-2] 107 (106) ←→7 (7) epidermal growth factor receptor 107 (104) ←→8 (8) insulin receptor 99 (94) ←→9 (9) opioid receptor, kappa 1 88 (87) ←→
10 (10) glucagon-like peptide 1 receptor 80 (82) ←→11 (11) dopamine receptor D2 73 (79) ←→12 (12) prostaglandin-endoperoxide synthase 1 (prostaglandin G/H
synthase and cyclooxygenase) [COX-1] 71 (75) ←→13 (15) gag-pol, HIV-1 64 (68) ←→14 (19) membrane-spanning 4-domains, subfamily A, member 1
[CD20] 64 (60) ←→15 (28) CD19 molecule 62 (49) ↑16 (24) tubulin, beta class I 62 (55) ←→17 (27) programmed cell death 1 61 (49) ↑18 (33) CD274 molecule 57 (43) ↑

24 / February 2018 © Informa UK Ltd 2018 (Unauthorized photocopying prohibited.)
Source: Pharmaprojects®, January 2018
*NCBI names, except additions it italics made by us for clarity
19 (16) estrogen receptor 1 57 (62) ←→20 (14) adrenoceptor beta 2, surface 57 (74) ↓21 (23) androgen receptor 56 (55) ←→22 (17) amyloid beta (A4) precursor protein 53 (61) ↓23 (29) kinase insert domain receptor 53 (49) ←→24 (22) 3-hydroxy-3-methylglutaryl-Coenzyme A reductase 52 (56) ←→25 (18) opioid receptor, delta 1 51 (60) ↓
I noted last year that, despite the broad IO mechanism’s surge in popularity, no individual protein targets connected with immuno-oncology had yet made it into the Top 25. That’s no longer the case, thanks to three of the four debutants seen in Table 6: CD19 at number 15, programmed cell death 1 at 17, and CD274 at 18. CD19 plays a role in B-cell lymphomas, and is one of the targets of Amgen’s marketed bispecific monoclonal Blincyto (blinatumomab), and of Novartis’ Kymriah (tisagenlecleucel-t), which in August became the first ever chimeric antigen receptor (CAR-T) cellular therapy to be approved. Programmed cell death-1, or PD-1, is behind the established melanoma and lung cancer therapies Opdivo (nivolumab; Bristol-Myers Squibb/Ono Pharmaceutical) and Keytruda (pembrolizumab; Merck & Co). Meanwhile, CD274, better known as PD-L1, saw the second and third drugs hitting it pass regulatory requirements during 2017, in AstraZeneca’s Imfinzi (durvalumab) and
Merck KGaA/Pfizer’s Bavencio (avelumab), both for urothelial cancer, with the latter additionally approved for Merkel cell carcinoma. Proof that, even though the IO boom is relatively recent, it is already providing a bang for its bucks.
Despite, or perhaps because of, this new approach bearing fruit, it wasn’t a good year generally for innovation. Figure 11 shows the number of newly identified drug targets which were first attached to pipeline drugs during 2017. At 75, that number is coming in well below the levels reported in the two previous years, returning to where it was in 2012–14. Not a disastrous result by any means, but pharma, like pop, does benefit from a constant influx of new talent to keep it fresh; it’s not good to rely on that repackaged box set with no new material. The total number of targets which drugs are currently being actively developed against actually declined, but not significantly, slipping slightly from 1,672 to 1,657.

February 2018 / 25© Informa UK Ltd 2018 (Unauthorized photocopying prohibited.)
Source: Pharmaprojects®, January 2018
Figure 11: Number of new drug protein targets identified by Pharmaprojects by year
0 50 100 150 200
2017
2016
2015
2014
2013
2012
2011
2010
2009
2008
2007
2006
2005
NUMBER OF NEW TARGETS
YEAR
72
107
92
102
97
67
179
89
68
77
113
116
75
26 / February 2018 © Informa UK Ltd 2018 (Unauthorized photocopying prohibited.)
Despite Inharmonious Times, Pharma Keeps on Rockin’ and Rollin’
As 2017 fades out, should pharma be singing joyfully at the top of its voice like an X-Factor wannabe, or mumbling miserably like the late, great, Leonard Cohen? Whatever side of the debate you’re on, few would disagree that political polarisation increased further through the year, and it can feel like the world is sounding more discordant than ever. The counterpoint to this is that, despite a seemingly never-ending chorus of disapproval, pharma seems to be doing OK – even if there is an element of it sticking its fingers in its ears and la la la-ing very loudly.
Record levels of new drug approvals in the US and continuing pipeline expansion last year, albeit at a lower rate, would seem to suggest that things are humming along nicely for the industry. And as our forthcoming NAS supplement to this report will reinforce, there were some genuinely innovative drugs brought to market last year. But not everything is moving along brilliante. There are fewer drugs in Phase III trials this year, most Big Pharma firms have smaller pipelines, and levels of innovation are not where they should be. Both the fragility of the EU as Brexit proceeds, and the unpredictable nature of the US administration – at the time of writing, the US government is in one of its periodic shutdowns while a budget cannot be agreed – are threatening to undermine confidence. Few pharma CEOs will be skipping to work whistling a happy tune.
The noise around drug pricing issues is likely to be moving towards a crescendo. One area where the pharma and music industries have markedly diverged is in the cost of their goods. Over the past 50 years, music has progressively become much cheaper, as manufacturing and distribution overheads all but disappeared with the move to digital delivery. I have many 12” singles in my collection in my spare room which cost £8.99 twenty years ago, whereas now, a track rarely costs more than 99p to download, to say nothing of the streaming services’ subscription propositions.
Paradoxically, the price crash has led many to not want to pay anything at all for music – hence the rise of illegal downloads. All of this has benefitted the consumer hugely, but made it much more difficult to make a living in the music business if you are an artist.
This is in sharp relief to the situation in pharma, where the expense of drug development has spiralled, leading to soaring prices facing payers, and ultimately consumers too. Whereas arguably the changes to the music industry have resulted in its democratization, the burgeoning costs, particularly of niche products and those for rare diseases, are increasingly restricting patients’ access to the latest new releases. Payers are starting to push back, and the industry can expect to be held more and more accountable for its pricing strategy. Increasingly, we can expect questions to be asked as to whether drug prices are really so high because of their intrinsic development costs, or because Big Pharma simply isn’t very efficient at doing what it does.
There’s no doubt that rare diseases are one sphere still setting the industry’s pulses racing at an ever faster BPM. As of January 2018, 4,615 drugs, or just over 30% of the pipeline, are under development for at least one rare disease. The orphan drug status route is also continuing to gain traction, with Figure 12 showing that a record number of orphan designations were granted in 2017. Another issue with this approach is that developing drugs for orphan indications can be very first world-centric, since developing countries tend to focus their limited funds on diseases affecting the largest populations, and don’t tend to have orphan drug programmes anyway. The graph also shows that the various schemes which the major territories have in place to fast-track approval for drugs where there is greatest need also showed higher uptake in the year just passed.

February 2018 / 27© Informa UK Ltd 2018 (Unauthorized photocopying prohibited.)
However, the issue of drug pricing may put a check on the headlong rush into rare diseases, and there are many common conditions which require urgent attention anyway. Successfully launching an Alzheimer’s drug which actually reversed the course of the disease would be more lucrative than Britney Spears’ just-concluded Vegas residency. The infectious disease area desperately needs new antibiotics, preferably before the last of the existing agents cease to work due to resistance. Despite all of the investment, cancer remains a major threat. And cardiovascular diseases, in the form of ischaemic heart disease and stroke, are still the world’s biggest killers, egged on by poor lifestyle choices. There is much to be done. To solve these and myriad other problems, pharma must break out of its rigid verse-chorus-verse-chorus-middle eight-
chorus structure, and find ways to innovate and remix its familiar sound for a new generation.
So, the song remains the same for pharma this year, but there are so many counter-melodies and variations constantly competing for attention; that information remains key to decoding the message. As always, we here at Pharmaprojects will be putting the needle on the record (ask your parents) and listening closely to every beat, note and crackle which emanates from the industry, not just in this annual review, but throughout the year. Rest assured, whether it be listening out for the fanfares of new drug launches or the funeral marches of discontinuations, Pharmaprojects and the rest of Informa’s Pharma Intelligence team will have our ears to the ground.
Figure 12: Rise in numbers of drugs receiving orphan drug status or an expedited review designation* 2013-2017
Source: Pharmaprojects®, January 2018
*Data for 2013 not complete as we only began systematically recording the dates of these events mid-year.
0
50
100
150
200
250
300
350
400
450
500
20172016201520142013
ORPHAN DRUGSTATUS GRANTED
EXPEDITED REVIEWSTATUS GRANTED
DRU
G CO
UN
T
299
50
326
157
394
182
369
188
434
250
YEAR

Informa’s Pharma intelligence is home of the world’s leading pharma and healthcare R&D and business intelligence brands – Datamonitor Healthcare, Sitetrove, Trialtrove, Pharmaprojects, Medtrack, Biomedtracker, Scrip, Pink Sheet, In Vivo. Pharma intelligence’s brands are trusted to provide over 3000 of the world’s leading pharmaceutical, contract research organizations (CRO’s), medical technology, biotechnology and healthcare service providers, including the top 10 global pharma and top 10 CRO’s, with an advantage when making critical R&D and commercial decisions.
Accurate and timely intelligence about the drug development pipeline is vital to understanding the opportunities and risks in today’s biopharmaceutical marketplace – whether you are targeting an unmet medical need, investigating promising new therapies or researching drug development historical trends and treatment patterns. If you are providing contract research or other services in the pharma industry, you need to stand out. A solid understanding of your potential clients’ pipelines and competition will help you leave a lasting impression.
United States52 Vanderbilt Avenue11th FloorNew YorkNY 10017USA+1 646 957 8919+1 888 436 3012
United KingdomChristchurch Court10-15 Newgate StreetLondonEC1A 7HDUnited Kingdom+44 20 7017 5000
JapanKotakudo GinzaBuilding, 7th Floor5-14-5 GinzaChuo-kuTokyo104-0061+81 351 487 670
China23rd FloorChina Online Centre333 Lockhart RoadWanchaiHong Kong+85 239 667 222
AustraliaLevel 7120 Sussex StreetSydneyNSW 2000+61 2 8705 6900
Pharma Intelligence © 2018. All rights reserved. Pharma Intelligence is a trading division of Informa UK Ltd. Registered office: Mortimer House, 37-41 Mortimer Street, London W1T3JH, UK. Registered in England and Wales No 1072954