pge 2 rhoda mine abstract
TRANSCRIPT

7/31/2019 Pge 2 Rhoda Mine Abstract
http://slidepdf.com/reader/full/pge-2-rhoda-mine-abstract 1/3
800.364.9897 www.caymanchem.com/FPIA
Fluorescence Polarization Immunoassay (FPIA)for PGE2 Based on a Rhodamine Fluorophore1180 E. Ellsworth Road • Ann Arbor, MI 48108 • Toll Free 800.364.9897 • www.caymanchem.com
Dan Tew, Adam Uzieblo, Michelle Stanton, Elizabeth Meade, Jeff Johnson, and Kirk Maxey
Prostaglandin E2 (PGE2) is a primary prostaglandin formed from the coupled metabolism of arachidonic acid by the cyclooxygenases(COX-1 and COX-2) and prostaglandin E synthase. Its activity in uences in ammation, fertility and parturition, gastric mucosal in-tegrity, and immune modulation. Most immunoassays for the measurement of PGE2 utilize a solid-phase format that requires multipleincubation and washing steps. We have developed a rhodamine-based uorescence polarization immunoassay (FPIA) for the rapidmeasurement of PGE2.
Fluorescence polarization (FP) assays are homogeneous, single-step assays ideal for high-throughput screening (HTS) applications. ThePGE2 FPIA-Red uses a simple mix-and-read format in which a single reagent is added to the sample/standard and the assay is read after
a 60 minute incubation. The assay is robust (Z’ = 0.69), exhibits D200 mP over a range of 91 pg/ml to 200 ng/ml PGE2, and has a sensitivity of 210 pg/ml. Use of the red-shifted rhodamine label reduces interference from most sample matrices thereby making theassay applicable to the identi cation of COX-1/-2 or PGE Synthase inhibitors using whole cells, cell lysates, plasma, or recombinantenzyme preparations.
Fluorescence Polarization Immunoassay (FPIA) for Prostaglandin E 2 Based on a Rhodamine Fluorophore
Abstract
0
100
200
300
400
10 10,000 100,000100 1,000 1,000,000
Prostaglandin E 2 (pg/ml)
m P
Low free PGE2 concentration:PGE2-Rhodamine bound to the antibody rotates slowly and exhib-its high polarization
High free PGE 2 concentration:Excess free PGE2 displaces PGE2-Rhodamine which rotates rapidly and exhibits low polarization
Methods and ResultsFigure 1: PGE 2 FPIA-Red Standard CurveFP tracers were prepared by labeling PGE2 with rhodamine. A PGspeci c monoclonal antibody and the tracer were titered to optimthe dynamic range and sensitivity of the assay. The PGE2 FPIA Stdard Curve in buffer shows a sensitivity of approximately 210 p
(3s from zero PGE2).
7/31/2019 Pge 2 Rhoda Mine Abstract
http://slidepdf.com/reader/full/pge-2-rhoda-mine-abstract 2/3
800.364.9897 www.caymanchem.com/FPIA
Fluorescence Polarization Immunoassay (FPIA)for PGE2 Based on a Rhodamine Fluorophore1180 E. Ellsworth Road • Ann Arbor, MI 48108 • Toll Free 800.364.9897 • www.caymanchem.com
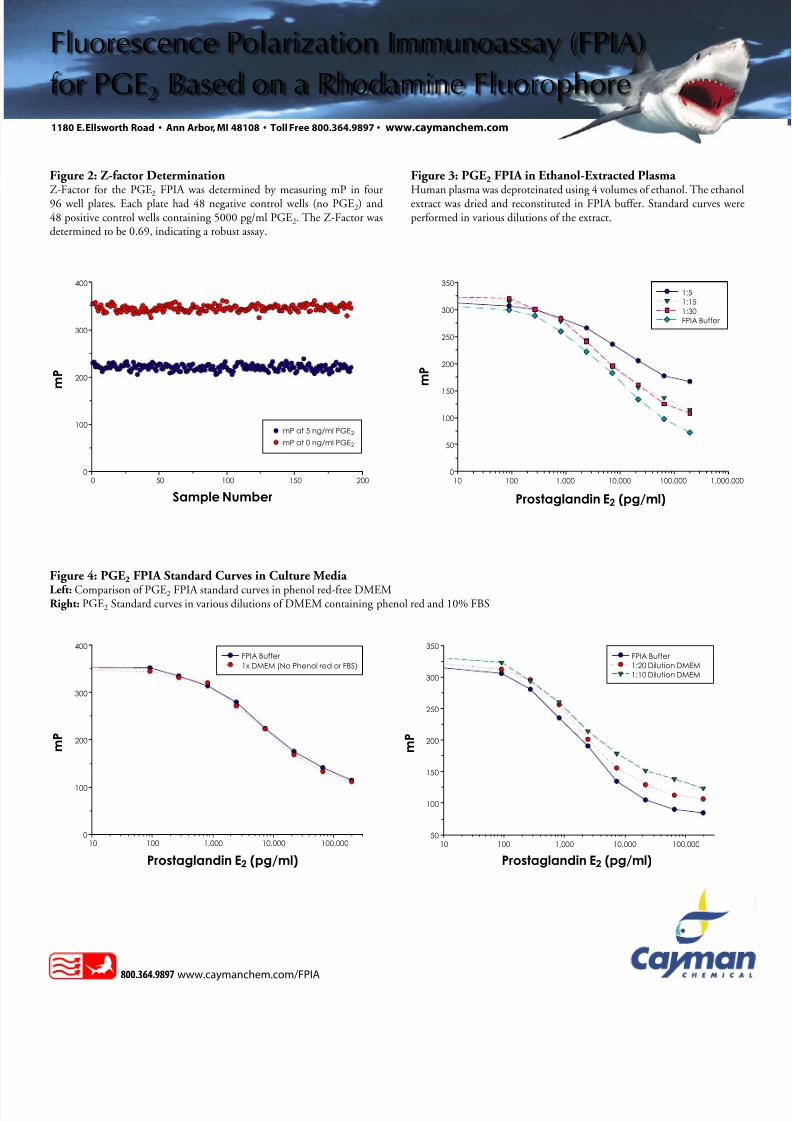
Figure 2: Z-factor DeterminationZ-Factor for the PGE
2FPIA was determined by measuring mP in four
96 well plates. Each plate had 48 negative control wells (no PGE2) and48 positive control wells containing 5000 pg/ml PGE2. The Z-Factor wasdetermined to be 0.69, indicating a robust assay.
mP at 0 ng/ml PGE 2
mP at 5 ng/ml PGE 2
Sample Number
m P
0 50 100 2001500
100
200
300
4001:5
1:30FPIA Buffer
1:15
Prostaglandin E 2 (pg/ml)
m P
350
010 100 1,000 10,000 100,000 1,000,000
50
100
150
200
250
300
Figure 3: PGE 2 FPIA in Ethanol-Extracted Plasma Human plasma was deproteinated using 4 volumes of ethanol. The ethanextract was dried and reconstituted in FPIA buffer. Standard curves weperformed in various dilutions of the extract.
FPIA Buffer 1x DMEM (No Phenol red or FBS)
Prostaglandin E 2 (pg/ml)
m P
10 100 1,000 100,00010,0000
100
200
300
400FPIA Buffer 1:20 Dilution DMEM1:10 Dilution DMEM
Prostaglandin E 2 (pg/ml)
m P
10 100 1,000 100,00010,00050
100
200
150
300
250
350
Figure 4: PGE 2 FPIA Standard Curves in Culture Media Left: Comparison of PGE2 FPIA standard curves in phenol red-free DMEMRight: PGE2 Standard curves in various dilutions of DMEM containing phenol red and 10% FBS
7/31/2019 Pge 2 Rhoda Mine Abstract
http://slidepdf.com/reader/full/pge-2-rhoda-mine-abstract 3/3
800.364.9897 www.caymanchem.com/FPIA
Fluorescence Polarization Immunoassay (FPIA)for PGE2 Based on a Rhodamine Fluorophore1180 E. Ellsworth Road • Ann Arbor, MI 48108 • Toll Free 800.364.9897 • www.caymanchem.com
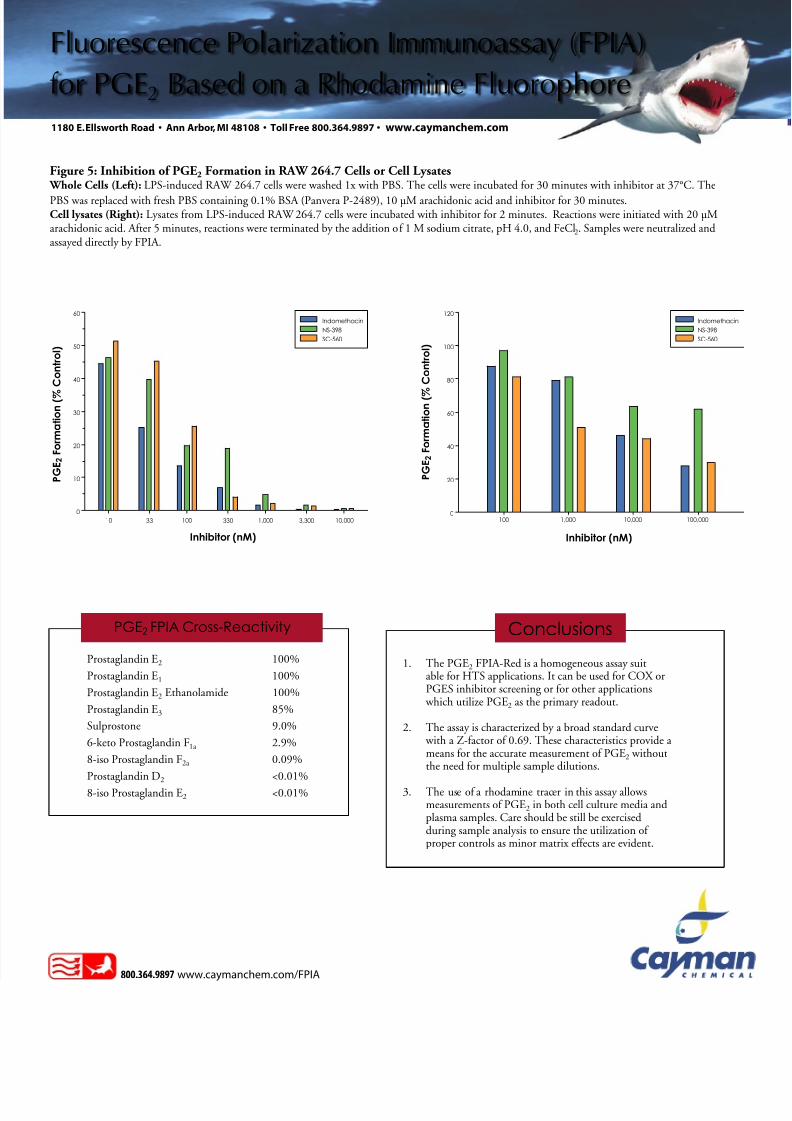
Figure 5: Inhibition of PGE 2 Formation in RAW 264.7 Cells or Cell Lysates Whole Cells (Left): LPS-induced RAW 264.7 cells were washed 1x with PBS. The cells were incubated for 30 minutes with inhibitor at 37°C. ThePBS was replaced with fresh PBS containing 0.1% BSA (Panvera P-2489), 10 µM arachidonic acid and inhibitor for 30 minutes.Cell lysates (Right): Lysates from LPS-induced RAW 264.7 cells were incubated with inhibitor for 2 minutes. Reactions were initiated with 20 µMarachidonic acid. After 5 minutes, reactions were terminated by the addition of 1 M sodium citrate, pH 4.0, and FeCl2. Samples were neutralized andassayed directly by FPIA.
Prostaglandin E2 100%Prostaglandin E1 100%Prostaglandin E2 Ethanolamide 100%Prostaglandin E3 85%Sulprostone 9.0%6-keto Prostaglandin F1a 2.9%8-iso Prostaglandin F2a 0.09%Prostaglandin D2 <0.01%8-iso Prostaglandin E2 <0.01%
PGE 2 FPIA Cross-Reactivity
1. The PGE2 FPIA-Red is a homogeneous assay suitable for HTS applications. It can be used for COX orPGES inhibitor screening or for other applications
which utilize PGE2 as the primary readout.
2. The assay is characterized by a broad standard curve with a Z-factor of 0.69. These characteristics provide a means for the accurate measurement of PGE2 withoutthe need for multiple sample dilutions.
3. The use of a rhodamine tracer in this assay allowsmeasurements of PGE2 in both cell culture media andplasma samples. Care should be still be exercisedduring sample analysis to ensure the utilization of proper controls as minor matrix effects are evident.
Conclusions
Indomethacin
NS-398
SC-560
10 100 10,0001,000
0
10
30
20
50
40
60
Inhibitor (nM)
P G E 2 F o r m a t i o n ( %
C o n t r o l )
33 330 3,300 100 1,000 100,00010,0000
20
60
40
100
80
120Indomethacin
NS-398
SC-560
Inhibitor (nM)
P G E 2 F o r m a t i o n ( %
C o n t r o l )