petrel tips&tricks from scm - scminc.com · knowledge worth sharing petrel tips&tricks from...
TRANSCRIPT

K n o w l e d g e W o r t h S h a r i n g
Petrel TIPS&TRICKS from SCM
Petrel is a mark of Schlumberger
4801 Woodway Drive, Suite 150W • Houston, TX 77056 • www.scminc.com • [email protected]
© 2011 SCM E&P Solutions, Inc.
1
Building and Using Petrophysical Attributes
Mappers and modelers who have used Petrel for sometime may be unaware of this simple yet extremely useful tool for calculating zone average attribute values. Its use allows rapid QC of calculated log data and the calculation of field wide volumes. Use these methods in the early stages of your modeling projects to ensure the framework and the data are ready to move into geocellular modeling.
This TIPS&TRICKS explains how to create Zone Attributes from continuous (e.g. average value for porosity) and discrete (e.g. average N:G from facies) logs and how to address some of the stumbling blocks, such as:
Errors resulting from missing tops.
Naming issues (and how to avoid them) resulting from attributes entered directly from a tops file.
Displaying attributes.
Well data attributes are part of the Well Tops file. These attributes can represent a value at a point such as the top pick, in which case it is a top attribute. Attributes can also represent a value between two tops, usually an average, in which case it is a zone attribute. Zone attributes are commonly used in mapping projects. A typical mapping workflow using Zone attributes might be:
1. Import or create well logs and tops.
2. Create zone-average attributes for porosity.
3. Build porosity grids for each zone.
4. Generate displays of each grid, posting the associated data.
5. Use porosity grid in volume calculations.
Here, we will concentrate on Steps 2 and 3.

Petrel is a mark of Schlumberger
4801 Woodway Drive, Suite 150W • Houston, TX 77056 • www.scminc.com • [email protected]
© 2011 SCM E&P Solutions, Inc.
2
Figure: A generalized mapping workflow that uses the Zone attribute tool (see step 2 below) to create the grid data.
Creating Zone Average Attributes Multiple attributes can be stored with objects like tops, zones, grids and points, the same way objects are stored in Petrel under folders. In this example we will concentrate on Zone Attributes stored in a Well Tops object.
1 2 4
5
3

Petrel is a mark of Schlumberger
4801 Woodway Drive, Suite 150W • Houston, TX 77056 • www.scminc.com • [email protected]
© 2011 SCM E&P Solutions, Inc.
3
All the above properties with the exception of the last two (Zone Porosity and Zone NtoG) are predefined for each well top. Some values are routinely defined all the time and some are empty until data is available to calculate them or values are entered manually. TWT Auto, TVT, and TST are all automatic attributes calculated according to the time/depth relationship and the dip of the stratigraphy in the well. Automatic attributes are dynamically updated whenever the well tops are adjusted.
This example illustrates how to create the two user-defined zone attributes in the above list. Once created, a Zone Attribute becomes a stored value with the zones in a Well Tops file. It can be interpolated from Logs or Surfaces or it can be entered manually. Attributes must be assigned one of six types; Continuous, Discrete, Boolean, String, Date or Derived. Here we will focus on only Continuous and Discrete attributes.
What Zone Attributes should be calculated?
While many attributes may be calculated for the zones, the following are the most common. Remember, these attributes are for the zones between the horizons and not for the horizons themselves.
Continuous Attributes
Continuous attributes are attributes which may have decimal values such as porosity and permeability. To create a continuous attribute, follow these steps:
Average Net Attribute (i.e.: Phi, Perm, Sw)
Attribute Thickness (i.e.: Phi*H)
Dominant Facies (Lithofacies)
Facies Thickness (Net Thickness)
Net-to-Gross Ratio (NTG)

Petrel is a mark of Schlumberger
4801 Woodway Drive, Suite 150W • Houston, TX 77056 • www.scminc.com • [email protected]
© 2011 SCM E&P Solutions, Inc.
4
1. Right-Click on the Attribute Folder and select Insert new attribute.
2. Specify the type of attribute (Continuous in this case).
3. The Attribute dialog is displayed. Choose the desired template.

Petrel is a mark of Schlumberger
4801 Woodway Drive, Suite 150W • Houston, TX 77056 • www.scminc.com • [email protected]
© 2011 SCM E&P Solutions, Inc.
5
4. Go to the Attribute Operations tab:
a. Check the button To the zones at level
b. Specify which level to calculate
c. Select the log to be used for calculation
d. Choose the correct Average method
e. Consider any other parameters
f. Click Run to calculate the attributes
The Attribute(s) are added to the bottom of the list
Take care in selecting the averaging method for creating a continuous attribute using a continuous log. Available methods are:
a. Arithmetic – Typically used for attributes such as porosity, saturation and net/gross because these are additive variables. The arithmetic mean is only correct for horizontal permeability that is constant within each layer.
b. Harmonic – Gives the effective vertical permeability if the reservoir is layered with constant permeability in each layer. The harmonic mean works well with log normal distributions. Used for permeability because it is sensitive to lower values. Only positive values may be used with this method.
c. Geometric – Normally a good estimate for permeability if it has no spatial correlation and is log normally distributed. The geometric mean is sensitive to lower values, which will have a greater influence on results. Only positive values may be used with this method.
d. RMS (Root Mean Square) – Will provide a bias towards high values.
e. Minimum – Will sample the minimum value of the well log for each layer.

Petrel is a mark of Schlumberger
4801 Woodway Drive, Suite 150W • Houston, TX 77056 • www.scminc.com • [email protected]
© 2011 SCM E&P Solutions, Inc.
6
f. Maximum – Will sample the maximum value of the well log for each layer.
g. Integrate – Will integrate (sum) the log between the two well tops.
The methods available for creating a continuous attribute using a discrete log are:
a. Most of – Will select the discrete value which is most represented in the log.
b. Median – Will sort the input values and select the center value. For example; if there are 5 input values, these are sorted by magnitude and then entry number 3 in the sequence is selected.
c. Minimum – Will sample the minimum value of the well log for each layer.
d. Maximum – Will sample the maximum value of the well log for each layer.
e. Arithmetic – Typically used for attributes such as porosity, saturation and net/gross because these are additive variables. The arithmetic mean is only correct for horizontal permeability that is constant within each layer.
f. Fraction – Calculate the fraction of a particular log that belongs to a specific facies between the two well tops according to the chosen depth scale (i.e. – 0.285 means 28.5 percent of the log is the specific facies).
o Must also pick the facies of interest
g. Percentage – Calculate the percentage of a particular log that belongs to a specific facies between the two well tops according to the chosen depth scale (i.e. – 28.5 means 28.5 percent of the log is the specific facies).
o Must also pick the facies of interest
h. Thickness – Calculate the thickness of a particular facies on a log located between two tops in a well according to the chosen depth scale.
o Must also pick the facies of interest
Petrel is a mark of Schlumberger
4801 Woodway Drive, Suite 150W • Houston, TX 77056 • www.scminc.com • [email protected]
© 2011 SCM E&P Solutions, Inc.
7
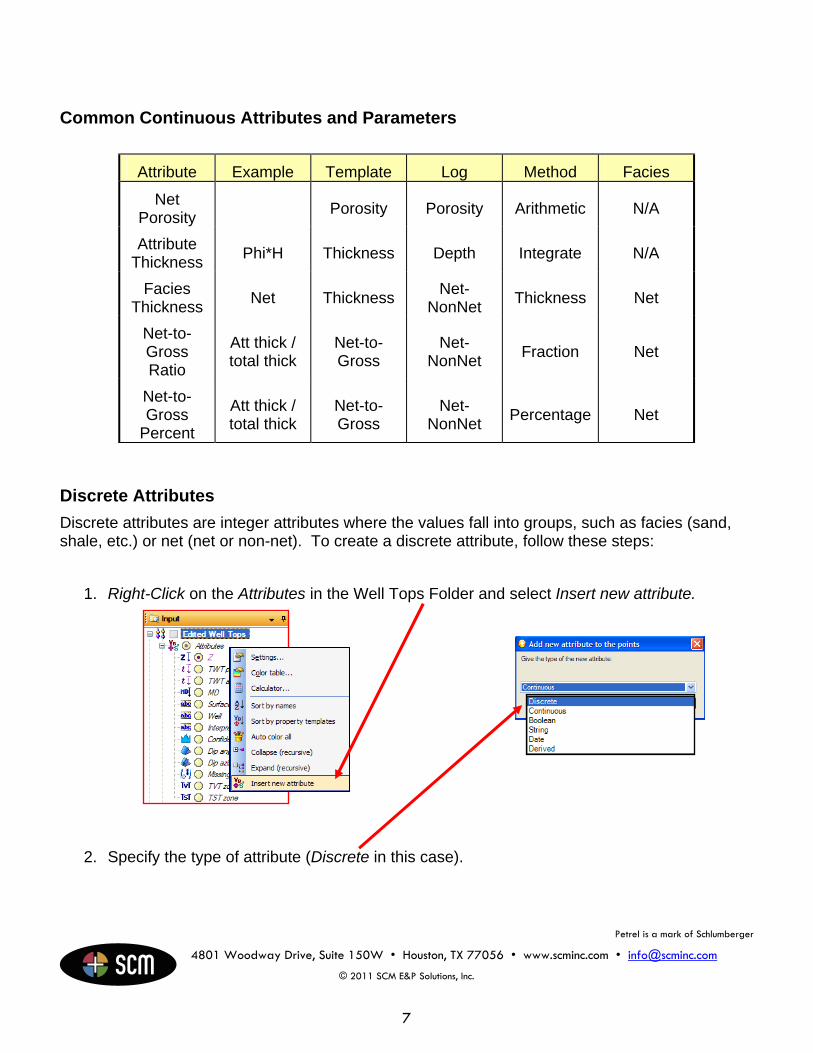
Common Continuous Attributes and Parameters
Attribute Example Template Log Method Facies
Net Porosity
Porosity Porosity Arithmetic N/A
Attribute Thickness
Phi*H Thickness Depth Integrate N/A
Facies Thickness
Net Thickness Net-
NonNet Thickness Net
Net-to-Gross Ratio
Att thick / total thick
Net-to-Gross
Net-NonNet
Fraction Net
Net-to-Gross
Percent
Att thick / total thick
Net-to-Gross
Net-NonNet
Percentage Net
Discrete Attributes
Discrete attributes are integer attributes where the values fall into groups, such as facies (sand, shale, etc.) or net (net or non-net). To create a discrete attribute, follow these steps:
1. Right-Click on the Attributes in the Well Tops Folder and select Insert new attribute.
2. Specify the type of attribute (Discrete in this case).

Petrel is a mark of Schlumberger
4801 Woodway Drive, Suite 150W • Houston, TX 77056 • www.scminc.com • [email protected]
© 2011 SCM E&P Solutions, Inc.
8
3. The Attribute dialog is displayed. Choose the desired template.
4. Go to the Attribute Operations tab:
g. Check the button To the zones at level
h. Specify which level to calculate
i. Select the log to be used for calculation
j. Choose the correct Average method
k. Consider any other parameters
l. Click Run to calculate the attributes
Petrel is a mark of Schlumberger
4801 Woodway Drive, Suite 150W • Houston, TX 77056 • www.scminc.com • [email protected]
© 2011 SCM E&P Solutions, Inc.
9
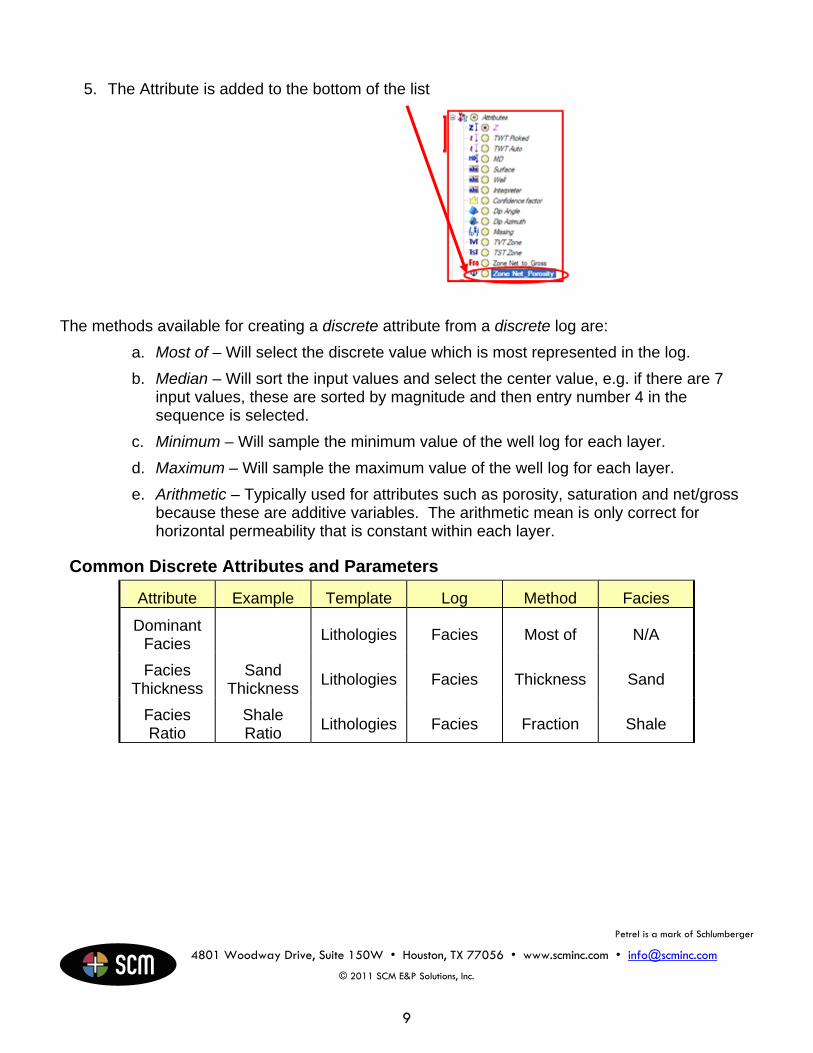
5. The Attribute is added to the bottom of the list
The methods available for creating a discrete attribute from a discrete log are:
a. Most of – Will select the discrete value which is most represented in the log.
b. Median – Will sort the input values and select the center value, e.g. if there are 7 input values, these are sorted by magnitude and then entry number 4 in the sequence is selected.
c. Minimum – Will sample the minimum value of the well log for each layer.
d. Maximum – Will sample the maximum value of the well log for each layer.
e. Arithmetic – Typically used for attributes such as porosity, saturation and net/gross because these are additive variables. The arithmetic mean is only correct for horizontal permeability that is constant within each layer.
Common Discrete Attributes and Parameters
Attribute Example Template Log Method Facies
Dominant Facies
Lithologies Facies Most of N/A
Facies Thickness
Sand Thickness
Lithologies Facies Thickness Sand
Facies Ratio
Shale Ratio
Lithologies Facies Fraction Shale
Petrel is a mark of Schlumberger
4801 Woodway Drive, Suite 150W • Houston, TX 77056 • www.scminc.com • [email protected]
© 2011 SCM E&P Solutions, Inc.
10
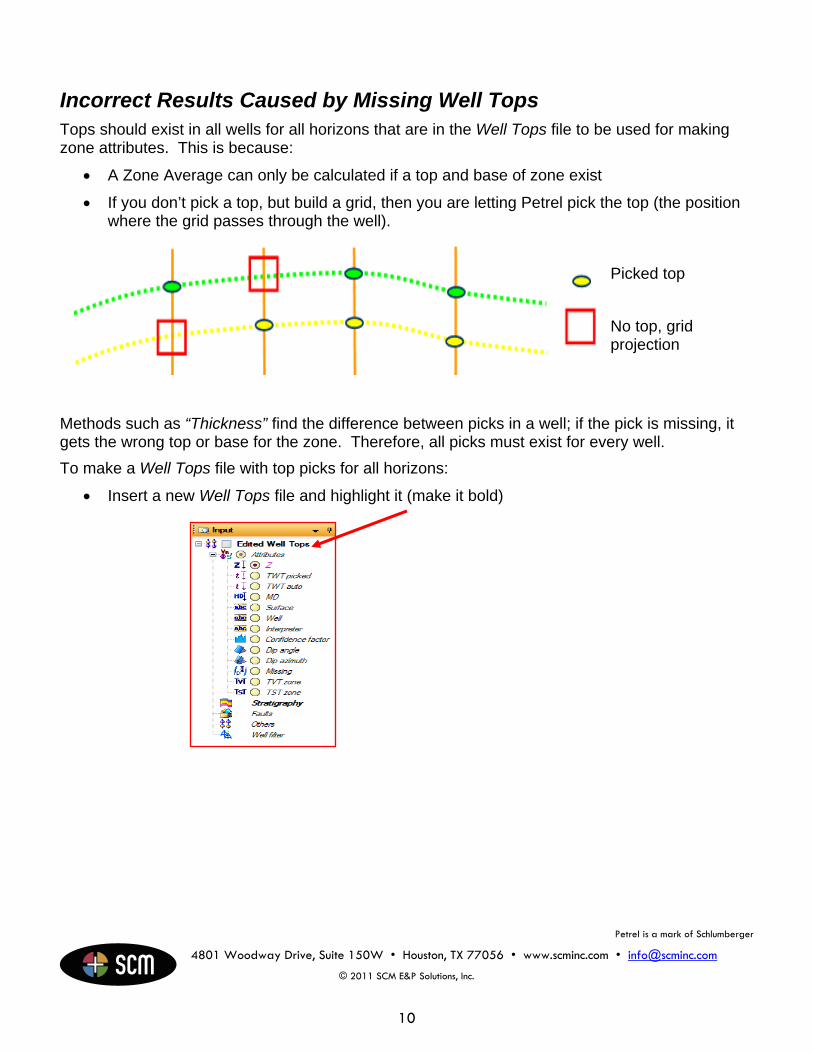
Incorrect Results Caused by Missing Well Tops Tops should exist in all wells for all horizons that are in the Well Tops file to be used for making zone attributes. This is because:
A Zone Average can only be calculated if a top and base of zone exist
If you don’t pick a top, but build a grid, then you are letting Petrel pick the top (the position where the grid passes through the well).
Picked top
No top, grid projection
Methods such as “Thickness” find the difference between picks in a well; if the pick is missing, it gets the wrong top or base for the zone. Therefore, all picks must exist for every well.
To make a Well Tops file with top picks for all horizons:
Insert a new Well Tops file and highlight it (make it bold)

Petrel is a mark of Schlumberger
4801 Woodway Drive, Suite 150W • Houston, TX 77056 • www.scminc.com • [email protected]
© 2011 SCM E&P Solutions, Inc.
11
Double click on the Wells folder and go to the Report tab
a. Press the 3D Grid icon
b. Check Iconize points as
c. Press button in front of Horizon in active Well Tops
d. Press the Run button
A spreadsheet report will appear showing all calculations and the well tops file will now have the Stratigraphy folder filled with horizons and zones.
QC the results by comparing the statistics to the original picks (or put them on a Well Section). Often, interpolated tops may not match the original tops perfectly, but it should be close. If it’s not close, the 3D grid probably wasn’t made correctly.

Petrel is a mark of Schlumberger
4801 Woodway Drive, Suite 150W • Houston, TX 77056 • www.scminc.com • [email protected]
© 2011 SCM E&P Solutions, Inc.
12
Naming Issue When Using Attributes Directly From a Tops File
Petrel does not assign unique names to grids when they are built directly from the zones in the Well Tops file. All zones are named according to the attribute used in the Make/Edit Surfaces process. Renaming for clarity requires manual editing.
Workaround for Naming Issue When extracting zone data from the Well Tops file as points, the points are automatically given unique names. These names are used to automatically create grids with similar unique names.
Steps for extracting the Zone data are:
1. In the Attributes folder of the Well Tops file, highlight the name of the attribute to extract (make it bold)
2. In the Stratigraphy folder, right-click on the zone (NOT the horizon) and select Convert the active attribute to points
Petrel is a mark of Schlumberger
4801 Woodway Drive, Suite 150W • Houston, TX 77056 • www.scminc.com • [email protected]
© 2011 SCM E&P Solutions, Inc.
13
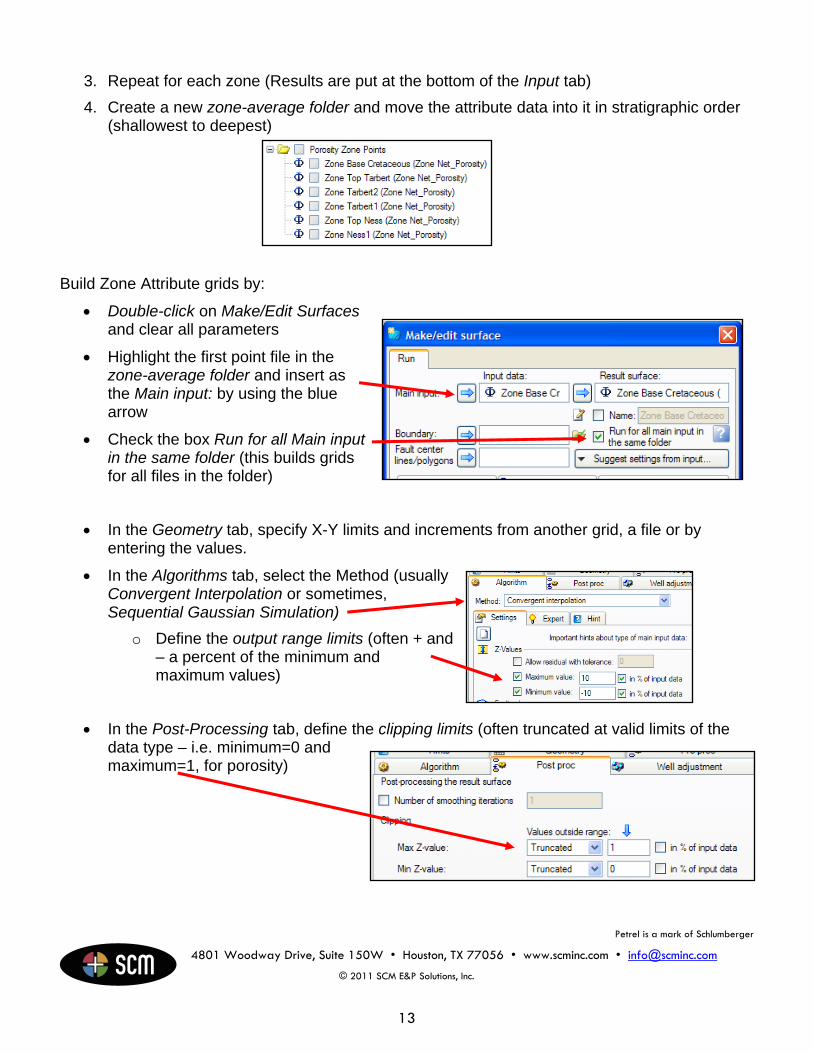
3. Repeat for each zone (Results are put at the bottom of the Input tab)
4. Create a new zone-average folder and move the attribute data into it in stratigraphic order (shallowest to deepest)
Build Zone Attribute grids by:
Double-click on Make/Edit Surfaces and clear all parameters
Highlight the first point file in the zone-average folder and insert as the Main input: by using the blue arrow
Check the box Run for all Main input in the same folder (this builds grids for all files in the folder)
In the Geometry tab, specify X-Y limits and increments from another grid, a file or by entering the values.
In the Algorithms tab, select the Method (usually Convergent Interpolation or sometimes, Sequential Gaussian Simulation)
o Define the output range limits (often + and – a percent of the minimum and maximum values)
In the Post-Processing tab, define the clipping limits (often truncated at valid limits of the data type – i.e. minimum=0 and maximum=1, for porosity)

Petrel is a mark of Schlumberger
4801 Woodway Drive, Suite 150W • Houston, TX 77056 • www.scminc.com • [email protected]
© 2011 SCM E&P Solutions, Inc.
14
Click Apply to build all grids
Don’t forget QC.

Petrel is a mark of Schlumberger
4801 Woodway Drive, Suite 150W • Houston, TX 77056 • www.scminc.com • [email protected]
© 2011 SCM E&P Solutions, Inc.
15
Displaying an Attribute There are two controls for object/attribute display:
What is displayed
Position of display (the purple attribute)
To display an object and a selected attribute
Check the box in front of the object containing the attributes
The radio button defines which attribute is displayed
The purple attribute defines the position where the attribute is displayed. In this case, since “Z” is purple, the “Porosity” attribute is displayed at the “Z” level.
To change the vertical position of the object, use Z-values of a different attribute to position the object
Right-click on the attribute
Select Use as visual vertical position
The attribute name turns Purple and defines the object’s position