peter congdon, centre for statistics and department of geography, queen mary university of london....
TRANSCRIPT

1
Peter Congdon, Centre for Statistics and Department of Geography, Queen Mary University of London.
Spatial Path Models with Multiple Indicators and
Causes: Population Psychiatric Outcomes in US Counties

2
Latent constructs of urban structure (“urban structure constructs”)
Analysis of urban social structure often oriented to producing indices of unobserved constructs
Examples: area deprivation, social fragmentation, social capital, familism, rurality, etc
Various multivariate (or other) methods use observed indicators X1,…XP to produce area scores for small set of underlying latent constructs F1,…FQ
Spatial structuring in latent construct typically not considered though Hogan/Tchernis (2004, JASA) provide Bayesian model for spatially structured Townsend deprivation score F.

3
Flow chart for Townsend Deprivation Score

4
Another Theme: Latent Spatial Constructs for Composite Morbidity
Seek composite morbidity index: e.g. index of cardiovascular morbidity underlying J different observed outcomes Yj, either Normal, Poisson or Binomial (Wang & Wall, Biostatistics, 2003)
Example: Yji are counts,Pi are Population offsets
Then : Yji ~ Poisson(Piji) j=1,..,J
log(ji)=αj+λjFi
Fi ~ spatial(W,,2F) over areas i=1,..,I
W =neighbourhood adjacencies, = spatial correlation
Loading λj expresses influence of common factor Fi on observed outcomes
5
Representing the impact of social structural constructs on morbidity: both X and Y
indicators
May seek area structural constructs F1,…FQ measured by socioeconomic indicators X1,…XP but oriented to explaining particular health outcomes Y1,…YJ.
Latent factors represent aspects of urban social structure, environmental exposure, etc. These are “mainly” measured by X indicators, but partly also measured by the Y outcomes.
Example: Want not “general” deprivation score but a context-specific score tuned to explaining variations in psychiatric morbidity (Y)

6
Social structure and morbidity model: defining aspects
Usually assume confirmatory model relating X variables to F variables (mutually exclusive subsets of X indicators explained by only one F variable). Usually extensive prior evidence to support such an approach
By contrast, typically each Y variable potentially explained by all constructs F1,..,FQ (and maybe also by known predictors W). May need iid random effects also for Y-model (e.g. overdispersed count responses)
7
Example: Psychiatric Morbidity for US Counties
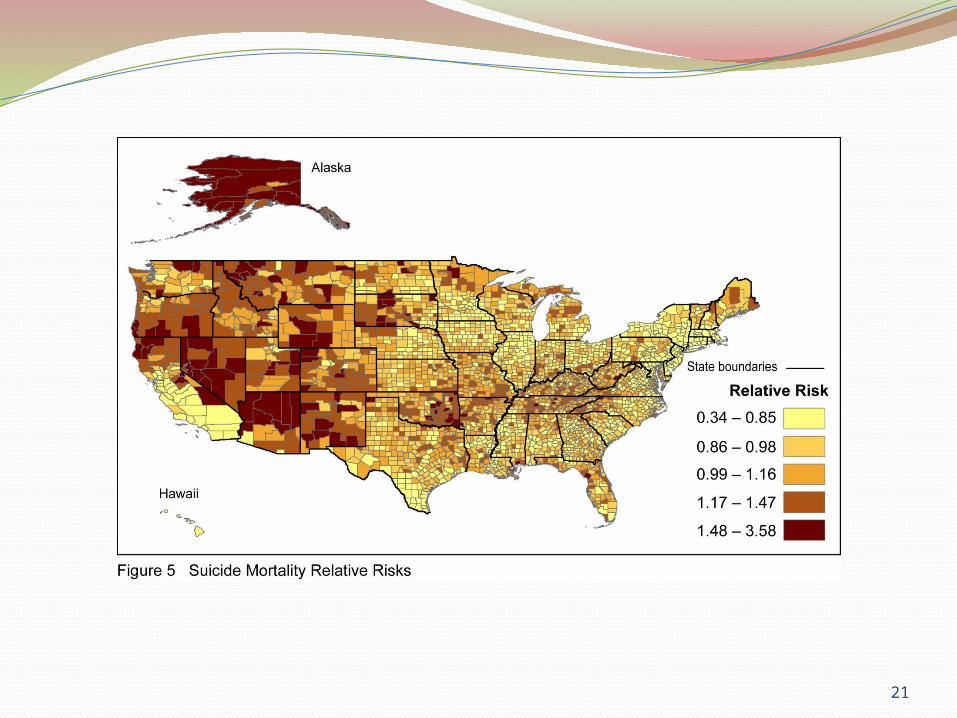
Y variables: suicide deaths (y₁) (Poisson), self-rated poor mental health (y₂) (Normal with varying precision). Source for y2 is BRFSS (Behavioral Risk Factor Surveillance System)
Q=4 latent constructs: social capital F1, deprivation F2, social fragmentation F3, and rurality F4, measured by P=17 X-indicators of urban structure
Choice of X-indicators for social capital follows Rupasingha et al (2006) The production of social capital in U.S. Counties, Journal of Socio-Economics, 35.
Also relevant to explaining Y-outcomes are known predictors W1=% White non-Hispanic and W2=% native American.
8
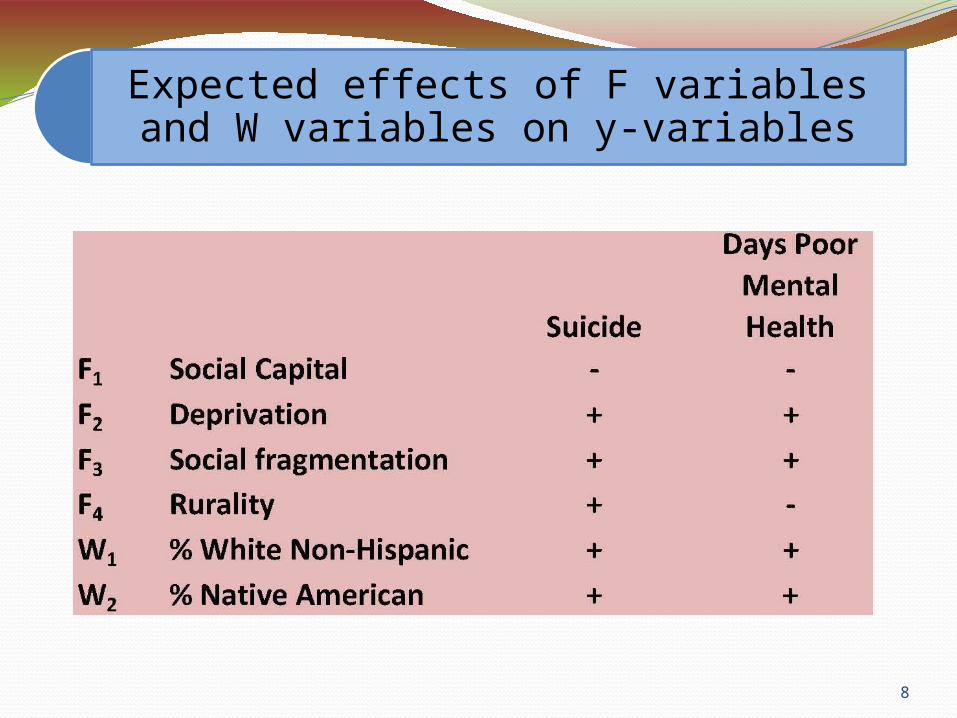
Expected effects of F variables and W variables on y-variables

9
Postulated Links (with Direction), Confirmatory Model Relating Constructs F1,F2,F3,F4 to X-indicators

10
Extending Model for Latent Factors
• Typical paradigm considers only responsive X-indicators, i.e. caused by latent constructs
However, there may be indicators relevant to measuring latent constructs that are better viewed as causes of the construct.
Also some F-variables may be better viewed as depending on other F variables: so one may want a more flexible regression scheme for multiple latent factors than that implied by multivariate normality

11
Causal Indicators of Constructs
Assume latent constructs may be influenced by known (possibly partially observed) exogenous variables {Z1i,..,ZKi}
Alternative terms: Zk sometimes called formative indicators, i.e. "observed variables that are assumed to cause a latent variable", as opposed to effect indicators X (Diamantopoulos & Winklhofer, 2001).
In US county application, literature suggests several possible causes of social capital F1 (e.g. income inequality –ve influence). Incorporating these into model improves measurement of latent construct.
Here we use measure of income inequality Z1, ethnic fractionalization index Z2, and measure of religious adherence Z3

12
Sequences among F variables
Bayesian analyses generally consider only univariate F, and if they consider multivariate F, assume multivariate normal conditionally autoregressive (MCAR) prior.
MCAR has implicit linear regressions between F1,..,FQ without any causal sequence.
Plausible sequence among constructs in US county application: social capital F1 depends on deprivation F2(expected -ve impact), fragmentation F3 (expected -ve impact ), and rurality F4 (expected +ve impact). See Rupasingha et al (2006) on substantive basis.
So have separate models for F1 and for {F2,F3,F4}.

13

14
Antecedent and Dependent F variables
Take {F2,F3,F4} to be trivariate CAR. These effects have zero means obtained by centering during MCMC sampling.
Model for F1 is separate univariate spatial prior with regression on other F variables and on Z variables
Can include nonlinear effects of {F2,F3,F4} on F1, and maybe Z-F interactions.
15
Mediating Effect of Dependent F variables
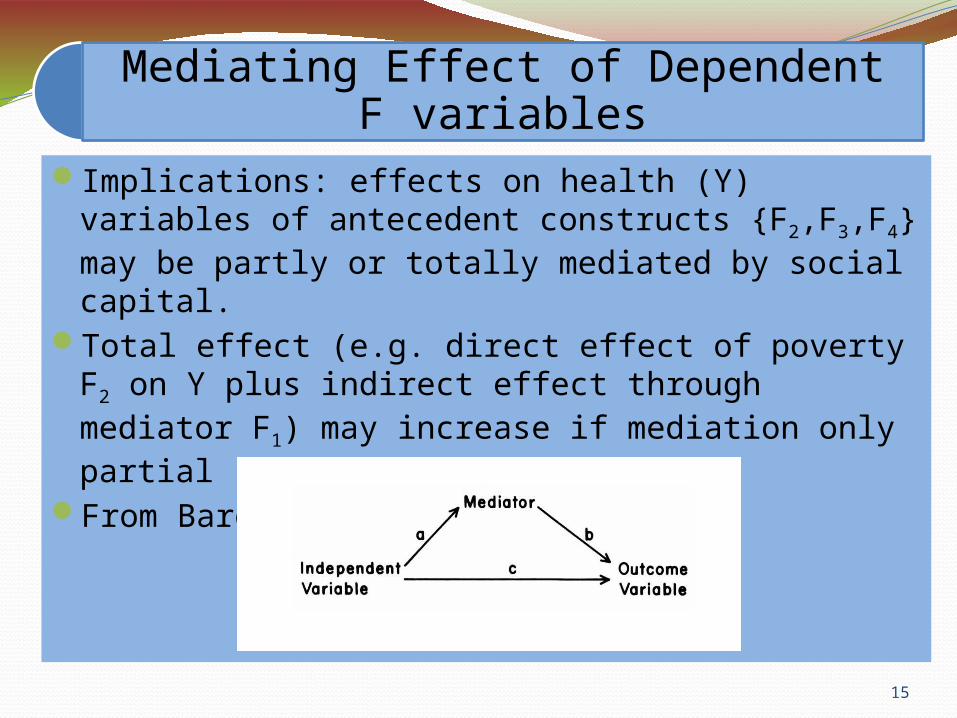
Implications: effects on health (Y) variables of antecedent constructs {F2,F3,F4} may be partly or totally mediated by social capital.
Total effect (e.g. direct effect of poverty F2 on Y plus indirect effect through mediator F1) may increase if mediation only partial
From Baron-Kenny 1986:

16
17
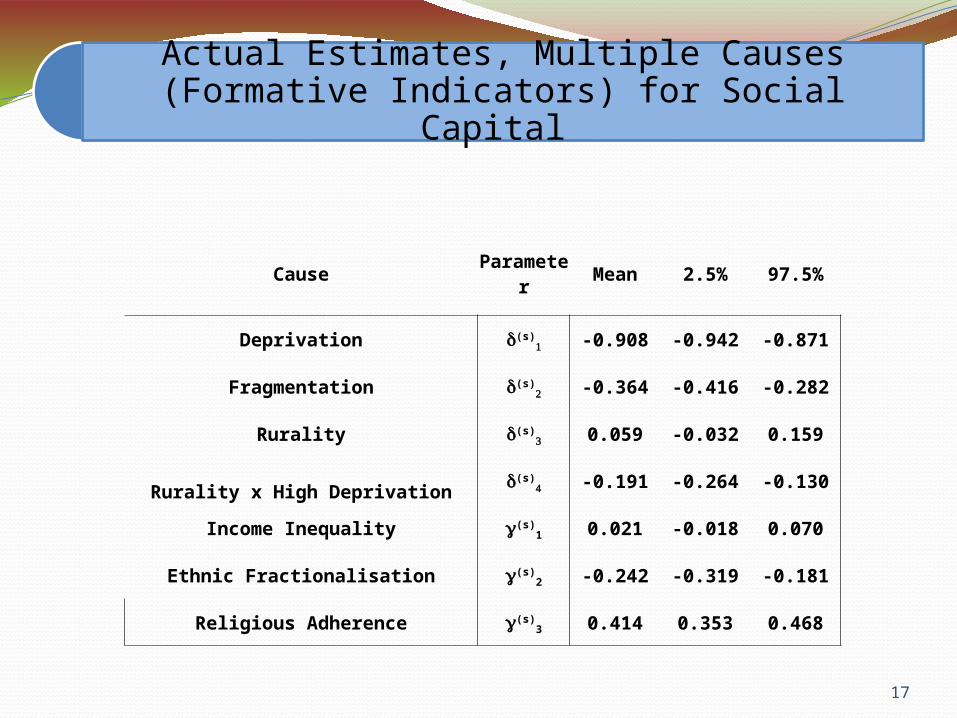
Actual Estimates, Multiple Causes (Formative Indicators) for Social Capital
Cause Parameter Mean 2.5% 97.5%
Deprivation d(s)1 -0.908 -0.942 -0.871
Fragmentation d(s)2 -0.364 -0.416 -0.282
Rurality d(s)3 0.059 -0.032 0.159
Rurality x High Deprivationd(s)
4 -0.191 -0.264 -0.130
Income Inequality g(s)1 0.021 -0.018 0.070
Ethnic Fractionalisation g(s)2 -0.242 -0.319 -0.181
Religious Adherence g(s)3 0.414 0.353 0.468

18

19

20
21

22
23
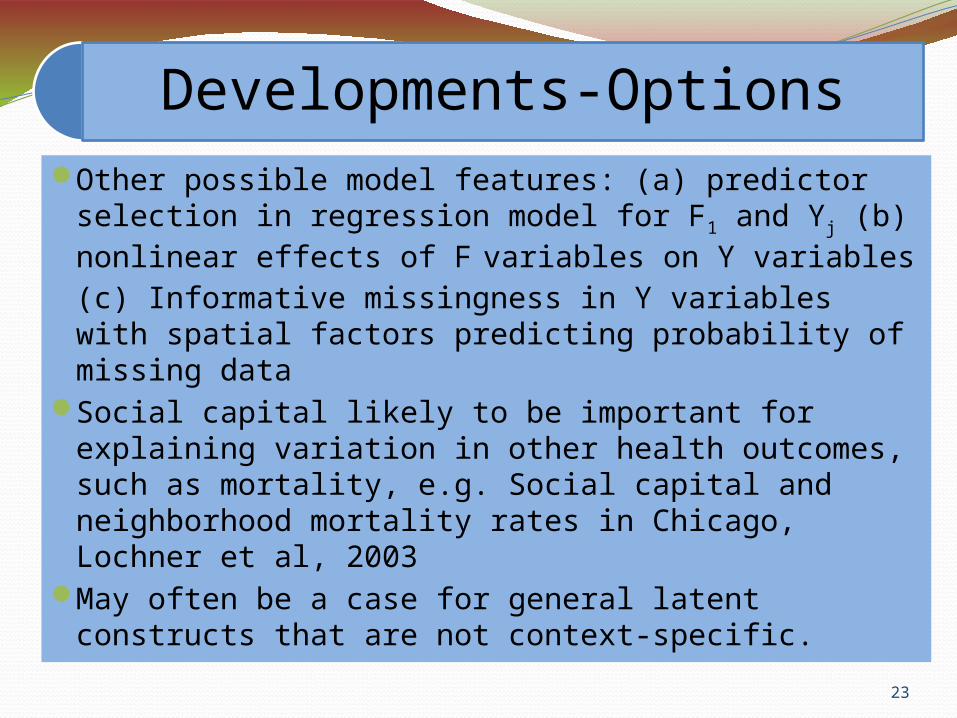
Developments-OptionsOther possible model features: (a) predictor
selection in regression model for F1 and Yj (b) nonlinear effects of F variables on Y variables (c) Informative missingness in Y variables with spatial factors predicting probability of missing data
Social capital likely to be important for explaining variation in other health outcomes, such as mortality, e.g. Social capital and neighborhood mortality rates in Chicago, Lochner et al, 2003
May often be a case for general latent constructs that are not context-specific.