pesticide use in cotton in australia, brazil, india, … use in cotton in australia, brazil, india,...
TRANSCRIPT
Pesticide1 use in cotton in Australia, Brazil, India, Turkey and USA
1 Pesticides is a general term, that includes acaricides, biological pesticides, fungicides, herbicides,
inorganic pesticides, insecticides, molluscicides, plant growth regulators, nematicides, etc. However data were not available that listed all pesticides used in cotton in the selected countries, and so this report is not comprehensive with respect to pesticide use on cotton in the selected countries. In particular, no data on herbicide use were available. Therefore, while the term ‘pesticides’ is used throughout the report as shorthand for all the pesticides considered by this report, it should not be taken to mean that this report considers all pesticides used in cotton in the selected countries.

2

Pesticide use in cotton in Australia, Brazil, India, Turkey and USA M. de Blécourt J. Lahr P.J. van den Brink
Pesticide use in cotton Alterra, Wageningen, 2010

4

Alterra-AlterraReport_final A4.doc 5
Contents
Summary 9
1 Introduction 13 1.1 Context 13 1.2 Objective of this study 13 1.3 Countries 14 1.4 Approach 14 1.5 This report 14
2 Methods 17 2.1 Datasets 17 2.2 Trends in pesticide use 18 2.3 Hazard Indicators 18
2.3.1 Information on pesticide properties 18 2.3.2 Acute hazard to human health 19 2.3.3 Chronic hazard to human health 20 2.3.4 Hazard to aquatic organisms 21 2.3.5 Hazard to bees 22 2.3.6 Potential to leach to the groundwater 22
2.4 Environmental Toxic Load of pesticides use in cotton 223
3 Pesticide use 25 3.1 Overall trends 25 3.2 Insecticides 28 3.3 Trends in number of active ingredients 32
4 Evaluation of the hazards of pesticide use in cotton 35 4.1 Hazard to human health 35
4.1.1 Acute hazard to human health 35 4.1.2 Chronic hazard to human health 36
4.2 Hazard to aquatic life 39 4.2.1 Acute hazard to fish 39 4.2.2 Acute hazard to Daphnia 39 4.2.3 Hazard to algae 40
4.3 Hazard to bees 41 4.4 Potential to leach to the groundwater using GUS index 42
5 Environmental Toxic Load 45 5.1 Environmental Toxic Load for aquatic organisms 45
5.1.1 Environmental Toxic Load for fish 45 5.1.2 Environmental Toxic Load for Daphnia 46 5.1.3 Environmental Toxic Load for algae 47
5.2 Environmental Toxic Load for bees 48
6 Biotech cotton versus conventional cotton in Australia 51 6.1 Pesticide use 51 6.2 Hazards to human health 52

6
6.2.1 Acute hazard to human health 52 6.2.2 Carcinogenicity 53 6.2.3 Genotoxicity 53 6.2.4 Toxicity to reproduction 54
6.3 Environmental hazards 55 6.3.1 Acute hazard to fish 55 6.3.2 Acute hazard to Daphnia 55 6.3.3 Hazard to algae 56 6.3.4 Acute hazard to bees 57 6.3.5 Potential to leach to the groundwater using GUS index 58
6.4 Environmental Toxic Load 59
7 Discussion 63 7.1 Available data 63 7.2 Limitations of the methods 64 7.3 Trends in pesticide use 65 7.4 Human health hazards 65 7.5 Leaching to the groundwater 66 7.6 Environmental Toxic Loads 66 7.7 Impacts of biotech cotton 68
8 Conclusions 71 8.1 Pesticide use, human health hazards, and the Environmental Toxic Loads
71 8.2 Impact of biotech cotton crops 72
References 73
Appendi c e s 1 Dataset 2, formulations names and conversion rates 77 2 Physical properties of active ingredients 79 3 Toxicity of active ingredients 83 4 Functional and chemical groups 87 5 Annual data on pesticide use, cotton area and cotton yield 91 6 Human health hazards of active ingredients 92 7 Evaluation of the number of active ingredients applied 97 8 Australia, summary of tables and graphs 104 9 Brazil, summary of tables and graphs 111 10 India, summary of tables and graphs 121 11 Turkey, summary of tables and graphs 129 12 USA, summary of tables and graphs 137

7
About the authors
Ir. Marleen de Blécourt was born in 1982 in Roosendaal, The Netherlands. She studied Forest and Nature Conservation (BSc) and Soil Science at the Wageningen University, The Netherlands, where she graduated in 2007. She specialised in Land Science, Ecology and Soil Quality. From 2008 to 2009 she worked on Environmental Risk Assessment (ERA) in the tropics for the ERA team of the Centre for Water and Climate of the research institute Alterra, belonging to Wageningen University and Research centre (Wageningen UR). She is currently working as a PhD student on the development of carbon and biodiversity assets for multifunctional landscapes in the Upper Mekong river at the Büsgen-Institute of Soil Science of Tropical and Subtropical Ecosystems of the Georg-August University of Goettingen, Germany. Dr. ir. Joost Lahr (1962) studied Environmental Science at the Wageningen University and specialised in ecotoxicology. From 1991 to 1997 he lived and worked as an expert for the FAO in Senegal, West-Africa, where he conducted research on ecological side-effects of pesticides in surface waters caused by locust control. From 1998 to 2003 Joost Lahr worked for the private consultancy AquaSense in Amsterdam as a senior consultant. Since the end of 2003 Joost works at the Centre for Ecosystem Studies of Alterra, Wageningen UR, as a research scientist on ERA where he is involved as a project leader in various projects in the field of pesticides, veterinary pharmaceuticals, heavy metals, endocrine disruptors, biomarkers, soil functioning, agrobiodiversity and risk mapping. Joost published over 20 peer-reviewed scientific articles and several dozens of reports in the field of ERA. Prof. dr. ir. Paul J. Van den Brink (1968) is a professor of chemical stress ecology and works at Alterra and the Aquatic Ecology and Water Quality Management Group of Wageningen University, both belonging to Wageningen UR. Recent research topics are the development of effect models (e.g. food web, meta-population and expert base models), Trait based Ecological Risk Assessment (TERA) and human and ecological risk assessment of pesticide use in developing countries in the tropics. Since 1994, Paul van den Brink has published over 100 peer reviewed papers and book chapters, for two of which he won an international prize. In 2006 Paul won the LRI-SETAC Innovative Science Award. He also organized and took part in many international workshops and courses. Paul van den Brink is presently an editor of the journal: ‘Environmental Toxicology and Chemistry’. He is also the immediate past-president of SETAC (Society of Environmental Toxicology and Chemistry) Europe and vice-president of SETAC World.

9
Summary
Synthetic pesticides are widely used in agriculture to control crop losses caused by pests. In the 1990s, the use of pesticides on cotton peaked; accounting for one quarter of the global annual value, equivalent to US$ 2 to 3 billion. In 2008 the global insecticides share used on cotton had declined from 19% (2000) to 15.7%. In the same year, cotton’s pesticide consumption accounted for 6.8% of global use. The goal of this study was to provide the ICAC Expert Panel on Social, Environmental and Economic Performance (SEEP) with information on pesticide use in cotton and to assess the hazards of the studied pesticides used in cotton on human health and the environment. Herbicides on cotton are used only in some countries and were not included in this comparative study. Hazard is the potential of a pesticide to cause adverse effects to an organism, whereas a risk is the probability that an adverse effect occurs. It should be noted that the hazard assessment does not represent the actual risk in the field since local risks depend on many factors that are not explicitly taken into account in these generic assessments, such as exposure, pesticide formulation, soil properties, conditions during application, use of personal protective equipment, method of application, buffer strips and other mitigation techniques; the species that do actually occur in the fields, etc.. The study aims to provide an: 1. Analysis of recent trends in the use of pesticides on cotton in five cotton growing
countries: Australia, Brazil, India, Turkey, and the USA. 2. Evaluation of the hazards of pesticide use on cotton on human health and the
environment in the same countries. The study includes a period of 14 years: Australia (1995 – 2007), Brazil, India, Turkey and the USA (1994 – 2006). Biotech cotton varieties were introduced in Australia in 1997, in Brazil in 2007, in India in 2002, and in the USA in 1996. As of 2009, Turkey has not introduced biotech cotton varieties. Two datasets were used. They included data on the use of active ingredients (a.i.) belonging to the functional groups: acaricides, biological pesticides, fungicides, inorganic pesticides, insecticides, molluscicide and nematicides. For the purposes of this report the term “pesticide” will apply only to those groups. The first dataset included information about yearly use of active ingredients in cotton for the five countries. For each active ingredient this dataset contained information on chemical group, area treated, amount used, and the application rate (kg a.i./ha). There was no distinction between cotton types. For Brazil, India, Turkey and the USA this information was only available for three years: 1994, 2000 and 2006. For Australia, information was available for five years: 1995, 1999, 2000, 2001 and 2002. The

10
second dataset contained information on pesticide use in conventional cotton and biotech cotton (represented by Bollgard® cotton), but only for Australia and for the period 2003-2007. The information in this dataset was limited to the active ingredients applied, the application rate used (kg a.i./ha) during each season in the period and the total areas of both types of cotton. The available data was analyzed with respect to:
1. Overall pesticide use and use of different types of pesticides, 2. Hazard to human health and the environment, and 3. Environmental Toxic Load (ETL), a concept newly developed by the authors
of this study. The hazard assessments were used to rank pesticides relative to each other in terms of expected hazard. The new ETL indicator represents the average amount of toxic pressure by the pesticide applied on one (1) hectare of cotton in one (1) year. The ETL can only be used to evaluate the impact of changes in pesticide use on environmental hazards between years and countries. The indicator is based on the quantitative information on pesticide use and the environmental toxicity of the pesticides considered. With this indicator, the pesticides can be identified that pose the highest average overall hazard to fish, aquatic invertebrates, algae and bees. Trends in pesticide use in cotton during the 14 years of this study show that Brazil was the only nation of the five investigated countries where the average amount of pesticides applied per hectare of cotton increased consistently. The use in Brazil tripled during the period 1994-2006, and by 2006 was 4 - 8 times higher than in the other countries. In Australia, the average amount of pesticides applied per hectare peaked in 1999, at 12.2 kg a.i./ha, but by 2007 had decreased to 1.0 kg a.i./ha. In the other three countries no clear trends were distinguished. However pesticide use per hectare in 2006 was lower than in 1994 in all three, India, Turkey and the USA. The average use per hectare of active ingredients that are extremely to highly hazardous (WHO Class I) to human health decreased over time in all of the five countries. The ETL of fish, aquatic invertebrates, and bees increased in Brazil. In 2006 the ETLs ranged from 3 - 27 times higher in Brazil than in the other four countries. In all other countries, the ETL decreased during the same period. Analysis of data on pesticide use in Australia in the years 2003 - 2007 in both biotech and conventional cottons showed that the average amount of pesticides applied per hectare was much higher in conventional cotton than in biotech cotton. The ETLs associated were also much higher in conventional cotton than in biotech cotton. However, with regard to acute human health hazards, the differences were much less pronounced. In Australia, India and the USA, where biotech cotton varieties have been introduced, an overall decrease in pesticide use was observed in the years following the introduction. Given the findings for Australia, it is plausible that the introduction of biotech cotton varieties contributed to these changes in pesticide use. However,
11
the three countries have also made significant investements in other pesticide reduction statregies (e.g., IPM programmes and policies, changes in pesticide registration policies, etc.) that have likely contributed to changes in pesticide use, which were not investigated as part of this study. Other causal factors like weather or pest load were also not analysed. This downward change in pesticide use was not observed in Brazil, the fourth country in the study growing biotech cotton varieties.


13
1 Introduction
1.1 Context
In the 1990s, the use of pesticides on cotton peaked, the annual value of pesticide use was estimated to be one quarter of the global annual value, equivalent to US$ 2 to 3 billion (Murray 1994 as cited in Banuri 1999). According to Cropnosis, a private company in the UK, plant protection chemicals worth US$44 billion were used globally in agriculture in 2008. Almost half of these were herbicides to control weeds. Plant protection chemicals worth three billion US dollars were used on cotton in 2008, which is almost 7% of all plant protection chemicals. In terms of value, 5% of all herbicides and 16% of all the insecticides used in the world in 2008 were applied to grow cotton on 30.7 million hectares. The insecticides share of the global use on cotton has declined from 19% in 2000 to 15.7% in 2008. Although official statistics on global and by-country utilization of active ingredients on cotton are not available to make an objective assessment of the new use levels, significant reductions in insecticide use on cotton starting from about 2000 are reported by many cotton-producing countries (see for example Kranthi and Russell, 2009, for India). Therefore SEEP asked Alterra Wageningen UR to carry out a study on pesticide use in cotton in 5 countries. In 4 of these countries, biotech cotton has been introduced. 1.2 Objective of this study
The goal of this study was to provide SEEP with information on pesticide use in cotton and to assess the hazards associated with the pesticides used in cotton on human health and the environment. Hazard is the potential of a pesticide to cause adverse effects to an organism whereas a risk is the probability that an adverse effect occurs. It should be noted that the hazard assessment do not represent the actual risk in the field since local risks depend on many more factors that are not explicitly taken into account in these generic assessments such as pesticide formulation, soil properties, conditions during application, use of personal protective equipment, method of application, buffer strips and other mitigation techniques; the species that do actually occur in the fields, etc.. The study aims to provide an:
1. Analysis of recent trends – over 14 years (1994-2007), in the use of pesticides on cotton in five countries: Australia, Brazil, India, Turkey, and United States of America.

14
2. Evaluation of the hazards of pesticide use on cotton on human health and the environment in the same countries.
In this study an overview is given of the trends over the 14 years and a comparison is made between the selected countries. 1.3 Countries
The study includes five cotton growing countries: Australia, Brazil, India, Turkey and USA. In four of these countries biotech cotton varieties have been introduced, namely in Australia in 1997, Brazil in 2007, India in 2002, and USA in 1996. As of 2009, Turkey has not introduced biotech cotton varieties. 1.4 Approach
This desk study was based on: 1) Quantitative information on pesticide use in cotton provided to Alterra by SEEP 2) Hazard assessments based on eco-toxicological data derived from databases 3) A newly developed indicator (ETL) for the environmental toxic load of the
pesticides. The hazard assessments were used to rank pesticides relative to each other in terms of hazard to human health and to the environment. The new Environmental Toxic Load (ETL) indicator developed by the research group represents the average amount of toxic pressure caused by the application of pesticides on one (1) hectare of cotton in one (1) year. The ETL can only be used to evaluate the impact of changes in pesticide use on environmental hazards between years and countries. The indicator is based on the quantitative information on pesticide use and the environmental toxicity of the considered pesticides. With this indicator, pesticides can be identified that most likely pose a potential problem to the environment. 1.5 This report
This report starts with a brief introduction of the methods. Chapter 3 gives an overview of the trends over time of the amounts and types of pesticides used in cotton. In Chapter 4 the human health and environmental hazards of the pesticides used in cotton are evaluated. Changes in the hazard profile of the pesticides used over time are explored and these trends are related to changes in pesticide use. Chapter 5 describes the ETL of pesticides used in cotton. In Chapter 6 a comparison is made between biotech cotton and conventional cotton in terms of pesticide use, the associated hazards and ETL in Australia. Chapter 7 and 8 provide, respectively, the discussion and conclusions based on the findings in the previous chapters.

15
Every chapter in this report gives a description of the general trends and a comparison between the included countries. Appendices 8-12 summarize per country the tables and graphs on pesticide use, hazards and ETLs.


17
2 Methods
The following activities were carried out in this study: • Trends in pesticide use over 14 years were analysed, in terms of the types of
pesticides used (functional groups and chemical groups) and the amounts of pesticides applied in cotton (total weight and kg a.i./ha).
• Pesticide hazard assessments were performed with regard to human health and environment. The pesticide parameters required for these hazard assessments were gathered from international databases.
• Trends over time were analysed of hazards of pesticides used in cotton with regards to human health and environment; and related to the trends in pesticide use.
• Trends over time were analysed of the ETL of pesticides used in cotton. • For Australia, a comparison was made between biotech cotton (Bollgard®) and
conventional cotton in terms of pesticide use, the associated hazards and ETLs for the years 2003-2007.
2.1 Datasets
Information on pesticide use in cotton in Australia, Brazil, India, Turkey and USA originated from GfK Kynetec (hereafter referred to as Dataset 1). For each active ingredient this dataset contained information on: the functional group (e.g. insecticide, acaricide, fungicide, etc) and the chemical family of the active ingredients, area treated, amounts applied in cotton (kg a.i.), and the average amount of active ingredients applied per hectare of cotton (kg a.i./ha). No distinction was made between biotech cotton and non-biotech cotton. For Brazil, India, Turkey and USA data was available for the years 1994, 2000 and 2006. For Australia data was only available for the years 1995, 1999, 2000, 2001 and 2002. Data is included on active ingredients belonging to the functional groups: acaricides, biological pesticides, fungicides, inorganic pesticides, insecticides, molluscicides and nematicides. For the purposes of this report the term “pesticide” will apply only to those groups. It should be noted that herbicides were not included in this dataset, although they are used in cotton in a number of countries. For Australia a second dataset was available with information on pesticide use in conventional cotton and biotech cotton (hereafter referred to as Dataset 2). This dataset originated from Crop Consultants Australia Inc. (2007). The information in this dataset was limited to the product consumption per hectare in kg or L per formulated product. For the purpose of this study, this was converted to kg per hectare of active ingredient. This conversion was based on the active ingredients and concentrations as described by the pesticide formulation name (e.g. aldicarb). Based on expert knowledge and a review of a number of the product labels for the pesticides in question the assumption was made that the numbers refer to concentration in grams of active ingredient per kilogram or litre of applied product.

18
Appendix 1 lists the pesticide formulation names of Dataset 2 and the conversion factors used to convert the dose rate per formulated product into the dose rate per active ingredient. For conventional cotton and biotech data was available for the growing seasons in the period 2002/2003 – 2006/2007. The total amount of each formulated product used in respectively biotech and conventional cotton was calculated by multiplying the product consumption per hectare with the total area of respectively biotech cotton and conventional cotton in that year (Appendix 5). The areas of biotech cotton originated from Allan Williams (personal communication) and the conventional cotton area was derived from The Australian Cottongrower Yearbook (1990 to 2007). Dataset 2 did not provide information on the functional and chemical groups of the pesticides. These data were gathered from Dataset 1. Data in Dataset 1 report the usage as being in the year of harvest, while data in Dataset 2 describe the growing season; e.g. data in Dataset 1 reported as for 2003 is equivalent to the period 2002/2003 in Dataset 2. In this report the growing seasons of Dataset 2 are referred to as the corresponding years of dataset 1. 2.2 Trends in pesticide use
Trends in pesticide use in cotton over 14 years were explored in terms of type of pesticides used and amount of pesticides used in the selected countries. Trends in pesticide use were based on both the total amount of active ingredients used in a country; and the pesticide use in kilograms of active ingredient applied per hectare of cotton from year to year. 2.3 Hazard Indicators
Hazard based indicators were used to rank pesticides relative to each other from high to low hazard. Hazard is defined by the Organization for Economic Co-operation and Development (OECD, 2003) as ‘an inherent property of an agent or situation having the potential to cause adverse effects when an organism, system or (sub) population is exposed to that agent’. Hazard is determined by the toxicological properties of the pesticide. In this study hazard assessments were performed for: 1) acute hazard to human health (WHO classification), 2) chronic hazard to human health (carcinogenicity, genotoxicity, and effects on reproduction), 3) hazard to aquatic organisms (algae, Daphnia, and fish), 4) hazard to bees, and 5) potential of leaching to groundwater. The basis on which each of these hazards was assessed is described more fully, below. 2.3.1 Information on pesticide properties
Pesticide properties are required to perform hazard assessments. A search was performed using international databases (Table 2) to gather the required toxicological

19
properties for each active ingredient. Table 2 shows the data sources used, the type of data provided by the databases, and where they can be found on the internet. When several different values were reported in the literature the lowest (thereby ensuring a worst case scenario) is reported and used as basis of the classification, unless there are clear indications that a higher value is more reliable. Table 1 lists the parameters for which values were searched. The values of the properties are provided in Appendix 2 - 3.
Table 1: List of physico-chemical-toxicological properties used in the hazard assessments Property Description Unit DT50 Soil Half life degradation in soil Days KOC Sorption coefficient for organic carbon L/kg LD50 Bees Concentration that kills 50% of the bees. The most sensitive endpoint of
either the oral or contact LD50 was used. �g/bee
EC50 Algae Concentration that affects 50% of the test organisms, algae mg/L L(E)C50 Daphnia The lowest value of LC 50 or EC 50, Daphnia. LC50 is the concentration that
kills 50% of the test organisms and EC 50 is the concentration that immobilizes 50% of the test organisms.
mg/L
L(E)C50 Fish The lowest value of LC 50 or EC 50, fish. LC50 is the concentration that kills 50% of the test organisms and EC 50 is the concentration that affects 50% of the test organisms.
mg/L
NOEC Daphnia No Observed Effect Concentration of Daphnia mg/L NOEC Fish No Observed Effect Concentration of fish mg/L LD50 Rats Amount of toxicant per kg of bodyweight required to kill 50% of the test
animals mg/kg
Table 2: Details of databases for physicochemical and ecotoxicological data used in this study,
Database /Source
Type of data Created by Web source
FOOTPRINT physicochemical and ecotoxicological data
University of Hertfordshire, United Kingdom.
http://www.eu-footprint.org/ppdb.html
RIVM physicochemical and ecotoxicological data
RIVM (Dutch National Institute for Health and Environment)
Not available online
EU list of endpoints
physicochemical and ecotoxicological data
EU: Decision and review reports of active substances which are approbed by the EU (DIR 91/414/EEC)
http://ec.europa.eu/food/plant/protection/evaluation/dir91-414eec_en.htm
Ctgb physicochemical and ecotoxicological data
Dutch Board for the authorization of Plant Protection Products and Biocides
http://www.ctgb.nl/
Alterra database
physicochemical and ecotoxicological data
Alterra, Wageningen UR, The Netherlands
Not available online
ECOTOX ecotoxicological data U.S. Environmental Protection Agency
http://cfpub.epa.gov/ecotox/
2.3.2 Acute hazard to human health
The classification of active ingredients according to their acute toxicity to human health originated from ‘The World Health Organization Recommended Classification of Pesticides by Hazard’ (World Health Organisation, 2005). The hazard referred to is the acute risk to health (that is, the risk of single or multiple exposures over a relatively short period of time) that might be encountered
20
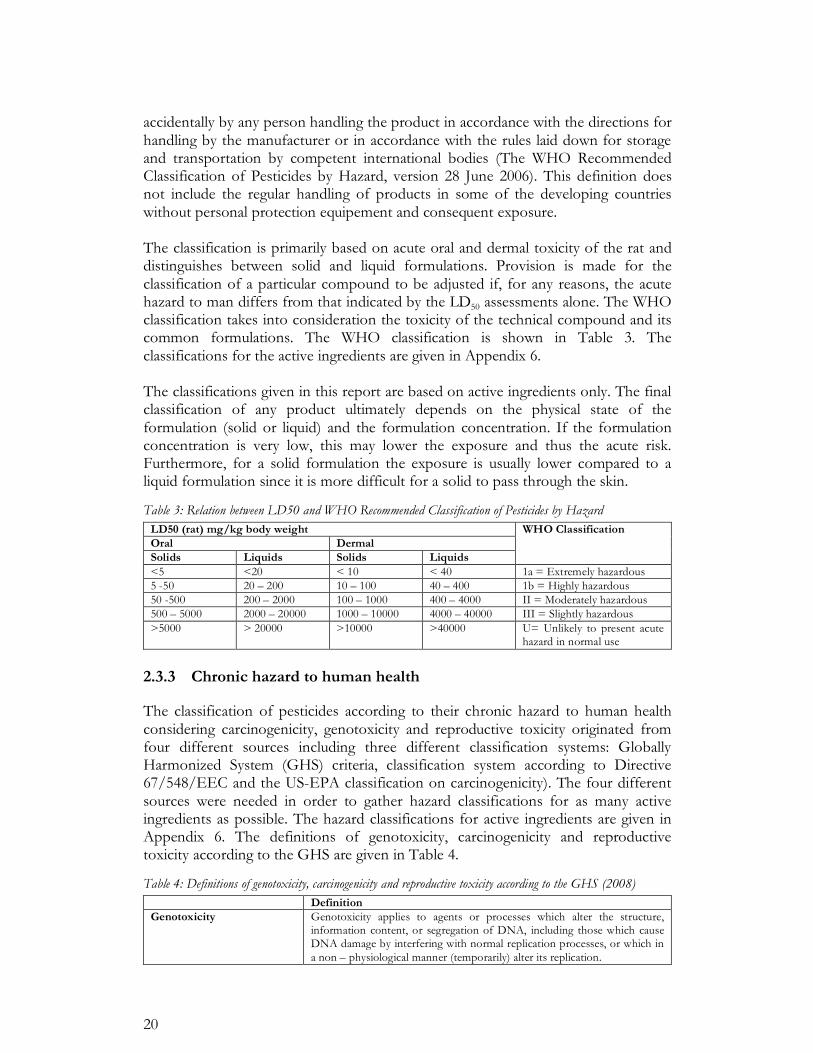
accidentally by any person handling the product in accordance with the directions for handling by the manufacturer or in accordance with the rules laid down for storage and transportation by competent international bodies (The WHO Recommended Classification of Pesticides by Hazard, version 28 June 2006). This definition does not include the regular handling of products in some of the developing countries without personal protection equipement and consequent exposure. The classification is primarily based on acute oral and dermal toxicity of the rat and distinguishes between solid and liquid formulations. Provision is made for the classification of a particular compound to be adjusted if, for any reasons, the acute hazard to man differs from that indicated by the LD50 assessments alone. The WHO classification takes into consideration the toxicity of the technical compound and its common formulations. The WHO classification is shown in Table 3. The classifications for the active ingredients are given in Appendix 6. The classifications given in this report are based on active ingredients only. The final classification of any product ultimately depends on the physical state of the formulation (solid or liquid) and the formulation concentration. If the formulation concentration is very low, this may lower the exposure and thus the acute risk. Furthermore, for a solid formulation the exposure is usually lower compared to a liquid formulation since it is more difficult for a solid to pass through the skin.
Table 3: Relation between LD50 and WHO Recommended Classification of Pesticides by Hazard LD50 (rat) mg/kg body weight Oral Dermal Solids Liquids Solids Liquids
WHO Classification
<5 <20 < 10 < 40 1a = Extremely hazardous 5 -50 20 – 200 10 – 100 40 – 400 1b = Highly hazardous 50 -500 200 – 2000 100 – 1000 400 – 4000 II = Moderately hazardous 500 – 5000 2000 – 20000 1000 – 10000 4000 – 40000 III = Slightly hazardous >5000 > 20000 >10000 >40000 U= Unlikely to present acute
hazard in normal use
2.3.3 Chronic hazard to human health
The classification of pesticides according to their chronic hazard to human health considering carcinogenicity, genotoxicity and reproductive toxicity originated from four different sources including three different classification systems: Globally Harmonized System (GHS) criteria, classification system according to Directive 67/548/EEC and the US-EPA classification on carcinogenicity). The four different sources were needed in order to gather hazard classifications for as many active ingredients as possible. The hazard classifications for active ingredients are given in Appendix 6. The definitions of genotoxicity, carcinogenicity and reproductive toxicity according to the GHS are given in Table 4.
Table 4: Definitions of genotoxicity, carcinogenicity and reproductive toxicity according to the GHS (2008) Definition Genotoxicity Genotoxicity applies to agents or processes which alter the structure,
information content, or segregation of DNA, including those which cause DNA damage by interfering with normal replication processes, or which in a non – physiological manner (temporarily) alter its replication.

21
Carcinogenicity Carcinogen means a substance or a mixture of substances which induce cancer or increase its incidence. Substances which have induced benign and malignant tumours in well performed experimental studies on animals are considered also to be presumed or suspected human carcinogens unless there is strong evidence that the mechanism of tumour formation is not relevant for humans.
Reproductive toxicity Reproductive toxicity includes 1) adverse effects on sexual function and fertility in adult males and females, 2) adverse effects on developmental toxicity in the offspring, and 3) Adverse effects on or via lactation.
The sources and classification systems used were, listed in order of choice: 1. The first classification system used was the Globally Harmonized System (GHS)
of Classification and Labeling of Chemicals. The GHS is a new UN-based system that aims to ensure that chemical hazards will be described and labeled in the same way all around the world. The GHS criteria were implemented in the EU legislation on 20 January 2009. Information on classification of active ingredients according to the GHS criteria was derived from the list of harmonized classification and labeling of hazardous substances on the website: http://ecb.jrc.ec.europa.eu/classification-labelling/ (retrieved in July, 2009).
2. Not all active ingredients of pesticides are classified according to the GHS criteria. For these active ingredients the former classification system of the European Union, according to Directive 67/548/EEC, was used. The classification of active ingredients according to Directive 67/548/EEC is derived from the CLASSLAB database found on the website: http://ecb.jrc.ec.europa.eu/classification-labelling/search-classlab/ (retrieved in July, 2009).
3. In case the active ingredients were not classified according to either of the above mentioned classification systems, the US - EPA’s list of potential carcinogenicity (list provided on request via US-EPA website: http://epa.gov/pesticides/carlist/) (July, 2009) or the draft assessment reports from the European Food Safety Authority (EFSA) available at: http://dar.efsa.europa.eu/dar-web/provision (retrieved in July, 2009) was used.
2.3.4 Hazard to aquatic organisms
The classification criteria for acute toxicity to algae is the concentration that affects 50% of the test organisms (EC50). Similarly, acute toxicity to fish and the water flea Daphnia representing aquatic invertebrates is based on acute EC50 or LC50 (concentration that kills 50% of the test organisms). Where several EC50 or LC50 values were available the lowest value given was used for classification. The classification of pesticides according to acute toxicity to aquatic organisms is listed in Table 5. The classification originated from the US-EPA http://www.epa.gov/oppefed1/ecorisk_ders/toera_analysis_eco.htm (retrieved in July 2009).
Table 5: Classification for acute toxicity to aquatic organisms LC50 or EC50 (mg/L) Acute hazard to aquatic organisms < 0.1 Very highly toxic 0.1 – 1 Highly toxic 1 – 10 Moderately toxic 10 - 100 Slightly toxic >100 Practically nontoxic

22
2.3.5 Hazard to bees
The classification of pesticides according to their acute toxicity to bees is based on the concentration that kills 50% of bees (oral or contact LD50). The most sensitive endpoint of either the oral or contact LD50 was used. The classification of pesticides toxic to bees is listed in Table 6. The classification originated from the manual for summarizing and evaluating the environmental aspects of plant protection products published by the Dutch National Institute for Public Health and the Environment (RIVM, 1995).
Table 6: Classification for contact or oral toxicity to bees LD50 (�g / bee) Hazard to bees < 0.1 Highly toxic 0.1 – 1 Toxic 1 – 10 Moderately toxic 10 – 100 Slightly toxic > 100 Very slightly toxic
2.3.6 Potential to leach to groundwater
The Groundwater Ubiquity Score or GUS (Gustafson, 1989) is an indication of the potential of a pesticide to reach the groundwater before it is degraded. GUS is an empirically derived value that relates pesticides persistence (half-life time, DT50) and sorption to soil (sorption coefficient; KOC). The GUS index is calculated as follows: GUS = log (DT50) x [4 – log (KOC)] The pesticide leaching rating is derived from GUS. Movement ratings range from very low to very high. The GUS were classified as indicated in Table 7.Table 7: Relation between GUS and potential to leach to groundwater
GUS Potential to leach to groundwater <1 Very Low 1.0-2.0 Low 2.0-3.0 Moderate 3.0-4.0 High >4.0 Very high
2.4 Environmental Toxic Load of pesticides used in cotton
The Environmental Toxic Load (ETL) indicator represents the average amount of toxic pressure by pesticides applied on one (1) hectare of cotton in one (1) year. Toxicity is mediated by the fact that only a small proportion of the pesticide volume will reach the organism. Dissipation processes like degradation and sorption are not taken into account. A similar approach has been used by Benbrook et al. (2002).

23
The ETL indicator is calculated separately for algae, fish, Daphnia and bees. The ETL is based on the total applied pesticide amount per year (a.i. applied in kg per yr), the L(E)C50 for algae, Daphnia or fish and the LD50 for bees, and the total cotton area (ha):
!"#$%
&'
=AI CottonArea
TAIweight
ETL
a.i. weight = The total weight of an active ingredient used in cotton in 1 year (kg). T = L(E)C50 of either algae, Daphnia or fish (mg/L); or the LD50 of
bees (�g/bee) Cotton Area = Total cotton area (ha) For example, if in a fictituous country with a cotton area 12000 ha the total use of pesticide X with a LC50 for Daphnia of 10 mg/L is 600 kg in a certain year and the use of pesticide Y with a LC50 for Daphnia of 100 mg/L amounts to 9000 kg in the same year, the ETL for Daphnia is calculated as (600/10)/12000 + (9000/100)/12000, which is equal to 0.0125. The ETL can only be used to evaluate the impact of changes in relative environmental hazards between pesticides, between years and between countries (see section 7.2 for more discussion). Furthermore, since toxicity data for bees (LD50) are expressed on the basis of �g/bee the ETL for bees cannot be compared to the ETL values for the aquatic organisms for which the toxicity (LC50) is expressed in mg/L. However, since the same units for toxicity are used for algae, Daphnia and fish it is justified to compare ETL’s between these aquatic organisms. For instance it is possible to indicate if the pesticide use in cotton in a certain country in a given year poses a higher overall potential hazard to algae than to fish. If the ETL for algae is 10 and the ETL for fish 1000 in a country in a certain year, the overall hazard of the pesticide use in cotton is 100 times more hazardous to fish than to algae on the average. It is worth noting that in comparing the ETL Figures presented in the reprot the significant differences in the axis scales should be considered. The ETL cannot be used to assess the actual risk (i.e., the probability of an adverse effect on organisms) as a consequence of pesticide treatments because there is no exposure assessment involved in its calculation. For instance there is no prediction of an environmental concentration (PEC) in water that can be compared with a ‘no effect concentration’ for water organisms (PEC/NEC analysis). This also implies that there cannot be fixed thresholds above which the ETL is dangerous or not. The indicator can only be used to compare average relative hazards to groups of organisms as outlined above. The data on cotton area per country was retrieved from the FAOSTAT database (http:/ /FAOSTAT.fao.org, retrieved July, 2009).

25
3 Pesticide use
This chapter provides insights into trends in the amounts and types of pesticides used in cotton in Australia between 1995 and 2007, and in Brazil, India, Turkey and the USA between 1994 and 2006. Appendices 8-12 provide a detailed description per country and list the ten most-used active ingredients in cotton in the year 2006 (for Australia in 2007). 3.1 Overall trends
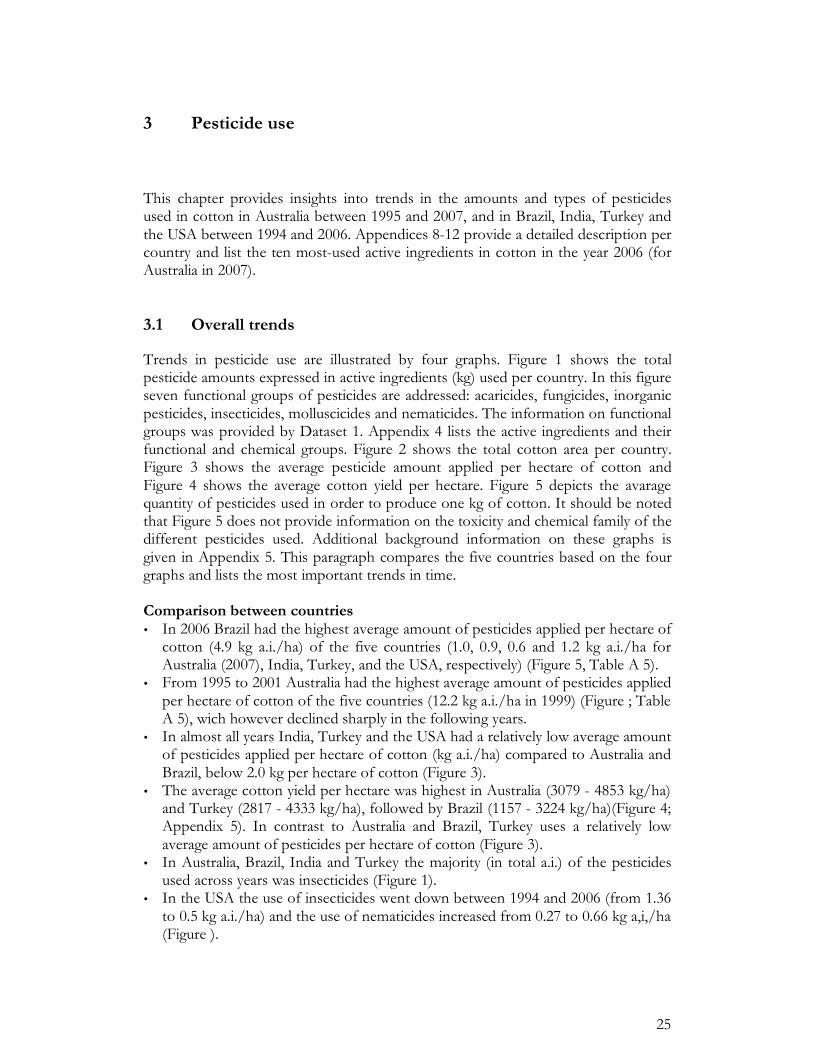
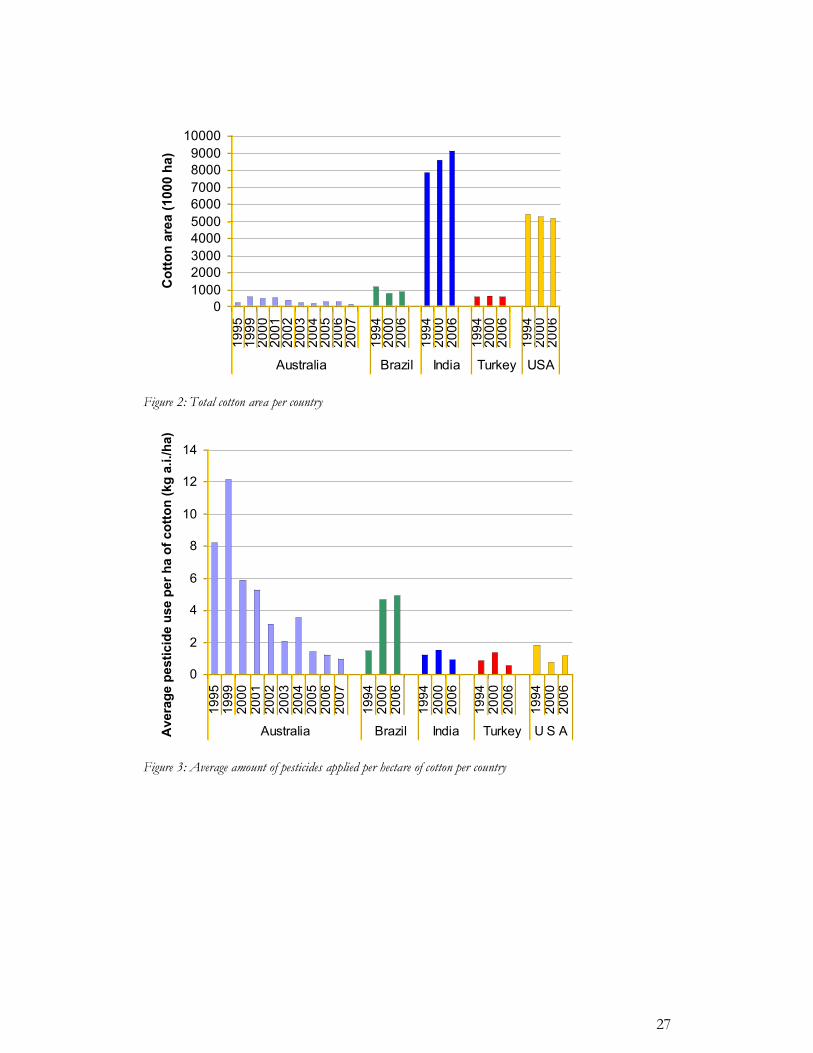
Trends in pesticide use are illustrated by four graphs. Figure 1 shows the total pesticide amounts expressed in active ingredients (kg) used per country. In this figure seven functional groups of pesticides are addressed: acaricides, fungicides, inorganic pesticides, insecticides, molluscicides and nematicides. The information on functional groups was provided by Dataset 1. Appendix 4 lists the active ingredients and their functional and chemical groups. Figure 2 shows the total cotton area per country. Figure 3 shows the average pesticide amount applied per hectare of cotton and Figure 4 shows the average cotton yield per hectare. Figure 5 depicts the avarage quantity of pesticides used in order to produce one kg of cotton. It should be noted that Figure 5 does not provide information on the toxicity and chemical family of the different pesticides used. Additional background information on these graphs is given in Appendix 5. This paragraph compares the five countries based on the four graphs and lists the most important trends in time. Comparison between countries • In 2006 Brazil had the highest average amount of pesticides applied per hectare of
cotton (4.9 kg a.i./ha) of the five countries (1.0, 0.9, 0.6 and 1.2 kg a.i./ha for Australia (2007), India, Turkey, and the USA, respectively) (Figure 5, Table A 5).
• From 1995 to 2001 Australia had the highest average amount of pesticides applied per hectare of cotton of the five countries (12.2 kg a.i./ha in 1999) (Figure ; Table A 5), wich however declined sharply in the following years.
• In almost all years India, Turkey and the USA had a relatively low average amount of pesticides applied per hectare of cotton (kg a.i./ha) compared to Australia and Brazil, below 2.0 kg per hectare of cotton (Figure 3).
• The average cotton yield per hectare was highest in Australia (3079 - 4853 kg/ha) and Turkey (2817 - 4333 kg/ha), followed by Brazil (1157 - 3224 kg/ha)(Figure 4; Appendix 5). In contrast to Australia and Brazil, Turkey uses a relatively low average amount of pesticides per hectare of cotton (Figure 3).
• In Australia, Brazil, India and Turkey the majority (in total a.i.) of the pesticides used across years was insecticides (Figure 1).
• In the USA the use of insecticides went down between 1994 and 2006 (from 1.36 to 0.5 kg a.i./ha) and the use of nematicides increased from 0.27 to 0.66 kg a,i,/ha (Figure ).

26
Most important trends • In Brazil the average amount of pesticides applied per hectare of cotton increased
between 1994 and 2006 (Figure 3) as did the average cotton yield per hectare (Figure 4
• In Australia the average amount of pesticides used per hectare of cotton and per kg of cotton produced peaked in 1999 (Figure 3, Figure 5). Between 1999 and 2007 the average amount of pesticides used per hectare of cotton decreased (Figure 3), while the average cotton yield per hectare increased (Figure 4).
• In India, Turkey and USA the average amount of pesticides used per hectare of cotton (kg a.i./ha) fluctuated over time, although it was lower in 2006 compared to 1994 for all three countries (Figure 3).
• In Turkey the average cotton yield per hectare increased (Figure 4) while the average amount of pesticides applied per hectare of cotton showed minimal change between 1994 and 2006 (Figure 2).
• In Brazil, Turkey and, in particular, the USA changes in cotton area between 1994 and 2006 were not exceptionally large (Figure 2). This indicates that in these three countries yearly changes in the average amount of pesticides applied per hectare of cotton (Figure 3) are mainly caused by changes in pesticide use.
0
2000
4000
6000
8000
10000
12000
14000
1995
1999
2000
2001
2002
2003
2004
2005
2006
2007
1994
2000
2006
1994
2000
2006
1994
2000
2006
1994
2000
2006
Australia Brazil India Turkey U S A
Total amount of pesticides used
(1000 kg a.i)
Nematicides
Molluscicides
Insecticides
Inorganic pesticides
Fungicides
Biological pesticides
Acaricides
Figure 1: Total amount of different types of pesticides applied per country
27
0
1000
2000
3000
4000
5000
6000
7000
8000
9000
10000
1995
1999
2000
2001
2002
2003
2004
2005
2006
2007
1994
2000
2006
1994
2000
2006
1994
2000
2006
1994
2000
2006
Australia Brazil India Turkey USA
Co
tto
n a
rea (
1000 h
a)
Figure 2: Total cotton area per country
0
2
4
6
8
10
12
14
19
95
19
99
20
00
20
01
20
02
20
03
20
04
20
05
20
06
20
07
19
94
20
00
20
06
19
94
20
00
20
06
19
94
20
00
20
06
19
94
20
00
20
06
Australia Brazil India Turkey U S AAvera
ge p
esti
cid
e u
se p
er
ha o
f co
tto
n (
kg
a.i./h
a)
Figure 3: Average amount of pesticides applied per hectare of cotton per country

28
0
500
1000
1500
2000
2500
1995
1999
2000
2001
2002
2003
2004
2005
2006
2007
1994
2000
2006
1994
2000
2006
1994
2000
2006
1994
2000
2006
Australia Brazil India Turkey U S A
Av
era
ge
co
tto
n y
ield
(K
g l
int
co
tto
n/h
a)
Figure 4: Average cotton yield per hectare of cotton per country
0
2
4
6
8
10
12
1995
1999
2000
2001
2002
2003
2004
2005
2006
2007
1994
2000
2006
1994
2000
2006
1994
2000
2006
1994
2000
2006
Australia Brazil India Turkey U S A
Avera
ge p
esti
cid
e u
se (
gr.
a.i./K
g lin
t co
tto
n)
Figure 5: Average pesticide use per kg of lint cotton per country
3.2 Insecticides
Insecticides are the major group of pesticides used in cotton in all five countries (Figure 1). Therefore this section focuses on trends in the use of insecticides and changes in the types of insecticides used based on the chemical family of the insecticides. Biological insecticides were excluded, since data on their chemical groups are lacking in the datasets. General descriptions of the most important chemical groups are given in Table 8. The average amount of insecticides applied per hectare of cotton per country per year is shown in Figure 6. Figure 7 shows the total amount used of different types of insecticides. The distribution shown in Figure 8 is based on percentage of the total insecticide amount used and the distribution. In this section the most important trends are listed and the general trends per insecticide group are described.

29
Table 81: General description of the most important chemical groups of insecticides (Walker et al., 2001)
Chemical group General description Carbamates Carbamate insecticides are used to control insect pests, and
they also have some use for control of nematodes and mollusks. They are derivatives of carbamic acids and they act as inhibitors of acetylcholinesterase. They vary greatly in water solubility. They are readily degradable and do not usually raise problems of persistence. The main hazards they present relate to acute toxicity. Some of them act as systemic insecticides (e.g. aldicarb and carbofuran)
Nicotinoids Nicotinoids or neonicotinoids are applied against insect pests. They are relatively new insecticides. Nicotinoid act on the central nervous system of insects.
Organochlorines and cyclodienes
Organochlorine insecticides are a relatively large group of insecticides with a high diversity of structures, properties and uses. The first synthetic organochlorine insecticide, DDT, was discovered in 1939. The organochlorine compounds that were applied in the investigated countries were the hexachlorocyclohexane lindane and the cyclodiene insecticide endosulfan. These insecticides act by disrupting the insects’ nervous system. Most organochlorines are relatively insoluble, persistent in soils and aquatic ecosystems, and bioconcentrate in the tissues of invertebrates and vertebrates.
Organophosphates and phosphormidothioates Interest in organophosphorous insecticides developed during World War II. Organophosphates are organic esters of phosphorus acids and act as an inhibitor of the nervous system enzyme acetylcholinesterase. The environmental hazards they present are mainly, but not exclusively, associated with acute toxicity. They are, in general, less stable than organochlorine insecticides and are more readily broken down. Some organophosphates can be effective systemic insecticides. Phosphoramidothioate insecticides are also organophosphorous compounds. The Phosphora-midothioate used in the investigated countries was acephate.
Pyrethroids Pyrethroids were introduced in the 1960s. Pyrethroids act as neurotoxins. Their chemical structure is similar to the natural chemical pyrethrine produced by flowers of pyrethrums (Chrysanthemum spp). They do not bioaccumulate as they are readily biodegradable and do not have a long biological half-life. Pyrethroids bind to soil particles and show persistence in sediments and soil. Pyrethroids are not used as systemic insecticides. The hazards they present relate mainly to acute toxicity. The main environmental concerns relate to their toxicity to fish and non-target invertebrates.
Most important trends in time • In Brazil, India Turkey and USA between 1994 and 2006, organophosphate
compounds (including phosphoramidothioate compounds) were the most important insecticide group applied in cotton, except for Turkey in 2006 where carbamates were an important group as well (Figure 7).
• In Australia between 1995 and 2007, organophosphate compounds and cyclodiene were the most important insecticide groups, except for 2001 when the use of cyclodiene was strongly reduced.
30
Trends per insecticide group Organophosphate compounds (including phosphoramidothioates): • The main insecticides used in all countries were organophosphate compounds
(Figure 8). • In Australia (1995-2007) and USA (1994 – 2006) the total amount used per year
of organophosphate compounds (including phosphoramidothioates) decreased (Figure 7).
• In Brazil, India and USA the use of phosphoramidothioate compounds (exclusively acephate) increased between 1994 and 2006 while in Australia (1995 -2002) and Turkey (1994 – 2006) the phosphoramidothioate compounds constituted less than 1% of the total amount of insecticides used (Figure 7).
Carbamates: • The total amount of carbamate compounds used decreased in Australia between
1995 and 2007 and in USA between 1994 and 2006 (Figure 7). Also the proportion of carbamates of the total amount of insecticides applied in cotton decreased in these time periods in these countries (Figure 8).
• In Brazil the total amount of carbamates used increased between 1994 and 2006 (Figure 7). Also the proportion of carbamates of the total amount of insecticides applied in cotton (Figure 8) increased in this period.
• In Turkey the proportion of carbamates of the total amount of insecticides applied in cotton increased between 1994 and 2006 (Figure 8).
Organochlorine compounds and cyclodiene organochlorines • India was the only country where lindane was still used in appreciable amounts in
1994 and 2000. In 2006 the total use amounted to only 2.788 kg of a.i. (Figure 7). • In Australia cyclodiene organochlorines (exclusively endosulfan) is the most
important insecticide group after organophosphates, although the total amount of cyclodiene used decreased between 1999 (2,232,000 kg a.i ) and 2007 by 95% (Figure 7).
• In Brazil, India, Turkey and USA the total amount of cyclodiene organochlorines (exclusively endosulfan) used decreased between 1994 and 2006. In 2006, India used 686,783 kg a.i., Brazil 509,110 kg a.i., Turkey 24,480 kg a.i and USA 10,793 kg a.i of endosulfan.

31
0
2
4
6
8
10
12
19
95
19
99
20
00
20
01
20
02
20
03
20
04
20
05
20
06
20
07
19
94
20
00
20
06
19
94
20
00
20
06
19
94
20
00
20
06
19
94
20
00
20
06
Australia Brazil India Turkey U S A
Avera
ge in
secti
cid
e u
se p
er
ha o
f co
tto
n
(kg
a.i./h
a)
Figure 6: Average total amounts of insecticides applied per hectare of cotton
0
2000
4000
6000
8000
10000
12000
14000
1995
1999
2000
2001
2002
2003
2004
2005
2006
2007
1994
2000
2006
1994
2000
2006
1994
2000
2006
1994
2000
2006
Australia Brazil India Turkey U S A
To
tal w
eig
ht
of
insecti
cid
es u
sed
(1000 k
g a
.i.)
Thiourea
Pyrethroid
Phosphoramidothioate
Organophosphate
Organochlorine
Nicotinoid
Fumigant
Cyclodiene
Carbamate
Others
Figure 7: Total amount of different types of insecticides applied per country
32
0
10
20
30
40
50
60
70
80
90
100
1995
1999
2000
2001
2002
2003
2004
2005
2006
2007
1994
2000
2006
1994
2000
2006
1994
2000
2006
1994
2000
2006
Australia Brazil India Turkey U S A
a.i w
eig
ht
in %
of
tota
l w
eig
ht
Thiourea
Pyrethroid
Phosphoramidothioate
Organophosphate
Organochlorine
Nicotinoid
Fumigant
Cyclodiene
Carbamate
Others
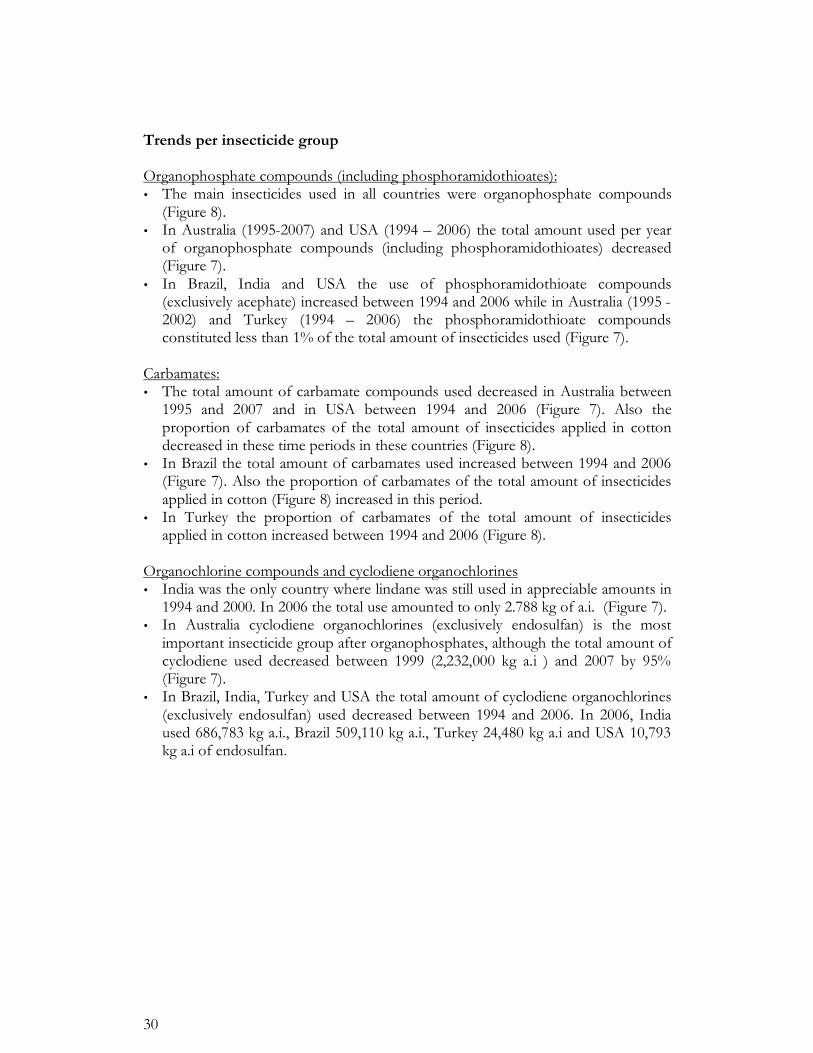
Figure 8: Proportion of different insecticides of the total amount applied per country per year
3.3 Trends in number of active ingredients
Figure 9 shows the changes over time of the number of active ingredients used in cotton in each country. Appendices 8-12 provide a detailed overview per country on the ten active ingredients with: i) highest use in 2006; ii) the greatest decrease in use in the investigated time period; and iii) the strongest increase in the investigated time period. Most important trends • Overall Australia used the smallest number of different active ingredients in
cotton (Figure 9). • The number of active ingredients used in cotton increased over time in Australia,
and India (Figure 9). However in Australia the increase was not continuous. • There was no clear trend in the number of active ingredients used in cotton in
Brazil, Turkey and USA. The number fluctuated over time (Figure 9).

33
0
10
20
30
40
50
60
70
19
95
19
99
20
00
20
01
20
02
20
03
20
04
20
05
20
06
20
07
19
94
20
00
20
06
19
94
20
00
20
06
19
94
20
00
20
06
19
94
20
00
20
06
Australia Brazil India Turkey U S A
Nu
mb
er
of
Acti
ve In
gre
die
nts
Figure 9: The number of active ingredients used in cotton per country per year.


35
4 Evaluation of the hazards of pesticide use in cotton
This chapter provides insight into the human health and environmental hazards of the pesticides used in cotton (biopesticides are not included). Hazard estimations were made for five hazard indicators: • acute toxicity to human health • chronic hazards to human health • acute hazard to aquatic organisms (fish, Daphnia and algae) • acute hazard to bees • leaching potential to groundwater. Listed for each country are the most-applied active ingredients in 2006 that have a high to very high toxicity to human health (acute and chronic) and for leaching to groundwater. The most applied active ingredients in cotton that have a high to very high toxicity to aquatic organisms and bees are listed in Chapter 5. Appendices 8-12 provide information per country on all active ingredients used in cotton that are highly to very highly hazardous to the environment or human health. 4.1 Hazard to human health
4.1.1 Acute hazard to human health
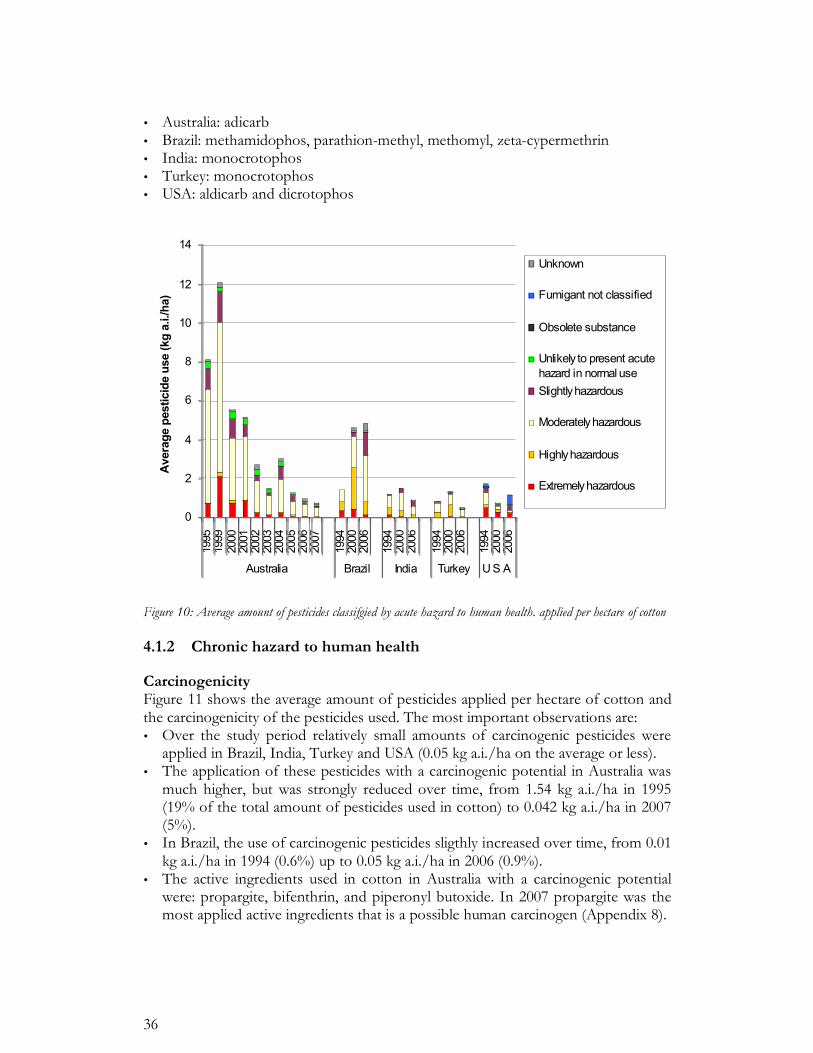
Figure 10 (with additional information in Appendices 8-12) shows the average amount of pesticides applied per hectare of cotton and shows the toxicity of the pesticides to human health. The most important observations are: • In 2006 Brazil applied the highest average amount of highly hazardous and
extremely hazardous substances per hectare of cotton (0.89 kg a.i./ha) of the five countries. However, the use of highly and extremely hazardous substances in Brazil declined between 2000 and 2006.
• In Australia the average amount of pesticides applied per hectare of cotton of highly hazardous and extremely hazardous substances peaked at ca 2 kg a.i./ha in 1999. Thereafter their use strongly decreased. In 2007 an average of 0.07 kg hazardous and extremely hazardous substances were applied per hectare.
• The average amount of pesticides applied per hectare of cotton of highly hazardous and extremely hazardous substances also decreased from 1994 to 2006 in USA (0.73 to 0.35 kg a.i./ha), India (0.58 to 0.21 kg a.i./ha) and Turkey (0.36 to 0.07 kg a.i./ha) with Turkey having the lowest use of the three countries in 2006.
• The USA applied a relatively high proportion of extremely hazardous substances compared to the total amount applied– 40%, 65%, and 30% for 1994, 2000, and 2006, respectively.
In 2006 the most-applied active ingredients in cotton that are highly to extremely hazardous (acute) to human health were (for Australia 2007) (Appendices 8-12):
36
• Australia: adicarb • Brazil: methamidophos, parathion-methyl, methomyl, zeta-cypermethrin • India: monocrotophos • Turkey: monocrotophos • USA: aldicarb and dicrotophos
0
2
4
6
8
10
12
14
1995
1999
2000
2001
2002
2003
2004
2005
2006
2007
1994
2000
2006
1994
2000
2006
1994
2000
2006
1994
2000
2006
Australia Brazil India Turkey U S A
Avera
ge p
esti
cid
e u
se (
kg
a.i./h
a)
Unknown
Fumigant not classified
Obsolete substance
Unlikely to present acute
hazard in normal use
Slightly hazardous
Moderately hazardous
Highly hazardous
Extremely hazardous
Figure 10: Average amount of pesticides classifgied by acute hazard to human health. applied per hectare of cotton 4.1.2 Chronic hazard to human health
Carcinogenicity Figure 11 shows the average amount of pesticides applied per hectare of cotton and the carcinogenicity of the pesticides used. The most important observations are: • Over the study period relatively small amounts of carcinogenic pesticides were
applied in Brazil, India, Turkey and USA (0.05 kg a.i./ha on the average or less). • The application of these pesticides with a carcinogenic potential in Australia was
much higher, but was strongly reduced over time, from 1.54 kg a.i./ha in 1995 (19% of the total amount of pesticides used in cotton) to 0.042 kg a.i./ha in 2007 (5%).
• In Brazil, the use of carcinogenic pesticides sligthly increased over time, from 0.01 kg a.i./ha in 1994 (0.6%) up to 0.05 kg a.i./ha in 2006 (0.9%).
• The active ingredients used in cotton in Australia with a carcinogenic potential were: propargite, bifenthrin, and piperonyl butoxide. In 2007 propargite was the most applied active ingredients that is a possible human carcinogen (Appendix 8).

37
0
2
4
6
8
10
12
14
1995
1999
2000
2001
2002
2003
2004
2005
2006
2007
1994
2000
2006
1994
2000
2006
1994
2000
2006
1994
2000
2006
Australia Brazil India Turkey U S A
Avera
ge p
esti
cid
e u
se (
kg
a.i./h
a) Unknown
Not Carcinogenic
US-EPA: Possible HumanCarcinogenic
US-EPA: Likely to be
Carcinogenic to Humans
R40 - May cause cancer
H351 - Suspected of causing
cancer
Figure 11: Average amount of pesticides applied per hectare of cotton and the carcinogenicity of the pesticides used
Genotoxicity Figure 12 shows the average amount of pesticides applied per hectare of cotton and the genotoxicity of the pesticide used. The most important observations are: • In 2006 India and Turkey were the only countries where active ingredients were
used in cotton with a genotoxic potential, at an average rate in cotton fields of 0.11 and 0.04 kg a.i./ha respectively.
• In the other three countries the use of such substances had ceased by that time. • In Brazil and India in 1994 and 2000 the average pesticide amount used per
hectare of cotton of pesticides with a genotoxic potential, was between 0.25 and 0.40 kg a.i./ha. In both countries the use of these pesticides decreased over time. In Brazil in 2006 pesticides with a genotoxic potential were no longer used.
• In Brazil (1994 and 2000) and India (1994, 2000 and 2006) the use of active ingredients in cotton with a genotoxic potential was almost totally related to the use of monocrotophos.

38
0
2
4
6
8
10
12
14
1995
1999
2000
2001
2002
2003
2004
2005
2006
2007
1994
2000
2006
1994
2000
2006
1994
2000
2006
1994
2000
2006
Australia Brazil India Turkey U S A
Avera
ge p
esti
cid
e u
se (
kg
a.i./h
a)
Unknown
No genotoxic potentials
H341 - Suspected of causinggenetic defects
Figure 12: Average amount of pesticides applied per hectare of cotton and the genotoxicity of the pesticides used
Toxicity to reproduction Figure 13 shows the average amount of pesticides applied per hectare of cotton and the toxicity to reproduction of the pesticides used. This figure shows that substances that cause effects on human reproduction were applied in very low quantities (< 0.004 kg a.i./ha) in the five countries during the years investigated.
0
2
4
6
8
10
12
14
1995
1999
2000
2001
2002
2003
2004
2005
2006
2007
1994
2000
2006
1994
2000
2006
1994
2000
2006
1994
2000
2006
Australia Brazil India Turkey U S A
Avera
ge p
esti
cid
e u
se (
kg
a.i./h
a)
Unknown
No evidence to have adverse
effects on reproduction
R63 - Possible risk of harm tothe unborn child
H362 - May cause harm to
breast-fed children
Figure 13: Average amount of pesticides applied per hectare of cotton and the toxicity to human reproduction of the pesticides used

39
4.2 Hazard to aquatic life
4.2.1 Acute hazard to fish
Figure 14 shows the average amount of pesticides applied per hectare of cotton and the toxicity of the pesticides to fish. The most important observations are: • In 2006 the average amount of pesticides, which are highly to very highly toxic to
fish, applied per hectare of cotton was highest in Brazil (2.5 kg a.i./ ha), followed by Australia (0,42 kg a.i./ ha) and India 0,37 kg a.i./ ha).
• In Brazil the average amount of pesticides applied per hectare of cotton of pesticides which are highly to very highly toxic to fish increased over time.
• In Australia and the USA the average amount of pesticides applied per hectare of cotton of pesticides which are highly to very highly toxic to fish decreased over time (exception made for the year 1999 in Australia).
• In India and Turkey the average amount of pesticides applied per hectare of cotton of pesticides which are highly to very highly toxic to fish was highest in 2000 (0.82 and 0.13 kg a.i./ha for India and Turkey, respectively).
0
2
4
6
8
10
12
14
1995
1999
2000
2001
2002
2003
2004
2005
2006
2007
1994
2000
2006
1994
2000
2006
1994
2000
2006
1994
2000
2006
Australia Brazil India Turkey U S A
Avera
ge p
esti
cid
e u
se (
kg
a.i./h
a)
Unknown
Very Slightly Toxic
Slightly toxic
Moderately toxic
Highly toxic
Very highly toxic
Figure 14: Average amount of pesticides applied per hectare of cotton and the acute toxicity to fish of pesticides used
4.2.2 Acute hazard to Daphnia
Figure 15 shows the average amount of pesticides applied per hectare of cotton and the acute toxicity of the pesticides to Daphnia. The most important observations are: • In all five countries in all years, except for the USA in 2006, most of the pesticides
used in cotton were highly to very highly toxic to Daphnia. • The average amount of pesticides applied per hectare of cotton of pesticides
which are highly to very highly toxic to Daphnia was highest (> 3 kg a.i./ha) in Australia (1995-2004) followed by Brazil at 1.9 and 1.6 kg a.i./ha in 2000 and 2006, respectively.

40
• In Brazil the average amount of pesticides applied per hectare of cotton of pesticides which are highly to very highly toxic to Daphnia increased between 1994 and 2000, but decreased somewhat between 2000 and 2006.
• In Australia and the USA the average amount of pesticides applied per hectare of cotton of pesticides which are highly to very highly toxic to Daphnia decreased over time (3.56 to 0.18 kg a.i./ha for Australia and 0.86 to 0.20 kg a.i./ha for the USA).
• In India and Turkey the average amount of pesticides applied per hectare of cotton of pesticides which are highly to very highly toxic to Daphnia fluctuated over time.
0
2
4
6
8
10
12
14
1995
1999
2000
2001
2002
2003
2004
2005
2006
2007
1994
2000
2006
1994
2000
2006
1994
2000
2006
1994
2000
2006
Australia Brazil India Turkey U S A
Avera
ge p
esti
cid
e u
se (
kg
a.i/h
a)
Unknown
Very Slightly Toxic
Slightly toxic
Moderately toxic
Highly toxic
Very highly toxic
Figure 15: Average amount of pesticides applied per hectare of cotton and the acute toxicity to Daphnia of the pesticides used
4.2.3 Hazard to algae
The analyses of the toxicity of pesticides to algae are only based on pesticides other than herbicides. It is likely that if herbicide use in cotton would be evaluated with respect to their hazard to algae, the presented image would change considerably. Figure 16 shows the average amount of pesticides applied per hectare of cotton and the toxicity of the pesticides to algae. The most important observations are: • In 2006 the average amount of pesticides applied per hectare of cotton of highly
toxic and very highly toxic active ingredients to algae in all five countries was small compared to less toxic substances but not negligible.
• In Australia from 1995-2004, the average amount of pesticides applied per hectare of cotton of highly toxic and very highly toxic active ingredients was the highest of the five countries > 2 kg a.i./ha in some years. However, from 2004-2007 the use of these substances decreased to 0.16 kg a.i./ha.

41
• In Brazil and India the the average amount of pesticides applied per hectare of cotton of highly toxic and very highly toxic active ingredients to algae increased from 1994 to 2006. In Turkey and the USA it fluctuated.
0
2
4
6
8
10
12
14
1995
1999
2000
2001
2002
2003
2004
2005
2006
2007
1994
2000
2006
1994
2000
2006
1994
2000
2006
1994
2000
2006
Australia Brazil India Turkey U S A
Avera
ge p
esti
cid
e u
se (
kg
a.i./h
a)
Unknown
Very Slightly Toxic
Slightly toxic
Moderately toxic
Highly toxic
Very highly toxic
Figure 16: Average amount of pesticides applied per hectare of cotton and the toxicity to algae of the pesticides used.
4.3 Hazard to bees
Figure 17 shows the average amount of pesticides applied per hectare of cotton and the toxicity of the pesticides to bees. The most important observations are: • In 2006 the average amount of pesticides applied per hectare of cotton of
pesticides which are toxic to highly toxic to bees was highest in Brazil (2.45 kg a.i./ ha ).
• Application of toxic to highly toxic substances in 2006 was equivalent to 0.49, 0.39 and 0.41 kg a.i./ ha in India, Turkey and USA, respectively.
• In Australia the application of toxic to highly toxic substances peaked in 1999 and decreased thereafter to 0.3 kg a.i./ ha in 2007.
• In India the application of toxic to highly toxic substances flucuated between 1994 and 2006. The amounts used were 0.86, 0.98. and 0.49 kg a.i./ha for 1994, 2000, and 2006, respectively.
• In Brazil the application of toxic to highly toxic substances increased more than 3-fold between 1994 and 2000.

42
0
2
4
6
8
10
12
14
1995
1999
2000
2001
2002
2003
2004
2005
2006
2007
1994
2000
2006
1994
2000
2006
1994
2000
2006
1994
2000
2006
Australia Brazil India Turkey U S A
Avera
ge p
esti
cid
e u
se (
kg
a.i./h
a)
Unknown
Very Slightly Toxic
Slightly Toxic
Moderately Toxic
Toxic
Highly Toxic
Figure 17: Average amount of pesticides applied per hectare of cotton and the acute toxicity to bees of the pesticides used
4.4 Potential to leach to groundwater
Figure 18 shows the average amount of pesticides applied per hectare of cotton and the potential to leach to groundwater of the pesticides used. The most important observations are: • In all five countries in all years, the average pesticide amounts applied per hectare
of cotton of pesticides with a high to very high hazard to leach to groundwater was zero or close to zero.

43
0
2
4
6
8
10
12
14
19
95
19
99
20
00
20
01
20
02
20
03
20
04
20
05
20
06
20
07
19
94
20
00
20
06
19
94
20
00
20
06
19
94
20
00
20
06
19
94
20
00
20
06
Australia Brazil India Turkey U S A
Avera
ge p
esti
cid
e u
se (
kg
a.i./h
a)
Very Low
Low
Unknown
Moderate
High
Very High
Figure 18: The average amount of pesticides used per hectare of cotton and the potential to leach to groundwater of pesticides used


45
5 Environmental Toxic Load
The ETL is calculated separately for fish, Daphnia, algae and bees. 5.1 Environmental Toxic Load for aquatic organisms
5.1.1 Environmental Toxic Load for fish
Figure 19 shows the ETL for fish due to pesticide use in cotton in Australia, Brazil, India, Turkey and the USA. The most important observations are: • In 2006 the ETL for fish was highest in Brazil. • In Brazil the ETL for fish increased over time. • In Australia the ETL for fish strongly decreased over time. However the decrease
was not continuous. The ETL peaked in 1999 and 2004. • In the USA the ETL for fish strongly decreased over time. • In India and Turkey the ETL fluctuated over time.
0
500
1000
1500
2000
2500
3000
3500
4000
4500
1995
1999
2000
2001
2002
2003
2004
2005
2006
2007
1994
2000
2006
1994
2000
2006
1994
2000
2006
1994
2000
2006
Australia Brazil India Turkey U S A
ET
L f
or f
ish
Zeta-cypermethrin
Quinalphos
Lindane
Lambda-cyhalothrin
Fenvalerate
Fenbutatin oxide
Esfenvalerate
Endosulfan
Diafenthiuron
Cypermethrin
Cyfluthrin
Chlorpyrifos
Bifenthrin
Others
Figure 19: The ETL for fish due to pesticide use in cotton
The active ingredients per country applied in cotton in 2006 (for Australia 2007) that have the biggest contribution to the ETL for fish are (Figure 19 and Appendices 8-12): • Australia: endosulfan and diafenthiuron
46
• Brazil: endosulfan, diafenthiuron, lambda-cyhalothrin and zeta-cypermethrin • India: chlorpyrifos and endosulfan • Turkey: lambda-cyhalothrin, endosulfan and diafenthiuron • USA: chlorpyrifos and lambda-cyhalothrin. 5.1.2 Environmental Toxic Load for Daphnia
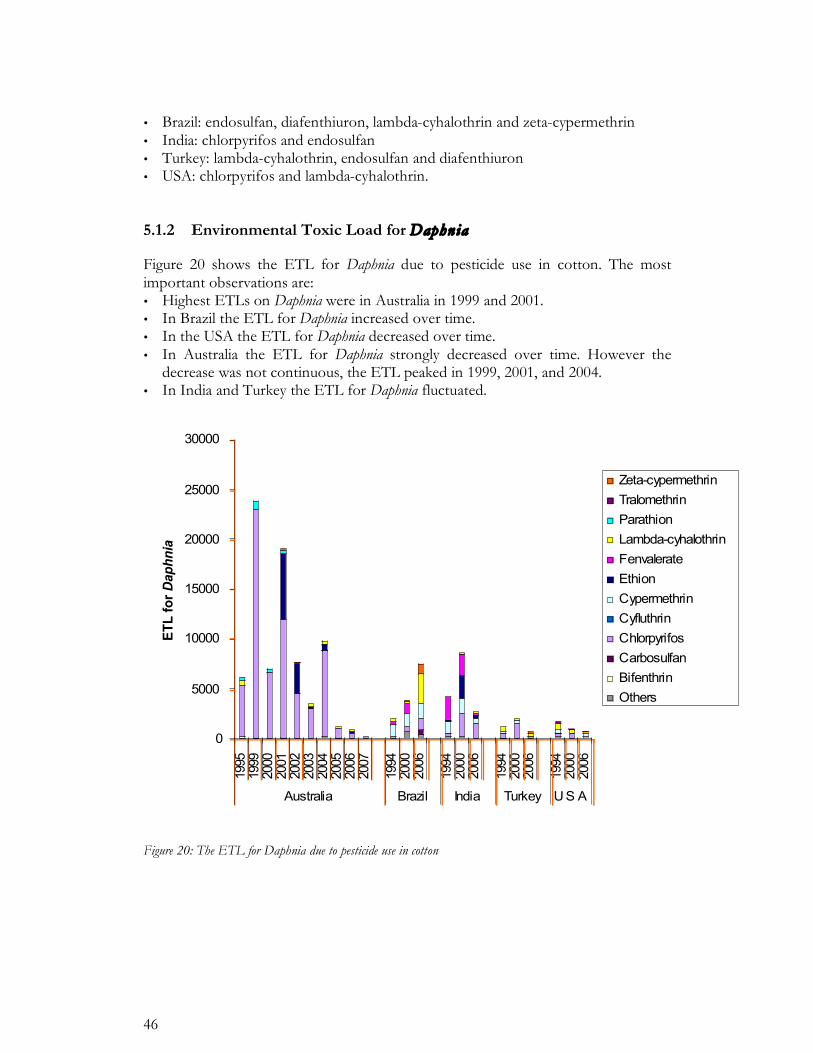
Figure 20 shows the ETL for Daphnia due to pesticide use in cotton. The most important observations are: • Highest ETLs on Daphnia were in Australia in 1999 and 2001. • In Brazil the ETL for Daphnia increased over time. • In the USA the ETL for Daphnia decreased over time. • In Australia the ETL for Daphnia strongly decreased over time. However the
decrease was not continuous, the ETL peaked in 1999, 2001, and 2004. • In India and Turkey the ETL for Daphnia fluctuated.
0
5000
10000
15000
20000
25000
30000
1995
1999
2000
2001
2002
2003
2004
2005
2006
2007
1994
2000
2006
1994
2000
2006
1994
2000
2006
1994
2000
2006
Australia Brazil India Turkey U S A
ET
L f
or Daphnia
Zeta-cypermethrin
Tralomethrin
Parathion
Lambda-cyhalothrin
Fenvalerate
Ethion
Cypermethrin
Cyfluthrin
Chlorpyrifos
Carbosulfan
Bifenthrin
Others
Figure 20: The ETL for Daphnia due to pesticide use in cotton

47
The active ingredients per country applied in cotton in 2006 (for Australia 2007) that have biggest contribution to the ETL for Daphnia are (Figure 20 and Appendices 8-12): • Australia: chlorpyrifos • Brazil: lambda-cyhalothrin, cypermethrin, chlorpyrifos and zeta-cypermethrin • India: chlorpyrifos, ethion, and cypermethrin • Turkey: lambda-cyhalothrin, chlorpyrifos and cypermethrin • USA: chlorpyrifos, lambda-cyhalothrin and cypermethrin. 5.1.3 Environmental Toxic Load for algae
The ETL for algae are only based on the analysis of the toxicity of pesticides other than herbicides. Some of the enzymes found in weeds that are the target site for herbicide activity are also found in algae, therefore the ETL would expected to be high for this functional group of pesticides. It is likely that if the herbicide used in cotton were included in the study and evaluated with respect to their toxicity, the presented image of the ETLs for algae would be considerably different. Figure 21 shows the ETL for algae due to pesticide use in cotton. The most important observations are: • In 2006 the ETL for algae was highest in USA, Australia and Brazil. • In Turkey the use of fenbutatin oxide caused a very high ETL for algae in 2000.
In 2006 fenbutatin oxide was no longer used resulting in a very strong decrease of the ETL for algae close to zero.
• In Brazil the ETL for algae increased over time. • In Australia the ETL for Algae strongly decreased over time. This trend was not
continuous the ETL peaked in 1999, and 2004. • In India and the USA the ETL for algae fluctuated over the years. The active ingredients per country applied in cotton in 2006 (for Australia 2007) that have biggest contribution to the ETL for algae are (Figure 21 and Appendices 8-12): • Australia: indoxacarb and endosulfan • Brazil: permethrin • India: chlorpyrifos. • Turkey: negligible ETL for algae. • USA: naled.

48
0
5
10
15
20
25
30
35
1995
1999
2000
2001
2002
2003
2004
2005
2006
2007
1994
2000
2006
1994
2000
2006
1994
2000
2006
1994
2000
2006
Australia Brazil India Turkey U S
A
ET
L f
or
alg
ae
Teflubenzuron
Sulphur
Spinosad
Propargite
Piperonyl butoxide
Permethrin
Parathion-methyl
Parathion
Naled
Indoxacarb
Fenbutatin oxide
Esfenvalerate
Endosulfan
Disulfoton
Dicofol
Chlorpyrifos
Chlorfenapyr
Others
Figure 21: The ETL for algae due to pesticide use in cotton
5.2 Environmental Toxic Load for bees
Figure 22 shows the ETL for bees due to pesticide use in cotton. The most important observations are: • In 2006 the ETL for bees due to pesticide use in cotton was highest in Brazil. • In Brazil the ETL strongly increased in the period 1994 - 2006. • In Australia the ETL peaked between 1999 - 2001, in those years Australia had
the highest ETL of the five investigated countries. However, in the period 2001-2007 the ETL strongly decreased.
• In India and the USA the ETL decreased over time. In Australia and Turkey the ETL was fluctuating over the years.

49
0
20
40
60
80
100
120
140
1995
1999
2000
2001
2002
2003
2004
2005
2006
2007
1994
2000
2006
1994
2000
2006
1994
2000
2006
1994
2000
2006
Australia Brazil India Turkey U S A
ET
L f
or
bees
Zeta-cypermethrin
Thiodicarb
Spinosad
Profenofos
Parathion
Monocrotophos
Methamidophos
Imidacloprid
Emamectin Benzoate
Deltamethrin
Cyfluthrin
Chlorpyrifos
Bifenthrin
Beta-cyfluthrin
Aldicarb
Cypermethrin
Others
Figure 22: The ETL for bees due to pesticide use in cotton
The active ingredients per country applied in cotton in 2006 (for Australia 2007) that have biggest contribution to the ETL for bees are (Figure 22 and Appendices 8-12): • Australia: deltamethrin • Brazil: zeta-cypermethrin • India: monocrotophos, imidacloprid, spinosad and chlorpyrifos • Turkey: thiodicarb • USA: cyfluthrin, aldicarb and dicrotophos.


51
6 Biotech cotton versus conventional cotton in Australia
For Australia for the years 2003 – 2007 data (Dataset 2) was available on average pesticide use per hectare of cotton for both conventional and biotech cotton (represented by Bollgard®). Pesticide use in conventional and biotech cotton was compared in terms of: • The number of active ingredients used in cotton and the average amount of
pesticides applied per hectare of cotton, • Number of active ingredients used in cotton and their associated hazards, • Average amount of pesticides applied per hectare and their associated hazards, • The ETLs for fish, Daphnia, algae, and bees. 6.1 Pesticide use
Figure 23 shows the number of active ingredients used in respectively biotech cotton cotton and conventional cotton. The most important observations are: • In all years, except 2007, the number of active ingredients used in biotech cotton
cotton was lower than in conventional cotton. • The difference in the number of active ingredients used between biotech cotton
and conventional cotton was biggest in 2003.
0
10
20
30
40
50
60
70
20
03
20
04
20
05
20
06
20
07
Nu
mb
er
of
Acti
ve In
gre
die
nts
Bollgard cotton
Conventional
cotton
Figure 23: The number of active ingredients used in biotech and conventional cottons Figure 24 shows the average amount of pesticides applied per hectare for respectively biotech cotton and conventional cotton. The most important observations are: • In all investigated years the average amount of pesticides applied per hectare is
higher in conventional cotton compared to biotech cotton. • In conventional cotton the average amount used per hectare fluctuated over time
while in biotech cotton the average amount of pesticides applied per hectare was more or less stable.
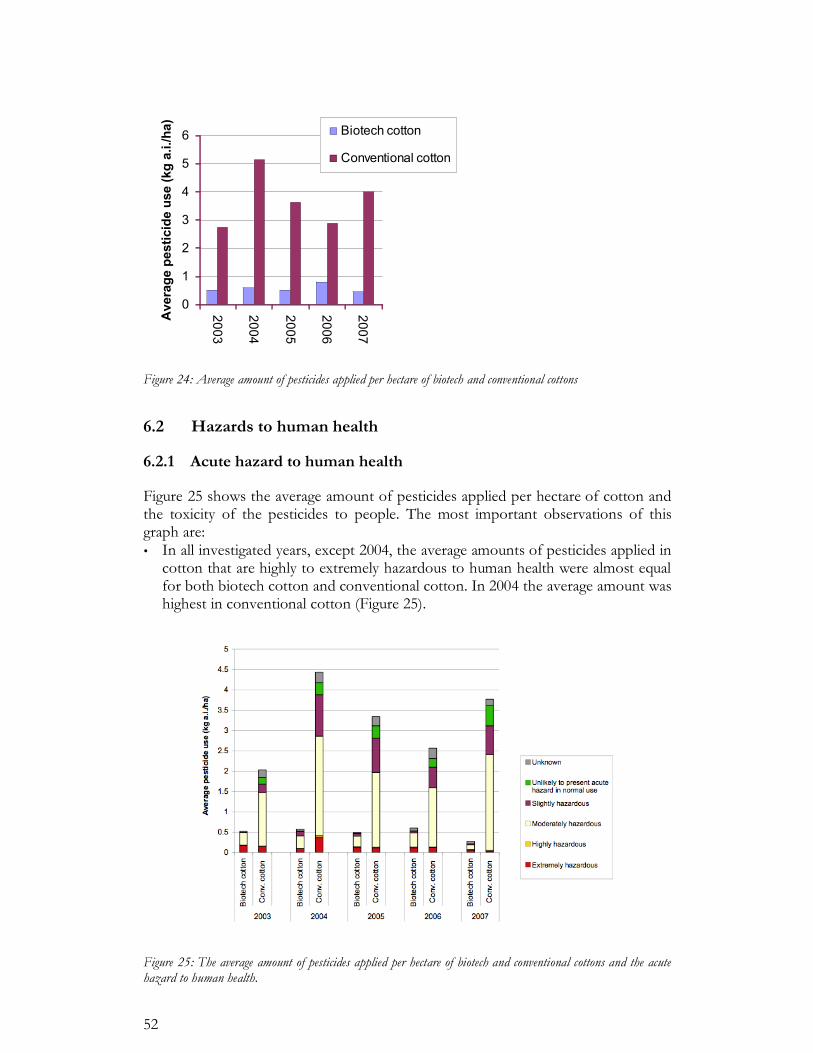
52
0
1
2
3
4
5
6
20
03
20
04
20
05
20
06
20
07
Avera
ge p
esti
cid
e u
se (
kg
a.i./h
a)
Biotech cotton
Conventional cotton
Figure 24: Average amount of pesticides applied per hectare of biotech and conventional cottons
6.2 Hazards to human health
6.2.1 Acute hazard to human health
Figure 25 shows the average amount of pesticides applied per hectare of cotton and the toxicity of the pesticides to people. The most important observations of this graph are: • In all investigated years, except 2004, the average amounts of pesticides applied in
cotton that are highly to extremely hazardous to human health were almost equal for both biotech cotton and conventional cotton. In 2004 the average amount was highest in conventional cotton (Figure 25).
Figure 25: The average amount of pesticides applied per hectare of biotech and conventional cottons and the acute hazard to human health.
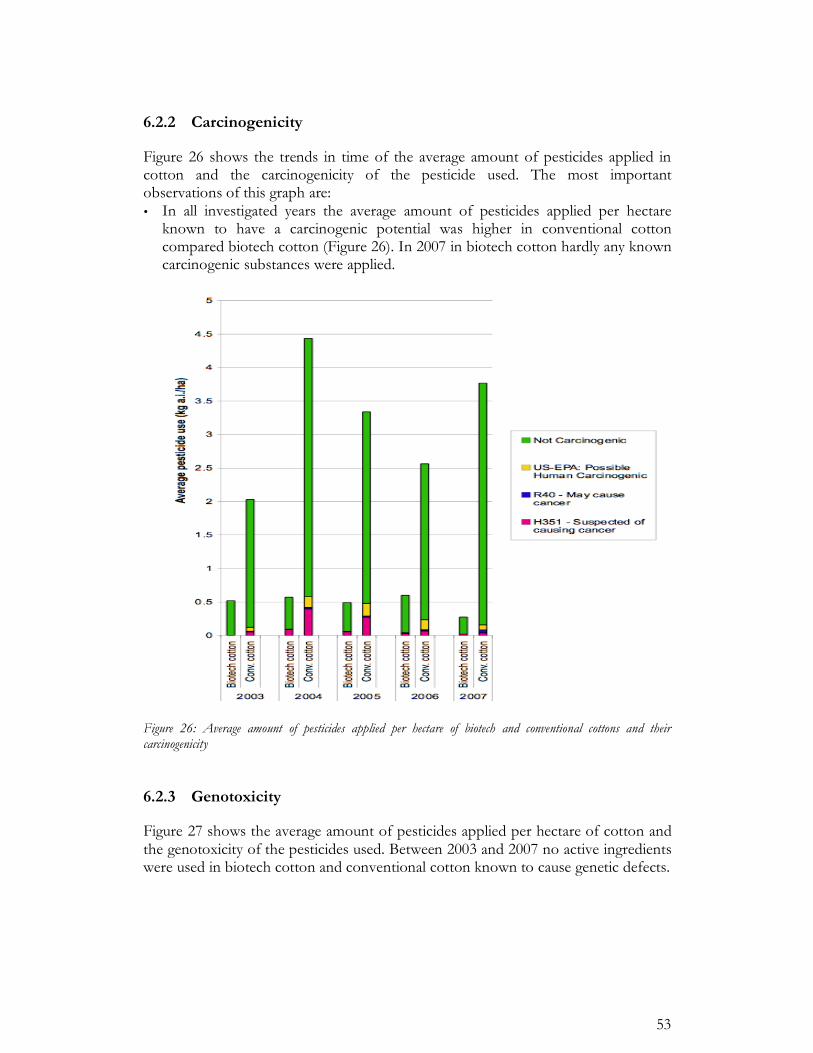
53
6.2.2 Carcinogenicity
Figure 26 shows the trends in time of the average amount of pesticides applied in cotton and the carcinogenicity of the pesticide used. The most important observations of this graph are: • In all investigated years the average amount of pesticides applied per hectare
known to have a carcinogenic potential was higher in conventional cotton compared biotech cotton (Figure 26). In 2007 in biotech cotton hardly any known carcinogenic substances were applied.
Figure 26: Average amount of pesticides applied per hectare of biotech and conventional cottons and their carcinogenicity 6.2.3 Genotoxicity
Figure 27 shows the average amount of pesticides applied per hectare of cotton and the genotoxicity of the pesticides used. Between 2003 and 2007 no active ingredients were used in biotech cotton and conventional cotton known to cause genetic defects.

54
Figure 27: Average amount of pesticides applied per hectare of biotech and conventional cottons and their genotoxicity 6.2.4 Toxicity to reproduction
Figure 28 shows the average amount of pesticides applied per hectare and the reproductive toxicity of the pesticides used for both cotton types. Most important observation on the basis of this graph is: • The active ingredients known to cause effects on human reproduction were hardly
applied (at the rate of 0.003 kg a.i.) in both biotech cotton and conventional cotton during the investigated years.
Figure 28: Average amount of pesticides applied per hectare of biotech and conventional cottons and their reproductive toxicity

55
6.3 Environmental hazards
6.3.1 Acute hazard to fish
Figure 29 shows the average amount of pesticides applied per hectare and the acute toxicity of the pesticides to fish for both cotton types. The most important observations on the basis of this graph are: • n all investigated years the average amount used per area of pesticides which are
highly to extremely toxic to fish was much lower in biotech cotton compared to conventional cotton (Figure 29).
Figure 29: Average amount of pesticides applied per hectare of biotech and conventional cottons and their acute toxicity to fish
6.3.2 Acute hazard to Daphnia
Figure 30 shows the average amount of pesticides applied per hectare and the acute toxicity of the pesticides to Daphnia for both cotton types. The most important observations of this graph are: • In all investigated years, except for 2007, the average amount of pesticides applied
per hectare of cotton with a high to very high toxicity to Daphnia was lower in biotech cotton than in conventional cotton (Figure 30).

56
Figure 30: Average amount of pesticides applied per hectare of biotech and conventional cottons and their acute toxicity to Daphnia
6.3.3 Hazard to algae
As already indicated, the analyses of the toxicity to algae are only based on pesticides other than herbicides. Figure 31 shows the average amount of pesticides applied per hectare of cotton and the toxicity of the pesticides to algae for both cotton types. The most important observations on basis of this graph are: • In all investigated years the average amount applied per area of pesticides that are
highly to very highly toxic to algae was much lower in biotech cotton than in conventional cotton (Figure 31). In biotech cotton in the period 2005-2007 hardly any substances other than herbicides were applied that are highly to very highly toxic to algae.
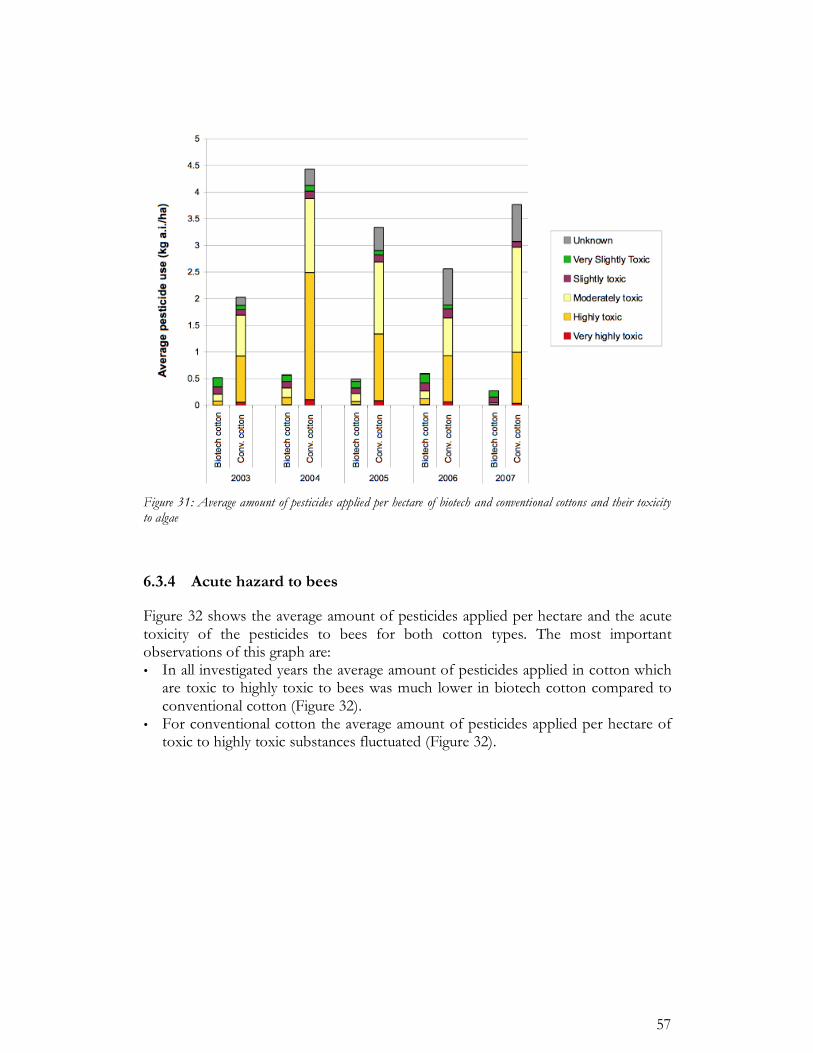
57
Figure 31: Average amount of pesticides applied per hectare of biotech and conventional cottons and their toxicity to algae
6.3.4 Acute hazard to bees
Figure 32 shows the average amount of pesticides applied per hectare and the acute toxicity of the pesticides to bees for both cotton types. The most important observations of this graph are: • In all investigated years the average amount of pesticides applied in cotton which
are toxic to highly toxic to bees was much lower in biotech cotton compared to conventional cotton (Figure 32).
• For conventional cotton the average amount of pesticides applied per hectare of toxic to highly toxic substances fluctuated (Figure 32).

58
Figure 32: Average amount of pesticides applied per hectare of biotech and conventional cottons and their acute toxicity to bees
6.3.5 Potential to leach to groundwater
Figure 33 shows the average amount of pesticides applied per hectare and their hazard to leach to groundwater. The most important observations of this graph are: • Looking at the average pesticide use per area showed that 2007 was the only year
in which pesticides were used that have a very high leaching potential and only in conventional cotton (Figure 33).

59
!
0
0.5
1
1.5
2
2.5
3
3.5
4
4.5
5
2003 2004 2005 2006 2007
Unknown
Very Low
Low
Moderate
High
Very High
Figure 33: The average amount of pesticides applied per hectare of biotech and conventional cottons and their potential to leach to groundwater
6.4 Environmental Toxic Load
Figure 34 – Figure 37 show the ETLs due to pesticide use for respectively, fish, Daphnia, algae and bees for both biotech cotton and conventional cotton. All graphs show that the ETL is much lower in biotech cotton compared to conventional cotton. The higher ETLs in conventional cotton compared to biotech cotton were either due to the use of additional active ingredients or related to the higher average amount of pesticide applied per hectare. Table 9 lists the active ingredients applied in conventional cotton in 2007 that have a big contribution to the ETL for fish, Daphnia, algae, and bees. Table 9: active ingredients applied in cotton in 2007 that have a big contribution to the ETL for different test organisms.
ETL for Fish ETL for Daphnia ETL for Algae ETL for Bees Endosulfan Chlorpyrifos Indoxacarb Spinosad Chlorpyrifos Endosulfan Profenofos Deltamethrin Beta-cyfluthrin Emamectin Benzoate

60
0
200
400
600
800
1000
1200
1400
1600
Bio
tech c
otton
Conve
ntio
nal
Bio
tech c
otton
Conve
ntio
nal
Bio
tech c
otton
Conve
ntio
nal
Bio
tech c
otton
Conve
ntio
nal
Bio
tech c
otton
Conve
ntio
nal
2003 2004 2005 2006 2007
ET
L f
or f
ish
Endosulfan
Diafenthiuron
Chlorpyrifos
Bifenthrin
Others
Figure 34: The ETL for fish due to pesticide use in biotech and conventional cottons
0
2000
4000
6000
8000
10000
12000
14000
16000
Bio
tech c
otton
Conve
ntio
nal
Bio
tech c
otton
Conve
ntio
nal
Bio
tech c
otton
Conve
ntio
nal
Bio
tech c
otton
Conve
ntio
nal
Bio
tech c
otton
Conve
ntio
nal
2003 2004 2005 2006 2007
ET
L f
or
Dap
hn
ia Zeta-cypermethrin
Lambda-cyhalothrin
Ethion
Chlorpyrifos
Bifenthrin
Others
Figure 35: The ETL for Daphnia due to pesticide use in biotech and conventional cottons

61
0
1
2
3
4
5
6
7
8
9
Bio
tech
co
tto
n
Co
nve
ntio
na
l
Bio
tech
co
tto
n
Co
nve
ntio
na
l
Bio
tech
co
tto
n
Co
nve
ntio
na
l
Bio
tech
co
tto
n
Co
nve
ntio
na
l
Bio
tech
co
tto
n
Co
nve
ntio
na
l
2003 2004 2005 2006 2007
ET
L f
or
alg
ae Spinosad
Propargite
Piperonyl butoxide
Indoxacarb
Endosulfan
Chlorpyrifos
Chlorfenapyr
Amitraz
Others
Figure 36: The ETL for algae due to pesticide use in biotech and conventional cottons
0
10
20
30
40
50
60
70
80
90
Bio
tech
co
tto
n
Co
nve
ntio
na
l co
tto
n
Bio
tech
co
tto
n
Co
nve
ntio
na
l co
tto
n
Bio
tech
co
tto
n
Co
nve
ntio
na
l co
tto
n
Bio
tech
co
tto
n
Co
nve
ntio
na
l co
tto
n
Bio
tech
co
tto
n
Co
nve
ntio
na
l co
tto
n
2003 2004 2005 2006 2007
ET
L f
or b
ees
Spinosad
Profenofos
Fipronil
Emamectin Benzoate
Dimethoate
Deltamethrin
Chlorpyrifos
Bifenthrin
Beta-cyfluthrin
Aldicarb
Abamectin
Others
Figure 37: The ETL for bees due to pesticide use in biotech and conventional cottons


63
7 Discussion
This chapter summarizes and discusses the main findings of the study. First the limitations of the datasets and the methods are reviewed. Secondly the trends in time of pesticide use, hazards and the Environmental Toxic Loads (ETLs) are analyzed and thirdly, the impact of biotech cotton varietes on pesticide use is discussed. 7.1 Available data
The analyses in this report strongly depend on the quality and the completeness of the datasets that were received. A few things must be noted in this respect. For Brazil, India, Turkey and the USA pesticide use data were available for only three years, 1994, 2000, and 2006. In comparison, information for Australia was available for the years 1995 and 1999 – 2007. Information for three separate years does not allow in-depth evaluation of consistent trends in pesticide use because yearly fluctuations may go unnoticed or incidental data in one of the three years may disturb the overall picture. Therefore interpretation of the results should be undertaken with care and observations on any trends in this report must be seen against the background of these limitations. Additionally all analyses and interpretations in this chapter are based on the assumption that pesticide use in each country is reported with the same accuracy. Furthermore, data on herbicide use were not received even though herbicides are used in cotton production in some countries. Therefore no evaluation of this important group of pesticides could be performed, and this may influence the assessment of the hazards to sensitive groups, e.g., algae. Toxicological properties of the pesticides in the datasets were derived from various data sources. The toxicological information retrieved was incomplete for approximately 20% of the active ingredients, i.e., for these substances one or more of the toxicity values for bees, fish, algae or Daphnia was lacking (noted as “Unknown” in Appendix 3). In this study no complete assessment was made of the quality of the available data on substances. Results of the hazard assessments and the ETL calculations often depend on one single value that was found for a toxicological parameter. Therefore, toxicity data for the most hazardous substance were checked with other sources in order to verify the validity of recommendations on specific substances. For chronic human health hazards, retrieved information was incomplete for approximately 30% of the active ingredients. For these compounds there is no information available on either carcinogenicity, genotoxicity, toxicity to reproduction and only in a very few cases for WHO hazard classification (Appendix 6).

64
7.2 Limitations of the methods
Hazard assessments The hazard assessments for aquatic organisms, leaching potential to groundwater and bees that were done during this study rank pesticides relative to each other from high to low hazard. The hazard assessments do not provide information on the actual risks in the field posed by these pesticides. Real risks to aquatic organisms, bees and groundwater depend on both the toxicity of the pesticide and the exposure of organisms to the pesticide. Exposure is, among other things, determined by pesticide formulation, soil properties, climate, application regimes, conditions during application, persistence of pesticides in the ecosystem, the presence and distance to surface water bodies, presence of fish and bees, buffer strips and other mitigation techniques employed, etc. These factors were not taken into account. Hazard assessments are best used to decide whether follow-up risk assessments are required. The risk of judging pesticides on the basis of hazard assessment only is that farmers may be encouraged to base their choice of pesticide on only one parameter — low toxicity — without due consideration being taken into account of the overall risk, which requires the total exposure to also be considered. While, for pesticides with a low toxicity, repeated use may lead to increased exposure and therefore pose a higher risk than pesticides with a high toxicity but low rates of esposure. Therefore drawing conclusions on hazard indicators only is not advised and it is recommended to use a simplified risk assessment method. The hazard assessments for aquatic organisms do not take into account the persistence of the compound. Highly toxic pesticides with a low persistence in the ecosystem can pose a lower risk to aquatic organisms than persistent compounds with lower toxicity. Therefore the approach can be improved by including persistence and use patterns in the equation. The hazard assessments for groundwater take into account mobility and degradation in soil, but not toxicity of the pesticides. Whether the use of a specific compound is a risk to groundwater depends on the toxicity of the compound, the distance to groundwater and the use of the groundwater. The hazard assessment for groundwater can be improved by including toxicity in the indicator. Environmental Toxic Load A new indicator called ETL was used to evaluate the consequences of changes in pesticide use on average toxic loads to the environment. The ETL was calculated separately for fish, aquatic invertebrates (Daphnia), algae and bees. The ETL, is not an indicator of the risk associated with the use of a pesticide, or the actual impact on organisms in the field, but rather ETL is a composite indicator for the relative hazard based on pesticide use. This limitation is particularly evident in the evaluation of a granular formulation of a pesticide with regard to bees where pesticides are applied to the soil providing little or no opportunity for exposure.
65
As the ETL is averaged over the whole cotton area, the ETL does not account for differences between regions where relatively high or low amounts of toxic substances are used. So even when the ETL is relatively low for a country in a given year, there could still be environmental damage in a particular area where a highly toxic active ingredient is used extensively. 7.3 Trends in pesticide use
During the years evaluated in this study, the overall amount of pesticides (kg a.i.) used per hectare of cotton was the highest in Australia between 1995-2002, and second highest in Brazil (Figure 3). In Australia the total amount of pesticides applied (Figure 2) and the average amount of pesticides applied per hectare of cotton strongly increased in 1999. However, the data from Australia also show that the average amount of pesticides applied per hectare decreased in the period 1999 - 2007, from more than 12.0 kg/ha in 1999 to less than 2 kg/ha in 2007. Despite this decrease in per hectare average pesticide use over this period, the average cotton yield per hectare increased (Figure 4). The use per hectare in India, Turkey and the USA was lower than in Australia and Brazil, below 2.0 kg/ha from 1994 to 2006. For Brazil comparison of these trends yields a different picture as both the average amount of pesticides applied per hectare of cotton as well as the average cotton yield per hectare increased over time. In 2006 Brazil used the highest average amount of pesticides per hectare of cotton of the five countries. For India, Turkey and the USA there were no clear trends in the average amount of pesticides applied per hectare of cotton, although it was lower in 2006 compared to 1994 for all three countries. In Turkey the average cotton yield per hectare increased over time and in 2006 the average cotton yield per hectare was equal to the yield in Australia and higher than in the other investigated countries. The high cotton yields reported for Turkey were coupled with low pesticide use. Insecticides were the major group of pesticides used in all countries (noting that herbicide use was not evaluated), and organophosphates were among the insecticides used most (paragraph 3.2). The use of carbamate compounds was increasing in Brazil and Turkey. India was the only country where the organochlorine substance lindane was still applied in cotton in appreciable amounts, but only in 1994 and 2000. Lindane was used in negligible amounts in 2006. The cyclodiene organochlorine compound endosulfan was used in all five countries in the investigated years. In all five countries the use of endosulfan was reduced over time. However in Australia, Brazil, India and Turkey endosulfan was still one of the most used substances in 2006 (Australia 2007) (Appendices 8-12). 7.4 Human health hazards
Between 1995 and 2002 the average amount (kg a.i.) applied per hectare of highly or extremely hazardous substances to human health (WHO classification) was highest in Australia. It peaked in 1999 at 2 kg a.i kg./ha but strongly decreased the following
66
years. In 2007 Australia applied 0.07 kg a.i./ha of highly or extremely hazardous substances (Appendix 8). In India, Turkey and the USA the average amount applied per hectare of highly or extremely hazardous substances also decreased over time. In 2006, Turkey used 0.066 kg a.i./ha of highly or extremely hazardous substances, in contrast to India and the USA, which applied 0.21 and 0.35 kg a.i./ha, respectively, of highly or extremely hazardous substances (Appendices 10, 11 and 12). In Brazil the use of highly or extremely hazardous substances peaked in 2000. In 2006 Brazil at 0.89 kg a.i./ha had the highest average amount used of highly or extremely hazardous substances of the five countries (Appendix 9). In 2006 in Brazil the most widely applied substances in cotton that are highly or extremely hazardous to human health were methamidophos, parathion-methyl, methomyl, and zeta-cypermethrin. In the USA in 2006 the most used hazardous substance was aldicarb (Appendix 12), whereas in India it was monocrotophos (Appendix 10). Australia was the only country where carcinogenic pesticides were applied in cotton (Figure 11). However the application of these compounds decreased over the years to 0.042 kg a.i./ha in 2007 (Appendix 8). The application of substances known to cause genetic defects ceased in all but two countries, India and Turkey, by 2006 (2007 for Australia) (Figure12). Substances that cause effects on human reproduction numbered two or fewer and were applied at very low rates in cotton in the five countries during the investigated years (Figure 13). 7.5 Leaching to groundwater
The GUS indicator was used to estimate the potential of a pesticide to reach the groundwater before it is degraded. Combination of this indicator together with the quantitative information on pesticides use showed that the number and the amount of active ingredients with a high to very high potential to leach to the groundwater applied in cotton in the five countries during the investigated years was low (Figure 18). 7.6 Environmental Toxic Loads
Aquatic organisms In the investigated years the ETL for fish due to pesticide use in cotton was higher in Australia between 1995 and 2004 and in Brazil in 2000 and 2006 compared to the other countries (Figure 19). This corresponds with the total amounts of pesticides applied per hectare in these two countries (Figure 3). In 2006 Brazil had the highest ETL for fish of the five countries. The ETL of fish in India, Turkey and the USA was much lower than in Australia and Brazil. In Australia the ETL for fish peaked in 1999, but decreased afterwards. In all years most of the toxic pressure to fish in Australia was caused by the use of endosulfan

67
and chlorpyrifos. The strong increase of the ETL in 1999 in this country was due to an increased use of chlorpyrifos. Between 1999 and 2007 the use of these substances was reduced. In Brazil the ETL for fish increased over time. This increase was due to an increased use of endosulfan, diafenthiuron, lambda–cyhalothrin, and zeta-cypermethrin. In the USA it decreased continuously over time from 1994 to 2006 despite an increase in pesticide use in 2006. This implies that over time, use patterns in the USA changed in favor of compounds that are less toxic to fish. In all investigated countries the ETL for aquatic invertebrates (represented by Daphnia) was higher than the ETL for fish and algae (Paragraph 5.1). The ETL for aquatic invertebrates showed similar trends as the ETL of fish, i.e., the overall ETL was relatively high in Australia between 1995 and 2004, in Brazil in 2000 and 2006 and in India in 1994 and 2000. (Figure 20). The ETL increased over time in Brazil, decreased in Australia and USA, and fluctuated in the other two countries. In 2006 Brazil had the highest ETL for Daphnia of the five countries. A few things are noticeable: • In Australia the ETL for Daphnia was highest in 1999, 2001 and 2004. Between
2004 and 2007 the ETL declined. The high ETLs in 1999 and 2004 were almost entirely due to the use of chlorpyrifos and in 2001 to ethion. The decline of the ETL between 2004 and 2007 was due to a reduction in the use of chlorpyrifos.
• In Brazil the ETL to Daphnia increased over time, first as a result of the use of fenvalerate and followed in 2006 by the use of lambda-cyhalothrin, zeta-cypermethrin and chlorpyrifos. Fenvalerate was no longer used after 2000.
• In India, Turkey and the USA hight ETL values in regard to Daphnia also coincided with the use of chlorpyrifos, ethion, fenvalerate and lambda-cyhalothrin, in different combinations.
In all investigated countries the ETL for algae was considerably lower than the ETL for aquatic invertebrates and fish (Paragraph 5.1). As already indicated, the assessment of the hazards to algae is only partial as herbicides wer not included. The high values in the USA can be almost entirely explained by the use of the organophosphate compound naled. Furthermore there is a conspicuous peak of the ETL to algae in Turkey in 2000 resulting from fenbutatin oxide, an organotin compound. Bees For bees, the overall ETL was highest in Australia between 1995 and 2006 and in Brazil in 2000 and 2006 (Figure 22). Over time, the ETL increased in Brazil, decreased in Australia and fluctuated elsewhere. In 2006 Brazil had the highest ETL for bees of the five countries a result of the use of zeta-cypermethrin. In Australia in 1999 an increase of the ETL for bees was related to increased use of parathion and chlorpyrifos. Between 2000 and 2002 application of these substances
68
in cotton decreased but the use of the insecticide spinosad increased. A reduction in the application of spinosad between 2002 and 2007combined with the decrease in the use of parathion and chlorpyrifos after 2000 resulted in an overall decrease of the ETL in 2007. The ETL for bees decreased over time in India and USA and remained relatively low in Turkey. 7.7 Impacts of biotech cotton
Changes in pesticide use, in terms of average amount of pesticide used per hectare and types of pesticides applied in cotton, may be due to several reasons i.e. registration policies, climate, year to year variations in weather conditions, pest occurrence, management strategies (e.g. integrated pest management and organic cotton), and introduction of biotech cotton varieties. In this study, information on driving factors other than the introduction of biotech cotton varieties was not investigated. Except for Australia, no information was available in the studied datasets on the size of the area where biotech cotton varieties has been introduced and the extension of this area during the investigated years. In regard to the average amount of pesticide applied per hectare of cotton it can be observed that after the introduction of biotech cotton crops in India and USA the average amount of pesticide applied per hectare decreased, while in Australia the pesticide use first increased and thereafter decreased (Paragraph 3.1). For Brazil the year of introduction of biotech cotton varieties (2005) coincides with the last year of available pesticide use data (2006, which is the equivalent to the growing season 2005/2006). In this year no positive effects could be observed as the increase in the average amount of pesticide used per hectare of cotton continued. Looking at the trends in time of the hazards to human health and environment, similar patterns were found for the investigated countries. Data on pesticide use in biotech cotton and conventional cotton was available for Australia for 2003-2007. It showed that there was a considerable difference in pesticide use between these cotton types (Chapter 6). In 2007, the average amount of pesticide applied per hectare was much higher in conventional cotton (4 kg a.i./ha) than in biotech cotton (0.45 kg a.i./ha) (Paragraph 6.1). A similar change was observed in the number of active ingredients used but the differences were much smaller except in 2003 when the number of active ingredients used in conventional cotton exceeded the number used in biotech cotton by 15. As would be expected with the large difference in the amounts of pesticide used in the conventional cotton versus biotech cotton, the environmental hazards and the ETLs were much higher in conventional cotton than in biotech cotton (Paragraphs 6.3 and 6.4). The differences were less pronounced when considered in terms of pesticides that have an acute or chronic hazard to human health (Paragraph 6.2). In most of the investigated years the average amount used of substances with an extremely to high acute hazard to human health was almost equal for biotech cotton and conventional cotton.

69
However, it must be noted that average pesticide amounts used of these substances had been reduced prior to 2003 (Chapter 4). On the contrary, the average amount of carcinogenic pesticides (monocrotophos) applied per hectare was slightly higher in conventional cotton compared to biotech cotton (Figure 26). Given these findings for Australia, it is plausible that the introduction of biotech cotton varieties in Australia, India and USA contributed to the described decrease in pesticide use, human health hazards, and the ETLs. However, this study did not investigate the contribution of other causal factors (e.g., changes in registration policies, weather conditions, pest occurrence) to changes in pesticide use.


71
8 Conclusions
This study aimed to give an overview of pesticide use in cotton in Australia, Brazil, India, Turkey and USA. In four of the five countries biotech cotton varieties have been introduced. This chapter describes the most important observations focusing on the following four questions: 1) How has pesticide use in cotton evolved over 14 years? 2) What are the changes in hazards of pesticides used in cotton on environment and
human health according to the criteria used is this study? 8.1 Pesticide use, human health hazards, and the Environmental
Toxic Loads
The most significant observations according to this study are: • Brazil was the only country of the five investigated countries with an increase over
time of the average amount of pesticides (kg a.i.) applied per hectare of cotton. The average use per area tripled during the investigated period and the use in 2006 was 4 - 8 times higher than in the other countries. Additionally, the ETLs for fish, aquatic invertebrates, and bees increased over time. In 2006 the ETLs were 3 - 27 times higher than in the other four countries.
• Between 1995 and 2002, Australia applied the highest average amount of pesticides per hectare of cotton and applied the highest amount of highly or extremely hazardous substances for human health and environment of the five countries. However between 1999 and 2007 the average amount of pesticides per hectare of cotton strongly decreased as well as the associated human health hazards and the ETLs.
• For India, Turkey and USA the average pesticide use per area as well as the ETLs were lower in 2006 compared to 1994. However these trends were not consistent.
• The amounts used of substances hazardous to human health decreased in all of the five countries. In 2006 few substances were applied in cotton in the five investigated countries that are carcinogenic, genotoxic, or toxic to human reproduction. However, in 2006 noticeable amount of pesticides with high or extreme acute hazard to human health were still used in Brazil, India and USA. It should be noted that dealing with such pesticides in some countries, risk is mitigated by management techniques that reduce exposure to humans and the environment.
The pesticides that contributed most to the human health hazards and the ETLs in the investigated countries in 2006 (for Australia 2007) are given in Table 10. The substances listed contributed to more than 50% of the human health hazards (based on total amount of active ingredients of highly hazardous substances applied) and the ETLs. Two things must be noted in respect to these remarks: 1) Pesticides with a low toxicity and a high environmental persistence are not considered. Thus, these pesticides may even be a bigger threat to the environment than highly toxic pesticides

72
with a low environmental persistence; 2) The ETLs are based on the use across the entire cotton crop in a given country, and do not account for any regional variations in use, eg. extensive use of highly toxic pesticides in a particular area. Table 10: The most applied highly hazardous pesticides in cotton in 2006 (for Australia 2007).
Environment Human Health (Acute & Chronic) Fish Daphnia Bees
Australia Aldicarb Endosulfan Chlorpyrifos Deltamethrin
Methamidophos Endosulfan Lambda-cyhalothrin Zeta-cypermethrin
Parathion-methyl Diafenthiuron Cypermethrin
Methomyl Lambda-cyhalothrin Chlorpyrifos
Brazil
Zeta-cypermethrin Zeta-cypermethrin Zeta-cypermethrin
Monocrotophos Chlorpyrifos Chlorpyrifos Monocrotophos
Endosulfan Ethion Imidacloprid
India
Cypermethrin Spinosad
Monocrotophos Lambda-cyhalothrin Lambda-cyhalothrin Chlorpyrifos
Endosulfan Chlorpyrifos Thiodicarb
Turkey
Diafenthiuron Cypermethrin
Aldicarb Chlorpyrifos Chlorpyrifos Cyfluthrin
Dicrotophos Lambda-cyhalothrin Lambda-cyhalothrin Aldicarb
USA
Cypermethrin Dicrotophos
8.2 Impact of biotech cotton varieties
Data on pesticide use in Australia in both biotech cotton and conventional cotton in the timespan 2003 – 2007 showed that the average amount of pesticides applied per hectare as well as the associated ETLs was much higher in conventional cotton than in biotech cotton cotton. However, with regard to acute human health hazards, the differences were much less pronounced. In India and USA pesticide use as well as the associated human health hazards and ETLs decreased in the years following the introduction of biotech cotton varieties. It is plausible that the introduction of biotech cotton varieties contributed to these changes in pesticide use. However, it is not possible to assign the observed decrease with certainty to the introduction of biotech cotton varieties lone, since information on other causal factors (e.g., changes in registration policies, weather conditions, pest occurrence) were not take into account, nor was information on the proportion of hectares planted to biotech cotton varieties.

73
References
The Australian Cottongrower Yearbook, 1990 to 2007 – annual publication. Benbrook, C. M., D. L. Sexson, et al., 2002. ‘Developing a pesticide risk assessment tool to monitor progress in reducing reliance on high-risk pesticides.’ American Journal of Potato Research 79(3): 183-199. Crop Consultant Australia Inc., 2007. ‘Report for the International Cotton Advisory Committee. Historical survey data chemical usage in Australian cotton 1998-2007’. Prepared for Crop Consultant Australia Inc. by the Western Research Institute, 11th October 2007.’ GHS, 2008. Globally Harmonized System of Classification and labelling of chemicals; Part 3 Health Hazards. United Nations. Retrieved, October 2009. from http://www.unece.org/trans/danger/publi/ghs/ghs_rev02/02files_e.html FAO, 2002. International Code of Conduct on the Distribution and Use of Pesticides (Revised Version). http://www.fao.org/fileadmin/templates/agphome/documents/Pests_Pesticides/Code/code.pdf Kranthi K.R. and Russell D.A., 2009. Changing Trends in Cotton Pest Management, Integrated Pest Management: A Global Overview of History, Programs and Adoption. In Integrated Pest Management: Integrated Pest Management: Innovation-Development Process. Eds.Rajinder Peshin, Ashok K. Dhawan Gustafson, D.I., 1989. ‘Groundwater Ubiquity Score: a simple method for assessing pesticide leachability’. Environmental Toxicology and Chemistry 8: 339-357. Mensink, B.J.W.G., M. Montforts, et al., 1995. Manual for summarizing and evaluating the environmental aspects of plant protection products. Report no. 679101022. Bilthoven, The Netherlands, RIVM. Murray, Douglas L. (1994) Cultivating Crisis: The Human Cost of Pesticides in Latin America, Austin: University of Texas Press. Rajinder Peshin, Rakesh S. Bandral, WenJun Zhang, Lewis Wilson and Ashok K. Dhawan, 2009. Integrated Pest Management: A Global Overview of History, Programs and Adoption. In Integrated Pest Management: Integrated Pest Management: Innovation-Development Process. Eds. Rajinder Peshin, Ashok K. Dhawan OECD, 2003. ‘Descriptions of selected key generic terms used in chemical hazard/risk assessment. OECD series on testing and assessment’. Number 44.

74
Environmental directorate joint meeting of the chemicals committee and the working party on chemicals, pesticides and biotechnology. Walker, C. H., S. P. Hopkin, et al., Eds., 2001. Principles of Ecotoxicology, Taylor & Francis Group. ISBN 0 7484 0939 4 Williams, A. Personal communication. July, 2009. WHO, 2005. The WHO recommended classification of pesticides by hazard and guidelines to classification. ISBN 92 4 154663 8. Web sources CTGB, ‘Pesticide Database from the Board for the Authorisation of Plant Protection Products and Biocides’. Retrieved June, 2009, from www.ctgb.nl. ECB, ‘CLASSLAB database’. Retrieved July, 2009, from http://ecb.jrc.ec.europa.eu/classification-labelling/search-classlab. ECB, ‘Table 3.1: List of classification and labelling of hazardous substances’ Retrieved July, 2009, from http://ecb.jrc.ec.europa.eu/classification-labelling/. European Commission, ‘Decision and review reports of active substances which are approved by the EU (DIR 91/414/EEC)’. Retrieved June, 2009, from http://ec.europa.eu/food/plant/protection/evaluation/dir91-414eec_en.htm. European Food Safety Authority, ‘Draft assessment reports’. Retrieved July 2009, from http://dar.efsa.europa.eu/dar-web/provision. FAO, ‘FAOSTAT’, Retrieved July, 2009, from http://FAOSTAT.fao.org. PPDB, 2009. The Pesticide Properties Database (PPDB) developed by the Agriculture & Environment Research Unit (AERU), University of Hertfordshire, funded by UK national sources and the EU-funded FOOTPRINT project (FP6-SSP-022704). Retrieved June, 2009 from http://www.eu-footprint.org/ppdb.html US-EPA, ‘The ECOTOX (ECOTOXicology) database provides single chemical toxicity information for aquatic and terrestrial life’. Retrieved June, 2009, from http://cfpub.epa.gov/ecotox/. US-EPA, ‘Technical Overview of Ecological Risk Assessment: Ecotoxicity Categories for Terrestrial and Aquatic Organisms’. Retrieved July, 2009, from http://www.epa.gov/oppefed1/ecorisk_ders/toera_analysis_eco.htm. US-EPA, 2008. ‘Chemicals Evaluated for Carcinogenic Potential ‘Retrieved July, 2009, from http://epa.gov/pesticides/carlist/.

75


77
Appendix 1 Dataset 2, formulations names and conversion rates
Table A 1: Conversion rates used to convert dose rates of formulation into dose rates of active ingredient
Formulation Active ingredient Conversion rate g a.i. /L or kg of formulation
Abamectin 18SC Abamectin 18
Acetamiprid Acetamiprid 225
Aldicarb 150G Aldicarb 150
Alpha-Cypermethrin 100EC Alpha-Cypermethrin 100
Alpha-Cypermethrin 16UL Alpha-Cypermethrin 16
Amitraz 200EC Amitraz 200
Amitraz 200UL Amitraz 200
Beta-cyfluthrin 25EC/UL Beta-cyfluthrin 25
Beta-cyfluthrin 8UL Beta-cyfluthrin 8
Bifenthrin 100EC Bifenthrin 100
Biopest Unknown Unknown
Carbaryl 500EC Carbaryl 500
Carbosulfan 250EC Carbosulfan 250
Chlorfenapyr 360SC Chlorfenapyr 360
Chlorpyrifos 300EC/UL Chlorpyrifos 300
Chlorpyrifos 500EC Chlorpyrifos 500
Chlorpyrifos 750 Chlorpyrifos 750
Chlorpyrifos-methyl EC/UL Chlorpyrifos-M 500
Cypermethrin 200EC Cypermethrin 200
Cypermethrin 40UL Cypermethrin 40
Deltamethrin 27.5EC Deltamethrin 27.5
Deltamethrin 5.5UL Deltamethrin 5.5
Diafenthiuron 500SC Diafenthiuron 500
Dimethoate 400EC Dimethoate 400
Emamectin Emamectin Benzoate 17
Endosulfan 350EC Endosulfan 350
Esfenvalerate 10UL Esfenvalerate 10
Esfenvalerate EC/UL Esfenvalerate 50
Etoxazole- Paramite Etoxazole 110
Fipronil 200SC Fipronil 200
Food spray Unknown Unknown
Imidacloprid 200SC Imidacloprid 200
Indoxacarb Indoxacarb 200
Lambda-Cyhalothrin 6UL Lambda-Cyhalothrin 6
Lambda-Cyhalothrin EC/UL Lambda-Cyhalothrin 250
Lambda-Cyhalothrin ZEON Lambda-Cyhalothrin 250
Methidathion 400EC Methidathion 400
Methomyl 225LC Methomyl 225
NPV-Gemstar Unknown Unknown
NPV-Vivus Unknown Unknown
Omethoate 800SL Omethoate 800
Parathion-methyl 500EC Parathion-m 500
Phorate 200G Phorate 200
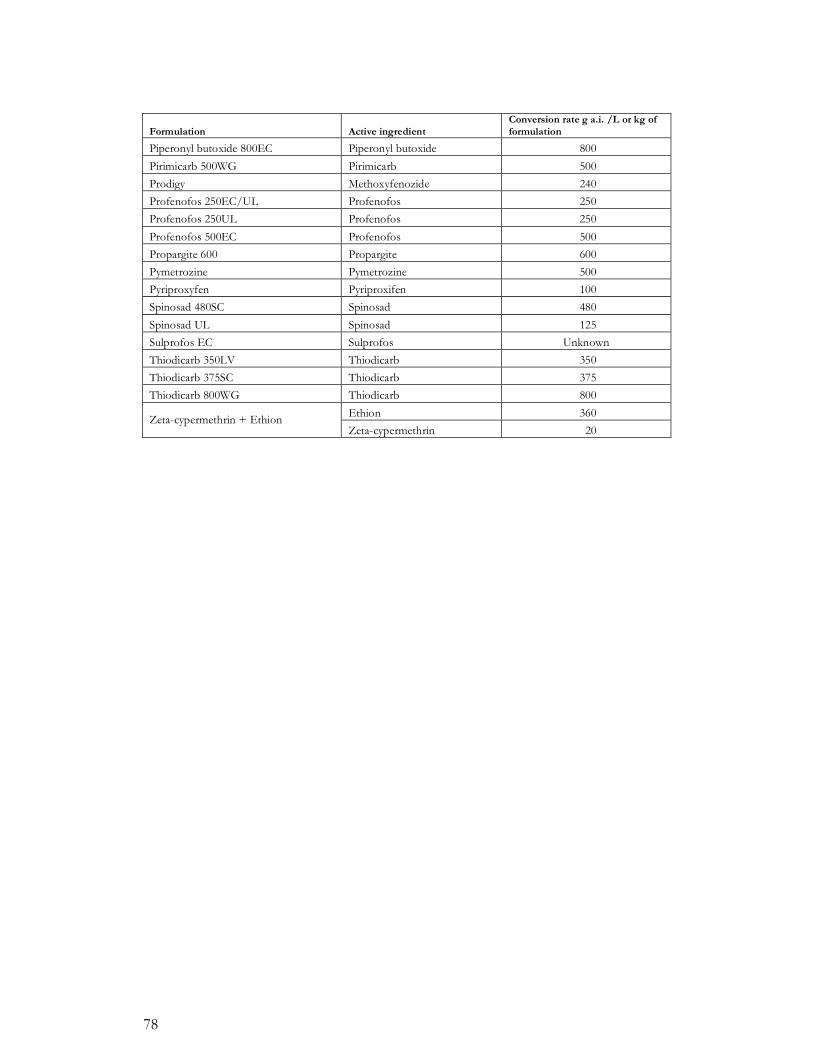
78
Formulation Active ingredient Conversion rate g a.i. /L or kg of formulation
Piperonyl butoxide 800EC Piperonyl butoxide 800
Pirimicarb 500WG Pirimicarb 500
Prodigy Methoxyfenozide 240
Profenofos 250EC/UL Profenofos 250
Profenofos 250UL Profenofos 250
Profenofos 500EC Profenofos 500
Propargite 600 Propargite 600
Pymetrozine Pymetrozine 500
Pyriproxyfen Pyriproxifen 100
Spinosad 480SC Spinosad 480
Spinosad UL Spinosad 125
Sulprofos EC Sulprofos Unknown
Thiodicarb 350LV Thiodicarb 350
Thiodicarb 375SC Thiodicarb 375
Thiodicarb 800WG Thiodicarb 800
Ethion 360 Zeta-cypermethrin + Ethion Zeta-cypermethrin 20

79
Appendix 2 Physical properties of active ingredients
Table A 2: Per active ingredients the physical properties, the calculated GUS value and the ranking of the potential to leach to groundwater.
active ingredient DT50_soil (days)
KOC (L/kg)
GUS Potential to leach to groundwater
1,3-dichloropropene 9.30 34.00 2.39 Moderate
Abamectin 30.00 14197.14 -0.22 Very Low
Acephate 2.53 23.70 1.06 Low
Acetamiprid 2.60 107.92 0.82 Very Low
Aldicarb 6.09 30.00 1.98 Low
Alpha-cypermethrin 35.00 57889.00 -1.18 Very Low
Amitraz 0.83 141.37 -0.15 Very Low
Azadirachtin 26.00 6.50 4.51 Very High
Azinphos-methyl 10.00 1000.00 1.00 Low
Bacillus thuringiensis 2.70 5000.00 0.13 Very Low
Benfuracarb 0.50 9100.00 -0.01 Very Low
Beta-cyfluthrin 13.00 64300.00 -0.90 Very Low
Beta-cypermethrin 10.00 Unknown Unknown Unknown
Bifenthrin 106.40 236610.00 -2.79 Very Low
Bromopropylate 58.50 6309.00 0.35 Very Low
Buprofezin 135.40 2209.31 1.40 Low
Cadusafos 38.00 227.00 2.60 Moderate
Carbaryl 16.00 211.00 2.02 Moderate
Carbofuran 12.80 42.88 2.62 Moderate
Carbosulfan 29.20 9489.00 0.03 Very Low
Cartap 3.00 Unknown Unknown Unknown
Chlorfenapyr 1.40 12000.00 -0.01 Very Low
Chlorfluazuron 90.00 20790.00 -0.62 Very Low
Chloropicrin 3.00 81.00 1.00 Very Low
Chlorpyrifos 50.00 8151.00 0.15 Very Low
Chlorpyrifos-m 3.00 4645.00 0.16 Very Low
Clofentezine 50.71 1025.78 1.69 Low
Clothianidin 830.00 215.00 4.87 Very High
Cyfluthrin 33.00 64300.00 -1.23 Very Low
Cyhexatin 29.50 1028.65 1.45 Low
Cypermethrin 68.00 86779.26 -1.72 Very Low
Deltamethrin 25.88 475.82 1.87 Low
Diafenthiuron 0.50 43546.00 0.19 Very Low
Diazinon 9.10 693.00 1.11 Low
Dichlorvos 2.00 50.00 0.69 Very Low
Dicofol 80.00 6064.00 0.41 Very Low
Dicrotophos 28.00 75.00 3.08 High
Diflubenzuron 48.76 10365.77 -0.03 Very Low
Dimethoate 4.89 2633.65 0.40 Very Low
Disulfoton 30.00 1345.00 1.29 Low
Emamectin Benzoate Unknown 10.00 Unknown Unknown

80
active ingredient DT50_soil (days)
KOC (L/kg)
GUS Potential to leach to groundwater
Endosulfan 39.00 11500.00 -0.10 Very Low
Esfenvalerate 55.00 5300.00 0.48 Very Low
Ethion 90.00 10000.00 0.00 Very Low
Ethoprophos 17.00 110.00 2.41 Moderate
Etofenprox 11.00 9025.00 0.05 Very Low
Etoxazole 19.00 83230.00 -1.18 Very Low
Etridiazole 20.00 289.00 2.00 Moderate
Fenazaquin 45.00 16702.00 -0.37 Very Low
Fenbutatin oxide 365.00 183550.00 -3.24 Very Low
Fenitrothion 2.70 322.00 0.64 Very Low
Fenpropathrin 34.00 25739.32 -0.63 Very Low
Fenthion 22.00 1500.00 1.11 Low
Fenvalerate 40.00 5273.00 0.45 Very Low
Fipronil 142.00 737.87 2.44 Moderate
Flonicamid 3.10 21.40 1.31 Low
Flufenoxuron 42.00 3200.00 0.80 Very Low
Fonofos 99.00 870.00 2.12 Moderate
Furathiocarb 1.00 577.00 0.00 Very Low
Gamma-cyhalothrin 50.00 59677.00 -1.32 Very Low
Hexaflumuron 57.00 10391.00 -0.03 Very Low
Hexythiazox 30.00 6287.43 0.30 Very Low
Imidacloprid 179.00 225.00 3.71 High
Indoxacarb 17.00 6450.00 0.23 Very Low
Lambda-cyhalothrin 57.60 159627.32 -2.12 Very Low
Lindane 121.00 1100.00 2.00 Low
Lufenuron 16.30 41182.00 -0.75 Very Low
Malathion 0.18 217.00 -1.24 Very Low
Mephosfolan Unknown Unknown Unknown Unknown
Metaldehyde 8.75 85.00 1.95 Low
Metam-potassium Unknown Unknown Unknown Unknown
Metam-sodium 7.00 17.80 2.32 Moderate
Methamidophos 4.00 1.00 2.41 Moderate
Methidathion 10.00 400.00 1.40 Low
Methomyl 7.00 25.52 2.19 Moderate
Methoxyfenozide 1008.00 402.00 4.19 Very High
Methyl-bromide 55.00 39.00 4.19 Very High
Mevinphos 1.20 44.00 0.19 Very Low
Monocrotophos 7.00 19.00 2.30 Moderate
Naled 1.00 180.00 0.00 Very Low
Novaluron 72.00 9232.00 0.06 Very Low
Omethoate 14.00 41.00 2.74 Moderate
Oxamyl 5.25 17.00 1.99 Low
Oxydemeton-m 1.00 10.00 0.00 Very Low
Parathion 49.00 7660.00 0.20 Very Low
Parathion-methyl 12.00 240.00 1.75 Low
Permethrin 13.00 100000.00 -1.11 Very Low

81
active ingredient DT50_soil (days)
KOC (L/kg)
GUS Potential to leach to groundwater
Phenthoate 1.00 1000.00 0.00 Very Low
Phorate 63.00 1660.00 1.40 Low
Phosalone 26.50 600.94 1.74 Low
Phosmet 3.10 3212.00 0.24 Very Low
Phosphamidon 9.20 33.00 2.39 Moderate
Piperonyl butoxide 13.00 89125.00 -1.06 Very Low
Pirimicarb 33.30 388.00 2.15 Moderate
Pirimiphos-methyl 39.00 1100.00 1.53 Low
Potassium-bicarbonate Unknown Unknown Unknown Unknown
Potassium-oleate Unknown Unknown Unknown Unknown
Profenofos 7.00 2015.36 0.59 Very Low
Propargite 56.00 56500.00 -1.31 Very Low
Pymetrozine 14.00 1510.00 0.94 Very Low
Pyrethrins 8.00 100000.00 -0.90 Very Low
Pyridalyl 140.00 Unknown Unknown Unknown
Pyridaphenthion 18.00 7211.00 0.18 Very Low
Pyriproxyfen 10.00 21175.00 -0.33 Very Low
Quinalphos 21.00 1484.36 1.10 Low
Quintozene 210.00 4599.63 0.78 Very Low
Rotenone 2.00 10000.00 0.00 Very Low
Spinosad 14.00 34600.00 -0.62 Very Low
Spiromesifen 23.00 30900.00 -0.67 Very Low
Sulfluramid Unknown 3500000.00 Unknown Unknown
Sulphur 30.00 1950.00 1.05 Low
Sulprofos 143.00 25900.00 -0.89 Very Low
Tau-fluvalinate 4.00 750746.00 -1.13 Very Low
Tebufenozide 400.00 623.00 3.14 High
Teflubenzuron 92.00 26062.00 -0.82 Very Low
Terbufos 8.00 500.00 1.17 Low
Tetradifon 112.00 100.00 4.10 Very High
Thiacloprid 15.50 615.00 1.44 Low
Thiamethoxam 51.00 56.20 3.84 High
Thiodicarb 0.67 418.00 -0.24 Very Low
Thiometon 2.00 579.00 0.37 Very Low
Tralomethrin 3.00 359732.00 -0.74 Very Low
Triazophos 44.00 358.00 2.38 Moderate
Trichlorfon 18.00 10.00 3.77 High
Triflumuron 22.00 2757.00 0.75 Very Low
Trimethacarb Unknown 400.00 Unknown Unknown
Vamidothion 1.80 70.00 0.55 Very Low
Zeta-cypermethrin 21.00 121786.00 -1.44 Very Low


83
Appendix 3 Toxicity of active ingredients
Colour codes are used to distinguish between low, medium and high hazard levels. Green indicates practically nontoxic to slightly toxic; blue indicates moderately toxic; and red indicates toxic to extremely toxic. Table A 3: Toxicity of active ingredients
active ingredient LD50 Bees (�g/bee)
LEC50 Fish (mg/L)
EC50 Algae (mg/L)
LEC50 Daphnia (mg/L)
1,3-dichloropropene 6.6 2.780 2.35 3.600
Abamectin 0.0022 0.004 100 0.000
Acephate 1.2 175.000 1000 36.606
Acetamiprid 8.09 100.000 98.3 49.800
Aldicarb 0.09 0.422 50 0.411
Alpha-cypermethrin 0.033 0.003 0.1 0.000
Amitraz 3.8 0.657 12 0.035
Azadirachtin 2.5 0.480 Unknown 11.600
Azinphos-methyl 0.06 0.020 7.15 0.001
Benfuracarb 0.19 0.038 2.2 0.010
Beta-cyfluthrin 0.001 0.005 10 0.000
Beta-cypermethrin 0.0018 0.030 56.2 0.000
Bifenthrin 0.015 0.001 50 0.001
Bromopropylate 183 0.557 52 0.170
Buprofezin 163.5 0.330 2.1 0.420
Cadusafos 1.08 130.000 4300 0.750
Carbaryl 0.14 2.600 0.6 0.006
Carbofuran 0.04 0.219 6.5 0.020
Carbosulfan 0.18 0.015 47 0.002
Cartap 10 1.600 Unknown 0.010
Chlorfenapyr 0.12 0.007 0.132 0.006
Chlorfluazuron 100 300.000 Unknown 0.001
Chloropicrin Unknown 4.800 0.11 150.000
Chlorpyrifos 0.059 0.001 0.48 0.000
Chlorpyrifos-m 0.38 0.410 0.57 0.001
Clofentezine 84.5 23.108 0.32 200.000
Clothianidin 0.004 117.000 70 40.000
Cyfluthrin 0.001 0.000 10 0.000
Cyhexatin 32 0.005 0.1 0.600
Cypermethrin 0.035 0.001 1.3 0.000
Deltamethrin 0.0015 0.008 Unknown 0.000
Diafenthiuron 1.5 0.001 50 0.500
Diazinon 0.09 3.100 6.4 0.001
Dichlorvos 0.29 0.318 52.8 0.000
Dicofol 50 0.510 0.075 0.140
Dicrotophos 0.068 6.300 Unknown 0.013
Diflubenzuron 100 0.184 0.3 0.003
Dimethoate 0.1 30.000 300 4.700

84
active ingredient LD50 Bees (�g/bee)
LEC50 Fish (mg/L)
EC50 Algae (mg/L)
LEC50 Daphnia (mg/L)
Disulfoton 4.1 0.039 0.036 0.013
Emamectin Benzoate 0.0035 0.174 Unknown 0.001
Endosulfan 7.8 0.002 2.15 0.440
Esfenvalerate 0.06 0.000 0.0065 0.001
Ethion 20.6 0.500 Unknown 0.000
Ethoprophos 5.56 0.740 2.4 0.095
Etofenprox 0.13 0.003 0.15 0.001
Etoxazole 200 20.000 10 40.000
Etridiazole Unknown 2.400 0.3 3.100
Fenazaquin 1.21 0.004 49 0.004
Fenbutatin oxide 200 0.001 0.0005 0.048
Fenitrothion 0.16 2.608 3.9 0.002
Fenpropathrin 0.05 0.001 2 0.001
Fenthion 0.308 0.800 1.79 0.006
Fenvalerate 0.23 0.004 50 0.000
Fipronil 0.00417 0.240 0.068 0.190
Flonicamid 53300 100.000 119 100.000
Flufenoxuron 410 0.005 0.00395 0.000
Fonofos 3.3 0.028 1.5 0.002
Furathiocarb Unknown 0.030 340 0.002
Gamma-cyhalothrin 0.005 0.001 3.51 0.000
Hexaflumuron 0.1 100.000 3.2 0.000
Hexythiazox 112 0.040 0.4 0.470
Imidacloprid 0.0037 227.000 10 85.300
Indoxacarb 0.18 0.650 0.11 0.600
Lambda-cyhalothrin 0.038 0.000 0.3 0.000
Lindane 0.56 0.003 2.5 1.600
Lufenuron 197 29.000 10 0.001
Malathion 0.71 0.022 13 0.001
Mephosfolan Unknown 0.040 52.8 0.000
Metaldehyde 87.5 75.000 75.9 78.400
Metam-potassium Unknown Unknown Unknown Unknown
Metam-sodium 36.2 0.175 0.556 0.990
Methamidophos 0.22 25.000 178 0.270
Methidathion 0.13 0.010 22 0.006
Methomyl 0.16 1.104 6.311208735 0.195
Methoxyfenozide 100 2.800 3.4 3.700
Methyl-bromide 50 3.900 3.2 2.600
Mevinphos 0.027 0.018 71 1.460
Monocrotophos 0.02 7.000 Unknown 0.023
Naled 0.48 0.195 0.00035 0.000
Novaluron 100 1.000 9.68 0.058
Omethoate 0.048 9.100 167.5 0.021
Oxamyl 0.38 3.130 0.93 0.319
Oxydemeton-m 0.31 17.000 100 0.110
Parathion 0.04 1.500 0.5 0.003

85
active ingredient LD50 Bees (�g/bee)
LEC50 Fish (mg/L)
EC50 Algae (mg/L)
LEC50 Daphnia (mg/L)
Parathion-methyl 19.5 2.700 3 0.007
Permethrin 0.029 0.006 0.0125 0.000
Phenthoate 0.306 2.500 Unknown 0.002
Phorate 0.32 0.013 1.3 0.004
Phosalone 4.5 0.630 1.1 0.001
Phosmet 0.22 0.230 0.07 0.002
Phosphamidon 0.17 6.000 260 0.008
Piperonyl butoxide 25 5.300 0.24 0.510
Pirimicarb 40 42.881 140 0.014
Pirimiphos-methyl 0.22 0.404 1 0.000
Potassium-bicarbonate Unknown Unknown Unknown Unknown
Potassium-oleate Unknown Unknown Unknown Unknown
Profenofos 0.095 0.080 Unknown 0.500
Propargite 15 0.118 1.08 0.098
Pymetrozine 117 100.000 21.6 87.000
Pyrethrins 0.15 0.032 320 0.025
Pyridalyl 100 0.500 Unknown Unknown
Pyridaphenthion 0.08 7.500 Unknown Unknown
Pyrimidifen Unknown Unknown Unknown Unknown
Pyriproxyfen 100 0.270 0.056 0.400
Quinalphos 0.07 0.005 Unknown 0.001
Quintozene 100 0.100 6.72 0.770
Rotenone 0.24 0.002 0.6 0.004
Spinosad 0.0029 30.000 0.09 14.000
Spiromesifen 200 0.016 0.094 0.092
Sulfluramid Unknown 8.000 Unknown 0.370
Sulphur 50 0.063 0.063 0.063
Sulprofos Unknown 11.000 64 0.001
Tau-fluvalinate 5.83 0.003 10 0.009
Tebufenozide 234 3.000 0.64 3.800
Teflubenzuron 72 0.007 0.02 0.003
Terbufos 4.1 0.004 1.4 0.000
Tetradifon 11 880.000 100 2.000
Thiacloprid 17.32 27.724 63.983629765 85.100
Thiamethoxam 0.024 100.000 100 100.000
Thiodicarb 0.153 2.662 8.3 0.027
Thiometon 0.56 5.641 12.8 8.090
Tralomethrin 0.13 0.002 Unknown 0.000
Triazophos 14.35 0.038 9.1 0.003
Trichlorfon 0.4 0.700 10 0.001
Triflumuron 200 320.000 0.025 0.002
Trimethacarb Unknown 40.000 25 30.000
Vamidothion 0.15 590.000 1525 0.190
Zeta-cypermethrin 0.002 0.001 1 0.000


87
Appendix 4 Functional and chemical groups
The information on functional and chemical groups was provided by dataset 1.
Table A 4: Functional and chemical groups
Active ingredient Functional and chemical group Abamectin Insecticide: Macrocyclic lactone Acephate Insecticide: Phosphoramidothioate Acetamiprid Insecticide: Nicotinoid Aldicarb Nematicide Alphacypermethrin Insecticide: Pyrethroid Amitraz Acaricide Azadirachtin Insecticide: Botanical Azinphos-m Insecticide: Organophosphate Bacillus-thuringiensis Biological insecticide Benfuracarb Insecticide: Carbamate Betacyfluthrin Insecticide: Pyrethroid Betacypermethrin Insecticide: Pyrethroid Bifenthrin Insecticide: Pyrethroid Bromopropylate Acaricide Bt-Cotton-GM Transgenic crop Buprofezin Insecticide: IGR Cadusafos Insecticide: Organophosphate Carbaryl Insecticide: Carbamate Carbofuran Insecticide: Carbamate Carbosulfan Insecticide: Carbamate Cartap Insecticide: Nereistoxin analogue Chlorfenapyr Insecticide: Pyrrole Chlorfluazuron Insecticide: IGR Chloropicrin Insecticide: Fumigant Chlorpyrifos-e Insecticide: Organophosphate Chlorpyrifos-m Insecticide: Organophosphate Clofentezine Acaricide Clothianidin Insecticide: Nicotinoid Cyfluthrin Insecticide: Pyrethroid Cyhexatin Acaricide Cypermethrin Insecticide: Pyrethroid Deltamethrin Insecticide: Pyrethroid Diafenthiuron Insecticide: Thiourea Diazinon Insecticide: Organophosphate Dichloropropene Nematicide Dichlorvos(DDVP) Insecticide: Organophosphate Dicofol Acaricide Dicrotophos Insecticide: Organophosphate Diflubenzuron Insecticide: IGR Dimethoate Insecticide: Organophosphate Disulfoton Insecticide: Organophosphate Emamectin Insecticide: Macrocyclic lactone Endosulfan Insecticide: Cyclodiene

88
Active ingredient Functional and chemical group Esfenvalerate Insecticide: Pyrethroid Ethion Insecticide: Organophosphate Ethoprophos Nematicide Etofenprox Insecticide: Pyrethroid Etoxazole Acaricide Etridiazole Fungicide: Thiazole Fenazaquin Acaricide Fenbutatin-oxide Acaricide Fenitrothion Insecticide: Organophosphate Fenpropathrin Insecticide: Pyrethroid Fenthion Insecticide: Organophosphate Fenvalerate Insecticide: Pyrethroid Fipronil Insecticide: Pyrazole Flonicamid Insecticide: Nicotinoid Flufenoxuron Insecticide: IGR Fonofos Insecticide: Organophosphate Furathiocarb Insecticide: Carbamate Gamma-cyhalothrin Insecticide: Pyrethroid Gossyplure Insecticide: Pheromone Harpin-protein Biological fungicide Hexaflumuron Insecticide: IGR Hexythiazox Acaricide Imidacloprid Insecticide: Nicotinoid Indoxacarb Insecticide: Oxadiazine Lambda-cyhalothrin Insecticide: Pyrethroid Lindane Insecticide: Organochlorine Lufenuron Insecticide: IGR Malathion Insecticide: Organophosphate Mephosfolan Insecticide: Phosphoramidate Metaldehyde Molluscicide Metam-potassium Nematicide Metam-sodium Insecticide: Unknown Methamidophos Insecticide: Organophosphate Methidathion Insecticide: Organophosphate Methomyl Insecticide: Carbamate Methoxyfenozide Insecticide: IGR Methyl-bromide Insecticide: Fumigant Mevinphos Insecticide: Organophosphate Monocrotophos Insecticide: Organophosphate Naled Insecticide: Organophosphate Novaluron Insecticide: IGR Omethoate Insecticide: Organophosphate Other pyrethroids Insecticide: Pyrethroid Oxamyl Nematicide Oxydemeton-m Insecticide: Organophosphate Parathion-e Insecticide: Organophosphate Parathion-m Insecticide: Organophosphate Permethrin Insecticide: Pyrethroid
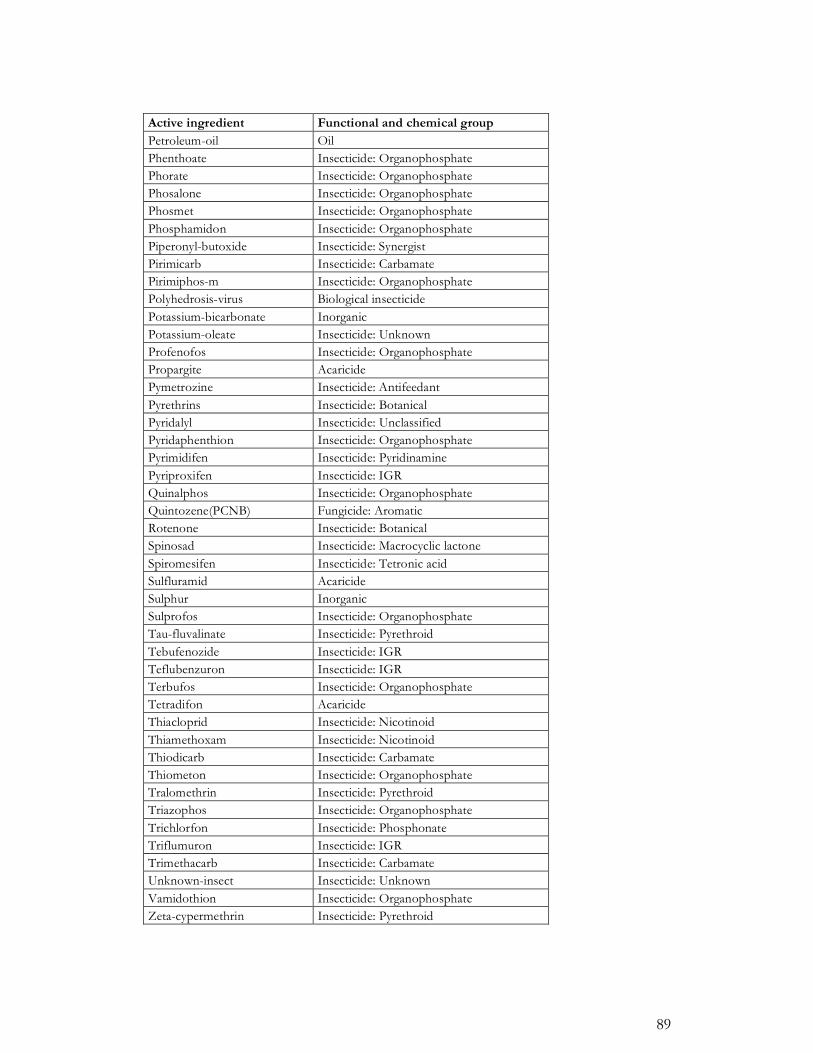
89
Active ingredient Functional and chemical group Petroleum-oil Oil Phenthoate Insecticide: Organophosphate Phorate Insecticide: Organophosphate Phosalone Insecticide: Organophosphate Phosmet Insecticide: Organophosphate Phosphamidon Insecticide: Organophosphate Piperonyl-butoxide Insecticide: Synergist Pirimicarb Insecticide: Carbamate Pirimiphos-m Insecticide: Organophosphate Polyhedrosis-virus Biological insecticide Potassium-bicarbonate Inorganic Potassium-oleate Insecticide: Unknown Profenofos Insecticide: Organophosphate Propargite Acaricide Pymetrozine Insecticide: Antifeedant Pyrethrins Insecticide: Botanical Pyridalyl Insecticide: Unclassified Pyridaphenthion Insecticide: Organophosphate Pyrimidifen Insecticide: Pyridinamine Pyriproxifen Insecticide: IGR Quinalphos Insecticide: Organophosphate Quintozene(PCNB) Fungicide: Aromatic Rotenone Insecticide: Botanical Spinosad Insecticide: Macrocyclic lactone Spiromesifen Insecticide: Tetronic acid Sulfluramid Acaricide Sulphur Inorganic Sulprofos Insecticide: Organophosphate Tau-fluvalinate Insecticide: Pyrethroid Tebufenozide Insecticide: IGR Teflubenzuron Insecticide: IGR Terbufos Insecticide: Organophosphate Tetradifon Acaricide Thiacloprid Insecticide: Nicotinoid Thiamethoxam Insecticide: Nicotinoid Thiodicarb Insecticide: Carbamate Thiometon Insecticide: Organophosphate Tralomethrin Insecticide: Pyrethroid Triazophos Insecticide: Organophosphate Trichlorfon Insecticide: Phosphonate Triflumuron Insecticide: IGR Trimethacarb Insecticide: Carbamate Unknown-insect Insecticide: Unknown Vamidothion Insecticide: Organophosphate Zeta-cypermethrin Insecticide: Pyrethroid

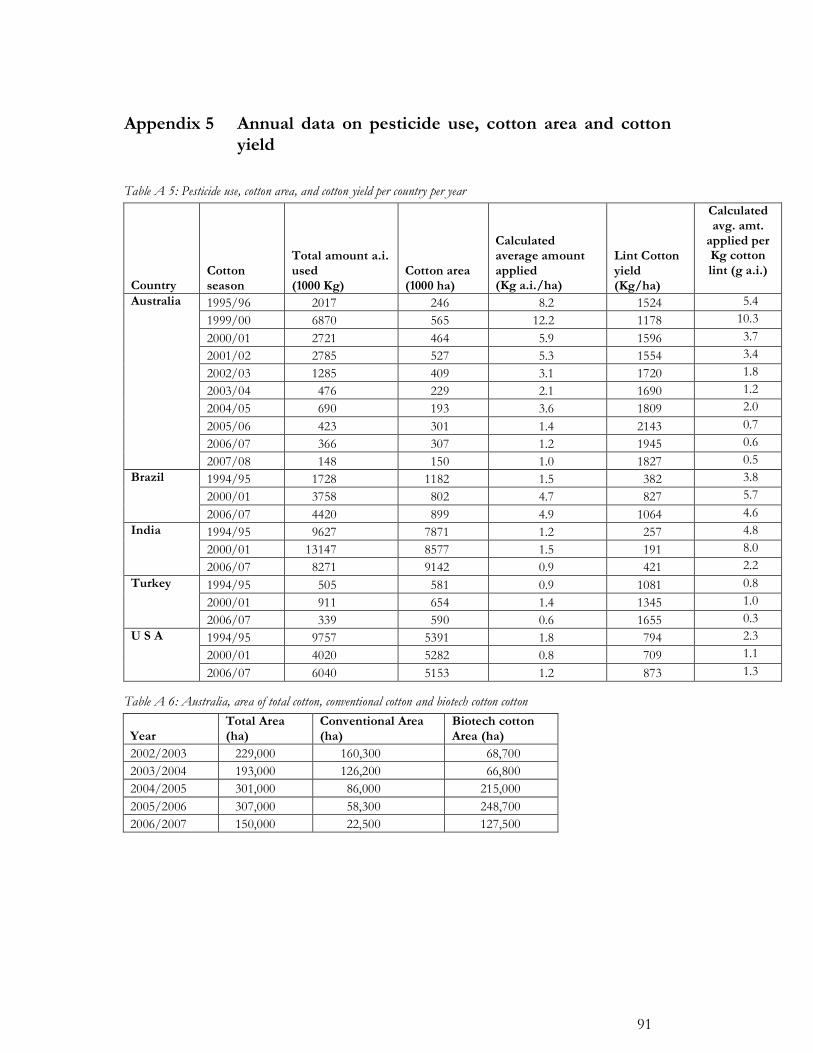
91
Appendix 5 Annual data on pesticide use, cotton area and cotton yield
Table A 5: Pesticide use, cotton area, and cotton yield per country per year
Country Cotton season
Total amount a.i. used (1000 Kg)
Cotton area (1000 ha)
Calculated average amount applied (Kg a.i./ha)
Lint Cotton yield (Kg/ha)
Calculated avg. amt.
applied per Kg cotton lint (g a.i.)
1995/96 2017 246 8.2 1524 5.4
1999/00 6870 565 12.2 1178 10.3
2000/01 2721 464 5.9 1596 3.7
2001/02 2785 527 5.3 1554 3.4
2002/03 1285 409 3.1 1720 1.8
2003/04 476 229 2.1 1690 1.2
2004/05 690 193 3.6 1809 2.0
2005/06 423 301 1.4 2143 0.7
2006/07 366 307 1.2 1945 0.6
Australia
2007/08 148 150 1.0 1827 0.5
1994/95 1728 1182 1.5 382 3.8
2000/01 3758 802 4.7 827 5.7 Brazil
2006/07 4420 899 4.9 1064 4.6
1994/95 9627 7871 1.2 257 4.8
2000/01 13147 8577 1.5 191 8.0 India
2006/07 8271 9142 0.9 421 2.2
1994/95 505 581 0.9 1081 0.8
2000/01 911 654 1.4 1345 1.0 Turkey
2006/07 339 590 0.6 1655 0.3
1994/95 9757 5391 1.8 794 2.3
2000/01 4020 5282 0.8 709 1.1 U S A
2006/07 6040 5153 1.2 873 1.3
Table A 6: Australia, area of total cotton, conventional cotton and biotech cotton cotton
Year Total Area (ha)
Conventional Area (ha)
Biotech cotton Area (ha)
2002/2003 229,000 160,300 68,700 2003/2004 193,000 126,200 66,800 2004/2005 301,000 86,000 215,000 2005/2006 307,000 58,300 248,700 2006/2007 150,000 22,500 127,500

92
Appendix 6 Human health hazards of active ingredients
Colour codes are used to distinguish between low, medium and high hazard levels. Green indicates a low hazard, blue indicates a moderate hazard, and red indicates a high to extremely high hazard.
Table A 7: Human health hazards per active ingredient
active ingredient Carcinogenicity Genotoxicity Toxicity to reproduction WHO Hazard
1,3-dichloropropene Not Carcinogenic No genotoxic potential No evidence to have adverse effects on reproduction Fumigant not classified
Abamectin Not Carcinogenic No genotoxic potential R63 - Possible risk of harm to the unborn child Unknown
Acephate Not Carcinogenic No genotoxic potential No evidence to have adverse effects on reproduction Slightly hazardous
Acetamiprid Not Carcinogenic No genotoxic potential No evidence to have adverse effects on reproduction Unknown
Aldicarb Not Carcinogenic No genotoxic potential No evidence to have adverse effects on reproduction Extremely hazardous
Alpha-cypermethrin Not Carcinogenic No genotoxic potential No evidence to have adverse effects on reproduction Moderately hazardous
Amitraz Not Carcinogenic No genotoxic potential No evidence to have adverse effects on reproduction Slightly hazardous
Azadirachtin Unknown Unknown Unknown Unknown
Azinphos-methyl Not Carcinogenic No genotoxic potential No evidence to have adverse effects on reproduction Highly hazardous
Benfuracarb Not Carcinogenic No genotoxic potential No evidence to have adverse effects on reproduction Moderately hazardous
Beta-cyfluthrin Not Carcinogenic No genotoxic potential No evidence to have adverse effects on reproduction Moderately hazardous
Beta-cypermethrin Unknown Unknown Unknown Moderately hazardous
Bifenthrin R40 - May cause cancer No genotoxic potential No evidence to have adverse effects on reproduction Moderately hazardous
Bromopropylate Unknown Unknown Unknown Unknown
Buprofezin Not Carcinogenic No genotoxic potential No evidence to have adverse effects on reproduction
Unlikely to present acute hazard in normal use
Cadusafos Not Carcinogenic No genotoxic potential No evidence to have adverse effects on reproduction Highly hazardous
Carbaryl H351 - Suspected of causing cancer No genotoxic potential
No evidence to have adverse effects on reproduction Moderately hazardous
Carbofuran Not Carcinogenic No genotoxic potential No evidence to have adverse effects on reproduction Highly hazardous
Carbosulfan Not Carcinogenic No genotoxic potential No evidence to have adverse effects on reproduction Moderately hazardous
Cartap Not Carcinogenic No genotoxic potential No evidence to have adverse effects on reproduction Moderately hazardous
Chlorfenapyr Not Carcinogenic No genotoxic potential No evidence to have adverse effects on reproduction Moderately hazardous
Chlorfluazuron Unknown Unknown Unknown Unlikely to present acute hazard in normal use
Chloropicrin Not Carcinogenic No genotoxic potential No evidence to have adverse effects on reproduction Fumigant not classified
Chlorpyrifos Not Carcinogenic No genotoxic potential No evidence to have adverse effects on reproduction Moderately hazardous
Chlorpyrifos-m Not Carcinogenic No genotoxic potential No evidence to have adverse effects on reproduction
Unlikely to present acute hazard in normal use
Clofentezine Not Carcinogenic No genotoxic potential No evidence to have adverse effects on reproduction Unknown
Clothianidin Not Carcinogenic Unknown Unknown Unknown
Cyfluthrin Not Carcinogenic No genotoxic potential No evidence to have adverse effects on reproduction Highly hazardous
Cyhexatin Not Carcinogenic No genotoxic potential No evidence to have adverse effects on reproduction Slightly hazardous
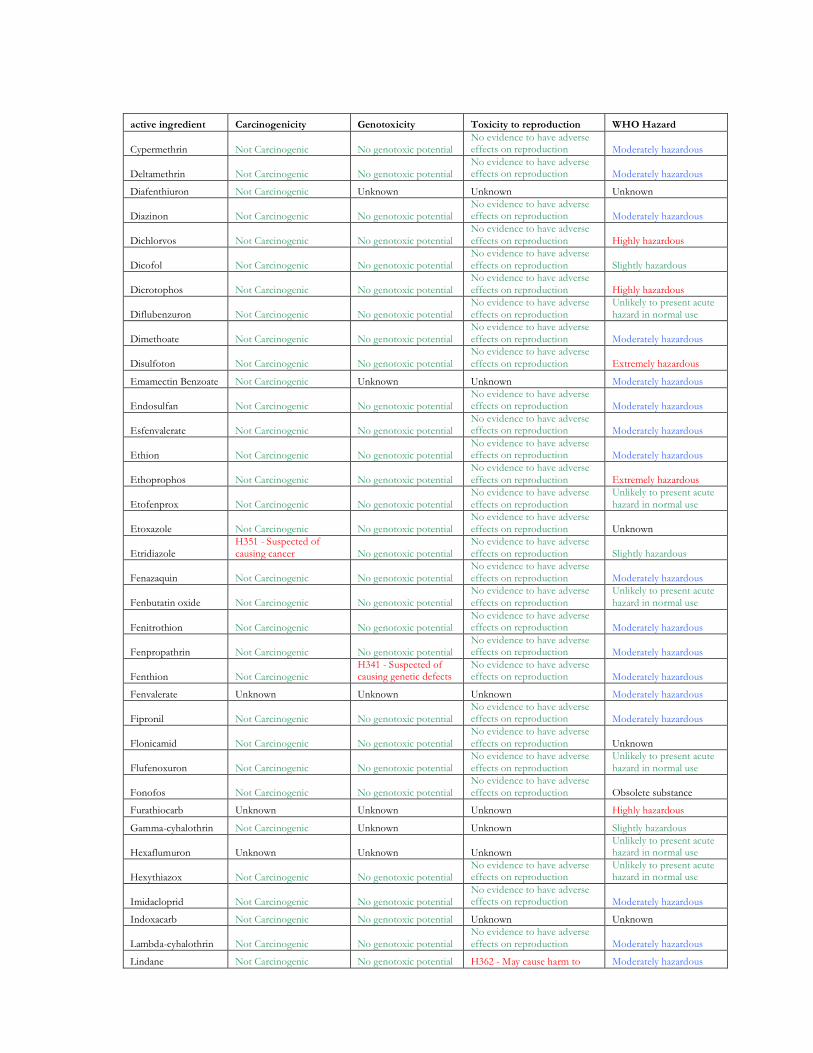
93
active ingredient Carcinogenicity Genotoxicity Toxicity to reproduction WHO Hazard
Cypermethrin Not Carcinogenic No genotoxic potential No evidence to have adverse effects on reproduction Moderately hazardous
Deltamethrin Not Carcinogenic No genotoxic potential No evidence to have adverse effects on reproduction Moderately hazardous
Diafenthiuron Not Carcinogenic Unknown Unknown Unknown
Diazinon Not Carcinogenic No genotoxic potential No evidence to have adverse effects on reproduction Moderately hazardous
Dichlorvos Not Carcinogenic No genotoxic potential No evidence to have adverse effects on reproduction Highly hazardous
Dicofol Not Carcinogenic No genotoxic potential No evidence to have adverse effects on reproduction Slightly hazardous
Dicrotophos Not Carcinogenic No genotoxic potential No evidence to have adverse effects on reproduction Highly hazardous
Diflubenzuron Not Carcinogenic No genotoxic potential No evidence to have adverse effects on reproduction
Unlikely to present acute hazard in normal use
Dimethoate Not Carcinogenic No genotoxic potential No evidence to have adverse effects on reproduction Moderately hazardous
Disulfoton Not Carcinogenic No genotoxic potential No evidence to have adverse effects on reproduction Extremely hazardous
Emamectin Benzoate Not Carcinogenic Unknown Unknown Moderately hazardous
Endosulfan Not Carcinogenic No genotoxic potential No evidence to have adverse effects on reproduction Moderately hazardous
Esfenvalerate Not Carcinogenic No genotoxic potential No evidence to have adverse effects on reproduction Moderately hazardous
Ethion Not Carcinogenic No genotoxic potential No evidence to have adverse effects on reproduction Moderately hazardous
Ethoprophos Not Carcinogenic No genotoxic potential No evidence to have adverse effects on reproduction Extremely hazardous
Etofenprox Not Carcinogenic No genotoxic potential No evidence to have adverse effects on reproduction
Unlikely to present acute hazard in normal use
Etoxazole Not Carcinogenic No genotoxic potential No evidence to have adverse effects on reproduction Unknown
Etridiazole H351 - Suspected of causing cancer No genotoxic potential
No evidence to have adverse effects on reproduction Slightly hazardous
Fenazaquin Not Carcinogenic No genotoxic potential No evidence to have adverse effects on reproduction Moderately hazardous
Fenbutatin oxide Not Carcinogenic No genotoxic potential No evidence to have adverse effects on reproduction
Unlikely to present acute hazard in normal use
Fenitrothion Not Carcinogenic No genotoxic potential No evidence to have adverse effects on reproduction Moderately hazardous
Fenpropathrin Not Carcinogenic No genotoxic potential No evidence to have adverse effects on reproduction Moderately hazardous
Fenthion Not Carcinogenic H341 - Suspected of causing genetic defects
No evidence to have adverse effects on reproduction Moderately hazardous
Fenvalerate Unknown Unknown Unknown Moderately hazardous
Fipronil Not Carcinogenic No genotoxic potential No evidence to have adverse effects on reproduction Moderately hazardous
Flonicamid Not Carcinogenic No genotoxic potential No evidence to have adverse effects on reproduction Unknown
Flufenoxuron Not Carcinogenic No genotoxic potential No evidence to have adverse effects on reproduction
Unlikely to present acute hazard in normal use
Fonofos Not Carcinogenic No genotoxic potential No evidence to have adverse effects on reproduction Obsolete substance
Furathiocarb Unknown Unknown Unknown Highly hazardous
Gamma-cyhalothrin Not Carcinogenic Unknown Unknown Slightly hazardous
Hexaflumuron Unknown Unknown Unknown Unlikely to present acute hazard in normal use
Hexythiazox Not Carcinogenic No genotoxic potential No evidence to have adverse effects on reproduction
Unlikely to present acute hazard in normal use
Imidacloprid Not Carcinogenic No genotoxic potential No evidence to have adverse effects on reproduction Moderately hazardous
Indoxacarb Not Carcinogenic No genotoxic potential Unknown Unknown
Lambda-cyhalothrin Not Carcinogenic No genotoxic potential No evidence to have adverse effects on reproduction Moderately hazardous
Lindane Not Carcinogenic No genotoxic potential H362 - May cause harm to Moderately hazardous

94
active ingredient Carcinogenicity Genotoxicity Toxicity to reproduction WHO Hazard breast-fed children
Lufenuron Not Carcinogenic No genotoxic potential No evidence to have adverse effects on reproduction Slightly hazardous
Malathion Not Carcinogenic No genotoxic potential No evidence to have adverse effects on reproduction Slightly hazardous
Mephosfolan Not Carcinogenic No genotoxic potential No evidence to have adverse effects on reproduction Obsolete substance
Metaldehyde Not Carcinogenic No genotoxic potential No evidence to have adverse effects on reproduction Moderately hazardous
Metam-potassium Unknown Unknown Unknown Unknown
Metam-sodium Not Carcinogenic No genotoxic potential No evidence to have adverse effects on reproduction Moderately hazardous
Methamidophos Not Carcinogenic No genotoxic potential No evidence to have adverse effects on reproduction Highly hazardous
Methidathion Not Carcinogenic No genotoxic potential No evidence to have adverse effects on reproduction Highly hazardous
Methomyl Not Carcinogenic No genotoxic potential No evidence to have adverse effects on reproduction Highly hazardous
Methoxyfenozide Not Carcinogenic Unknown Unknown Unlikely to present acute hazard in normal use
Methyl-bromide Not Carcinogenic H341 - Suspected of causing genetic defects
No evidence to have adverse effects on reproduction Fumigant not classified
Mevinphos Not Carcinogenic No genotoxic potential No evidence to have adverse effects on reproduction Extremely hazardous
Monocrotophos Not Carcinogenic H341 - Suspected of causing genetic defects
No evidence to have adverse effects on reproduction Highly hazardous
Naled Not Carcinogenic Unknown Unknown Moderately hazardous
Novaluron Not Carcinogenic No genotoxic potential Unknown Unknown
Omethoate Not Carcinogenic No genotoxic potential No evidence to have adverse effects on reproduction Highly hazardous
Oxamyl Not Carcinogenic No genotoxic potential No evidence to have adverse effects on reproduction Highly hazardous
Oxydemeton-m Not Carcinogenic No genotoxic potential No evidence to have adverse effects on reproduction Highly hazardous
Parathion Not Carcinogenic No genotoxic potential No evidence to have adverse effects on reproduction Extremely hazardous
Parathion-methyl Not Carcinogenic No genotoxic potential No evidence to have adverse effects on reproduction Extremely hazardous
Permethrin Not Carcinogenic No genotoxic potential No evidence to have adverse effects on reproduction Moderately hazardous
Phenthoate Not Carcinogenic No genotoxic potential No evidence to have adverse effects on reproduction Moderately hazardous
Phorate Not Carcinogenic No genotoxic potential No evidence to have adverse effects on reproduction Extremely hazardous
Phosalone Not Carcinogenic No genotoxic potential No evidence to have adverse effects on reproduction Moderately hazardous
Phosmet Not Carcinogenic No genotoxic potential No evidence to have adverse effects on reproduction Moderately hazardous
Phosphamidon Not Carcinogenic H341 - Suspected of causing genetic defects
No evidence to have adverse effects on reproduction Extremely hazardous
Piperonyl butoxide US-EPA: Possible Human Carcinogenic Unknown Unknown
Unlikely to present acute hazard in normal use
Pirimicarb Not Carcinogenic No genotoxic potential No evidence to have adverse effects on reproduction Moderately hazardous
Pirimiphos-methyl Not Carcinogenic No genotoxic potential No evidence to have adverse effects on reproduction Slightly hazardous
Potassium-bicarbonate Unknown Unknown Unknown Unknown
Potassium-oleate Unknown Unknown Unknown Unknown
Profenofos Not Carcinogenic No genotoxic potential No evidence to have adverse effects on reproduction Moderately hazardous
Propargite H351 - Suspected of causing cancer No genotoxic potential
No evidence to have adverse effects on reproduction Slightly hazardous
Pymetrozine H351 - Suspected of causing cancer No genotoxic potential
No evidence to have adverse effects on reproduction Slightly hazardous
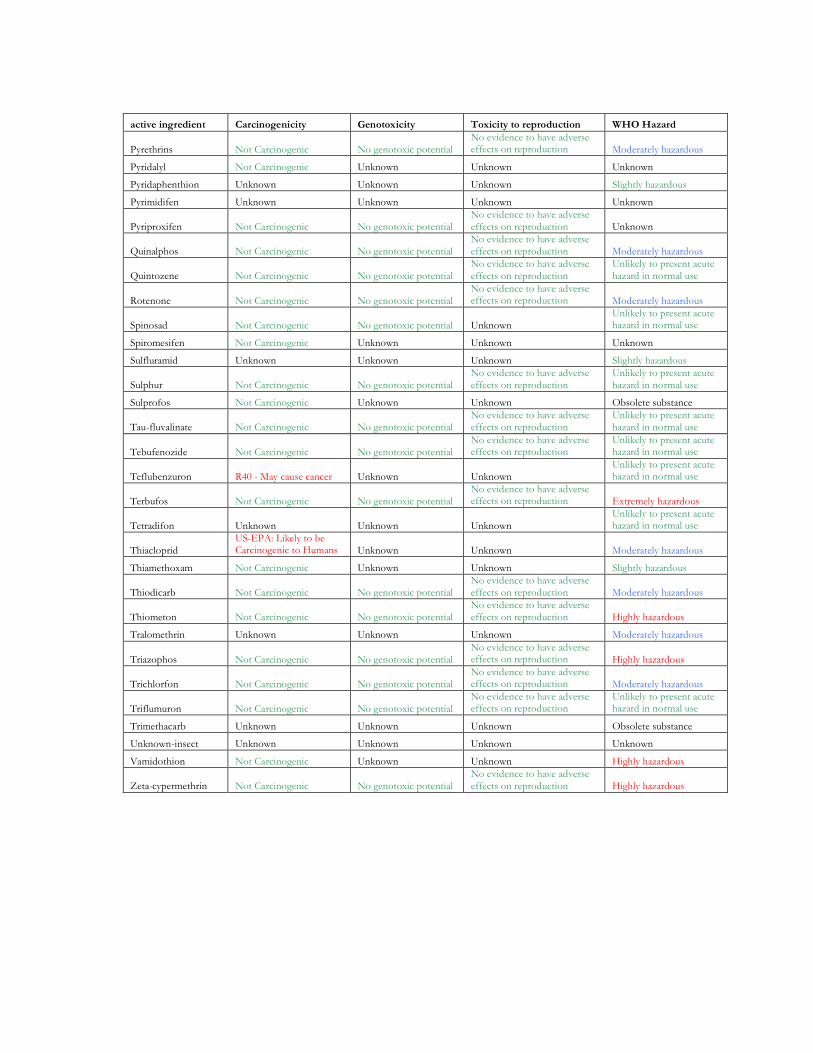
95
active ingredient Carcinogenicity Genotoxicity Toxicity to reproduction WHO Hazard
Pyrethrins Not Carcinogenic No genotoxic potential No evidence to have adverse effects on reproduction Moderately hazardous
Pyridalyl Not Carcinogenic Unknown Unknown Unknown
Pyridaphenthion Unknown Unknown Unknown Slightly hazardous
Pyrimidifen Unknown Unknown Unknown Unknown
Pyriproxifen Not Carcinogenic No genotoxic potential No evidence to have adverse effects on reproduction Unknown
Quinalphos Not Carcinogenic No genotoxic potential No evidence to have adverse effects on reproduction Moderately hazardous
Quintozene Not Carcinogenic No genotoxic potential No evidence to have adverse effects on reproduction
Unlikely to present acute hazard in normal use
Rotenone Not Carcinogenic No genotoxic potential No evidence to have adverse effects on reproduction Moderately hazardous
Spinosad Not Carcinogenic No genotoxic potential Unknown Unlikely to present acute hazard in normal use
Spiromesifen Not Carcinogenic Unknown Unknown Unknown
Sulfluramid Unknown Unknown Unknown Slightly hazardous
Sulphur Not Carcinogenic No genotoxic potential No evidence to have adverse effects on reproduction
Unlikely to present acute hazard in normal use
Sulprofos Not Carcinogenic Unknown Unknown Obsolete substance
Tau-fluvalinate Not Carcinogenic No genotoxic potential No evidence to have adverse effects on reproduction
Unlikely to present acute hazard in normal use
Tebufenozide Not Carcinogenic No genotoxic potential No evidence to have adverse effects on reproduction
Unlikely to present acute hazard in normal use
Teflubenzuron R40 - May cause cancer Unknown Unknown Unlikely to present acute hazard in normal use
Terbufos Not Carcinogenic No genotoxic potential No evidence to have adverse effects on reproduction Extremely hazardous
Tetradifon Unknown Unknown Unknown Unlikely to present acute hazard in normal use
Thiacloprid US-EPA: Likely to be Carcinogenic to Humans Unknown Unknown Moderately hazardous
Thiamethoxam Not Carcinogenic Unknown Unknown Slightly hazardous
Thiodicarb Not Carcinogenic No genotoxic potential No evidence to have adverse effects on reproduction Moderately hazardous
Thiometon Not Carcinogenic No genotoxic potential No evidence to have adverse effects on reproduction Highly hazardous
Tralomethrin Unknown Unknown Unknown Moderately hazardous
Triazophos Not Carcinogenic No genotoxic potential No evidence to have adverse effects on reproduction Highly hazardous
Trichlorfon Not Carcinogenic No genotoxic potential No evidence to have adverse effects on reproduction Moderately hazardous
Triflumuron Not Carcinogenic No genotoxic potential No evidence to have adverse effects on reproduction
Unlikely to present acute hazard in normal use
Trimethacarb Unknown Unknown Unknown Obsolete substance
Unknown-insect Unknown Unknown Unknown Unknown
Vamidothion Not Carcinogenic Unknown Unknown Highly hazardous
Zeta-cypermethrin Not Carcinogenic No genotoxic potential No evidence to have adverse effects on reproduction Highly hazardous


97
Appendix 7 Evaluation of the number of active ingredients applied
Acute hazard to human health Figure A 1 shows the trends over time per country of the number of active ingredients used in cotton and their acute hazard to human health according to the WHO classification. The most important observations are: • In 2006 the total number of active ingredients ranked as extremely hazardous or
highly hazardous was highest in USA and Brazil (more than ten substances). • In the USA and Turkey the total number of active ingredients ranked as extremely
hazardous or highly hazardous decreased over time. • In Australia the total number of active ingredients ranked as extremely hazardous or
highly hazardous showed an overall increase over time. However the increase was not continuous, from 2006- 2007 the number slightly decreased again.
• In Brazil the total number of active ingredients ranked as extremely hazardous or highly hazardous fluctuated over time.
• In India the total number of active ingredients ranked as extremely hazardous or highly hazardous stayed almost equal.
0
10
20
30
40
50
60
70
1995
1999
2000
2001
2002
2003
2004
2005
2006
2007
1994
2000
2006
1994
2000
2006
1994
2000
2006
1994
2000
2006
Australia Brazil India Turkey U S A
Nu
mb
er
of
acti
ve in
gre
die
nts Unknown
Fumigant not classified
Obsolete substance
Unlikely to present acute
hazard in normal use
Slightly hazardous
Moderately hazardous
Highly hazardous
Extremely hazardous
Figure A 1: Acute hazard to human health of active ingredients used in cotton
Chronic hazard to human health Carcinogenicity Figure A 2 shows the trends in use of the carcinogenic substances over time per country of the number of active ingredients used in cotton. The most important observations are: • In 2006 the number of active ingredients used in cotton that may cause cancer was in
all countries between 2 and 4. In Turkey and Brazil the number was 4. • The number of active ingredients used in cotton that may cause cancer slightly
increased over time in Brazil, India and Turkey.

98
• The number of active ingredients used in cotton that may cause cancer decreased over time in USA.
0
10
20
30
40
50
60
70
1995
1999
2000
2001
2002
2003
2004
2005
2006
2007
1994
2000
2006
1994
2000
2006
1994
2000
2006
1994
2000
2006
Australia Brazil India Turkey U S A
Nu
mb
er
of
acti
ve in
gre
die
nts
Unknown
Not Carcinogenic
US-EPA: Possible HumanCarcinogenic
US-EPA: Likely to be
Carcinogenic to Humans
R40 - May cause cancer
H351 - Suspected of causing
cancer
Figure A 2: Carcinogenicity of pesticides used in cotton
Genotoxicity Figure A 3 shows the trends over time per country of the number of active ingredients used in cotton and their genotoxicity. The most important observations are: • In 2006 in Brazil, India and USA and in 2007 in Australia no active ingredients were
used in cotton which are suspected of causing genetic defects. • In 1994, 2000 and 2006 in India 3 active ingredients were used which are suspected
of causing genetic defects (Fenthion, Monocrotophos and Phosphamidon).
0
10
20
30
40
50
60
70
1995
1999
2000
2001
2002
2003
2004
2005
2006
2007
1994
2000
2006
1994
2000
2006
1994
2000
2006
1994
2000
2006
Australia Brazil India Turkey U S A
Nu
mb
er
of
acti
ve in
gre
die
nts
Unknown
No genotoxic potentials
H341 - Suspected of causinggenetic defects
Figure A 3: Genotoxicity of active ingredients used in cotton.
Toxicity to reproduction Figure A 4 shows toxicity to reproduction of active ingredients used in cotton per country per year. The most important observations are:
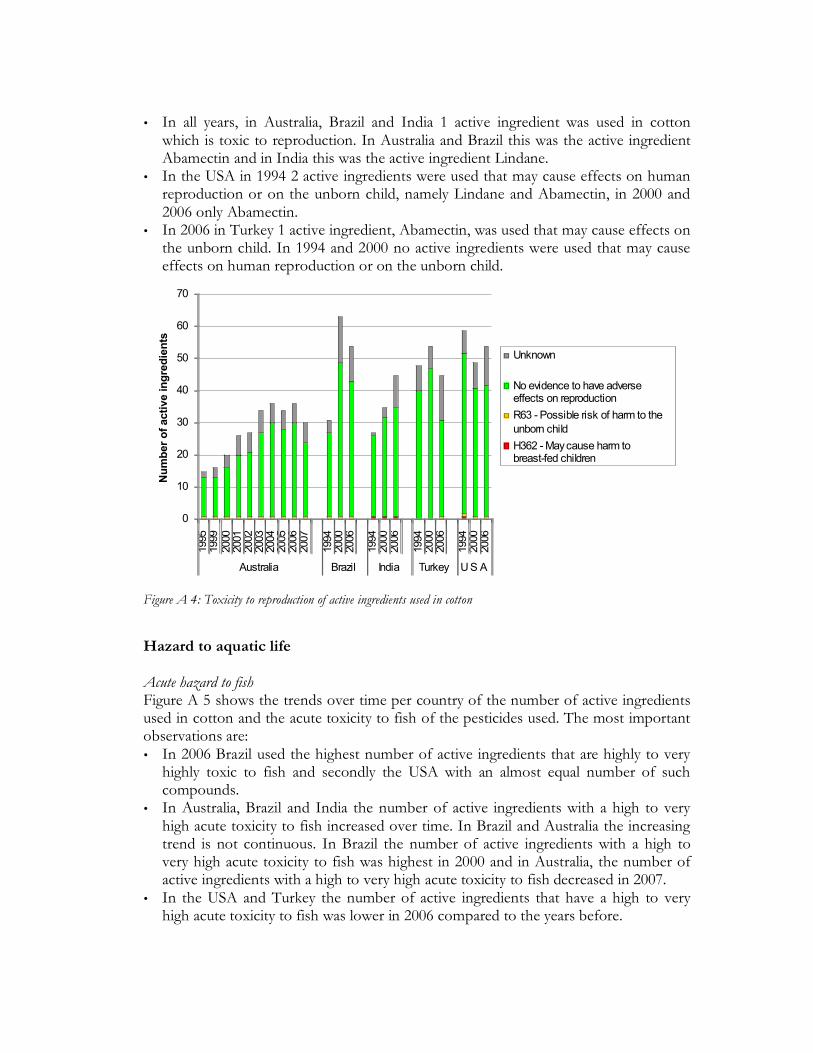
99
• In all years, in Australia, Brazil and India 1 active ingredient was used in cotton which is toxic to reproduction. In Australia and Brazil this was the active ingredient Abamectin and in India this was the active ingredient Lindane.
• In the USA in 1994 2 active ingredients were used that may cause effects on human reproduction or on the unborn child, namely Lindane and Abamectin, in 2000 and 2006 only Abamectin.
• In 2006 in Turkey 1 active ingredient, Abamectin, was used that may cause effects on the unborn child. In 1994 and 2000 no active ingredients were used that may cause effects on human reproduction or on the unborn child.
0
10
20
30
40
50
60
70
1995
1999
2000
2001
2002
2003
2004
2005
2006
2007
1994
2000
2006
1994
2000
2006
1994
2000
2006
1994
2000
2006
Australia Brazil India Turkey U S A
Nu
mb
er
of
acti
ve in
gre
die
nts
Unknown
No evidence to have adverseeffects on reproduction
R63 - Possible risk of harm to the
unborn child
H362 - May cause harm tobreast-fed children
Figure A 4: Toxicity to reproduction of active ingredients used in cotton
Hazard to aquatic life Acute hazard to fish Figure A 5 shows the trends over time per country of the number of active ingredients used in cotton and the acute toxicity to fish of the pesticides used. The most important observations are: • In 2006 Brazil used the highest number of active ingredients that are highly to very
highly toxic to fish and secondly the USA with an almost equal number of such compounds.
• In Australia, Brazil and India the number of active ingredients with a high to very high acute toxicity to fish increased over time. In Brazil and Australia the increasing trend is not continuous. In Brazil the number of active ingredients with a high to very high acute toxicity to fish was highest in 2000 and in Australia, the number of active ingredients with a high to very high acute toxicity to fish decreased in 2007.
• In the USA and Turkey the number of active ingredients that have a high to very high acute toxicity to fish was lower in 2006 compared to the years before.

100
0
10
20
30
40
50
60
70
1995
1999
2000
2001
2002
2003
2004
2005
2006
2007
1994
2000
2006
1994
2000
2006
1994
2000
2006
1994
2000
2006
Australia Brazil India Turkey U S A
Nu
mb
er
of
acti
ve in
gre
die
nts
Unknown
Practically nontoxic
Slightly toxic
Moderately toxic
Highly toxic
Very highly toxic
Figure A 5: Acute hazard to fish of active ingredients used in cotton
Acute hazard to Daphnia Figure A 6 shows the trends over time per country of the number of active ingredients used in cotton and the acute toxicity to Daphnia as a representative of aquatic organisms of the pesticides used. The most important observations are: • In all countries most active ingredients used in cotton are highly to very highly toxic
to Daphnia. • In 2006 Brazil used the highest total number of active ingredients in cotton that are
highly to very highly toxic to Daphnia, in 2000 that number was even higher. • In Australia, Brazil and India the number of active ingredients used in cotton that are
highly to very highly toxic to Daphnia increased over time. However in Brazil the trend was not continuous and in Australia the number decreased between 2006 and 2007.
• In Turkey and the USA the number of active ingredients that are highly to very highly toxic to Daphnia decreased over time.

101
0
10
20
30
40
50
60
70
1995
1999
2000
2001
2002
2003
2004
2005
2006
2007
1994
2000
2006
1994
2000
2006
1994
2000
2006
1994
2000
2006
Australia Brazil India Turkey U S A
Nu
mb
er
of
acti
ve in
gre
die
nts
Unknown
Practically nontoxic
Slightly toxic
Moderately toxic
Highly toxic
Very highly toxic
Figure A 6: Acute hazard to Daphnia of active ingredients used in cotton.
Hazard to algae Figure A 7 shows the trends over time per country of the number of active ingredients used in cotton and their toxicity to algae. The most important observations are: • In 2006 Brazil and the USA used the highest total number of pesticides on cotton
that have a high to very high toxicity to algae. • In Australia, Brazil and India the number of active ingredients with a high to very
high toxicity to algae increased over time. In Brazil this increase was not continuous. In Turkey the number increased very slightly.
• In the USA the number of active ingredients with a high to very high toxicity to algae slightly decreased over time.
0
10
20
30
40
50
60
70
1995
1999
2000
2001
2002
2003
2004
2005
2006
2007
1994
2000
2006
1994
2000
2006
1994
2000
2006
1994
2000
2006
Australia Brazil India Turkey U S A
Nu
mb
er
of
acti
ve in
gre
die
nts
Unknown
Very Slightly Toxic
Slightly toxic
Moderately toxic
Highly toxic
Very highly toxic
Figure A 7: Hazard to algae of active ingredients used in cotton
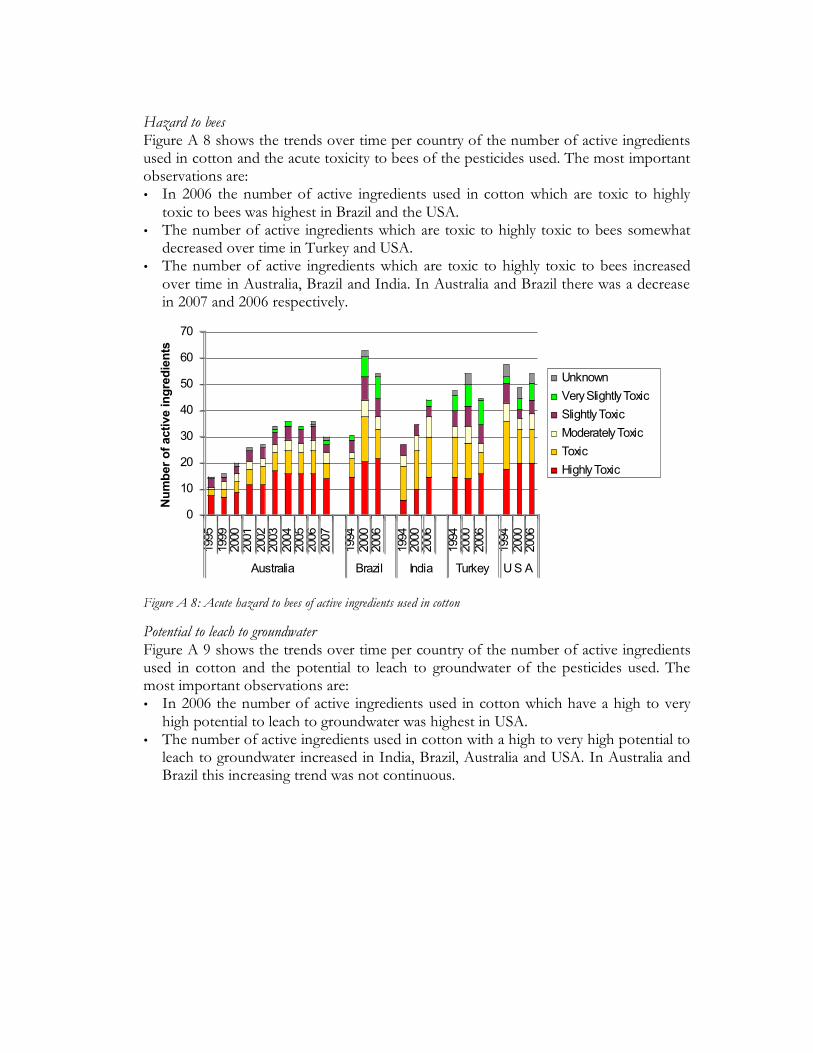
102
Hazard to bees Figure A 8 shows the trends over time per country of the number of active ingredients used in cotton and the acute toxicity to bees of the pesticides used. The most important observations are: • In 2006 the number of active ingredients used in cotton which are toxic to highly
toxic to bees was highest in Brazil and the USA. • The number of active ingredients which are toxic to highly toxic to bees somewhat
decreased over time in Turkey and USA. • The number of active ingredients which are toxic to highly toxic to bees increased
over time in Australia, Brazil and India. In Australia and Brazil there was a decrease in 2007 and 2006 respectively.
0
10
20
30
40
50
60
70
1995
1999
2000
2001
2002
2003
2004
2005
2006
2007
1994
2000
2006
1994
2000
2006
1994
2000
2006
1994
2000
2006
Australia Brazil India Turkey U S A
Nu
mb
er
of
acti
ve in
gre
die
nts
Unknown
Very Slightly Toxic
Slightly Toxic
Moderately Toxic
Toxic
Highly Toxic
Figure A 8: Acute hazard to bees of active ingredients used in cotton
Potential to leach to groundwater Figure A 9 shows the trends over time per country of the number of active ingredients used in cotton and the potential to leach to groundwater of the pesticides used. The most important observations are: • In 2006 the number of active ingredients used in cotton which have a high to very
high potential to leach to groundwater was highest in USA. • The number of active ingredients used in cotton with a high to very high potential to
leach to groundwater increased in India, Brazil, Australia and USA. In Australia and Brazil this increasing trend was not continuous.

103
0
10
20
30
40
50
60
70
1995
1999
2000
2001
2002
2003
2004
2005
2006
2007
1994
2000
2006
1994
2000
2006
1994
2000
2006
1994
2000
2006
Australia Brazil India Turkey U S A
Nu
mb
er
of
acti
ve in
gre
die
nts
Unknown
Very Low
Low
Moderate
High
Very High
Figure A 9: Leaching potential (GUS) of active ingredients used in cotton.

104
Appendix 8 Australia, summary of tables and graphs
Pesticide use in cotton
Table A 8 shows the 10 active ingredients with the highest amount use in 2007 and the 10 Active ingredients with the highest increase and decrease in use between 1995 and 2007. The order for increase and decrease in use is based on the absolute difference in use between 1995 and 2007. The percentages indicate the increase or decrease in use for each active ingredient related to their use in 1995. Table A9 shows the 10 major active ingredients according to the cumulative treated area. Table A 8: Australia, 10 active ingredients with highest use in 2007, with the greatest decrease in use, and with the strongest increase between 1995 and 2007, percentages are based on the total amount applied.
Major a.i. in 2007 Greatest decrease 1995 - 2007 Strongest increase 1995 - 2007
1 Endosulfan 24% Endosulfan -95% Amitraz New
2 Biopest 15% Propargite -99% Methoxyfenozide New
3 Profenofos 10% Profenofos -94% Aldicarb New
4 Amitraz 10% Thiodicarb -100% Diafenthiuron New
5 Dimethoate 8% Parathion-e -100% Indoxacarb New
6 Methoxyfenozide 6% Chlorpyrifos -98% Acetamiprid New
7 Aldicarb 5% Piperonyl-butoxide -98% Fipronil New
8 Diafenthiuron 5% Bifenthrin -96% Cypermethrin New
9 Bacillus-thuringiensis 4% Other pyrethroids -100% Chlorpyrifos-m New
10 Propargite 2% Pirimicarb -100% Spinosad New *-New = active ingredients which were not used in cotton in 1995 but were used in 2007.
Table A 9: Australia, 10 active ingredients with highest use in 2002, with the greatest decrease in use, and with the strongest increase between 1995 and 2002, percentages are based on hectare treated area of cotton
Major a.i. in 2002 Greatest decrease 1995 - 2002 Strongest increase 1995 - 2002
1 Other pyrethroids 12% Endosulfan -70% Spinosad New*
2 Spinosad 10% Other pyrethroids -57% Emamectin New*
3 Emamectin 9% Thiodicarb -96% Indoxacarb New*
4 Dimethoate 8% Profenofos -74% Amitraz New*
5 Indoxacarb 8% Bifenthrin -63% Dimethoate 232%
6 Endosulfan 7% Propargite -94% Abamectin 421%
7 Amitraz 7% Deltamethrin -100% Ethion New
8 Bacillus-thuringiensis 6% Lambda-cyhalothrin -100% Zeta-cypermethrin New*
9 Piperonyl-butoxide 5% Parathion-e -78% Aldicarb New*
10 Profenofos 3% Bacillus-thuringiensis -23% Polyhedrosis-virus New* *-New = active ingredients which were not used in cotton in 1995 but were used in 2002.

105
Hazards Table A 10: Australia, active ingredients used in cotton that are highly to extremely hazardous to human health.. The percentages are based on the total amount used in cotton in that year.
1995 2000 2007 Acute hazard to human health active ingredient kg a.i./ha % kg a.i./ha % kg a.i./ha %
Aldicarb 0.05 6
Parathion 0.76 9.3 0.81 15
Extremely hazardous
Phorate 0.002 0.3
Methomyl 0.02 0.4 0.002 0.2
Monocrotophos 0.07 1
Highly hazardous
Omethoate 0.03 0.4 0.02 0.4 0.02 2
Total 0.79 10 0.92 17 0.07 9
Table A 11: Australia, active ingredients used in cotton which are ranked as possible carcinogenic. The percentages are based on the total amount used in cotton in that year.
1995 2000 2007 Carcinogenicity active ingredient kg a.i./ha % kg a.i./ha % kg a.i./ha %
Propargite 1.067 13 0.549 10 0.024 3 R40 - May cause cancer
Bifenthrin 0.111 1.4 0.032 0.6 0.007 0.9 US-EPA: Possible Human Carcinogenic Piperonyl butoxide 0.366 4.5 0.271 5 0.011 1.4
Total 1.543 19 0.853 15 0.042 5
Table A 12: Australia, active ingredients used in cotton which are suspected of causing genetic defects. The percentages are based on the total amount used in cotton in that year.
1995 2000 2007
Genotoxicity active ingredient kg a.i./ha % kg a.i./ha % kg a.i./ha %
H341 - Suspected of causing genetic defects Monocrotophos 0.07 1.2
Total 0 0.07 1.2 0
Table A 13: Australia, active ingredients used in cotton which pose a hazard to reproduction. The percentages are based on the total amount used in cotton in that year.
1995 2000 2007
Reproductive Toxicity active ingredient kg a.i./ha % kg a.i./ha % kg a.i./ha %
R63 - Possible risk of harm to the unborn child Abamectin 0.001 0.01 0.001 0.02 0.003 0.4
Total 0.001 0.01 0.001 0.02 0.003 0.4

106
Table A 14: Australia, active ingredients used in cotton which are very highly toxic to fish. The percentages are based on the total amount used in cotton in that year.
1995 2000 2007 Acute hazard to fish active ingredient kg a.i./ha % kg a.i./ha % kg a.i./ha %
Abamectin 0.001 0.0 0.001 0.0 0.003 0.3 Alpha-cypermethrin 0.0003 0.0
Beta-cyfluthrin 0.001 0.1
Bifenthrin 0.111 1.4 0.032 0.6 0.007 0.9
Chlorfenapyr 0.145 2.6 0.002 0.2
Chlorpyrifos 0.503 6.2 0.663 11.9 0.016 2.0
Cypermethrin 0.0003 0.0
Deltamethrin 0.009 0.1 0.003 0.4
Diafenthiuron 0.043 0.8 0.048 6.0
Endosulfan 2.971 36.4 1.551 27.8 0.232 29.1 Lambda-cyhalothrin 0.010 0.1 0.001 0.1
Phorate 0.002 0.3
Very highly toxic
Profenofos 1.098 13.5 0.646 11.6 0.103 12.9
Total 4.70 58 3.08 55 0.42 53
Table A 15: Australia, active ingredients used in cotton which are very highly toxic to Daphnia. The percentages are based on the total amount used in cotton in that year.
1995 2000 2007 Acute hazard to Daphnia active ingredient kg a.i./ha % kg a.i./ha % kg a.i./ha %
Abamectin 0.001 0.0 0.001 0.0 0.003 0.3 Alpha-cypermethrin 0.0003 0.0
Amitraz 0.388 7.0 0.101 12.6
Beta-cyfluthrin 0.001 0.1
Bifenthrin 0.111 1.4 0.032 0.6 0.007 0.9
Chlorfenapyr 0.145 2.6 0.002 0.2
Chlorpyrifos 0.503 6.2 0.663 11.9 0.016 2.0
Chlorpyrifos-m 0.003 0.4
Cypermethrin 0.0003 0.0
Deltamethrin 0.009 0.1 0.003 0.4 Emamectin Benzoate 0.003 0.3 Lambda-cyhalothrin 0.010 0.1 0.001 0.1
Monocrotophos 0.069 1.2
Omethoate 0.031 0.4 0.022 0.4 0.016 2.0
Parathion 0.763 9.3 0.808 14.5
Phorate 0.002 0.3
Pirimicarb 0.060 0.7 0.065 1.2 0.0004 0.1
Propargite 1.067 13.1 0.549 9.8 0.024 3.0
Very highly toxic
Thiodicarb 1.006 12.3 0.044 0.8
Total 3.560 44 2.786 50 0.182 23

107
Table A 16: Australia, active ingredients used in cotton which are highly to very highly toxic to algae. The percentages are based on the total amount used in cotton in that year.
1995 2000 2007 Hazard to Algae a.i. kg a.i./ha % kg a.i./ha % kg a.i./ha %
Fipronil 0.009 0.2 0.006 0.7 Very highly toxic
Spinosad 0.134 2.4 0.003 0.4
Alpha-cypermethrin 0.0003 0.0
Chlorfenapyr 0.145 2.6 0.002 0.2
Chlorpyrifos 0.503 6.2 0.663 11.9 0.016 2.0
Chlorpyrifos-m 0.003 0.4
Indoxacarb 0.017 2.1
Lambda-cyhalothrin 0.010 0.1 0.001 0.1
Parathion 0.763 9.3 0.808 14.5
Highly toxic
Piperonyl butoxide 0.366 4.5 0.271 4.9 0.011 1.4
Total 1.65 20 2.42 37 0.16 7 Table A 17: Australia, active ingredients used in cotton which are toxic to highly toxic to bees. The percentages are based on the total amount used in cotton in that year.
1995 2000 2007 Acute hazard to bees active ingredient kg a.i./ha % kg a.i./ha % kg a.i./ha %
Abamectin 0.001 0.0 0.001 0.0 0.003 0.3
Aldicarb 0.049 6.2
Alpha-cypermethrin 0.0003 0.0
Beta-cyfluthrin 0.001 0.1
Bifenthrin 0.111 1.4 0.032 0.6 0.007 0.9
Chlorpyrifos 0.503 6.2 0.663 11.9 0.016 0.0
Cypermethrin 0.0003 2.0
Deltamethrin 0.009 0.1 0.003 0.4 Emamectin Benzoate 0.003 0.3
Fipronil 0.009 0.2 0.006 0.7
Lambda-cyhalothrin 0.010 0.1 0.001 0.1
Monocrotophos 0.069 1.2
Omethoate 0.031 0.4 0.022 0.4 0.016 2.0
Parathion 0.763 9.3 0.808 14.5
Profenofos 1.098 13.5 0.646 11.6 0.103 12.9
Highly Toxic
Spinosad 0.134 2.4 0.003 0.4
Chlorfenapyr 0.145 2.6 0.002 0.2
Chlorpyrifos-m 0.003 0.4
Dimethoate 0.079 1 0.075 1.4 0.079 9.9
Indoxacarb 0.017 2.1
Methomyl 0.024 0.4 0.002 0.2
Phorate 0.002 0.3
Toxic
Thiodicarb 1.006 12.3 0.044 0.8
Total 3.609 44 2.673 48 0.316 40

108
Table A 18: Australia, active ingredients used in cotton have a high to very high potential to leach to groundwater. The percentages are based on the total amount used in cotton in that year.
1995 2000 2007 Leaching potential to groundwater (GUS) active ingredient kg a.i./ha % kg a.i./ha % kg a.i./ha %
Very High Methoxyfenozide 0.058 7.3
Total 0 0 0.058 7

109
Environmental Toxic Load (ETL)
0
500
1000
1500
2000
2500
3000
3500
4000
4500
1995 1999 2000 2001 2002 2003 2004 2005 2006 2007
ET
L f
or f
ish
Zeta-cypermethrin
Lambda-cyhalothrin
Endosulfan
Diafenthiuron
Chlorpyrifos
Bifenthrin
Others
Figure A 10: Australia, ETL for fish
0
5000
10000
15000
20000
25000
30000
1995 1999 2000 2001 2002 2003 2004 2005 2006 2007
ET
L f
or Daphnia
Zeta-cypermethrin
Parathion
Lambda-cyhalothrin
Ethion
Cypermethrin
Chlorpyrifos
Carbosulfan
Bifenthrin
Others
Figure A 11 Australia, ETL for Daphnia

110
0
2
4
6
8
10
12
14
1995 1999 2000 2001 2002 2003 2004 2005 2006 2007
ET
L f
or
alg
ae
Spinosad
Propargite
Piperonyl butoxide
Parathion
Indoxacarb
Endosulfan
Chlorpyrifos
Chlorfenapyr
Amitraz
Others
Figure A 12: Australia, ETL for algae
0
20
40
60
80
100
120
140
1995 1999 2000 2001 2002 2003 2004 2005 2006 2007
ET
L f
or b
ees
Zeta-cypermethrin
Thiodicarb
Spinosad
Profenofos
Parathion
Monocrotophos
Emamectin Benzoate
Deltamethrin
Chlorpyrifos
Bifenthrin
Beta-cyfluthrin
Aldicarb
Cypermethrin
Others Figure A 13: Australia, ETL for bees

111
Appendix 9 Brazil, summary of tables and graphs
Pesticide use in cotton Table A 19 shows the 10 active ingredients with the highest amount use in 2007 and the 10 Active ingredients with the highest increase and decrease in use between 1994 and 2006. The order for increase and decrease in use is based on the absolute difference in use between 1994 and 2006. The percentages indicate the increase or decrease in use for each active ingredient related to their use in 1994. Table A 20 shows the 10 major active ingredients according to the cumulative treated area.
Table A 19: Brazil, 10 active ingredients with highest use in 2006, with the greatest decrease in use, and with the strongest increase between 1994 and 2006, percentages are based on the total amount applied.
Major a.i. in 2006 Greatest decrease between
1994 and 2006 Strongest increase between
1994 and 2006
1 Acephate 25% Monocrotophos -100% Acephate 4997%
2 Carbosulfan 15% Parathion-m -63% Carbosulfan New*
3 Endosulfan 12% Fenitrothion -92% Diafenthiuron New*
4 Methamidophos 7% Aldicarb -67% Endosulfan 75%
5 Profenofos 7% Fenvalerate -100% Dimethoate 829%
6 Diafenthiuron 6% Thiometon -100% Methomyl New*
7 Dimethoate 4% Propargite -81% Profenofos 76%
8 Parathion-m 3% Fenpropathrin -88% Zeta-cypermethrin 4526%
9 Methomyl 3% Triazophos -29% Methamidophos 53%
10 Zeta-cypermethrin 3% Methidathion -15% Chlorpyrifos 556% *-New = active ingredients which were not used in cotton in 1994 but were used in 2006.
Table A 20: Brazil, 10 active ingredients with highest use in 2006, with the greatest decrease in use, and with the strongest increase between 1994 and 2006, percentages are based on hectare treated area of cotton
Major a.i. in 2006 Greatest decrease between
1994 and 2006 Strongest increase between
1994 and 2006
1 Carbosulfan 13% Monocrotophos -100% Carbosulfan New*
2 Lambda-cyhalothrin 10% Parathion-m -59% Lambda-cyhalothrin 1023%
3 Acephate 8% Fenvalerate -100% Acephate 5489%
4 Cypermethrin 8% Deltamethrin -16% Zeta-cypermethrin 2301%
5 Zeta-cypermethrin 8% Betacyfluthrin -26% Lufenuron New*
6 Lufenuron 5% Thiometon -100% Diafenthiuron New*
7 Profenofos 4% Fenitrothion -93% Diflubenzuron 2033%
8 Endosulfan 3% Fenpropathrin -76% Methomyl New*
9 Diflubenzuron 3% Aldicarb -75% Novaluron New*
10 Methamidophos 3% Propargite -91% Profenofos 146% *-New = active ingredients which were not used in cotton in 1994 but were used in 2002.

112
Hazards Table A 21: Brazil, active ingredients used in cotton that are highly to extremely hazardous to human health. The percentages are based on the total amount used in cotton in that year.
1994 2000 2006 Acute hazard to human health
active ingredient kg a.i./ha %
kg a.i./ha %
kg a.i./ha %
Aldicarb 0.02 2 0.04 1 0.01 0.2
Disulfoton 0.03 1
Parathion-methyl 0.35 24 0.32 7 0.17 4
Phorate 0.07 2 0.01 0.1
Extremely hazardous
Terbufos 0.02 0.4
Azinphos-methyl 0.0009 0.1
Cadusafos 0.0007 0.0
Carbofuran 0.0006 0.0 0.01 0.1
Cyfluthrin 0.00 0.0 0.00 0.0 0.0003 0.0
Methamidophos 0.18 12 1.18 25 0.36 7
Methidathion 0.01 1 0.02 0.4 0.01 0.3
Methomyl 0.20 4 0.17 3
Monocrotophos 0.27 19 0.25 5
Thiometon 0.01 1
Triazophos 0.02 1 0.43 9 0.02 0.3
Vamidothion 0.002 0.1 0.004 0.1
Highly hazardous
Zeta-cypermethrin 0.002 0.2 0.01 0.2 0.14 3
Total 0.87 60 2.57 45 0.89 18 Table A 22: Brazil, active ingredients used in cotton which are ranked as possible carcinogenic. The percentages are based on the total amount used in cotton in that year.
1994 2000 2006
Carcinogenicity active ingredient kg a.i./ha %
kg a.i./ha %
kg a.i./ha %
Carbaryl 0.03 0.6 0.01 0.2 H351 – Suspected of causing cancer
Propargite 0.01 0.6 0.002 0.0
Bifenthrin 0.0001 0.0004 0.3 0.03 0.1 R40 – May cause cancer
Teflubenzuron 0.01 0.0 0.01 0.6
Total 0.01 0.6 0.04 0.9 0.05 0.9 Table A 23: Brazil, active ingredients used in cotton which are suspected of causing genetic defects. The percentages are based on the total amount used in cotton in that year.
1994 2000 2006
Genotoxicity active ingredient kg a.i./ha %
kg a.i./ha %
kg a.i./ha %
Fenthion 0.0005 0.0 H341 – Suspected of causing genetic defects
Monocrotophos 0.27 18.6 0.25 5.4
Total 0.27 19 0.25 5 0

113
Table A 24: Brazil, active ingredients used in cotton which pose a hazard to reproduction. The percentages are based on the total amount used in cotton in that year.
1994 2000 2006
Reproductive toxicity active ingredient kg a.i./ha %
kg a.i./ha %
kg a.i./ha %
R63 – Possible risk of harm to the unborn child Abamectin 0.0001 0.01 0.0001 0.001 0.0007 0.01
Total 0.0001 0.01 0.0001 0.001 0.0007 0.01 Table A 25: Brazil, active ingredients used in cotton which are very highly toxic to fish. The percentages are based on the total amount used in cotton in that year.
1994 2000 2006
Acute hazard to fish active ingredient kg a.i./ha %
kg a.i./ha %
kg a.i./ha %
Abamectin 0.0001 0.0 0.0001 0.0 0.001 0.0
Alpha-cypermethrin 0.001 0.0 0.003 0.1
Azinphos-methyl 0.001 0.1
Benfuracarb 0.063 1.4
Beta-cyfluthrin 0.003 0.2 0.005 0.1 0.003 0.1
Beta-cypermethrin 0.0005 0.0
Bifenthrin 0.0001 0.0 0.0004 0.0 0.028 0.6
Carbosulfan 0.015 0.3 0.735 15.0
Chlorfenapyr 0.005 0.1 0.002 0.0
Chlorpyrifos 0.013 0.9 0.059 1.3 0.110 2.3
Cyfluthrin 0.0006 0.0 0.0001 0.0 0.0003 0.0
Cypermethrin 0.065 4.4 0.072 1.5 0.092 1.9
Deltamethrin 0.006 0.4 0.037 0.8 0.005 0.1
Diafenthiuron 0.125 2.7 0.310 6.3
Disulfoton 0.028 0.6
Endosulfan 0.247 16.9 0.760 16.2 0.566 11.6
Esfenvalerate 0.010 0.2 0.004 0.1
Fenpropathrin 0.006 0.4 0.004 0.1 0.001 0.0
Fenvalerate 0.012 0.8 0.031 0.7
Flufenoxuron 0.0002 0.0
Gamma-cyhalothrin 0.005 0.1
Lambda-cyhalothrin 0.004 0.3 0.004 0.1 0.048 1.0
Malathion 0.005 0.1
Methidathion 0.013 0.9 0.019 0.4 0.014 0.3
Permethrin 0.004 0.1 0.041 0.8
Phorate 0.072 1.5 0.007 0.1
Profenofos 0.151 10.3 0.144 3.1 0.349 7.1
Sulphur 0.054 1.2
Teflubenzuron 0.012 0.3 0.006 0.1
Terbufos 0.017 0.4
Triazophos 0.018 1.2 0.431 9.2 0.017 0.3
Very highly toxic
Zeta-cypermethrin 0.002 0.2 0.010 0.2 0.139 2.8
Total 0.541 37 1.990 43 2.487 51

114
Table A 26: Brazil, active ingredients used in cotton which are very highly toxic to Daphnia. The percentages are based on the total amount used in cotton in that year.
1994 2000 2006 Acute hazard to Daphnia active ingredient
kg a.i./ha %
kg a.i./ha %
kg a.i./ha %
Abamectin 0.0001 0.0 0.0001 0.0 0.001 0.0
Alpha-cypermethrin 0.001 0.0 0.003 0.1
Azinphos-methyl 0.001 0.1
Benfuracarb 0.063 1.4
Beta-cyfluthrin 0.003 0.2 0.005 0.1 0.003 0.1
Beta-cypermethrin 0.0005 0.0
Bifenthrin 0.0001 0.0 0.0004 0.0 0.028 0.6
Carbaryl 0.0 0.029 0.6 0.010 0.2
Carbofuran 0.001 0.007 0.1
Carbosulfan 0.015 0.3 0.735 15.0
Cartap 0.057 1.2 0.045 0.9
Chlorfenapyr 0.005 0.1 0.002 0.0
Chlorfluazuron 0.0001 0.0 0.001 0.0 0.003 0.1
Chlorpyrifos 0.013 0.9 0.059 1.3 0.110 2.3
Cyfluthrin 0.001 0.0 0.00008 0.0 0.0003 0.0
Cypermethrin 0.065 4.4 0.072 1.5 0.092 1.9
Deltamethrin 0.006 0.4 0.037 0.8 0.005 0.1
Diflubenzuron 0.001 0.0 0.007 0.1 0.016 0.3
Disulfoton 0.028 0.6
Esfenvalerate 0.010 0.2 0.004 0.1
Fenitrothion 0.037 2.5 0.201 4.3 0.004 0.1
Fenpropathrin 0.006 0.4 0.004 0.1 0.001 0.0
Fenthion 0.0005 0.0
Fenvalerate 0.012 0.8 0.031 0.7
Flufenoxuron 0.1 0.0002 0.0
Gamma-cyhalothrin 0.005 0.1
Lambda-cyhalothrin 0.004 0.3 0.004 0.048 1.0
Lufenuron 0.003 0.1 0.025 0.5
Malathion 0.005 0.1
Methidathion 0.013 0.9 0.019 0.4 0.014 0.3
Monocrotophos 0.272 18.6 0.252 5.4
Novaluron 0.001 0.0 0.010 0.2
Parathion-methyl 0.352 24.1 0.316 6.8 0.169 3.5
Permethrin 0.004 0.1 0.041 0.8
Phorate 0.072 1.5 0.007 0.1
Phosmet 0.002 0.0
Pirimicarb 0.023 0.5
Propargite 0.009 0.6 0.002 0.0
Sulphur 0.054 1.2
Teflubenzuron 0.012 0.3 0.006 0.1
Terbufos 0.017 0.4
Thiodicarb 0.013 0.3
Triazophos 0.018 1.2 0.431 9.2 0.017 0.3
Very highly toxic
Trichlorfon 0.050 1.1

115
1994 2000 2006 Acute hazard to Daphnia active ingredient
kg a.i./ha %
kg a.i./ha %
kg a.i./ha %
Triflumuron 0.006 0.1 0.008 0.2
Zeta-cypermethrin 0.002 0.2 0.010 0.2 0.139 2.8 Total 0.815 56 1.909 41 1.573 32
Tabl e A 27: Braz il , a ct i ve in gr ed ient s used in co t ton which are hi ghl y to v ery h i gh ly toxi c to al ga e. The per cen ta g es ar e based on the to tal amount used in co t ton in tha t year .
1994 2000 2006
Hazard to algae active ingredient kg a.i./ha %
kg a.i./ha %
kg a.i./ha %
Dicofol 0.001 0.1 0.004 0.1 0.002 0.1
Disulfoton 0.028 0.6
Esfenvalerate 0.010 0.2 0.004 0.1
Fipronil 0.023 0.5 0.011 0.2
Flufenoxuron 0.0002 0.0
Permethrin 0.004 0.1 0.041 0.8
Phosmet 0.002 0.0
Spinosad 0.013 0.3 0.014 0.3
Sulphur 0.054 1.2
Teflubenzuron 0.012 0.3 0.006 0.1
Very highly toxic
Triflumuron 0.006 0.1 0.008 0.2
Alpha-cypermethrin 0.001 0.0 0.003 0.1
Carbaryl 0.029 0.6 0.010 0.2
Chlorfenapyr 0.005 0.1 0.002 0.0
Chlorpyrifos 0.013 0.9 0.059 1.3 0.110 2.3
Clofentezine 0.0003 0.0 0.0003 0.0
Diflubenzuron 0.001 0.0 0.007 0.1 0.016 0.3
Indoxacarb 0.003 0.1 0.007 0.1
Lambda-cyhalothrin 0.004 0.3 0.004 0.1 0.048 1.0
Highly toxic
Tebufenozide 0.001 0.0
Total 0.024 2 0.303 6 0.289 6
Table A 28: Brazil, active ingredients used in cotton which are toxic to highly toxic to bees. The percentages are based on the total amount used in cotton in that year.
1994 2000 2006
Acute hazard to bees active ingredient kg a.i./ha %
kg a.i./ha %
kg a.i./ha %
Abamectin 0.0001 0.0 0.0001 0.0 0.001 0.0 Aldicarb 0.024 1.6 0.039 0.8 0.010 0.2 Alpha-cypermethrin 0.001 0.0 0.003 0.1 Azinphos-methyl 0.001 0.1 Beta-cyfluthrin 0.003 0.2 0.005 0.1 0.003 0.1 Beta-cypermethrin 0.0005 0.0 Bifenthrin 0.00008 0.0 0.0004 0.0 0.028 0.6 Carbofuran 0.001 0.0 0.007 0.1 Chlorpyrifos 0.013 0.9 0.059 1.3 0.110 2.3
Highly Toxic Cyfluthrin 0.001 0.0 0.0001 0.0 0.0003 0.0

116
1994 2000 2006
Acute hazard to bees active ingredient kg a.i./ha %
kg a.i./ha %
kg a.i./ha %
Cypermethrin 0.065 4.4 0.072 1.5 0.092 1.9 Deltamethrin 0.006 0.4 0.037 0.8 0.005 0.1 Esfenvalerate 0.010 0.2 0.004 0.1 Fenpropathrin 0.006 0.4 0.004 0.1 0.001 0.0 Fipronil 0.023 0.5 0.011 0.2 Gamma-cyhalothrin 0.005 0.1 Imidacloprid 0.025 0.5 0.024 0.5 Lambda-cyhalothrin 0.004 0.3 0.004 0.1 0.048 1.0 Monocrotophos 0.272 18.6 0.252 5.4 Permethrin 10.3 0.004 0.1 0.041 0.8 Profenofos 0.151 0.144 3.1 0.349 7.1 Pyridaphenthion 0.004 0.1 Spinosad 0.013 0.3 0.014 0.3 Thiamethoxam 0.019 0.4 0.039 0.8
Zeta-cypermethrin 0.002 0.2 0.010 0.2 0.139 2.8 Benfuracarb 0.063 1.4 Carbaryl 0.029 0.6 0.010 0.2 Carbosulfan 0.015 0.3 0.735 15 Chlorfenapyr 0.005 0.1 0.002 0.0 Dimethoate 0.017 1.1 0.035 0.8 0.202 4.1 Fenitrothion 0.037 2.5 0.201 4.3 0.004 0.1 Fenthion 0.8 0.0005 0.01 Fenvalerate 0.012 0.031 0.7 Indoxacarb 0.003 0.1 0.007 0.1 Malathion 0.005 0.1 Methamidophos 0.177 12.1 1.177 25.1 0.356 7.3 Methidathion 0.013 0.9 0.019 0.4 0.014 0.3 Methomyl 0.203 4.3 0.167 3.4 Phorate 0.072 1.5 0.007 0.1 Phosmet 0.002 0.0 Thiodicarb 0.013 0.3 Thiometon 0.010 0.7 Trichlorfon 0.050 1.1
Toxic
Vamidothion 0.002 0.1 0.004 0.1
Total 0.814 18 2.641 41 2.452 50

117
Table A 29: Brazil, active ingredients used in cotton have a high to very high potential to leach to groundwater. The percentages are based on the total amount used in cotton in that year.
1994 2000 2006 Leaching potential to groundwater (GUS)
active ingredient kg a.i./ha %
kg a.i./ha %
kg a.i./ha %
Methoxyfenozide 0.002 0.0 0.006 0.1 Very High
Tetradifon 0.002 0.1 0.001 0.0
Imidacloprid 0.025 0.5 0.024 0.5
Tebufenozide 0.001 0.0
Thiamethoxam 0.019 0.4 0.039 0.8
High
Trichlorfon 0.050 1
Total 0.002 0.1 0.097 2 0.069 1

118
Environmental Toxic Load (ETL)
0
200
400
600
800
1000
1200
1400
1600
1994 2000 2006
ET
L f
or f
ish
Zeta-cypermethrin
Lambda-cyhalothrin
Fenpropathrin
Esfenvalerate
Endosulfan
Diafenthiuron
Cypermethrin
Chlorpyrifos
Carbosulfan
Others
Figure A 14 Brazil, ETL for fish
0
1000
2000
3000
4000
5000
6000
7000
8000
9000
1994 2000 2006
ET
L f
or D
ap
hn
ia
Zeta-cypermethrin
Lambda-cyhalothrin
Fenvalerate
Cypermethrin
Cyfluthrin
Chlorpyrifos
Carbosulfan
Bifenthrin
Others
Figure A 15: Brazil ETL for Daphnia

119
0
2
4
6
8
1994 2000 2006
ET
L f
or
alg
ae
Triflumuron
Teflubenzuron
Sulphur
Permethrin
Fipronil
Esfenvalerate
Endosulfan
Disulfoton
Others
Figure A 16 Brazil, ETL for algae
0
20
40
60
80
100
120
140
1994 2000 2006
ET
L f
or b
ee
s
Zeta-cypermethrin
Spinosad
Profenofos
Monocrotophos
Methamidophos
Imidacloprid
Fipronil
Deltamethrin
Cypermethrin
Cyfluthrin
Carbosulfan
Beta-cyfluthrin
Others
Figure A 17 Brazil, ETL for bees


121
Appendix 10 India, summary of tables and graphs
Pesticide use in cotton Table A 30 shows the 10 active ingredients with the highest amount use in 2007 and the 10 Active ingredients with the highest increase and decrease in use between 1994 and 2006. The order for increase and decrease in use is based on the absolute difference in use between 1994 and 2006. The percentages indicate the increase or decrease in use for each active ingredient related to their use in 1994. Table A 31 shows the 10 major active ingredients according to the cumulative treated area. Table A 30: India, 10 active ingredients with highest use in 2006, with the greatest decrease in use, and with the strongest increase between 1994 and 2006, percentages are based on the total amount applied.
Major a.i. in 2006 Greatest decrease between
1994 and 2006 Strongest increase between 1994 and 2006
1 Acephate 30% Monocrotophos -65% Acephate 367%
2 Chlorpyrifos 16% Parathion-m -92% Chlorpyrifos 360%
3 Monocrotophos 12% Lindane -99.6% Profenofos New*
4 Endosulfan 8% Endosulfan -45% Phorate 684%
5 Profenofos 5% Fenvalerate -98% Thiodicarb New*
6 Phorate 4% Dimethoate -86% Ethion 724%
7 Ethion 3% Cypermethrin -58% Triazophos 173%
8 Thiodicarb 3% Phosphamidon -96% Imidacloprid New*
9 Cypermethrin 3% Carbaryl -82% Methomyl 384%
10 Dichlorvos 3% Quinalphos -52% Spinosad New* *-New = active ingredients which were not used in cotton in 1994 but were used in 2006.
Table A 31: India, 10 active ingredients with highest use in 2006, with the greatest decrease in use, and with the strongest increase between 1994 and 2006, percentages are based on hectare treated area of cotton
Major a.i. in 2006 Greatest decrease between 1994 and 2006
Strongest increase between 1994 and 2006
1 Acephate 20 Cypermethrin -58% Acephate 366
2 Cypermethrin 14 Fenvalerate -97% Imidacloprid New*
3 Chlorpyrifos 12 Monocrotophos -65% Chlorpyrifos 252
4 Imidacloprid 10 Dimethoate -86% Acetamiprid New*
5 Monocrotophos 7 Parathion-m -92% Profenofos New*
6 Alphacypermethrin 4 Endosulfan -51% Lambda-cyhalothrin New*
7 Acetamiprid 3 Deltamethrin -66% Thiamethoxam New*
8 Profenofos 3 Quinalphos -62% Spinosad New*
9 Endosulfan 3 Phosphamidon -92% Indoxacarb New*
10 Monocrotophos 20 Lindane -99.6% Novaluron New* *-New = active ingredients which were not used in cotton in 1994 but were used in 2006.

122
Hazards Table A 32: India, active ingredients used in cotton that are highly to extremely hazardous to human health.. The percentages are based on the total amount used in cotton in that year.
1994 2000 2006 Acute hazard to human health active ingredient
kg a.i./ha %
kg a.i./ha %
kg a.i./ha %
Parathion-methyl 0.12 10 0.01 1 0.01 1
Phorate 0.005 0.4 0.07 5 0.03 5
Extremely hazardous
Phosphamidon 0.04 3 0.01 0.4 0.001 0.4
Dichlorvos 0.03 2 0.02 1 0.02 1
Methomyl 0.002 0.2 0.04 3 0.01 3
Monocrotophos 0.36 29 0.22 15 0.11 15
Oxydemeton-m 0.02 1 0.01 0.4 0.003 0.4
Thiometon 0.001 0.1 0.001 0.1 0.1
Highly hazardous
Triazophos 0.01 1 0.05 3 0.02 3
Total 0.58 47 0.43 28 0.21 28 Table A 33: India, active ingredients used in cotton which are ranked as possible carcinogenic. The percentages are based on the total amount used in cotton in that year.
1994 2000 2006
Carcinogenicity active ingredient kg a.i./ha %
kg a.i./ha %
kg a.i./ha %
H351 – Suspected of causing cancer Carbaryl 0.03 2.6 0.02 1.0 0.005 0.0
R40 – May cause cancer Bifenthrin 0.0003 0.6
Total 0.031 2.6 0.016 1.0 0.005 0.6 Table A 34: India, active ingredients used in cotton which are suspected of causing genetic defects. The percentages are based on the total amount used in cotton in that year.
1994 2000 2006
Genotoxicity a.i. Kg a.i./ha %
kg a.i./ha %
kg a.i./ha %
Fenthion 0.01 0.7 0.005 0.3 0.003 0.3
Monocrotophos 0.36 29.2 0.22 14.7 0.11 11.9 H341 - Suspected of causing genetic defects Phosphamidon 0.04 3.1 0.01 0.4 0.001 0.1
Total 0.40 33 0.24 15 0.11 12
Table A 35: India, active ingredients used in cotton which pose a hazard to reproduction. The percentages are based on the total amount used in cotton in that year.
Reproductive toxicity active ingredient 1994 2000 2006 H362 - May cause harm to breast-fed children Lindane 0.084 6.8 0.003 0.2 0.0003 0.03
Total 0.084 7 0.003 0.2 0.0003 0.03

123
Table A 36: India, active ingredients used in cotton which are very highly toxic to fish. The percentages are based on the total amount used in cotton in that year.
1994 2000 2006
Acute hazard to fish active ingredient kg a.i./ha % kg a.i./ha %
kg a.i./ha %
Alpha-cypermethrin 0.003 0.2 0.007 0.5 0.003 0.4
Bifenthrin 0.0003 0.0
Chlorfenapyr 0.001 0.1
Chlorpyrifos 0.036 3.0 0.226 14.8 0.143 15.9
Cypermethrin 0.068 5.6 0.089 5.8 0.025 2.7
Deltamethrin 0.002 0.1 0.002 0.1 0.0005 0.1
Diafenthiuron 0.001 0.1
Endosulfan 0.158 13.0 0.164 10.7 0.075 8.3
Etofenprox 0.0001 0.0 0.001 0.1 0.00005 0.0
Fenazaquin 0.0003 0.0
Fenvalerate 0.070 5.7 0.064 4.2 0.001 0.1
Lambda-cyhalothrin 0.001 0.1 0.002 0.3
Lindane 0.084 6.8 0.003 0.2 0.0003 0.0
Phorate 0.005 0.4 0.070 4.6 0.032 3.6
Profenofos 0.046 3.0 0.043 4.8
Quinalphos 0.048 3.9 0.097 6.3 0.020 2.2
Tau-fluvalinate 0.001 0.1 0.00004 0.0 0.00004 0.0
Very highly toxic
Triazophos 0.009 0.8 0.051 3.3 0.022 2.4
Total 0.483 40 0.820 54 0.370 41 Table A 37: India, active ingredients used in cotton which are very highly toxic to Daphnia. The percentages are based on the total amount used in cotton in that year.
1994 2000 2006
Acute hazard to Daphni a active ingredient kg a.i./ha %
kg a.i./ha %
kg a.i./ha %
Alpha-cypermethrin 0.003 0.2 0.007 0.5 0.003 0.4
Bifenthrin 0.0003 0.0
Carbaryl 0.031 2.6 0.016 1.0 0.005 0.6
Chlorfenapyr 0.001 0.1
Chlorpyrifos 0.036 3.0 0.226 14.8 0.143 15.9
Cypermethrin 0.068 5.6 0.089 5.8 0.025 2.7
Deltamethrin 0.002 0.1 0.002 0.1 0.0005 0.1
Dichlorvos 0.029 2.4 0.021 1.4 0.024 2.6 Emamectin Benzoate 0.0001 0.0
Ethion 0.004 0.3 0.131 8.6 0.027 3.0
Etofenprox 0.000 0.0 0.001 0.1 0.00005 0.0
Fenazaquin 0.0003 0.0
Fenthion 0.008 0.7 0.005 0.3 0.003 0.3
Fenvalerate 0.070 5.7 0.064 4.2 0.001 0.1
Lambda-cyhalothrin 0.001 0.1 0.002 0.3
Lufenuron 0.0003 0.0
Monocrotophos 0.357 29.2 0.225 14.7 0.107 11.9
Novaluron 0.001 0.1
Very highly toxic
Parathion-methyl 0.119 9.7 0.011 0.7 0.008 0.9

124
1994 2000 2006
Acute hazard to Daphni a active ingredient kg a.i./ha %
kg a.i./ha %
kg a.i./ha %
Phenthoate 0.001 0.1 0.002 0.1 0.002 0.3
Phorate 0.005 0.4 0.070 4.6 0.032 3.6
Phosalone 0.004 0.3 0.005 0.3 0.001 0.1
Phosphamidon 0.038 3.1 0.006 0.4 0.001 0.1
Quinalphos 0.048 3.9 0.097 6.3 0.020 2.2
Tau-fluvalinate 0.001 0.1 0.000 0.0 0.0004 0.0
Thiodicarb 0.027 1.8 0.027 2.9
Triazophos 0.009 0.8 0.051 3.3 0.022 2.4
Total 0.833 68 1.055 69 0.457 51 Table A 38: India, active ingredients used in cotton which are highly to very highly toxic to algae. The percentages are based on the total amount used in cotton in that year.
1994 2000 2006
Hazard to algae active ingredient kg a.i./ha %
kg a.i./ha %
kg a.i./ha %
Dicofol 0.0002 0.0 0.006 0.4 0.004 0.5
Fipronil 0.0001 0.0 0.001 0.1
Very highly toxic
Spinosad 0.006 0.6
Alpha-cypermethrin 0.003 0.2 0.007 0.5 0.003 0.4
Carbaryl 0.031 2.6 0.016 1.0 0.005 0.6
Chlorfenapyr 0.001 0.1
Chlorpyrifos 0.036 3.0 0.226 14.8 0.143 15.9
Etofenprox 0.0001 0.0 0.001 0.1 0.00005 0.0
Indoxacarb 0.001 0.1 0.003 0.4
Highly toxic
Lambda-cyhalothrin 0.001 0.1 0.002 0.3
Total 0.071 6 0.259 17 0.169 19 Table A 39: India, active ingredients used in cotton which are toxic to highly toxic to bees. The percentages are based on the total amount used in cotton in that year.
1994 2000 2006
Acute hazard to bees active ingredient kg a.i./ha %
kg a.i./ha %
kg a.i./ha %
Alpha-cypermethrin 0.003 0.2 0.007 0.5 0.003 0.4
Bifenthrin 0.0001 0.0
Chlorpyrifos 0.036 3.0 0.226 14.8 0.143 15.9
Clothianidin 0.001 0.1
Cypermethrin 0.068 5.6 0.089 5.8 0.025 2.7
Deltamethrin 0.002 0.1 0.002 0.1 0.0005 0.1 Emamectin Benzoate 0.0001 0.0
Fipronil 0.000 0.0 0.001 0.1
Imidacloprid 0.003 0.2 0.013 1.4
Lambda-cyhalothrin 0.001 0.1 0.002 0.3
Monocrotophos 0.357 29.2 0.225 14.7 0.107 11.9
Profenofos 0.046 3.0 0.043 4.8
Quinalphos 0.048 3.9 0.097 6.3 0.020 2.2
Highly Toxic
Spinosad 0.006 0.6

125
1994 2000 2006
Acute hazard to bees active ingredient kg a.i./ha %
kg a.i./ha %
kg a.i./ha %
Thiamethoxam 0.003 0.4
Carbaryl 0.031 2.6 0.016 1.0 0.005 0.6
Chlorfenapyr 0.001 0.1
Dichlorvos 0.029 2.4 0.021 1.4 0.024 2.6
Dimethoate 0.061 5.0 0.019 1.2 0.007 0.8
Etofenprox 0.0001 0.0 0.001 0.1 0.00005 0.0
Fenthion 0.008 0.7 0.005 0.3 0.003 0.3
Fenvalerate 0.070 5.7 0.064 4.2 0.001 0.1
Indoxacarb 0.001 0.1 0.003 0.4
Lindane 0.084 6.8 0.003 0.2 0.0003 0.0
Methomyl 0.002 0.2 0.040 2.6 0.010 1.1
Oxydemeton-m 0.017 1.4 0.006 0.4 0.003 0.3
Phenthoate 0.001 0.1 0.002 0.1 0.002 0.3
Phorate 0.005 0.4 0.070 4.6 0.032 3.6
Phosphamidon 0.038 3.1 0.006 0.4 0.001 0.1
Thiodicarb 0.027 1.8 0.027 2.9
Toxic
Thiometon 0.001 0.1 0.001 0.1 Total 0.86 70 0.98 64 0.49 54
Table A 40: India, active ingredients used in cotton have a high to very high hazard to leach to groundwater. The percentages are based on the total amount used in cotton in that year.
1994 2000 2006 Potential to leach to groundwater (GUS) active ingredient
kg a.i./ha %
kg a.i./ha %
kg a.i./ha %
Azadirachtin 0.0004 0.0 0.001 0.1 Very High
Clothianidin 0.001 0.1
Imidacloprid 0.003 0.2 0.01 1.4 High
Thiamethoxam 0.003 0.4
Total 0 0.003 0.2 0.02 2.0

126
Environmental Toxic Load (ETL)
0
100
200
300
400
500
1994 2000 2006
ET
L f
or f
ish
Quinalphos
Lindane
Lambda-cyhalothrin
Fenvalerate
Endosulfan
Cypermethrin
Chlorpyrifos
Others
Figure A 18: India ETL for fish.
0
1000
2000
3000
4000
5000
6000
7000
8000
9000
10000
1994 2000 2006
ET
L f
or Daphnia Lambda-cyhalothrin
Fenvalerate
Ethion
Cypermethrin
Chlorpyrifos
Others
Figure A 19: India ETL for Daphnia.

127
0.00
0.25
0.50
0.75
1.00
1994 2000 2006
ET
L f
or
alg
ae
Spinosad
Phorate
Endosulfan
Dicofol
Chlorpyrifos
Others
Figure A 20: India ETL for algae.
0
5
10
15
20
25
1994 2000 2006
ET
L f
or b
ee
s
Spinosad
Quinalphos
Monocrotophos
Imidacloprid
Deltamethrin
Cypermethrin
Chlorpyrifos
Others
Figure A 21: India ETL for bees.


129
Appendix 11 Turkey, summary of tables and graphs
Pesticide use in cotton Table A 41 shows the 10 active ingredients with the highest amount use in 2007 and the 10 Active ingredients with the highest increase and decrease in use between 1994 and 2006. The order for increase and decrease in use is based on the absolute difference in use between 1994 and 2006. The percentages indicate the increase or decrease in use for each active ingredient related to their use in 1994. Table A 42 shows the 10 major active ingredients according to the cumulative treated area. Table A 41: Turkey, 10 active ingredients with highest use in 2006, with the greatest decrease in use, and with the strongest increase between 1994 and 2006, percentages are based on the total amount applied in cotton in the country
Major a.i. in 2006 Greatest decrease between 1994
and 2006 Strongest increase between 1994 and 2006
1 Thiodicarb 33% Methamidophos -100% Thiodicarb 859%
2 Dimethoate 12% Profenofos -82% Acetamiprid New*
3 Endosulfan 8% Amitraz -100% Dimethoate 95%
4 Acetamiprid 8% Carbosulfan -92% Trimethacarb New*
5 Monocrotophos 7% Parathion-m -82% Acephate New*
6 Trimethacarb 4% Chlorpyrifos -63% Zeta-cypermethrin New*
7 Diazinon 3% Carbaryl -100% Monocrotophos 9%
8 Diafenthiuron 3% Benfuracarb -100% Hexythiazox 869%
9 Chlorpyrifos 3% Propargite -75% Tetradifon 79%
10 Profenofos 2% Endosulfan -22% Fenitrothion New* *-New = active ingredients which were not used in cotton in 1994 but were used in 2006. Table A 42: Turkey, 10 active ingredients with highest use in 2006, with the greatest decrease in use, and with the strongest increase between 1994 and 2006, percentages are based on hectare treated area of cotton
Major a.i. in 2006 Greatest decrease between 1994
and 2006 Strongest increase between 1994 and 2006
1 Acetamiprid 29% Lambda-cyhalothrin -67% Acetamiprid New*
2 Thiodicarb 13% Methamidophos -100% Thiodicarb 859%
3 Dimethoate 8% Cypermethrin -75% Dimethoate 107%
4 Abamectin 4% Benfuracarb -100% Abamectin New*
5 Lambda-cyhalothrin 4% Parathion-m -82% Lufenuron New*
6 Chlorfluazuron 4% Carbosulfan -92% Hexythiazox 869%
7 Hexythiazox 4% Amitraz -100% Teflubenzuron New*
8 Lufenuron 4% Profenofos -77% Zeta-cypermethrin New*
9 Endosulfan 3% Furathiocarb -100% Trimethacarb New*
10 Oxydemeton-m 2% Chlorpyrifos -64% Tetradifon 79% *-New = active ingredients which were not used in cotton in 1994 but were used in 2006.

130
Hazards Table A 43: Turkey, active ingredients used in cotton that are highly to extremely hazardous to human health. The percentages are based on the total amount used in cotton in that year.
1994 2000 2006 Acute hazard to human health active ingredient
kg a.i./ha %
kg a.i./ha %
kg a.i./ha %
Aldicarb 0.005 1
Parathion-methyl 0.037 4 0.070 5 0.007 1
Phorate 0.001 0.1
Extremely hazardous
Phosphamidon 0.007 1
Azinphos-methyl 0.009 1 0.002 0.1 0.001 0.2
Cyfluthrin 0.001 0.1 0.002 0.2 0.0003 0.0
Furathiocarb 0.012 1 0.012 1
Methamidophos 0.222 26 0.524 38
Methomyl 0.007 1 0.006 0.4
Monocrotophos 0.039 5 0.070 5 0.042 7
Oxydemeton-m 0.011 1 0.012 1 0.013 2
Thiometon 0.003 0.3 0.003 0.2
Triazophos 0.002 0.3 0.012 1
Highly hazardous
Zeta-cypermethrin 0.004 1
Total 0.356 41 0.712 51 0.066 12 Table A 44: Turkey, active ingredients used in cotton which are ranked as possible carcinogenic. The percentages are based on the total amount used in cotton in that year.
1994 2000 2006
Carcinogenicity active ingredient kg a.i./ha %
kg a.i./ha %
kg a.i./ha %
Carbaryl 0.026 3
Propargite 0.026 3 0.016 1.2 0.006 1.1
H351 - Suspected of causing cancer
Pymetrozine 0.002 0.1
Bifenthrin 0.002 0.3 0.002 0.2 0.001 0.2 R40 - May cause cancer
Teflubenzuron 0.003 0.2 0.002 0.4 US-EPA: Likely to be Carcinogenic to Humans Thiacloprid 0.002 0.4
Total 0.054 6 0.023 1.6 0.012 2.1 Table A 45: Turkey, active ingredients used in cotton which are suspected of causing genetic defects. The percentages are based on the total amount used in cotton in that year.
1994 2000 2006
Genotoxicity active ingredient kg a.i./ha %
kg a.i./ha %
kg a.i./ha %
Fenthion 0.001 0.1
Monocrotophos 0.04 4.5 0.07 5 0.04 7.3
H341 - Suspected of causing genetic defects
Phosphamidon 0.01 0.8
Total 0.05 5 0.07 5 0.04 7

131
Table A 46: Turkey, active ingredients used in cotton which pose a hazard to reproduction. The percentages are based on the total amount used in cotton in that year.
1994 2000 2006
Reproductive Toxicity a.i. kg a.i./ha % kg a.i./ha % kg a.i./ha %
R63 - Possible risk of harm to the unborn child Abamectin 0.001 0.1
Total 0 0 0.001 0.1 Table A 47: Turkey, active ingredients used in cotton which are very highly toxic to fish. The percentages are based on the total amount used in cotton in that year.
1994 2000 2006
Acute hazard to fish active ingredient kg a.i./ha %
kg a.i./ha %
kg a.i./ha %
Abamectin 0.001 0.1
Alpha-cypermethrin 0.002 0.2 0.002 0.3
Azinphos-methyl 0.009 1.1 0.002 0.1 0.001 0.2
Benfuracarb 0.025 2.9 0.002 0.1
Beta-cyfluthrin 0.00005 0.0
Bifenthrin 0.002 0.3 0.002 0.2 0.001 0.2
Carbosulfan 0.033 3.8 0.041 3.0 0.003 0.4
Chlorfenapyr 0.003 0.2 0.001 0.1
Chlorpyrifos 0.044 5.1 0.151 10.8 0.016 2.8
Cyfluthrin 0.001 0.1 0.002 0.2 0.000 0.0
Cyhexatin 0.003 0.2 0.002 0.4
Cypermethrin 0.013 1.5 0.016 1.2 0.006 1.1
Deltamethrin 0.001 0.1 0.001 0.1
Diafenthiuron 0.023 2.6 0.026 1.8 0.018 3.2
Endosulfan 0.057 6.5 0.072 5.1 0.044 7.6
Esfenvalerate 0.001 0.1% 0.001 0.1
Fenazaquin 0.001 0.1
Fenbutatin oxide 0.002 0.3 0.015 1.1
Fenpropathrin 0.002 0.2 0.007 0.5 0.003 0.4
Fenvalerate 0.001 0.1
Furathiocarb 0.012 1.4 0.012 0.8
Hexythiazox 0.0004 0.0 0.001 0.1 0.004 0.6
Lambda-cyhalothrin 0.008 0.9 0.003 0.2 0.006 1.0
Malathion 0.003 0.4 0.002 0.1
Mephosfolan 0.003 0.2
Phorate 0.001 0.0
Profenofos 0.082 9.5 0.023 1.7 0.014 2.5
Quinalphos 0.002 0.2 0.003 0.2
Spiromesifen 0.001 0.1
Teflubenzuron 0.003 0.2 0.002 0.4
Tralomethrin 0.0001 0.0
Triazophos 0.002 0.3 0.012 0.9
Very highly toxic
Zeta-cypermethrin 0.004 0.6
Total 0.32 37 0.40 29 0.13 22

132
Table A 48: Turkey, active ingredients used in cotton which are very highly toxic to Daphnia. The percentages are based on the total amount used in cotton in that year.
1994 2000 2006
Acute hazard to Daphni a active ingredient kg a.i./ha %
kg a.i./ha %
kg a.i./ha %
Abamectin 0.001 0.1
Alpha-cypermethrin 0.002 0.2 0.002 0.3
Amitraz 0.033 3.8 0.014 1.0
Azinphos-methyl 0.009 1.1 0.002 0.1 0.001 0.2
Benfuracarb 0.025 2.9 0.002 0.1
Beta-cyfluthrin 0.00005 0.0
Bifenthrin 0.002 0.3 0.002 0.2 0.001 0.2
Carbaryl 0.026 3.0
Carbosulfan 0.033 3.8 0.041 3.0 0.003 0.4
Chlorfenapyr 0.003 0.2 0.001 0.1
Chlorfluazuron 0.002 0.3 0.001 0.1 0.003 0.5
Chlorpyrifos 0.044 5.1 0.151 10.8 0.016 2.8
Cyfluthrin 0.001 0.1 0.002 0.2 0.0003 0.0
Cypermethrin 0.013 1.5 0.016 1.2 0.006 1.1
Deltamethrin 0.001 0.1 0.001 0.1
Diazinon 0.029 3.3 0.033 2.4 0.019 3.3
Diflubenzuron 0.000 0.0 Emamectin Benzoate 0.0003 0.04 Esfenvalerate 0.001 0.1 0.001 0.1
Fenazaquin 0.001 0.1
Fenbutatin oxide 0.002 0.3 0.015 1.1
Fenitrothion 0.002 0.2 0.003 0.5
Fenpropathrin 0.002 0.2 0.007 0.5 0.003 0.4
Fenthion 0.001 0.1
Fenvalerate 0.001 0.1
Furathiocarb 0.012 1.4 0.012 0.8
Hexaflumuron 0.0002 0.0 0.00003 0.01
Lambda-cyhalothrin 0.008 0.9 0.003 0.2 0.006 1.0
Lufenuron 0.001 0.1 0.001 0.2
Malathion 0.003 0.4 0.002 0.1
Mephosfolan 0.003 0.2
Monocrotophos 0.039 4.5 0.070 5.0 0.042 7.3
Novaluron 0.0001 0.01
Parathion-methyl 0.037 4.2 0.070 5.0 0.007 1.2
Phorate 0.001 0.0
Phosalone 0.005 0.6 0.006 0.4
Phosphamidon 0.007 0.8
Pirimiphos-methyl 0.002 0.2 0.003 0.2
Propargite 0.026 2.9 0.016 1.2 0.006 1.1
Quinalphos 0.002 0.2 0.003 0.2
Spiromesifen 0.001 0.1
Teflubenzuron 0.003 0.2 0.002 0.4
Very highly toxic
Thiodicarb 0.020 2.3 0.017 1.2 0.189 32.8

133
1994 2000 2006
Acute hazard to Daphni a active ingredient kg a.i./ha %
kg a.i./ha %
kg a.i./ha %
Tralomethrin 0.0001 0.0
Triazophos 0.002 0.3 0.012 0.9
Zeta-cypermethrin 0.004 0.6
Total 0.388 44 0.516 37 0.315 55 Table A 49: Turkey, active ingredients used in cotton which are highly to very highly toxic to algae. The percentages are based on the total amount used in cotton in that year.
1994 2000 2006
Hazard to algae active ingredient kg a.i./ha %
kg a.i./ha %
kg a.i./ha %
Dicofol 0.013 1.5 0.028 2.0 0.011 1.9
Esfenvalerate 0.001 0.1 0.001 0.1
Fenbutatin oxide 0.002 0.3 0.015 1.1
Spinosad 0.0003 0.1
Spiromesifen 0.001 0.1
Very highly toxic
Teflubenzuron 0.003 0.2 0.002 0.4
Alpha-cypermethrin 0.002 0.2 0.002 0.3
Amitraz 0.033 3.8 0.014 1.0
Carbaryl 0.026 3.0
Chlorfenapyr 0.003 0.2 0.001 0.1
Chlorpyrifos 0.044 5.1 0.151 10.8 0.016 2.8
Clofentezine 0.001 0.2 0.001 0.0
Cyhexatin 0.003 0.2 0.002 0.4
Diflubenzuron 0.0001 0.0
Hexythiazox 0.0004 0.0 0.001 0.1 0.004 0.6
Indoxacarb 0.0004 0.1
Highly toxic
Lambda-cyhalothrin 0.008 0.9 0.003 0.2 0.006 1.0
Total 0.767 15 1.252 16 0.414 8 Table A 50: Turkey, active ingredients used in cotton which are toxic to highly toxic to bees. The percentages are based on the total amount used in cotton in that year.
1994 2000 2006
Acute hazard to bees active ingredient kg a.i./ha %
kg a.i./ha %
kg a.i./ha %
Abamectin 0.001 0.1
Aldicarb 0.005 0.6
Alpha-cypermethrin 0.002 0.2 0.002 0.3
Azinphos-methyl 0.009 1.1 0.002 0.1 0.001 0.2
Beta-cyfluthrin 0.00005 0.01
Bifenthrin 0.002 0.3 0.002 0.2 0.001 0.2
Chlorpyrifos 0.044 5.1 0.151 10.8 0.016 2.8
Cyfluthrin 0.001 0.1 0.002 0.2 0.0003 0.0
Cypermethrin 0.013 1.5 0.016 1.2 0.006 1.1
Deltamethrin 0.001 0.1 0.001 0.1
Diazinon 0.029 3.3 0.033 2.4 0.019 3.3
Highly Toxic
Emamectin Benzoate 0.0003 0.04

134
1994 2000 2006
Acute hazard to bees active ingredient kg a.i./ha %
kg a.i./ha %
kg a.i./ha %
Esfenvalerate 0.001 0.1 0.001 0.1
Fenpropathrin 0.002 0.2 0.007 0.5 0.003 0.4
Imidacloprid 0.008 0.5
Lambda-cyhalothrin 0.008 0.9 0.003 0.2 0.006 1
Monocrotophos 0.039 4.5 0.070 5 0.042 7.3
Profenofos 0.082 9.5 0.023 1.7 0.014 2.5
Quinalphos 0.002 0.2 0.003 0.2
Spinosad 0.0003 0.1
Zeta-cypermethrin 0.004 0.6
Benfuracarb 0.025 2.9 0.002 0.1
Carbaryl 0.026 3
Carbosulfan 0.033 3.8 0.041 3 0.003 0.4
Chlorfenapyr 0.003 0.2 0.001 0.1
Dimethoate 0.035 4 0.125 9 0.067 11.6
Fenitrothion 0.002 0.2 0.003 0.5
Fenthion 0.001 0.1
Fenvalerate 0.001 0.1
Hexaflumuron 0.0002 0.0 0.00003 0.0
Indoxacarb 0.0004 0.1
Malathion 0.003 0.4 0.002 0.1
Methamidophos 0.222 25.6 0.524 37.6
Methomyl 0.007 0.8 0.006 0.4
Oxydemeton-m 0.011 1.3 0.012 0.8 0.013 2.2
Phorate 0.001 0.05
Phosphamidon 0.007 0.8
Pirimiphos-methyl 0.002 0.2 0.003 0.2
Thiodicarb 0.020 2.3 0.017 1.2 0.189 32.8
Thiometon 0.003 0.3 0.003 0.2
Toxic
Tralomethrin 0.0001 0.0
Total 0.635 73 1.061 76 0.390 68 Table A 51: Turkey, active ingredients used in cotton have a high to very high potential to leach to groundwater. The percentages are based on the total amount used in cotton in that year.
1994 2000 2006 Potential to leach to groundwater (GUS) active ingredient
kg a.i./ha %
kg a.i./ha %
kg a.i./ha %
Very High Tetradifon 0.004 0.5 0.008 0.6 0.007 1.0
High Imidacloprid 0.008 0.5
Total 0.004 0.5 0.015 1.1 0.007 1.0
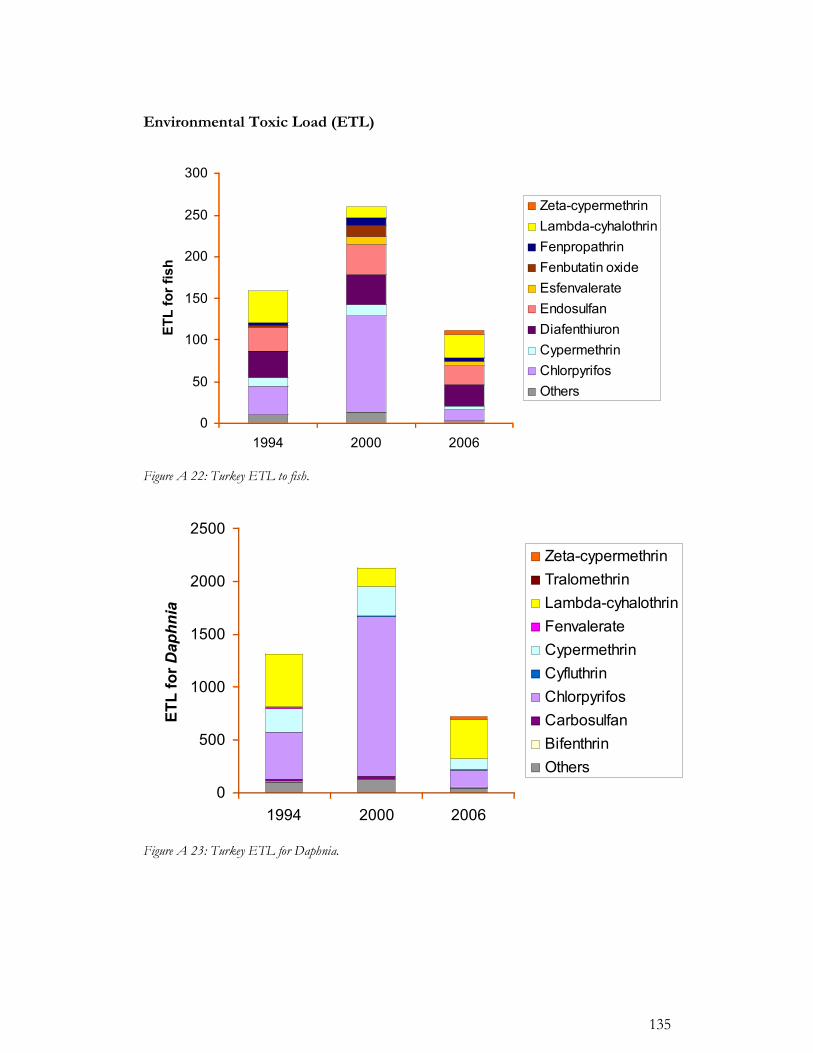
135
Environmental Toxic Load (ETL)
0
50
100
150
200
250
300
1994 2000 2006
ET
L f
or f
ish
Zeta-cypermethrin
Lambda-cyhalothrin
Fenpropathrin
Fenbutatin oxide
Esfenvalerate
Endosulfan
Diafenthiuron
Cypermethrin
Chlorpyrifos
Others
Figure A 22: Turkey ETL to fish.
0
500
1000
1500
2000
2500
1994 2000 2006
ET
L f
or Daphnia
Zeta-cypermethrin
Tralomethrin
Lambda-cyhalothrin
Fenvalerate
Cypermethrin
Cyfluthrin
Chlorpyrifos
Carbosulfan
Bifenthrin
Others
Figure A 23: Turkey ETL for Daphnia.

136
0
7
14
21
28
35
1994 2000 2006
ET
L f
or
alg
ae
Thiodicarb
Teflubenzuron
Lambda-cyhalothrin
Hexythiazox
Fenbutatin oxide
Esfenvalerate
Endosulfan
Dicofol
Cyhexatin
Chlorpyrifos
Others
Figure A 24: Turkey ETL for algae.
0.0
0.2
0.4
0.6
0.8
1.0
1.2
1.4
1994 2000 2006
ET
L f
or b
ees
Trimethacarb
Thiodicarb
Profenofos
Parathion-methyl
Monocrotophos
Methamidophos
Endosulfan
Dimethoate
Diazinon
Diafenthiuron
Chlorpyrifos
Carbosulfan
Carbaryl
Benfuracarb
Amitraz
Acetamiprid
Others
Figure A 25: Turkey ETL for bees.

137
Appendix 12 USA, summary of tables and graphs
Pesticide use in cotton Table A 52 shows the 10 active ingredients with the highest amount use in 2007 and the 10 Active ingredients with the highest increase and decrease in use between 1994 and 2006. The order for increase and decrease in use is based on the absolute difference in use between 1994 and 2006. The percentages indicate the increase or decrease in use for each active ingredient related to their use in 1994. Table A 53 shows the 10 major active ingredients according to the cumulative treated area.
Table A 52: USA 10 active ingredients with highest use in 2006, with the greatest decrease in use, and with the strongest increase between 1994 and 2006, percentages are based on the total amount applied.
Major a.i. in 2006 Greatest decrease between
1994 and 2006 Strongest increase between 1994 and 2006
1 Dichloropropene 36% Parathion-m -97% Dichloropropene 254%
2 Acephate 24% Endosulfan -99% Acephate 162%
3 Aldicarb 18% Metam-sodium -100% Aldicarb 54%
4 Dicrotophos 8% Parathion-e -100% Dicrotophos 249%
5 Sulphur 3% Profenofos -96% Sulphur 47%
6 Chlorpyrifos 2% Dicofol -93% Thiamethoxam New*
7 Oxamyl 1% Thiodicarb -100% Metam-potassium New *
8 Cypermethrin 1% Propargite -98% Acetamiprid New*
9 Thiamethoxam 1% Phorate -93% Imidacloprid New*
10 Parathion-m 1% Azinphos-m -95% Indoxacarb New* *-New = active ingredients which were not used in cotton in 1994 but were used in 2006.
Table A 53: USA, 10 active ingredients with highest use in 2006, with the greatest decrease in use, and with the strongest increase between 1994 and 2006, percentages are based on hectares treated area of cotton.
Major a.i. in 2006 Greatest decrease 1994 2006 Strongest increase
1 Acephate 22% Parathion-m -97% Acephate 303%
2 Dicrotophos 13% Lambda-cyhalothrin -69% Thiamethoxam New*
3 Aldicarb 13% Esfenvalerate -89% Dicrotophos 192%
4 Thiamethoxam 10% Endosulfan -99% Imidacloprid New*
5 Cypermethrin 8% Tralomethrin -100% Acetamiprid New* 6 Lambda-cyhalothrin 6% Zeta-cypermethrin -77% Aldicarb 23%
7 Cyfluthrin 5% Azinphos-m -90% Novaluron New*
8 Imidacloprid 3% Thiodicarb -99% Spinosad New*
9 Oxamyl 3% Profenofos -97% Dichloropropene 317%
10 Acetamiprid 3% Parathion-e -100% Indoxacarb New* *-New = active ingredients which were not used in cotton in 1994 but were used in 2006.

138
Hazards Table A 54: USA, active ingredients used in cotton that are highly to extremely hazardous to human health.. The percentages are based on the total amount used in cotton in that year.
1994 2000 2006 Acute hazard to human health active ingredient
kg a.i./ha %
kg a.i./ha %
kg a.i./ha %
Aldicarb 0.132 7 0.211 28 0.212 18
Disulfoton 0.039 2 0.012 2 0.0001 0.0
Ethoprophos 0.009 0.5
Mevinphos 0.001 0.0
Parathion 0.102 6
Parathion-methyl 0.253 14 0.069 9 0.007 1
Phorate 0.054 3 0.036 5 0.004 0.4
Extremely hazardous
Phosphamidon 0.0002 0.0
Azinphos-methyl 0.051 3 0.012 2 0.003 0.2
Carbofuran 0.009 0.5 0.026 3 0.0001 0.0
Cyfluthrin 0.009 0.5 0.006 1 0.004 0.4
Dicrotophos 0.027 2 0.035 5 0.099 8
Methamidophos 0.0001 0.0 0.007 1 0.001 0.1
Methidathion 0.001 0.1
Methomyl 0.011 1 0.005 1 0.0004 0.0
Oxamyl 0.021 1 0.071 9 0.018 1.5
Oxydemeton-m 0.0002 0.0
Highly hazardous
Zeta-cypermethrin 0.008 0.5 0.003 0.3 0.001 0.1
Total 0.727 40 0.493 65 0.349 30 Table A 55: USA, active ingredients used in cotton which are ranked as possible carcinogenic. The percentages are based on the total amount used in cotton in that year.
1994 2000 2006
Carcinogenicity active ingredient kg a.i./ha %
kg a.i./ha %
kg a.i./ha %
Carbaryl 0.002 0.1 0.001 0.1 0.002 0.2
Etridiazole 0.007 0.4 0.0005 0.1
H351 - Suspected of causing cancer
Propargite 0.054 3 0.004 0.5 0.001 0.1 R40 - May cause cancer Bifenthrin 0.002 0.1 0.002 0.2 0.003 0.2 US-EPA: Possible Human Carcinogenic Piperonyl butoxide 0.001 0.1
Total 0.066 3.7 0.007 0.9 0.006 0.5 Table A 56: USA, active ingredients used in cotton which are suspected of causing genetic defects. The percentages are based on the total amount used in cotton in that year.
1994 2000 2006
Genotoxicity active ingredient kg a.i./ha %
kg a.i./ha %
kg a.i./ha %
Methyl-bromide 0.036 2 H341 - Suspected of causing genetic defects
Phosphamidon 0.0002 0.01
Total 0.036 2.0 0 0

139
Table A 57: USA, active ingredients used in cotton which pose a hazard to reproduction. The percentages are based on the total amount used in cotton in that year.
1994 2000 2006
Reproductive toxicity active ingredient kg a.i./ha %
kg a.i./ha %
kg a.i./ha %
H362 - May cause harm to breast-fed children Lindane 0.00001 0.001 R63 - Possible risk of harm to the unborn child Abamectin 0.0004 0.02 0.0003 0.04 0.0002 0.02
Total 0.0004 0.02 0.0003 0.04 0.0002 0.02 Table A 58: USA, active ingredients used in cotton which are very highly toxic to fish. The percentages are based on the total amount used in cotton in that year.
1994 2000 2006
Acute hazard to fish active ingredient kg a.i./ha %
kg a.i./ha %
kg a.i./ha %
Abamectin 0.0004 0.0 0.0003 0.0 0.0002 0.0
Azinphos-methyl 0.0510 2.8 0.0116 1.5 0.0028 0.2
Bifenthrin 0.0020 0.1 0.0018 0.2 0.0025 0.2
Chlorpyrifos 0.0358 2.0 0.0464 6.1 0.0277 2.4
Cyfluthrin 0.0091 0.5 0.0057 0.8 0.0041 0.4
Cypermethrin 0.0140 0.8 0.0047 0.6 0.0123 1.0
Deltamethrin 0.0008 0.1 0.0001 0.0
Disulfoton 0.0389 2.2 0.0125 1.6 0.0001 0.0
Endosulfan 0.1739 9.6 0.0091 1.2 0.0021 0.2
Esfenvalerate 0.0093 0.5 0.0008 0.1 0.0006 0.1
Fenpropathrin 0.0051 0.3 0.0002 0.0
Fonofos 0.0001 0.0
Gamma-cyhalothrin 0.00002 0.0
Lambda-cyhalothrin 0.0125 0.7 0.0046 0.6 0.0039 0.3
Lindane 0.00001 0.0
Malathion 0.0455 2.5 0.0228 3.0 0.0004 0.04
Methidathion 0.0008 0.0
Mevinphos 0.0007 0.0
Permethrin 0.0008 0.0 0.0007 0.1 0.0002 0.01
Phorate 0.0543 3.0 0.0356 4.7 0.0042 0.4
Profenofos 0.0643 3.6 0.0338 4.4 0.0030 0.3
Pyrethrins 0.0001 0.0 <0.00001 0.0
Rotenone 0.0008 0.0 <0.00001 0.0
Spiromesifen 0.0006 0.0
Sulphur 0.0198 1.1 0.0011 0.1 0.0305 2.6
Tralomethrin 0.0037 0.2 0.0005 0.1 <0.00001 0.0
Very highly toxic
Zeta-cypermethrin 0.0083 0.5 0.0025 0.3 0.0009 0.1
Total 0.55 31 0.20 26 0.10 8

140
Table A 59: USA, active ingredients used in cotton which are very highly toxic to Daphnia. The percentages are based on the total amount used in cotton in that year.
1994 2000 2006 Acute hazard to Daphnia active ingredient
kg a.i./ha %
kg a.i./ha %
kg a.i./ha %
Abamectin 0.0004 0.0 0.0003 0.0 0.0002 0.0
Amitraz 0.0212 1.2 0.0011 0.2
Azinphos-methyl 0.0510 2.8 0.0116 1.5 0.0028 0.2
Bifenthrin 0.0020 0.1 0.0018 0.2 0.0025 0.2
Carbaryl 0.0016 0.1 0.0006 0.1 0.0020 0.2
Carbofuran 0.0092 0.5 0.0264 3.5 0.0001 0.0
Chlorpyrifos 0.0358 2.0 0.0464 6.1 0.0277 2.4
Chlorpyrifos-m 0.0011 0.1 0.0002 0.0
Cyfluthrin 0.0091 0.5 0.0057 0.8 0.0041 0.4
Cypermethrin 0.0140 0.8 0.0047 0.6 0.0123 1.0
Deltamethrin 0.0008 0.1 0.0001 0.0
Diazinon 0.0010 0.1
Dicrotophos 0.0271 1.5 0.0352 4.6 0.0989 8.4
Diflubenzuron 0.0009 0.1 0.0003 0.0
Disulfoton 0.0389 2.2 0.0125 1.6 0.0001 0.0 Emamectin Benzoate 0.0004 0.1 0.00005 0.0
Esfenvalerate 0.0093 0.5 0.0008 0.1 0.0006 0.1
Ethoprophos 0.0085 0.5
Fenpropathrin 0.0051 0.3 0.0002 0.0
Fonofos 0.0001 0.0
Gamma-cyhalothrin 0.00002 0.0
Lambda-cyhalothrin 0.0125 0.7 0.0046 0.6 0.0039 0.3
Malathion 0.0455 2.5 0.0228 3.0 0.0004 0.0
Methidathion 0.0008 0.0
Naled 0.0024 0.1 0.0016 0.2 0.0024 0.2
Novaluron 0.0001 0.0
Parathion 0.1023 5.7
Parathion-methyl 0.2525 14.0 0.0694 9.1 0.0074 0.6
Permethrin 0.0008 0.0 0.0007 0.1 0.0002 0.0
Phorate 0.0543 3.0 0.0356 4.7 0.0042 0.4
Phosmet 0.0001 0.0 0.0001 0.0
Phosphamidon 0.0002 0.0
Propargite 0.0545 3.0 0.0039 0.5 0.0010 0.1
Pyrethrins 0.0001 0.0 <0.00001 0.0
Rotenone 0.0008 0.0 <0.00001 0.0
Spiromesifen 0.0006 0.0
Sulphur 0.0198 1.1 0.0011 0.1 0.0305 2.6
Sulprofos 0.0090 0.5 0.0015 0.2
Thiodicarb 0.0540 3.0 0.0024 0.3 0.0001 0.0
Tralomethrin 0.0037 0.2 0.0005 0.1 <0.00001 0.0
Very highly toxic
Zeta-cypermethrin 0.0083 0.5 0.0025 0.3 0.0009 0.1 Total 0.86 48 0.30 39 0.20 17

141
Table A 60: USA, active ingredients used in cotton which are highly to very highly toxic to algae. The percentages are based on the total amount used in cotton in that year.
1994 2000 2006
Hazard to algae a.i. kg a.i./ha %
kg a.i./ha %
kg a.i./ha %
Dicofol 0.0614 3.4 0.0198 2.6 0.0047 0.4
Disulfoton 0.0389 2.2 0.0125 1.6 0.0001 0.0
Esfenvalerate 0.0093 0.5 0.0008 0.1 0.0006 0.1
Naled 0.0024 0.1 0.0016 0.2 0.0024 0.2
Permethrin 0.0008 0.0 0.0007 0.1 0.0002 0.0
Phosmet 0.0001 0.0 0.0001 0.0
Spinosad 0.0047 0.6 0.0007 0.1
Spiromesifen 0.0006 0.0
Very highly toxic
Sulphur 0.0198 1.1 0.0011 0.1 0.0305 2.6
Amitraz 0.0212 1.2 0.0011 0.2
Carbaryl 0.0016 0.1 0.0006 0.1 0.0020 0.2
Chloropicrin 0.0207 1.1 0.0003 0.0
Chlorpyrifos 0.0358 2.0 0.0464 6.1 0.0277 2.4
Chlorpyrifos-m 0.0011 0.1 0.0002 0.0
Diflubenzuron 0.0009 0.1 0.0003 0.0
Etridiazole 0.0067 0.4 0.0005 0.1
Indoxacarb 0.0049 0.6 0.0009 0.1
Lambda-cyhalothrin 0.0125 0.7 0.0046 0.6 0.0039 0.3
Metam-sodium 0.1445 8.0
Oxamyl 0.0208 1.2 0.0712 9.4 0.0175 1.5
Parathion 0.1023 5.7
Piperonyl butoxide 0.0013 0.1
Rotenone 0.0008 0.0 <0.00001 0.0
Highly toxic
Tebufenozide 0.0034 0.4 0.0002 0.0
Total 0.50 28 0.17 23 0.09 8 Table A 61: USA, active ingredients used in cotton which are toxic to highly toxic to bees. The percentages are based on the total amount used in cotton in that year.
1994 2000 2006
Acute hazard to bees active ingredient kg a.i./ha %
kg a.i./ha %
kg a.i./ha %
Abamectin 0.0004 0.0 0.0003 0.0 0.0002 0.0
Aldicarb 0.1320 7.3 0.2111 27.8 0.2120 18.1
Azinphos-methyl 0.0510 2.8 0.0116 1.5 0.0028 0.2
Bifenthrin 0.0020 0.1 0.0018 0.2 0.0025 0.2
Carbofuran 0.0092 0.5 0.0264 3.5 0.0001 0.0
Chlorpyrifos 0.0358 2 0.0464 6.1 0.0277 2.4
Cyfluthrin 0.0091 0.5 0.0057 0.8 0.0041 0.4
Cypermethrin 0.0140 0.8 0.0047 0.6 0.0123 1
Deltamethrin 0.0008 0.1 0.0001 0.0
Diazinon 0.0010 0.1
Dicrotophos 0.0271 1.5 0.0352 4.6 0.0989 8.4
Highly Toxic
Emamectin Benzoate 0.0004 0.1 0.00005 0.0

142
1994 2000 2006
Acute hazard to bees active ingredient kg a.i./ha %
kg a.i./ha %
kg a.i./ha %
Esfenvalerate 0.0093 0.5 0.0008 0.1 0.0006 0.1
Fenpropathrin 0.0051 0.3 0.0002 0.03
Gamma-cyhalothrin 0.00002 0.0
Imidacloprid 0.0024 0.3 0.0024 0.2
Lambda-cyhalothrin 0.0125 0.7 0.0046 0.6 0.0039 0.3
Mevinphos 0.0007 0.0
Parathion 0.1023 5.7
Permethrin 0.0008 0.0 0.0007 0.1 0.0002 0.0
Profenofos 0.0643 3.6 0.0338 4.4 0.0030 0.3
Spinosad 0.0047 0.6 0.0007 0.1
Thiamethoxam 0.00001 0.0 0.0082 0.7
Zeta-cypermethrin 0.0083 0.5 0.0025 0.3 0.0009 0.1
Carbaryl 0.0016 0.1 0.0006 0.1 0.0020 0.2
Chlorpyrifos-m 0.0011 0.1 0.0002 0.0
Dimethoate 0.0223 1.2 0.0053 0.7 0.0032 0.3
Indoxacarb 0.0049 0.6 0.0009 0.1
Lindane 0.00001 0.0
Malathion 0.0455 2.5 0.0228 3 0.0004 0.0
Methamidophos 0.0001 0.01 0.0069 0.9 0.0006 0.1
Methidathion 0.0008 0.05
Methomyl 0.0110 0.6 0.0050 0.7 0.0004 0.03
Naled 0.0024 0.1 0.0016 0.2 0.0024 0.2
Oxamyl 0.0208 1.2 0.0712 9.4 0.0175 1.5
Oxydemeton-m 0.0002 0.0
Phorate 0.0543 3 0.0356 4.7 0.0042 0.4
Phosmet 0.0001 0.0 0.0001 0.0
Phosphamidon 0.0002 0.0
Pyrethrins 0.0001 0.0 <0.00001 0.0
Rotenone 0.0008 0.1 <0.00001 0.0
Thiodicarb 0.0540 3 0.0024 0.3 0.0001 0.0
Toxic
Tralomethrin 0.0037 0.2 0.0005 0.1 <0.00001 0.0
Total 0.70 39 0.55 73 0.41 35 Table A 62: USA, active ingredients used in cotton have a high to very high potential to leach to groundwater. The percentages are based on the total amount used in cotton in that year.
1994 2000 2006 Leaching hazard to groundwater (GUS) active ingredient
kg a.i./ha %
kg a.i./ha %
kg a.i./ha %
Azadirachtin 0.0001 0.0
Methoxyfenozide 2 0.0004
Very High
Methyl-bromide 0.036 0.0
Dicrotophos 0.027 1.5 0.035 4.6 0.099 8.4
Imidacloprid 0.002 0.3 0.002 0.2
Tebufenozide 0.003 0.4 0.0002 0.0
High
Thiamethoxam 0.00001 0.0 0.008 0.7
Total 0.063 3.5 0.041 5 0.110 9

143
Environmental Toxic Load (ETL)
0
100
200
300
400
1994 2000 2006
ET
L f
or f
ish
Zeta-cypermethrin
Lambda-cyhalothrin
Esfenvalerate
Endosulfan
Cypermethrin
Cyfluthrin
Chlorpyrifos
Others
Figure A 26: USA ETL for fish.
0
500
1000
1500
2000
1994 2000 2006
ET
L f
or Daphnia
Zeta-cypermethrin
Tralomethrin
Parathion
Lambda-cyhalothrin
Cypermethrin
Cyfluthrin
Chlorpyrifos
Bifenthrin
Others
Figure A 27: USA ETL for Daphnia.

144
0
5
10
15
1994 2000 2006
ET
L f
or
alg
ae
Sulphur
Naled
Esfenvalerate
Disulfoton
Dicofol
Others
Figure A 28: USA ETL for algae.
0
5
10
15
20
25
1994 2000 2006
ET
L f
or b
ee
s
Zeta-cypermethrin
Spinosad
Parathion
Imidacloprid
Dicrotophos
Cyfluthrin
Chlorpyrifos
Carbofuran
Azinphos-methyl
Aldicarb
Others
Figure A 29: USA ETL for bees.