peru - iuj
TRANSCRIPT

COUNTRY PROFILE
PeruOur quarterly Country Report on Peru analyses currenttrends. This annual Country Profile provides backgroundpolitical and economic information.
1997-98The Economist Intelligence Unit15 Regent Street, London SW1Y 4LRUnited Kingdom

The Economist Intelligence Unit
The Economist Intelligence Unit is a specialist publisher serving companies establishing and managingoperations across national borders. For over 50 years it has been a source of information on businessdevelopments, economic and political trends, government regulations and corporate practice worldwide.
The EIU delivers its information in four ways: through subscription products ranging from newslettersto annual reference works; through specific research reports, whether for general release or for particularclients; through electronic publishing; and by organising conferences and roundtables. The firm is amember of The Economist Group.
London New York Hong KongThe Economist Intelligence Unit The Economist Intelligence Unit The Economist Intelligence Unit15 Regent Street The Economist Building 25/F, Dah Sing Financial CentreLondon 111 West 57th Street 108 Gloucester RoadSW1Y 4LR New York Wanchai United Kingdom NY 10019, US Hong KongTel: (44.171) 830 1000 Tel: (1.212) 554 0600 Tel: (852) 2802 7288Fax: (44.171) 499 9767 Fax: (1.212) 586 1181/2 Fax: (852) 2802 7638e-mail: [email protected] e-mail: [email protected] e-mail: [email protected]
Website: http://www.eiu.com
Electronic deliveryEIU ElectronicNew York: Lou Celi or Lisa Hennessey Tel: (1.212) 554 0600 Fax: (1.212) 586 0248London: Moya Veitch Tel: (44.171) 830 1007 Fax: (44.171) 830 1023
This publication is available on the following electronic and other media:
Online databases CD-ROM Microfilm
FT Profile (UK) Knight-Ridder Information World Microfilms Publications (UK)Tel: (44.171) 825 8000 Inc (US) Tel: (44.171) 266 2202
DIALOG (US) SilverPlatter (US) University Microfilms Inc (US)Tel: (1.415) 254 7000 Tel: (1.800) 521 0600
LEXIS-NEXIS (US)Tel: (1.800) 227 4908
M.A.I.D/Profound (UK)Tel: (44.171) 930 6900
Copyright© 1998 The Economist Intelligence Unit Limited. All rights reserved. Neither this publication nor any part of it may be reproduced, stored in a retrieval system, or transmitted in any form or by anymeans, electronic, mechanical, photocopying, recording or otherwise, without the prior permission of The Economist Intelligence Unit Limited.
All information in this report is verified to the best of the author’s and the publisher’s ability. However,the EIU does not accept responsibility for any loss arising from reliance on it.
Symbols for tables“n/a” means not available; “–” means not applicable
Printed and distributed by Redhouse Press Ltd, Unit 151, Dartford Trade Park, Dartford, Kent DA1 1QB, UK
ISSN 0269-5944
January 31st 1998 Contents
2 Basic data
3 Political background3 Historical background5 Constitution and institutions7 Political forces9 International relations and defence
10 The economy10 Economic structure12 Economic policy16 Economic performance18 Regional trends
19 Resources19 Population20 Education21 Health22 Natural resources and the environment
23 Economic infrastructure23 Transport and communications25 Energy provision27 Financial services28 Other services
29 Production29 Manufacturing32 Mining34 Agriculture, forestry and fishing
36 The external sector36 Merchandise trade38 Invisibles and the current account38 Capital flows and foreign debt40 Foreign reserves and the exchange rate
42 Appendices42 Regional trading associations43 Sources of information44 Reference tables
1
EIU Country Profile 1997-98 © The Economist Intelligence Unit Limited 1998

Peru
Basic data
Land area 1,285,216 sq km
Population 23.95m (1996 estimate)
Main towns Population in ’000, 1993 census
Lima 5,708 Piura 278Callao 640 Iquitos 275Arequipa 619 Chimbote 269Trujillo 509 Huancayo 258Chiclayo 412 Cuzco 256
Climate Varies considerably by region and altitude. In general temperate on the coast,tropical in jungles, cool in highlands. The western side of the highlands has adry climate, but on the eastern and northern sides there is heavy rainfallbetween October and April
Weather in Lima (altitude120 metres)
Hottest month, February, 19-28°C (average daily minimum and maximum);coldest month, August, 13-19°C; driest months, February, March, 1 mm aver-age monthly rainfall; wettest month, August, 8 mm average monthly rainfall
Language Spanish is the principal language and the lingua franca for the large numbersof Quechua and Aymara speakers. Quechua and Aymara also have officialstatus
Measures Metric system; also old Spanish measures, particularly in rural areas
Currency Nuevo sol. Average exchange rate 1997, Ns2.67:$1; exchange rate on January30th 1998, Ns2.77: $1
Time 5 hours behind GMT
Public holidays January 1st; Easter (Maundy Thursday half day and Good Friday all day); May1st (Labour Day); June 29th (Saint Peter and Saint Paul); July 28th-29th (Inde-pendence Day); August 30th (Santa Rosa de Lima); October 8th (Battle ofArigamos); November 1st (All Saints Day); December 8th (Immaculate Concep-tion); December 25th (Christmas Day)
2 Peru: Basic data
EIU Country Profile 1997-98 © The Economist Intelligence Unit Limited 1998

Political background
Historical background
Peru is the birthplace of the Inca empire, one of the most important centres ofpre-Hispanic civilisation in the Americas. From Cuzco, their base in the high,southern Peruvian Andes, the Incas dominated the other tribes of the Andes aswell as the length of the Pacific coast from what is today southern Colombia tocentral Chile. An elaborate system of roads, garrisons and colonial settlementsallowed them to keep tight control of their large empire for more than acentury. Some of the Inca heritage survives in the Peruvian Andes today, in thesystem of communally owned lands, irrigation systems and shared communitylabour. The maize and potatoes first cultivated by the Incas have spread tobecome staple crops throughout the world.
Drawn by well-founded rumours of great wealth, the first Spanish conquerorsarrived in Peru in 1532. Led by Francisco Pizarro, they overcame the forces ofthe Inca Atahualpa: the rest of the empire swiftly fell to the conquistadores. Thenew capital, Lima, was founded in 1535 and the vice-royalty of Peru wasformally established in 1544. After the final defeat of the Incas in 1572, Spanishauthority went almost unchallenged for two centuries. Towards the end of the18th century, however, the ferment of new ideas and revolution in Europefuelled a desire for independence among landowners and criollos (descendantsof European settlers). Peru declared its independence from Spain on July 28th1821 (celebrated ever since as the national Independence Day holiday). A waveof military infighting ensued, punctuated by brief periods of relative politicalstability. The latter part of the 19th century was marked by the War of thePacific (1879-83), in which both Peru and Bolivia suffered ignominious de-feat—and the loss of important areas of territory—at the hands of Chile. Mu-tual suspicion still lingers today.
Peruvian 19th- and 20th-century history has been characterised by a successionof civilian caudillos, military strongmen and dictators of various persuasions.The election of one of the century’s more democratic leaders, Fernando Be-launde Terry, briefly looked to be a turning-point but he was overthrown by acoup in 1968: the left-wing, nationalist military, led by General Juan VelascoAlvarado, were convinced they could reform Peru faster and better than thecivilians. The first phase of military rule (1968-75) resulted in land reform,increased national control of natural resources and industrial partnership. Butspending and foreign borrowing spiralled out of control, ending in a bloodlesscoup in August 1975 which put General Morales Bermúdez in as president.
Democracy returned in 1980, when Mr Belaunde was elected for a secondperiod. Despite attempts at reform and liberalisation, world recession, the for-eign debt crisis and climatic disaster marred his presidency. Mr Belaunde’sparty, the centre-right Acción Popular (AP), lost support and, in the 1985general election, the left-of-centre Alianza Popular Revolucionaria Americana(APRA) was swept to office. A 36-year-old lawyer, Alan García Pérez, becamepresident amid popular euphoria and high expectations of change.
Peru: Historical background 3
EIU Country Profile 1997-98 © The Economist Intelligence Unit Limited 1998

From the outset, Mr García was a controversial figure. Radically unorthodoxeconomic policies initially generated high GDP growth rates and a sharp in-crease in purchasing power for the poor. But his popularity was short-lived.Economic mismanagement led to hyperinflation. Violent strikes affected al-most all economic activity. In mid-1987 an ill-judged move to nationalise thebanking system provoked strong protest and rallied opposition. By the elec-tions of 1990 Mr García and the APRA were discredited at home and abroadand the country was on the verge of economic collapse.
Against this depressing backdrop emerged a political unknown. Overcomingall the odds, Alberto Fujimori, the son of modest Japanese immigrants, whohad risen to become rector of Lima’s agrarian university, defeated both theAPRA party machine and Mario Vargas Llosa, the well-known novelist whoheaded a right-wing coalition. A pragmatist without party or programme,Mr Fujimori ran under the banner of hard work, honesty and technology, amessage which struck a chord among the voters. Once elected, he continued toprefer concrete achievements to ideology, improvising policy according tocircumstance.
Important recent events
July 1990: Alberto Fujimori, agricultural engineer and former university rector, takesoffice as president.August 1990: The government announces a series of drastic stabilisation measures;subsidies and price controls are removed and prices of many staples rise by 500%overnight.February 1991: The economy minister, Carlos Boloña, announces a sweepingprogramme of structural reforms, liberalisation and deregulation.April 1992: Faced with congressional opposition to proposals to give the securityforces greater powers in the fight against terrorism, Mr Fujimori closes Congress andsuspends the judiciary.April-August 1992: The Maoist guerrilla group, Sendero Luminoso, steps upbombings in Lima, killing dozens of civilians and severely damaging economicactivity. September 1992: Sendero Luminoso’s founder-leader, Abimael Guzmán, iscaptured in a surprise counter-terrorist police operation in Lima.November 1992: A planned coup by a group of serving and retired military officersis foiled. Elections are held for a new constituent assembly and Mr Fujimori’s Cambio90/Nueva Mayoría coalition wins an overall majority.December 1992: The new constitution is put to a national referendum andnarrowly approved. In a major departure from tradition, immediate presidentialre-election is permitted.April 1995: Mr Fujimori is re-elected outright, obtaining 64% of the valid votes inthe first round.April 1996: Mr Fujimori dismisses half of the 14-member cabinet, replacing themwith technocrats and entrepreneurs.December 1996-April 1997: Guerrillas hold hostages in the Japaneseambassador’s residence in Lima.February 1998: The Supreme Court upholds a 1996 law which interpreted theconstitution to allow Mr Fujimori to stand for president again in 2000.
4 Peru: Historical background
EIU Country Profile 1997-98 © The Economist Intelligence Unit Limited 1998

His rule has been characterised by a hybrid of democratic and autocratic ele-ments with a broad respect for press freedom. Under Mr Fujimori’s leadership,the traditional party system has given way to independent politicians. Mr Fuji-mori, who has shown no inclination to turn his own political movement into agenuine party, has been able to exploit the discredit into which the older partieshad fallen to enhance the authority of the executive branch.
Mr Fujimori’s style of governing owes something to the traditional LatinAmerican caudillo figure. His popular touch, which included frequent travel tothe remotest regions to supervise road repairs and school construction or tohand out advice to peasant farmers, gave him consistently high popularityratings, of more than 70%, until 1996. His 1992 self-coup (autogolpe), when heclosed down Congress and suspended the judiciary, was approved by the vastmajority of the population. A new constitution was enacted in 1993, andsubsequent laws have reduced the power of the legislature and reinforcedcentralism. In April 1995 Mr Fujimori was overwhelmingly re-elected as pres-ident for a second term. In the new, single-chamber Congress the governmentalliance, Cambio 90/Nueva Mayoría, holds 69 of the 120 seats.
An economic recession in 1996 severely damaged Mr Fujimori’s popularity,and since then disputes over the constitution have prompted harsh criticismfrom the news media. Although he is still credited with controlling inflationand combating terrorism, there has been growing dissatisfaction with per-ceived abuses of power by Mr Fujimori’s government.
Constitution and institutions
Peru’s current constitution, promulgated in 1993, is the fifth this century. Likemost of its predecessors, it is a pragmatic creation designed to bring the formallegal framework into line with the “new realities”. This time, the constitutionalinitiative responded to pressure from the international community, notablythe Organisation of American States (OAS), for a return to democratic rulefollowing Mr Fujimori’s April 1992 autogolpe.
The constitution was drafted by the 80-member constituent assembly,Congreso Constituyente Democrático (CCD, or Congress), elected in November1992. The main opposition parties boycotted that election, with the result thatMr Fujimori’s makeshift Cambio 90/Nueva Mayoría coalition obtained anoverall majority in the CCD. Several controversial changes, often promoted bythe president’s inner circle of advisers, were given unobstructed passagethrough the committees and plenary sessions. When put to the people forratification in what became seen as a plebiscite, the new constitution wasapproved by the tiniest of margins.
The 1993 constitution replaced the 1979 version which was seen as too statistfor Peru’s newly liberalised economy. The updated version enshrines free-market economic principles and reduces the role of the state. It also eliminatesmany congressional checks on the president, thereby enhancing the alreadysubstantial powers of the executive, and permits a president to stand for twoconsecutive terms. In theory the independence of the judiciary is strengthened
Peru: Constitution and institutions 5
EIU Country Profile 1997-98 © The Economist Intelligence Unit Limited 1998

by the new constitution. However, in practice the government often interfereswith the judiciary when rulings are not to its liking.
Congress now consists of 120 members, elected on a national basis every fiveyears through a system of lists prepared by the parties. Voters can overturn theparties’ choices of candidates by casting a preferential vote. However, thisoption is highly complex and well beyond the capabilities of less educatedvoters. The proliferation of small parties and supposedly independent move-ments has made recent ballot papers long and complicated: this tends to favourthe few better-known political movements.
Distribution of seats in Congress, Jan 1998
Cambio 90/Nueva Mayoría 69
Unión Por el Perú 12
Partido Aprista Peruano 8
Acción Popular-Code 7
Frente Independiente Moralizador 6
Movimiento Renovación 6
Others 12
Total 120Source: Local sources.
Internal war and economic chaos in the latter half of the 1980s weakened civilsociety and its institutions. This was especially true of political parties, thejudiciary, labour unions and peasant organisations. Congress is under the firmcontrol of the government: 52% of the valid votes cast in April 1995 gave 67 ofthe 120 seats to the government alliance, which comprises two movements ofso-called independents, Cambio 90, Mr Fujimori’s original movement, andNueva Mayoría, created to run in the November 1992 constituent assemblyelection. The opposition is led by Unión Por el Perú (UPP), a self-styled inde-pendent movement created to promote the 1995 presidential candidacy of theformer UN secretary-general, Javier Pérez de Cuéllar. UPP won 17 seats in theApril election. The remainder are divided among smaller, disparate groups,which include the once dominant traditional parties like APRA, Acción Popu-lar, Partido Popular Cristiano and others. Since the election, a number ofdefections has altered the distribution of congressional seats, but the govern-ments majority remains safe.
Ministries Formally, the Peruvian cabinet comprises 12 ministries under a premier who isknown as the president of the Council of Ministers. The economy minister istraditionally the most important, because he controls the purse- strings of allthe other ministries. There are few figures of weight in Mr Fujimori’s cabinet,however: his centralised style of government means that major decisions aremade in a small, closed circle of advisers and family members. Althoughcabinet meetings were rarely held, they have become more frequent sinceAlberto Pandolfi became prime minister in April 1996. Mr Fujimori channelsspending on social programmes and infrastructure through the presidencyministry, which is now second only to the economy and finance ministry inresources managed.
6 Peru: Constitution and institutions
EIU Country Profile 1997-98 © The Economist Intelligence Unit Limited 1998

Key political figures
Jorge Camet: He replaced the prominent Carlos Boloña as economy and financeminister in early 1993. Mr Camet has close links with the business community andhas presided over Peru’s private business lobby, Confiep. Under his stewardship,Peru in 1996 obtained a 20-year debt restructuring accord with the Paris Club and aBrady agreement with Peru’s commercial creditors. Carlos Torres y Torres Lara: A former labour minister and prime minister,Mr Torres y Torres Lara is one of Mr Fujimori’s oldest allies. He is vice-president ofCongress and helped draft the 1993 constitution. A lawyer, he is an adept defenderof controversial government actions and has often taken on the role of the unofficialspokesman of the governing alliance. He assumed a high profile in 1996 indefending Congress’s decision to pass a law opening the way for the president tostand for a third term.Martha Chávez: One of Mr Fujimori’s most vociferous and uncritical supporters,she obtained the highest number of preferential votes in the 1995 election andbecame the first woman to preside over Congress. Since then she has maintained ahigh profile as head of several legislative commissions, including one investigatingphone-tapping against opposition politicians and journalists.Vladimiro Montesinos: A lawyer and former army captain who was accused ofspying, Mr Montesinos is a shadowy but extremely influential, and feared, figure. Heis the effective, although not the titular, head of the Servicio de Inteligencia Nacional(SIN, the national intelligence service). He acts as liaison between Mr Fujimori andthe armed forces and is said to be the determining voice in senior militaryappointments. He has been credited by Mr Fujimori with much of the planning ofthe successful April 1997 raid on the Japanese ambassador’s residence (seeSubversion). Alberto Andrade: A lawyer and successful businessman, he has emerged asMr Fujimori’s main rival for the presidency in 2000. A liberal in economic matters, hewas associated for many years with the Partido Popular Cristiano (PPC). As aneffective mayor of Miraflores, he received 93.5% of the votes when he was re-electedin 1993. He then went on to be elected mayor of Lima. In 1995 he launched anindependent political movement, Somos Lima (We are Lima). In mid-1997 heannounced plans to establish a national party, Somos Perú. Although he hasdeclared his candidacy for a second term as the mayor of Lima in 1998, he has notruled out standing for the presidency in 2000.
Political forces
The political landscape of Peru in the mid-1990s is in stark contrast to thepicture a decade earlier. The election of Mr Fujimori, an outsider with no linksto the traditional political classes, transformed the country’s power structure.Subsequent elections have confirmed the decline in the influence of the trad-itional parties and the emergence of new actors on the political scene.
The armed forces In the absence of an organised party, Mr Fujimori’s only genuine power base isthe armed forces. From the earliest days of his first government, Mr Fujimorisought a close alliance with the military, primarily with its key branch, the
Peru: Political forces 7
EIU Country Profile 1997-98 © The Economist Intelligence Unit Limited 1998

army. By constitutional mandate, the president is commander-in-chief ofthe armed forces. Mr Fujimori used this position to hand-pick officers for keypositions, ending the traditional system of promotion by seniority. On six con-secutive occasions General Nicolás de Bari Hermoza has been reappointed aspresident of the joint chiefs-of-staff and the army’s strongman. In late 1997,however, Mr Fujimori suggested that Mr Hermosa’s position was under review.The influence of the army over civil society has steadily increased: in the exten-sive regions of the country which remain under emergency rule, army com-manders are simultaneously the highest political authorities and have control ofthe local police forces. In addition, the army has decisive influence in develop-ment projects in urban shanty towns and impoverished rural communities: itbuilds roads and irrigation systems, lends agricultural machinery to peasantfarmers and distributes food and medicines on behalf of other state agencies.
Subversion
1980: A Maoist guerrilla group, Sendero Luminoso (Shining Path), emerged. Basedin the impoverished Andean department of Ayacucho, Sendero Luminoso used acombination of terror tactics and political ideology to dominate many peasantcommunities in remote areas where there was little state presence. It spread in themid-1980s to the central Andes and the Huallaga valley, heartland of the illegal cocatrade.1984: A second guerrilla group, Movimiento Revolucionario Tupac Amaru (MRTA),started operating. Pro-Cuban, it was more in the traditional mould of Latin Americanguerrilla movements, using kidnap and ransom demands to try to achieve its aims.1984: The army took over full responsibility for counter-insurgency operations.Many areas of the country were put under state of emergency laws, with consequentrestrictions of civil liberties. Widespread violations of human rights ensued.April 1992: Following Mr Fujimori’s shutdown of Congress, Sendero Luminosoextended its armed struggle to the capital. Bombings became increasingly frequent.By this time, over 25,000 Peruvians had died in guerrilla-related violence andmaterial damage had cost an estimated $22bn, almost as much as the country’sentire foreign debt.June 1992: MRTA’s leader, Victor Polay, was captured in Lima; the subsequentdisintegration of his movement was rapid.September 1992: A combination of painstaking police work and an element ofluck led to the capture of Sendero’s ideological leader, Abimael Guzmán.Mr Guzmán’s capture and subsequent renouncing of the armed struggle were aturning-point. Arrests of other high-ranking members followed. A “repentance law”encouraged guerrillas to give themselves up in return for lenient treatment: theinformation they provided to military authorities led to yet more arrests.December 1996: Fourteen MRTA guerrillas, led by Nestor Cerpa Cartolini,assaulted the residence of the Japanese ambassador in Lima. They initially took morethan 600 hostages, including high-level government officials, foreign diplomats,businessmen and other influential personalities, but released all but 72. April 1997: After peace talks flagged, Mr Fujimori ordered some 150 commandosto storm the residence, in a well-planned operation. Seventy-one hostages werefreed. One hostage, two commandos and all 14 guerrillas were killed in the raid.
8 Peru: Political forces
EIU Country Profile 1997-98 © The Economist Intelligence Unit Limited 1998

The highest-ranking military officers share a common set of values with thepresident and agree with his view of the political system. (Dissident officershave, over the years, been “invited” to retire early.) In essence, the president seesthe need for a strong hand to tame the corrupt and inefficient political parties.Unlike its counterparts in much of Latin America, the Peruvian army sees itselfmore as a pressure group than a political participant. Low salary levels remain asource of dissatisfaction and some army officers resent Mr Fujimori’s interven-tion in military appointments. Nevertheless, malcontents are in a minority andthe prospects of a successful military coup are slight.
The Catholic Church The Catholic Church, which has sporadically criticised Mr Fujimori’s tougheconomic policies, retains the allegiance and affection of the majority of Peruvians.Its practical influence, however, is slight. In addition, in many parts of Peru’shinterland, the traditional influence of the Catholic Church is being under-mined by a host of evangelical movements. During 1995 Mr Fujimori came intodirect confrontation with senior churchmen about family planning: opinionpolls showed that Peruvians overwhelmingly sided with the president and hiscommitment to make free contraception (including sterilisations) available toall Peruvians. The Church has been forced to beat a strategic retreat.
Unions Labour unions, which were inordinately powerful a decade ago, are todayweakened, perhaps irrevocably. In the new political and economic climate theunions are often seen as irrelevant or are associated with the economic collapseof the late 1980s. The number of strikes has decreased sharply. Union leadershave proved incapable of capitalising on the thousands of jobs lost throughprivatisations to arouse popular sympathy. The mass demonstrations that wereonce a feature of street life in central Lima are now only occasionally seen.
International relations and defence
Mr Fujimori’s foreign policy is trade-driven and pragmatic. He has used hisown contacts and Peru’s geographical position to build links with the countriesof the Pacific Basin. At the same time, he has moved to strengthen bilateraltrade links with neighbouring countries. He has made goodwill visits to allPeru’s neighbours during his presidency. Relations with Bolivia have gone fromstrength to strength since the 1992 Ilo Agreement which grants land-lockedBolivia access to the Pacific Ocean for the first time since the War of the Pacific(1879-83). (Peru and Bolivia both lost land to Chile in the war.) In return, Peruhas access to the Atlantic via Bolivia’s river port, Puerto Suárez. Relations withChile remain cool more than a century after the war. Several matters are stillpending from a peace treaty signed in 1929. An agreement, known as the LimaConvention, was reached by the two governments in 1993 but was not ratifiedby the Peruvian Congress. In January 1996 the Peruvian government submittednew proposals to Chile, omitting mention of the Lima Convention. Progresstowards a final solution will remain slow.
Peru: International relations and defence 9
EIU Country Profile 1997-98 © The Economist Intelligence Unit Limited 1998

The relationship with Ecuador is Peru’s greatest problem. In late January 1995 anot uncommon skirmish between border patrols escalated into serious hostili-ties along a stretch of uninhabited, undemarcated jungle border. After a monthof fighting which left several dozen dead on each side, peace negotiations beganunder the auspices of Argentina, Brazil, Chile and the US. These were the fourguarantor countries of the Rio Protocol, a 1942 peace treaty signed by Peru andEcuador after an outbreak of hostilities in 1941. The establishment of a demili-tarised zone was a first step towards resolution of this long-standing conflict, inwhich nationalistic passions are readily aroused. In October 1996, Ecuador andPeru signed the Acuerdo de Santiago (Santiago Accord) under which they agreedto hold negotiations on the so-called “existing impasses” between the two na-tions within the framework of the Rio Protocol. The most contentious issues areEcuador’s refusal to accept the territorial division established by the Rio Protocoland its demand for a sovereign outlet to the Amazon. In November 1997 the twosides signed a four-point accord to discuss Ecuador’s non-sovereign navigationof the Amazon as well as border demarcation.
Because of a reduction in violations of human rights and the re-establishmentof democracy, relations with the US have improved. However, cultivation ofthe coca leaf and its processing into cocaine is a source of periodic tension.Every year, in a process called certification, the US government assesses theefforts made by drug-producing countries to combat the drug trade. In 1995the US was critical of Peru, only grudgingly renewing its certification for USassistance, and only in the interests of national security. In 1996 and 1997,however, the US State Department granted certification with more enthusiasm,congratulating Peru on its full co-operation over efforts to eradicate the drugstrade. However, there are still some deep-rooted suspicions about drugs-relatedcorruption inside the military.
The economy
Economic structure
Peru has a dual economy. There is a relatively modern sector on the coastalplains and a subsistence sector in the mountains of the interior, which is cut offby poor transport and communications. Economic power has traditionallybeen in the hands of an elite of European descent. Services account for 45% ofGDP, industry (including mining) for about 33% and agriculture for 13% (seeReference table 7). Mining is important for the balance of payments, providingalmost half of Peru’s export earnings. Industry is fairly diversified, with food,fishmeal, metals, steel, textiles and petroleum refining the largest sectors.Agriculture provides employment to over 30% of the workforce. The 1993census gave a labour force of 12.9m and an economically active population of7.1m, of whom 5m were men.
10 Peru: Economic structure
EIU Country Profile 1997-98 © The Economist Intelligence Unit Limited 1998

Main economic indicators
1996
Nominal GDP (Ns m) 149,481
GDP growth (%) 2.6
Consumer price inflation (av; %) 11.5
Exports fob ($ m) 5,897
Imports fob ($ m) 7,897
Current-account balance ($ m) –3,607
Exchange rate (av; Ns:$) 2.45
International reserves ($ m) 10,776.1Source: Banco Central de Reserva, Nota Semanal.
Peru is still largely a land of impoverished peasant farmers and underemployedshanty-town dwellers. According to the 1993 census, of the 7.1m economicallyactive population aged 14 and over, 20% were unskilled and 19% skilled agri-cultural workers. Of the total workforce, 10% described themselves as profes-sionals, 5% as technicians and 6% as office managers and workers. Only 13%of the non-agricultural workforce was qualified. Urban underemployment isnow classified as “visible” (those who work less than 35 hours but are willingto work more) and “invisible” (those who work more than 35 hours but earnless than needed to acquire the minimum consumer basket). In 1996 the ratesof underemployment were 17.9% and 24.7%, according to the two measuresrespectively. Income distribution is extremely unequal: the poorest 20% re-ceive under 5% of national income.
Unemployment and underemployment in Metropolitan Lima(%)
1995 1996
Unemploymenta 8.4 7.9 Male 6.7 7.2 Female 11.7 9.1
Underemployment 42.2 42.6 Visible 15.6 17.9 Invisible 26.8 24.7
a As % of labour force aged 14 years and above.
Source: Banco Central de Reserva, Memoria 1996.
According to official statistics, the service sector employs 50% of the eco-nomically active population in Lima. This conceals a harsh reality: the major-ity included in this figure eke out a precarious existence, selling low-valueobjects in the informal economy. The adjustment programme applied since1990 has sharply reduced formal employment. Drastic reductions in the statebureaucracy and rationalisation of state-owned companies as they were priva-tised has meant the loss of hundreds of thousands of jobs. In 1997 someimprovement was reported, with a 2.6% increase in employment in companieswith more than 100 workers.
Since colonial times and throughout the 19th and 20th centuries, Peru’s wealthhas been highly dependent on the extraction of natural resources. Mining hastraditionally been the backbone of export earnings. Despite a fall in the
Peru: Economic structure 11
EIU Country Profile 1997-98 © The Economist Intelligence Unit Limited 1998

percentage of total exports represented by minerals in the 1990s, mining stillaccounted in 1996 for 45% of total export earnings (see Reference table 18). Thisfigure is likely to rise in the late 1990s as new investments come on stream. In1994 Peru became the world’s second fishing nation after China, with a totalcatch of 11.6m tonnes. Fishing (largely for processing into fishmeal) earned$1,121m in export revenue in 1996, 19% of the total. In years like 1995 wheninternational mineral and commodity prices are high, around three-quarters ofPeruvian foreign-exchange earnings come from exports of minerals, fishmeal,oil and traditional semi-processed agricultural products such as cotton, coffee orsugar. This dependence upon exports of primary products leaves the economyvulnerable to shocks from volatile commodity prices.
Comparative economic indicators, 1996
Peru Bolivia Brazil Chile Paraguay
GDP ($ bn) 40.8 7.7 748.6 71.9 9.5
GDP per head ($) 2,539 1,015 4,745 4,988 1,925
Consumer price inflation (%) 11.5 12.4 16.5 7.4 9.8
Current-account balance ($ bn) –3.6 –403 –24.3 –2.8 –0.7 % of GDP –5.9 –5.2 –3.3 –3.9 –7.4
Exports of goods ($ bn) 5.9 1.1 47.7 15.5 2.7
Imports of goods ($ bn) 7.9 1.4 53.3 16.5 4.1
Trade balance fob (% of GDP) –3.3 –4.0 –0.7 –1.4 –14.7
External debt ($ bn) 31.0 5.3 172.4 27.3 2.2
Debt-service ratio, paid (%) 20.9 25.3 56.2 25.6 6.1Source: EIU.
Economic policy
After various economic experiments from the mid-20th century—the laisser-faire approach of the 1950s switching to import substitution and increasedgovernment spending in the 1960s—the economy turned inward during thenationalistic left-wing military government of General Juan Velasco Alvarado(1968-75). During this period the government nationalised most large foreigncorporations, creating huge state companies. Radical agrarian reform eliminatedthe large haciendas (estates) and replaced them with agricultural co-operatives,most of which have now disappeared.
The decade of democracy which followed the long period of military rule failedto bring prosperity to the bulk of the population. Indeed, by 1990 the eco-nomic policies of two consecutive democratically elected governments seemedto have brought the country to its knees. The hesitant liberalisation of theBelaunde regime (1980-85) collapsed with the advent of the debt crisis as Perudeclared a moratorium on servicing its foreign debt. GDP fell, inflation acceler-ated and the government retreated into protectionism. In 1985 the incomingpresident, Alan García, devalued the currency, raised wages and subsidisedfoodstuffs, restricted debt servicing, and banned many imports in an attemptto provoke demand-led growth. A boom in 1986-87 proved short-lived. Theeconomy contracted sharply in 1988-90, and by the time Alberto Fujimori tookpower in 1990, inflation was running at around 40% per month.
12 Peru: Economic policy
EIU Country Profile 1997-98 © The Economist Intelligence Unit Limited 1998

Mr Fujimori’s election in 1990 marked an immediate and radical change inpolicy direction. Although he had campaigned on the pledge of adjustmentwithout shock measures, it was clear that drastic measures were necessary totackle hyperinflation. On taking power, he eliminated price controls and statesubsidies. The immediate effect was for prices to spiral further. But a fewmonths later the drastic stabilisation policies began to show results and infla-tion subsided (see Reference table 18). A sweeping programme of economicliberalisation and structural reform was launched in February 1991 under adynamic economy minister, Carlos Boloña.
Key economic policy changes since 1990
● Trade liberalisation. Import duties were slashed and a simplified two-tier systemintroduced. Over 90% of all imports now pay 12% duty; the remainder pay 20%.● Unification and liberalisation of the exchange rate and abolition of all restrictionson capital flows. ● Thorough overhaul of the fiscal accounts. Expenditure was reduced through theabolition of subsidies, followed by privatisation of state-owned companies. The taxauthority, Sunat, was reorganised and tax collections were raised from less than 5%of GDP in 1990 to around 14% in 1996.● From 1993 the Banco Central de Reserva (the Central Bank) began to operate aninformal currency board under which sols in circulation have to be fully backed byforeign reserves. ● Gradual restoration of relations with the international financial communityfollowing a monitoring agreement and the granting of an extended fund facility bythe IMF in 1993.● Reform of the financial system, with new laws encouraging the development ofthe commercial banking sector and abolishing the state-owned, subsidiseddevelopment banks for agriculture, mining and other sectors.● Creation of a system of private pension funds, with voluntary affiliation.● Reform of the labour market, including greater freedom to hire and fire.● Legislation providing equal treatment and guarantees to foreign investors.
Fiscal policy Since 1990 the fiscal accounts have been transformed by the radical restructur-ing of the public sector (see Reference tables 1 and 2 for data on budget andpublic-sector finances). Spending on salaries has fallen sharply in real terms asthe state sector has been cut, while proceeds from privatisation and greater taxcompliance have increased revenue. In 1994 the public sector showed a finan-cial surplus (including interest payments) equivalent to 2.1% of GDP, com-pared with a deficit of 7.5% of GDP in 1990. Fiscal discipline was relaxed as thegovernment increased public spending sharply in the run-up to the generalelection of April 1995. The government trimmed spending after the election.Even so, the public-sector accounts (including interest payments) showed adeficit of 1.2% of GDP in 1995, compared with a surplus of 2% of GDP for1994. Spending cutbacks were necessary not only to ensure continued fiscalsoundness, but also to cool an overheating economy. In 1996 both current andcapital spending fell in real terms, restoring a surplus of 2.4% of GDP.
Mr Fujimori committed himself in his second term to increasing spending onsocial programmes to alleviate poverty. His scope for doing this depends upon
Peru: Economic policy 13
EIU Country Profile 1997-98 © The Economist Intelligence Unit Limited 1998

further gains in tax collection. Privatisation receipts, an important source offunding for social spending, will diminish. In addition, from 1997 onwards thegovernment’s foreign debt-service payments to commercial creditors (followingthe implementation of the Brady-style debt restructuring in mid-1996) and tobilateral Paris Club creditors has increased sharply.
Central government operationsa
(% of GDP)
Jan-Sep1995 1996 1997
Current-budget balance 0.4 1.5 3.0 Income 13.6 14.2 14.2 Expenditure 13.2 12.7 11.2 Interest 3.0 2.2 1.5 Other 10.2 10.5 9.7
Capital-budget balance –2.0 0.7 –2.2 Income 1.6 3.9 0.5 Expenditure 3.6 3.2 2.7
Overall balance –1.6 1.8 0.8
a Preliminary.
Source: Banco Central de Reserva, Nota Semanal.
Non-financial public-sector operations(% of GDP)
Jan-Sep1995 1996 1997
Current-budget balance excl interest 5.3 5.8 7.0 Interest 3.2 2.3 1.6
Current-budget balance 2.1 3.4 5.4
Capital-budget balance –3.4 –1.1 –3.6 Income 1.6 3.7 0.5 Expenditure 5.0 4.8 4.1
Overall balance –1.3 2.4 1.8Source: Banco Central de Reserva, Nota Semanal.
Tax reform The tax authority, Sunat, has been completely overhauled and is now an effi-cient and independent institution. From the dismal levels of revenue in 1989,when tax collected fell to below the equivalent of 7% of GDP, better systemsand a programme combining taxpayer education, penalties for evaders andpayment of arrears by instalments for industrial companies have boosted taxrevenue to about 12% of GDP in 1996, up from 11.5% in 1995. Sunat aims inthe medium term to raise tax revenue to between 20% and 22% of GDP.
Monetary policy In 1993 following a monitoring agreement with the IMF, the government intro-duced an informal currency board system whereby domestic currency has to befully backed by foreign reserves. High capital inflows caused foreign reserves torise sharply in 1993-94 (see Reference table 27). The Banco Central de Reserva(the Central Bank) allowed the accumulation of foreign reserves to expand themonetary base, with little recourse to sterilisation. It judged—correctly—thatthe expansion in the monetary base and other monetary aggregates was war-ranted by economic growth and remonetisation of the economy following the
14 Peru: Economic policy
EIU Country Profile 1997-98 © The Economist Intelligence Unit Limited 1998

hyperinflation of the late 1980s and early 1990s. As a result, rapid monetarygrowth did not fuel inflationary pressures. In 1995-96 the Central Bank tight-ened monetary policy to cool aggregate demand. (For data on money supply seeReference table 3.)
Foreign investment A cornerstone of Mr Fujimori’s economic policy has been that, in the absenceof adequate levels of internal savings, growth must be led by foreign invest-ment. To that end, the government has passed a series of laws encouragingprivate investment and imposing specific codes for the various productivesectors. Even the ownership of land, a politically sensitive issue, has beenliberalised and opened up to private investment, with foreigners as free toinvest as Peruvian nationals. Investment guarantees have been signed with anumber of international agencies.
Privatisation The principal stimulus to foreign investment has been the privatisation pro-gramme. After a hesitant start in 1991 and delays in the wake of the April 1992autogolpe, the disposal of state-owned companies got under way in earnest inlate 1992 with the sale of the iron producer, Hierroperú, and, at the start of1993, the national airline, Aeroperú. Since then, the process has been uninter-rupted and largely successful. The government’s sale in 1994 of stakes in thetwo telecommunications companies, Entel and Compañía Peruana deTeléfonos (CPT), attracted $1.3bn in cash and $700m in investment commit-ments from the Spanish telecommunications company, Telefónica. The privat-isation commission, Comisión de Privatización (Copri), is recognised to haveacted with efficiency and transparency.
At the end of 1997 almost all sales had been completed in telecommunications,banking, tourism and light industry, and about four-fifths in mining and met-als, basic industry, transport and cement. The major outstanding sales were theremaining units of Centromín, the huge state mining and refining company,two Petroperú refineries and the electricity generating units of Electoperú.Plans for the privatisation of Lima’s water utility, Sedapal, have been aban-doned, and the state has promised to invest $2.5bn by 2000.
In most privatisations, company workers are given the opportunity to buy upto 10% of the shares, in many cases in exchange for their rights to severancepay. The state retains a percentage in several important companies, notably thetelecommunications company now operated by Telefónica and in certain elec-tricity generators and distributors. Some 400,000 investors have acquiredshares through the so-called citizens’ participation programme since it beganin 1994, bringing a wider and more diversified pattern of share ownership.
Private pension funds Parallel to the privatisation programme and following the example ofneighbouring Chile, Peru has created a system of private pension funds (admin-istradoras de fondos de pensiones, AFPs). The purpose was twofold: to reorganisethe chaotic state social security system; and to offer a decent retirement pen-sion to members of the funds, while simultaneously encouraging domesticsavings and the creation of a local capital market.
Peru: Economic policy 15
EIU Country Profile 1997-98 © The Economist Intelligence Unit Limited 1998

Economic performance
Since liberalisation commenced in 1991, the Peruvian economy has been in aperiod of profound transition. Capital inflows have fuelled a strong economicrecovery (see Reference tables 5 and 6). However, the rapid economic growth of1993-95 is in large part attributable to a low base following the dramaticdecline of the late 1980s: GDP slumped by 22% between 1988 and 1992. GDPper head in 1996 was still only 4% above its 1987 level in real terms.
Gross domestic product(% real change, year on year)
Average 1992-95 1996a Jan-Sep 1997
Private consumption 5.8 1.4 4.0
Government consumption 7.0 1.6 –0.6
Gross fixed investment 15.3 –3.2 13.4
Exports of goods & services 6.9 11.4 16.3
Imports of goods & services 16.9 0.6 12.2
GDP 6.3 15.0 7.6
a These figures, from Nota Semanal January 23rd 1998, differ from the preliminary figures in theBanco Central de Reserva annual publication, Memoria 1996, given in Reference table 7. TheMemoria 1996 was published in mid-1997.
Source: Banco Central de Reserva, Nota Semanal.
The economic recovery was investment-led. A surge in private and publicinvestment raised the investment to GDP ratio from 21% in 1990 to 28% in1994. In 1994 growing confidence in the economy and a strong sol stimulateda consumer boom. Despite high interest rates, purchases of consumer durableson instalment plans boomed. Many of these consumer goods are imported.High import tariffs starved consumers of imported goods and luxuries for dec-ades. Once import tariffs were lifted, pent-up demand overflowed, contributingto the deterioration in the trade balance.
The benefits of opening up the economy have so far been confined to themiddle and upper classes, a small sector of the population. They have notreached either the hinterland or the shanty towns around the major citieswhere the bulk of the population live. Growth, while impressive, is unbal-anced. Peru has always been a country of extreme inequalities in terms ofincome distribution. The recent reforms have aggravated this structural imbal-ance.
Control of inflation was widely cited by voters as the principal reason for theircontinuing support for and re-election of Mr Fujimori in 1995. Nominal wagesoutstripped inflation in 1991, but the effect of hyperinflation and recessionkept real wages and salaries depressed in the first years of Mr Fujimori’s govern-ment. As growth has recovered, and inflation has remained low, real wagegrowth has been erratic. Central Bank figures show that after a strong increasein 1994, real wages had slipped back to their 1992 level by 1996. In 1993, theminimum wage level fell to under 60% of its August 1990 level. It recoveredslightly, to 82% of the 1990 level, by 1996, and then received a strong boost in1997, when it was adjusted upwards by 75% in real terms, restoring it to 40%above the 1990 level. (For prices and earnings, see Reference table 8.)
16 Peru: Economic performance
EIU Country Profile 1997-98 © The Economist Intelligence Unit Limited 1998

Price stabilisation and the dismantling of the two guerrilla groups, SenderoLuminoso (Shining Path) and Movimiento Revolucionario Tupac Amaru(MRTA), paved the way for strong GDP growth in 1993-95. The economy grewby 6.4% in 1993 and by 13.1% in 1994, easily the highest rate in the region.The economy did well again in 1995, growing by 7.2%. However, concernabout the widening current-account deficit caused the government to tighteneconomic policy in 1995 and growth fell to 2.6% in 1996, before recovering toaround 7% in 1997.
Agriculture Agricultural output contracted sharply in 1990-92. Guerrilla activity forcedfarmers off the land; liberalisation increased competition from imports; andcredit dried up following the closure of the state-owned bank, Banco Agrario.In addition to this, freak weather in 1992 decimated crops in the highlands andthe coastal plain. Output has recovered since then. Overall agricultural growthhas averaged 9% between 1993 and 1996. Output of export-oriented crops,such as cotton, sugar cane and asparagus, has been boosted as new investmentprojects have come on stream. Staple foods, such as potatoes, yucca and plan-tains, have also shown strong growth over the period (see Reference table 15).Harvests in 1997 were affected in the second half of the year by the El Niñoclimatic phenomenon. Crop production for the year to November 1997 wasonly 3.1% above the level for the same period in 1996.
Gross domestic product by sector(% real change, year on year)a
Average 1992-96 1996 Jan-Nov 1997
Agriculture & livestock 5.2 5.8 4.2
Fisheries 5.6 5.1 1.3
Mining 3.2 2.8 5.5
Manufacturing 5.1 2.7 7.5
Construction 13.2 –4.6 21.9
Services 4.6 3.6 6.5
GDP 5.5 7.2 7.6
a Preliminary.
Source: Banco Central de Reserva, Nota Semanal.
Construction Exceptionally high growth in construction in 1993-94 was a direct result ofhigh public spending on the rehabilitation of physical infrastructure, primarilyasphalting and rebuilding roads and bridges neglected for the previous decade.Construction activity grew by 34.5% in 1994 and by another 17.5% in 1995.Growth came to an end in 1996, as activity declined by 4.6% due to the sharpreduction of spending on infrastructure. However, the industry bounced backin 1997, stimulated by a surge in private sector investment. Construction out-put in January-November 1997, was 21.9% above its level in the same period of1996. (For construction data, see Reference table 17.)
Fishing Substantial investment in new plant has helped to increase the capacity of thefisheries sector by 50% in the 1990s. However, climatic variations have a strongimpact on annual catches. After growing by 21% in 1993 and 28.9% in 1994,the sector contracted by 19.1% in 1995 as a result of a fishing ban to replenish
Peru: Economic performance 17
EIU Country Profile 1997-98 © The Economist Intelligence Unit Limited 1998

stocks and less favourable maritime conditions. After the modest recovery of5.1% registered in 1996, the El Niño currents affected the catch in 1997, so thatin January-November production was only 1.3% higher than the same periodin 1996. El Niño’s effects are expected to continue into 1998. (For fishingproduction data, see Reference table 16.)
Mining The mining sector, which accounted for 11% of GDP and around 40% of exportearnings in 1994, grew by an annual average of around 5% in 1993-96. Gold hasbeen the fastest-growing subsector, owing to the success of the Yanacocha mineoperated by Newmont of the US. Iron output expanded strongly in 1993 and1994 after Hierroperú was sold to Shougang of China, but contracted in 1995, asa result of a prolonged strike and marketing problems experienced by ShougangHierro. Production of copper, the largest export earner, contracted in 1994 butrose by 11.3% in 1995 and a further 20% in 1996 as a result of heavy investment.Investment will drive strong increases in output of most minerals towards theyear 2000. (For minerals production data see Reference table 14.)
Manufacturing The manufacturing sector contracted sharply during the economic collapse of1989-90. Following a slight upturn in 1991 manufacturing output stagnated in1992-93, hit by depressed domestic demand and cheaper imports as tariff pro-tection was lifted. A recovery in consumer spending and a 40% rise in fishmealvolumes drove a 17% expansion in overall manufacturing output in 1994.However, production remains depressed. After moderate growth in 1995 and1996 (by 4.2% and 2.7% respectively), production is reported to have risen by7.5% in the first 11 months of 1997. But still, in November 1997, the manufac-turing sector was estimated to be operating at just 70% of installed capacity.Although this figure probably overestimates the current capacity of the manu-facturing sector, it shows that the sector has not recovered its former level ofactivity. (For manufacturing production data see Reference table 13.)
Regional trends
Regional imbalances in Peru are both historic and profound. The greater thedistance from the capital, Lima, and from a handful of other developed urbancentres, the more the economic and social indicators deteriorate. An attemptby the government of Alan García (1985-90) to devolve power to a dozenartificially created regions was swiftly halted by the incoming Fujimori admin-istration. Mr Fujimori’s style of government is to concentrate political power invery few hands.
Nevertheless, the new government has created a number of instruments whichassist in promoting economic development in the long-neglected provinces.The Fondo Nacional de Compensación y Desarrollo Social (Foncodes), set up in1991, is a channel for financing small infrastructure projects such as drinkingwater and sewerage systems and repairs to local roads and bridges. As well asimproving living standards, it provides temporary employment and remunera-tion in cash and kind for some of Peru’s poorest. The fund is used for politicalpurposes, serving as a permanent reminder to inhabitants of remote rural areasthat the presidency is working for them.
18 Peru: Regional trends
EIU Country Profile 1997-98 © The Economist Intelligence Unit Limited 1998

Another specially created state agency, Instituto Nacional de InfraestructuraEducativa y de Salud (Infes), is building new schools throughout the country.The need was great: in 1990, 80% of existing educational establishments hadno water, electricity or sewerage. Since then the government has pushedthrough promising if controversial legislation contained in Legislative Decree776. Opposed by the larger and more powerful town halls, the law redistributesresources from the richer to the poorer communities according to demo-graphic, territorial and social criteria. Financing comes from a special 2-per-centage-point allocation of the 18% value-added tax (VAT) collected atnational level. Funds are administered by the smallest local government units,known as districts.
Resources
Population
The 1993 census Peru’s 1993 census gave a mid-year population of 22,639,000 inhabitants (in-cluding an estimated 532,000 not contacted by census officials and anotherestimated 60,000 jungle-dwelling Indians). Of the total, 37% of all inhabitantswere under the age of 15 years. Population growth in 1990-95 averaged 1.78%per year. The National Statistics Institute estimates the 1996 population at23.95m. The overall population growth rate is expected to remain steady forthe next few years, giving a total projected population of 25.66m by the year2000. Life expectancy at birth is 71.1 years for women and 66.2 years for men.Improvements in health care have reduced the infant mortality rate from 109per 1,000 in 1972 to 48 by the end of 1996. (For population data see Referencetable 9.)
Internal migration Millions of Peruvians have migrated from the Andean highlands to the coastalcities over the past three decades in search of better standards of living, and thehealth-care and educational facilities usually lacking in the inaccessible hinter-land. From 1983, when the Sendero Luminoso (Shining Path) guerrilla move-ment became a serious threat to isolated rural communities and army reprisalswere stepped up, the number of migrants was swelled by hundreds of thou-sands of refugees from violence. The Geneva-based International Office forMigration (IOM) estimates that in the ten years from 1983 some 600,000Peruvians were forced to abandon their homes in the countryside for safety inthe provincial towns and the capital city. The 1993 census showed that 70% ofthe population lived in urban areas, up from 65% in the previous 1981 census.The trend towards urbanisation is expected to continue, although at a reducedrate since more peaceful conditions in the countryside have stemmed the flowof migrants and thousands of farming families have returned to their lands.Government funding of small infrastructure projects, as well as improvementsin highway infrastructure and communications in general, have also made theovercrowded shanty towns less attractive to potential migrants.
The proportion of the population living in poverty—defined as those living on$65 a month or less—dropped from 54% in 1990 to 50% in 1994. By mid-1995
Peru: Population 19
EIU Country Profile 1997-98 © The Economist Intelligence Unit Limited 1998

the number living in poverty (that is, unable to cover basic food, clothing,housing and transport requirements) remained around 11.5m. Of these, 4.7m,one-fifth of all Peruvians, were unable to meet basic nutritional needs. Strongereconomic growth and the targeting of the very poorest by the government’ssocial development projects is only gradually bringing reductions in povertylevels.
The indigenous population Peru has several large groups of Indians among its population. Quechua andAymara Indians have been integrated into society since the time of the Spanishconquest, but some tribes living in the remote Amazon basin have never yethad contact with the outside world. Most numerous of Peru’s non-integratedIndians are the Ashaninkas, who are to be found in greatest concentration inthe central jungle region east of Satipo. There are estimated to be between80,000 and 100,000 Ashaninkas, many of them living traditionally in smallextended family groups under a chief, dedicated to hunting, fishing and, to alesser extent, agriculture.
In the late 1980s and early 1990s, the Ashaninkas were a target for SenderoLuminoso. Subjected to blandishments, promises of land and weapons, or elseforcibly recruited, several thousand Ashaninkas are thought to have left theirlands to fight and act as guides for Sendero Luminoso. Ashaninka leaders claimthat some 3,500 men, women and children died between 1988 and 1995, andthat 50 communities have been abandoned.
Education
Public education standards are among the poorest in Latin America. This isespecially true of the rural areas where terrorism and a lack of discipline amongpoorly paid teachers have cut teaching hours drastically. As the Peruvian eco-nomy has been opened up and companies have been forced to compete in theinternational marketplace, the failings of the education system have beenthrown into stark relief.
Mr Fujimori has made improving education a priority for his second term.During his 1995 re-election campaign, he promised to build schools at the rateof three per day. However, teachers’ wages remain very low, school textbooksare almost non-existent and the education ministry has a reputation for ineffi-ciency. Overall, the state spends less than $100 per schoolchild per year.
Schools Although primary education is theoretically free, compulsory and available toall, the 1993 census showed that 12.7% of all children aged between 6 and 11,mainly in rural areas, do not attend school. In many remote regions, the localschool may offer tuition only to the first two school year grades. Drop-out ratesare as high as 40%. Few students go on to secondary education: while 4.2mwere enrolled at the primary level in 1995, only 1.8m were enrolled at thesecondary level. Illiteracy figures underline the problem: 1.78m Peruvians, or7.8% of the total population, were illiterate according to the 1993 census, andof the total 1.3m were women. In rural areas, the overall illiteracy rate was29.8%, compared with 6.7% in urban areas.
20 Peru: Education
EIU Country Profile 1997-98 © The Economist Intelligence Unit Limited 1998

Higher education There are around 50 universities in Peru, one-third of them in Lima. In 1995a total of 714,000 students were registered in universities or other higher educ-ation establishments. Technical education is woefully lacking. Quality trainingin practical skills at tertiary level is chiefly available through two institutions.They are: the Servicio Nacional de Adiestramiento en Trabajo Industrial (Senati),born out of a private-sector, entrepreneurial initiative, which operates nation-wide, providing full apprenticeships as well as short and sandwich courses; andthe Instituto Superior Tecnológico (Tecsup), a privately funded technologicalinstitute which caters for 1,000 full-time students in Lima and Arequipa.
Health
Statistics indicate that there have been some advances in healthcare in the pastfew decades. Life expectancy at birth, for example, rose from 47 years in 1960to 60 in 1985, 65 years in 1993 and 68 years in 1996, while infant mortalitydeclined from 109 per 1,000 in 1972 to 82 in 1981 and 48 in 1996. The severeeconomic recession of the late 1980s and the post-stabilisation recession of theearly 1990s, however, saw a decline in health-service funding and a sharp risein illnesses such as tuberculosis. The cholera epidemic which broke out in early1992 and spread rapidly throughout Peru was proof of poor overall levels ofnutrition and hygiene. Child malnutrition, measured by height and weightstatistics, remains a serious problem, especially in the remoter rural districts.According to the economy ministry, the rate of child malnutrition was reducedfrom 35% in 1993 to 26% in 1996. Regional variations in infant mortality arevery pronounced. Vaccination programmes ensure that nearly all children areprotected against polio, diphtheria, measles, tetanus and tuberculosis.
Healthcare for most of the population is provided by the health ministry andthe social security system. The latter has undergone a number of recent reforms.Through more than 300 hospitals, clinics and health centres around thecountry, it provides health services to 6.5m Peruvians, 2.5m of them are em-ployees on official company payrolls, the remainder their spouses and depend-ent children. Until the middle of 1995, employers paid the equivalent of 6% andemployees 3% of their salaries; now, the entire contribution is paid by theemployer while the employee is responsible for paying into either the statepension plan (now managed by a separate entity, Oficina de NormalizaciónPrevisional, ONP) or a private pension fund (administradora de fondos depensiones, AFP).
The three branches of the Peruvian armed forces and the Policía Nacionalprovide health services for their personnel and family members. Military andpolice hospitals are usually far superior to their counterparts in the publicsector. Some universities, municipalities and professional associations alsohave their own hospitals and health centres. In Lima and some other majorcities, the number of private clinics has grown rapidly since 1990. Privatehealth insurance schemes, a recent development, are proving attractive to thebetter-off.
Those who are not affiliated to the state national insurance scheme or otherproviders and have no private health insurance are entitled to free health-care
Peru: Health 21
EIU Country Profile 1997-98 © The Economist Intelligence Unit Limited 1998

provided by the ministry of health. Technically, this is free; in fact, most publichospitals are so underfunded that patients must buy their own medicines andbandages and rely on relatives for food.
Natural resources and the environment
Geography With an area of 1,285,216 sq km, Peru is the fourth largest country in LatinAmerica after Brazil, Argentina and Mexico. Topographically, Peru is dividedinto three regions: the coastal plain, the Andean highlands and the jungle. Thenarrow, arid coastal region bounded by the Pacific Ocean to the west and theAndean foothills to the east is the most densely populated region. Some 60rivers flow down from the Andes to the Pacific: their valleys are intensivelyfarmed. To the east are the valleys and high plains of the Andes: these were thepopulation centres of the great pre-Hispanic cultures and continue to be hometo around one-third of the population. Further east are the mountain slopes,lowlands and tropical rainforest of the selva or jungle, which comprises aboutthree-fifths of the national territory but is sparsely settled and has little agricul-ture or other development. Throughout history the rugged nature of the terrainhas been a serious obstacle to any attempt to integrate the country.
Climate The coastal climate is dominated by the cold current known as the Humboldt,which flows from the Antarctic along the Chilean and Peruvian coasts. Averagetemperatures here range between 18°C and 23°C. There is almost never anyrainfall, but dense cloud cover and fine mist are common between June andOctober. In the Andes, there are extremes of temperature between day andnight: in some highland areas it may drop from 34°C to below freezing in a fewhours. The rainy season in the Andes is from November to April. In the tropicalforest, a hot and humid tropical climate prevails: there are more than 200 daysof rain per year and average annual rainfall is over 250 cm.
Land use Peru is among the most ecologically diverse countries in the world. Soil use ishighly differentiated depending on the region. In parts of the coastal andAndean regions there are sophisticated irrigation works, some dating back tothe Inca period; in many steep Andean valleys Inca terraces are still in daily usefor agriculture. The tropical forests appear fertile, but the soils are fragile andintensive agriculture is difficult to sustain. The highlands have suffered severedeforestation, mostly because of small-scale wood-cutting. So far at least therehas been little mass exploitation of the timber resources of the Amazon rainforest.
Resources Peru has a wealth of largely unexploited mineral deposits, particularly copper,gold and zinc. Oil has been found in the Amazon and other eastern river basins,as well as offshore in the north. Huge natural gas deposits exist in the centraland southern selva, although exploitation has barely begun. The Peruvianstretch of the Pacific Ocean is one of the world’s richest fishing grounds. Abun-dant, fast-flowing rivers mean that potential for hydroelectric power generationis huge.
22 Peru: Natural resources and the environment
EIU Country Profile 1997-98 © The Economist Intelligence Unit Limited 1998

The environment Only in recent years have businesses and government started to concern them-selves with the environment. Legislation on environmental standards is beingimplemented, albeit slowly, in the mining and fishing sectors. However, partsof the Pacific coast still suffer from massive dumping of waste by fishmealplants, while mines dump tailings into nearby rivers. A Consejo Nacional delAmbiente (CONAM, national council for the environment) has been set upand every productive sector has its own particular regulations. Areas of respon-sibility are ill-defined and control mechanisms weak.
Economic infrastructure
When Alberto Fujimori took office as president in July 1990, Peru’s physicalinfrastructure was in an appalling state. There had been little new investmentfor a decade. Dwindling central government income in the late 1980s—as theeconomy contracted and tax revenue was eroded by hyperinflation—had beeninsufficient even for basic repair and maintenance. Terrorists regularly blew uproads, bridges and power installations. Telephone provision was among thelowest in the continent. Since then there has been a marked improvement. Aroadbuilding programme is under way, while new private investment is trans-forming airport facilities and telecommunications. Privatisation is expected toattract new investment for ports and railways.
Transport and communications
Roads The earliest loans granted by the multilateral organisations, once Peru hadregained its status of eligibility in late 1992, were for improvements to infra-structure. A first $400m credit from the Inter-American Development Bank(IDB), provided for the repair and resurfacing of the two main highways—thePan-American which runs the full 2,800-km length of the coast, and the centralhighway linking Lima to its agricultural and mining hinterland. In addition, aprogramme for the asphalting of some 10,000 km of roads to link the capitals ofall departments and provinces, at a total cost of $1bn, is under way. Another$400m is being spent on the repair of rural roads and the paving of 220 km ofstreets in run-down Andean towns. (For transport statistics see Reference table 10.)
Ports Peru has 21 ports, 11 of which are controlled by Empresa Nacional de Puertos(Enapu, the state ports authority). Deregulation has made them cheaper andmore efficient. Operating contracts for the state ports will be put out to tenderfrom 1998 onwards. Callao, Lima’s port, is by far the largest and most impor-tant at present, but Ilo in the south has a bright future. The 1992 free-tradeaccord with landlocked Bolivia made Ilo a free-trade and industrial zone which,it is hoped, will eventually handle a large percentage of Bolivian exports andimports. Ilo will also gain in importance as mining projects in the hinterlandcome on stream. However, so far little has been done to improve the port’sbasic infrastructure. A port modernisation programme is under way with thehelp of a $166m loan from Japan.
Peru: Transport and communications 23
EIU Country Profile 1997-98 © The Economist Intelligence Unit Limited 1998

Air Air transport is extremely important because of the country’s difficult terrain,and deregulation has encouraged a number of smaller operators to start upregular services to towns in the Andes and jungle inaccessible by road. Sched-uled services to major provincial cities have sharply increased in number andcompetition has resulted in improved time-keeping. There are over 50 airportsin Peru, the busiest being Lima’s Jorge Chávez, and Cuzco, Tacna, Arequipa andIquitos, all of which are classified as international. Airport services in Lima havebeen largely privatised and facilities much improved. Provincial airport servicesare to go in the same direction. The two main international airlines are Faucettand Aeroperú, both of which are privately owned. Other important domesticoperators are Americana, Expreso Aéreo, Aero Continente and Aero Cóndor.
Railways The Peruvian railway system, largely built by the British, is in a state of poorrepair. Commercially, the most important stretch of track runs eastward fromLima and transports large quantities of minerals from the mines in and aroundCerro de Pasco and La Oroya, the traditional mining heartland. EmpresaNacional de Ferrocarriles (Enafer, the railway company), state-owned and poorlyadministered, is scheduled to be handed over for concession to the private sectorbefore the year 2000. First to be transferred to the private sector is likely to theshort and profitable tourist train from Cuzco to Machu Picchu. The only stretchwhich is likely to remain in state hands is the line from Huancayo to Huancavelica,the only viable means of transport in the zone and heavily used by impover-ished peasant farmers. The transport and communications ministry views it as asocial service which would not survive unsubsidised.
Telecommunications At the beginning of 1994 Peru had almost the lowest level of telephone pene-tration in Latin America: under three lines per hundred inhabitants. In Febru-ary 1994, the government auctioned a 35% controlling shareholding in thetwo national telecommunications companies: the long-distance national andinternational state monopoly, Entel, and the telephone company for Lima,Compañía Peruana de Teléfonos (CPT). It was acquired by Telefónica Interna-cional (TISA), a subsidiary of Spain’s Telefónica, for over $2bn in what is to datePeru’s largest privatisation. Progress in telecommunications service has beendramatic since then. Telefónica del Perú will be expanding its services as fast asit can to take full advantage of its temporary monopoly, which expires inmid-1999. Telefónica’s strategic plan is to install 2.5m fixed lines by 2000 toachieve a density of 10%. The goal for the number of cellular customers is800,000 by that year. Plans also include the digitalisation of most lines by thetime Telefónica’s monopoly ends. Investment from 1998 to 2000 will total$1.5bn, bringing total investment since privatisation to some $7.5bn.
In December 1996 US-owned Bell South acquired 60% of the shares in thecellular telephone and cable television firm, Tele 2000, for $60m. In late 1996the telecommunications supervisory board, Ospital, ordered Telefónica to pro-vide cellular roaming rights in the provinces. The purchase will enable BellSouth to compete with Telefónica by the time the monopoly ends in 1999.
24 Peru: Transport and communications
EIU Country Profile 1997-98 © The Economist Intelligence Unit Limited 1998

Energy provision
Oil Peru is believed to have large, untapped energy potential in both gas and petro-leum. Oil output had risen in the late 1970s to peak at 71.4m barrels (204,000barrels/day, b/d) in 1980, but owing to decades of little investment by the stateand a lack of exploration by private companies, output had slumped to around118,500 b/d by 1997. Some 90% of output came from four companies: OccidentalPetroleum, Petrotech, Pluspetrol and Pérez Companc. Production is expected todecline further in 1998. Because of falling output and rising demand Peru is nolonger self-sufficient in oil. It still exports heavy crude (1996 exports earned$310m) but since 1987 has imported rising quantities of light crude. It has runan oil trade deficit since 1992.
Underinvestment in the oil industry was exacerbated by disputes in the late1980s between the government of Alan García and three foreign producers.Although Mr Fujimori made peace with foreign investors (which includedagreeing to pay $185m in compensation to the American Insurance Group forthe expropriation of oilfields originally operated by Belco of the US), newinvestment was slow to materialise at first. However, late in 1995 ChevronOverseas Petroleum, a subsidiary of the large US oil company, signed a majorexploration contract with Perupetro, the state contracting and promotion en-tity. Chevron made an aggressive bid for Block 52 in the Ucayali basin, border-ing the Camisea gas fields held by Shell. The 45% royalties offered by Chevronon future production were unprecedented in Peru and around double thenormal figure offered. Some 20 exploration and drilling contracts were signedin 1996.
The privatisation of the state oil company, Petroperú, was postponed because ofpolitical sensitivities in the run-up to the April 1995 general election, but beganin 1996. A consortium led by Spain’s state-owned firm, Repsol, acquired 60% ofthe shares in Petroperú’s La Pampilla refinery in June 1996, with a bid of $181m.Petroperú’s licensing agreement for Blocks 8 and 8X was transferred to a consor-tium led by Pluspetrol of Argentina, which bid $142m. Pérez Companc ofArgentina won the bidding for Block X on the northern coast, with an offer of£202m. Locally owned Grana y Montero and US-based Williams won the bid-ding in late 1997 for 30-year contracts to operate 15 oil storage terminals.
Gas After Shell’s 1987 discovery of the huge Camisea natural gas fields in thesouth-eastern jungle of Cuzco department, exploration companies widenedtheir interest in Peru’s hydrocarbon potential. The Camisea fields contain gasand condensates equivalent to 2.4bn barrels of oil, nearly seven times today’sproven reserves. A consortium of Shell (57.5%) and Mobil (42.5%) signed acontract with the Peruvian government in May 1996 to develop the deposits. Ifthe project is completed as scheduled, it will be the largest-ever private-sectorinvestment in Peru, involving about $2.8bn. In the first phase, four appraisalwells will be drilled, seismic and geological studies will be reworked and anenvironmental impact study will be prepared. The second phase—the con-struction of the trans-Andean pipeline, which would cost about $800m—willgo ahead only if sufficient demand for Camisea’s dry gas can be assured.
Peru: Energy provision 25
EIU Country Profile 1997-98 © The Economist Intelligence Unit Limited 1998

Electricity generation Despite the encouraging medium-term outlook for large discoveries of oil andgas, and the excellent prospects for Camisea, Peru is on the verge of an energycrisis in the short term. The present installed capacity is 4,420 mw, and some80% of output is hydroelectrically generated (see Reference table 11). Thismeans power supply is highly vulnerable to drought. When the warm Pacificcurrent known as El Niño made one of its periodic appearances in 1992, energysupply to industry was reduced by 30%. Official estimates are that capacitymust expand in the short term by 40% and thereafter by between 8.5% and10% per year to meet higher demand from mining and industry and to extendelectricity coverage to the 42% of the population still without power.
Privatisation is envisaged as one way of rapidly increasing capacity. Althoughsell-offs in the electricity generation sector were delayed, they did get underway in 1995. April saw the privatisation of the Cahua 40-mw hydroelectricplant, the smallest of state-owned Electroperú’s generation units, while Edegel,the 700-mw generating arm of what was originally Electrolima, was auctionedin October 1995, fetching $500m in a keenly contested sale. In June 1996, 60%of the shares of Electroperú’s Egenor were acquired by US-owned DominionEnergy for $228m and a commitment to install a 100-mw plant within threeyears. In October of the same year a consortium led by Spanish-owned Endesasubsidiary, Endesar, bought 43.2% of Empresa Eléctrica de Piura for $99.4m. Amonth later, the company agreed to buy a further 19.8% for $19.7m. The stateretains the remaining 37% share. The privatisation of Egesur, a generating firmin southern Peru, was announced and then postponed on various occasions. InNovember, the Congress passed a law limiting market shares in the electricitybusiness in an attempt to prevent the formation of monopolies.
Energy balance, 1996(m tonnes)
Oil Gas Coal Electricity Other Total
Primary production 6.2 0.9 0.1 3.4a 4.4 15.0
Imports 4.3 0.0 0.3 0.0 0.0 4.6
Exports 2.8 0.0 0.0 0.0 0.0 2.8
Primary supply 7.7 0.9 0.4 3.4 4.4 16.8
Net transformation 1.4 0.8 0.0 2.2 0.5 4.9
Final consumption 6.3 0.1 0.4 1.2b 3.9 11.9
a Input basis. b Output basis.
Source: Energy Data Associates.
Existing hydroelectric plants are particularly attractive to investors since de-mand is high and the marginal pricing mechanism favours cheap producers. Sofar, however, private investment in new generating capacity has been slow tomaterialise despite legislation designed to encourage it. In view of the immi-nent energy gap, the government has decided to step in, obtaining a $155msoft loan from Japan’s Eximbank to start work on San Gabán, a long-projected126-mw hydroelectric plant in the Andean department of Puno. Governmentofficials say they will privatise San Gabán before construction is complete. Asimilar mechanism is likely to be used to get two other hydroelectric plants,Mayush and Yuncan, started.
26 Peru: Energy provision
EIU Country Profile 1997-98 © The Economist Intelligence Unit Limited 1998

Financial services
Banks Peru’s banking sector has grown rapidly as a result of the economic recoveryand capital inflows into the financial system. When Mr Fujimori was elected in1990, the sector was in deep crisis. Legislation discriminating against foreignbanks had provoked a mass withdrawal; volumes intermediated by the com-mercial banks had fallen to one-third of their mid-1980s levels as a result ofhyperinflation and capital flight; and non-performing loans had increased toaround one-quarter of total loan portfolios.
Mr Fujimori quickly decreed the abolition of the state’s development and mort-gage credit banks. Today only the development finance corporation, Cofide, stillexists, but only as a second-tier bank channelling funds from other institutionsand without the powers to raise financing on its own account. Along with thesubsidised state development banks, a host of savings and loans co-operativeshave disappeared, victims of financial mismanagement, hyperinflation and em-bezzlement. With them went the savings of many Peruvians, who have been leftwith a distrust of the financial system. A controversial banking law was passedin December 1996 to reduce banks’ exposure to bad debts. The law requiredbanks to reduce the total assets plus risk-weighted contingent credits from theexisting level of 12.5 times net worth to 11.5 times net worth by mid-1997 and11 times net worth by the end of 1999. Critics suggest that the law gives exces-sive power to the banking and insurance superintendency.
Financial operations and assets remain very concentrated: four banks accountfor almost three-quarters of all deposits in the system. However, several newfinancial institutions have opened, others have merged and most have raisedfresh capital to back their operations. Exchange-rate stability has persuadedPeruvians to start saving in local currency, although the financial system re-mains heavily dollarised. In December 1997 about 70% of bank deposits werein dollars.
Even though deposits in the banking system have almost doubled since 1990,Peru is still severely underbanked. Total deposits were Ns45bn at end-1997,around 26% of GDP. The sector’s strong growth potential and high spreadshave attracted several foreign banks to invest in Peru since 1993. Competitionwill intensify, but the 45% reserves requirement imposed by the Banco Centralde Reserva (the Central Bank) on foreign-currency deposits will prevent a rapidnarrowing of interest rate spreads (for interest rates see Reference table 4).
As in several other sectors, the combination of a new legislative framework andprivatisation provided the initial spur to attract foreign investors. In mid-1994the smaller of two state-owned banks, Interbanc, was sold for $51m at auctionto International Financial Holdings, a group of Peruvian, US and Chileaninvestors. In April 1995 Spain’s leading corporate banking institution, BancoBilbao-Vizcaya, in conjunction with Peru’s Brescia group acquired the state-owned Banco Continental, the third-ranked bank in Peru in terms of assets anddeposits. Other newcomers to the sector include Chile’s Banco O’Higgins,which has acquired Banco Libertador, and the Errazuriz group which has ac-quired Bandesco (now called Banco de la República). Two Chilean financehouses have set up new banks (Banco del Trabajo and Banco Solventa) to
Peru: Financial services 27
EIU Country Profile 1997-98 © The Economist Intelligence Unit Limited 1998

exploit the fast-expanding consumer credit market. After losing to its rival,Banco Bilbao-Vizcaya, in the bid for Banco Continental, Spain’s Banco Santan-der acquired two medium-sized banks, Mercantil and Interandino, for around$100m: they are now merged into Banco Santander del Perú. Sudameris ofItaly, owned by the Generali insurance group, has purchased a controllingshare in Peru’s sixth largest bank, Banco de Lima, and Chile’s Luskic group hasacquired a majority share in Banco del Sur. The new arrivals are bringingcompetition and new technology to Peru.
The stockmarket The Lima Stock Exchange (Bolsa de Valores de Lima, BVL) began a long bull runin 1992 as the economy stabilised and progress towards pacification was made.Liberal foreign investment and foreign exchange regimes, exemption fromcapital gains on shares until 2001, and good prospects of economic growthattracted foreign investment funds. This resulted in a quadrupling of tradingvolumes to over $400m and a 125% increase in the general stockmarket index(Indice General de BVL—IGBVL) in 1992. The BVL posted further strong gainsin 1993 and 1994 before falling back in 1995 due to nervousness following theMexico crisis, bringing price/earnings ratios down from as high as 60 in thethird quarter of 1994 to 15 by the end of 1995. After falling by 17% in dollarterms in 1995, the index rose moderately in 1996 to end the year at 1,429,despite slippage prompted by the hostage crisis. By mid-1997 the BVL had risento 2,155 but political uncertainty within Peru dampened sentiment in July andAugust, and international financial disturbances following the Asian crisis con-tributed to a decline, to 1,745, by the end of the year. Although foreign invest-ors represent a small part of market capitalisation, they account for a largeshare of trading volume. (For stockmarket indicators see Reference table 12.)
Other services
The retail sector With the exception of some of the more affluent areas of Lima and other largecities, the retail sector is underdeveloped. There is a large informal network ofsmall shops, stalls and street-sellers. These informal traders often acquire theirmerchandise on the black market from backstreet sweatshops or from organ-ised smugglers. Since they pay virtually no taxes and have minimal overheads,they are stiff competition for legal outlets. This hindered the development of amodern retail sector until the opening of the economy and rapid growth of the1990s. Aggressive Chilean penetration, particularly of the supermarket sub-sector, has also been an important factor. Chilean investment totalling $50mhas built Peru’s largest shopping complex in the grounds of the Lima Jockey Club.
Tourism This promising sector collapsed in the late 1980s under the combined weightof hyperinflation, economic chaos and terrorism. With most of the countrynow pacified and Peru’s international image markedly improved, the touristsare returning. Tourist numbers grew by one-third in 1996 and another 15% in1997, to reach around 750,000. These figures, however, include business visi-tors as well as tourists.
Inadequate hotel infrastructure is a constraint on tourism. However, invest-ment is taking place. The 33 hotels of the Enturperú state chain have been
28 Peru: Other services
EIU Country Profile 1997-98 © The Economist Intelligence Unit Limited 1998

successfully transferred to private ownership. Several international hotelchains have built hotels in the capital, Arequipa and Cuzco, and there are moreunder construction. An overvalued exchange rate and the high cost of livinghave obliged the government to introduce tax exemptions on tourist packagessold abroad. Asian operators have penetrated the lucrative and underexploitedcasino sector.
Production
Manufacturing
Until the change of government in 1990, manufacturing industry was accus-tomed to protection against outside competition. High tariffs ensured that im-ported goods were beyond the reach of the vast majority of the population.Some manufacturers were favoured, during Alan García’s government (1985-90), by a differential exchange rate which enabled them to import parts cheaply.Incentives were also granted to certain sectors, such as the textile industry, toincrease output for export: they were allowed to import machinery free of dutyprovided the end product was exported. Exporters benefited from the CERTEXsystem which allowed drawback of numerous local taxes. All of these mecha-nisms were subject to widespread abuse on the part of the beneficiaries and thegovernment officials in charge of administering them, and fell into disrepute.
After the election of Alberto Fujimori in 1990 protectionist tariffs were slashedand all incentives and concessions were withdrawn. The change was traumaticfor manufacturers. Overnight, companies had to modernise plants and prod-uction techniques in order to survive in the world market. Most were severelyundercapitalised and in no position to raise the necessary funds for upgradingmachinery. Many businesses were forced to go bankrupt or merge. Only thefittest survived. (For further details of manufacturing production see Referencetable 13.)
Manufacturing volumes(% change, year on year)
Average1992-96 1996 Jan-Nov 1997
Processing of primary resources 5.2 5.5 5.2
Rest of manufacturing 3.4 1.6 8.4
Total 5.0 2.7 7.5Source: Banco Central de Reserva, Nota Semanal.
The food industry Two companies have come to dominate the foods sector: Alicorp (which re-sulted from the 1996 merger of Consorcio de Alimentos Fabril Pacífico andNicolini Hermanos), owned by the Romero group; and the Gloria group,owned by the Rodríguez group. Alicorp produces noodles and other food prod-ucts, but also has important manufacturing interests in cotton and textiles,palm oil and agro-industry. Gloria’s main product is canned milk, a huge massproduct in Peru where refrigeration is still a luxury for most of the population;
Peru: Manufacturing 29
EIU Country Profile 1997-98 © The Economist Intelligence Unit Limited 1998

Comparative economic indicators, 1996
0 100 200 300 400
Brazil
Mexico
Argentina
Colombia
Chile
Venezuela
Peru
Ecuador
Uruguay
Paraguay
Bolivia
Gross domestic product$ bn
Sources: EIU estimates; national sources.
749.1749.1749.1749.1749.1749.1749.1749.1
0 2,000 4,000 6,000 8,000 10,000
Argentina
Uruguay
Chile
Brazil
Mexico
Venezuela
Peru
Colombia
Paraguay
Ecuador
Bolivia
Gross domestic product per head$
Sources: EIU estimates; national sources.
-2 0 2 4 6 8
Chile
Mexico
Uruguay
Argentina
Bolivia
Brazil
Peru
Colombia
Ecuador
Paraguay
Venezuela
Gross domestic product% change, year on year
Sources: EIU estimates; national sources.
-10 0 10 20 30 40
Venezuela
Mexico
Uruguay
Ecuador
Brazil
Bolivia
Peru
Paraguay
Chile
Argentina
Colombia
Consumer prices% change, year on year
Sources: EIU estimates; national sources.
100100100100100100
0.40.4
100100100
0.4
30
EIU Country Profile 1997-98 © The Economist Intelligence Unit Limited 1998


it also manufactures ice cream, sweets and biscuits and has pharmaceuticalinterests.
Brewing and soft drinks In late 1996 Backus y Johnston brewery and Compañía Nacional de Cerveza(CNC) merged, to form Cervecerías Unidas Backus y Johnston. The new com-pany is Peru’s leading industrial company in terms of annual sales, which to-talled $300m in 1996. Cervesure, producer of the Cuzqueña and Arequipeabrands, also has a significant share of the beer market. Coca-Cola and Pepsi-Colacompete with the domestic soft drink Inca Kola, manufactured by José Lindleye Hijos.
Textiles Peru is well placed to develop a high-quality textile industry. Locally grown,long-staple Pima cotton is highly regarded on international markets and so isTanguis, a native Peruvian variety primarily used for sportswear. In recentyears, a handful of Peruvian manufacturers have started producing garmentsfor export from so-called ecological cotton: this has been grown continuouslyfor thousands of years in Peru and is naturally coloured, therefore needing nobleaching or dyeing. Other fibres with export potential are alpaca and vicuña,both species native to the high Peruvian Andes. However, although the rawmaterial is available, manufacture and export of fibre, either as tops or asfinished garments, has been slow to develop. Exporters face high costs becauseof poor transport infrastructure and suffer from the overvalued exchange rate.Textile exports earned $441m in 1995. In 1996 growth in textile exports slowedto 3.1%, but in the first 11 months of 1997 they rose by an impressive 24.9%.
Mining
Peru is one of the world’s leading mining countries, the seventh largest copperproducer in the world and the second largest silver producer. It also rankshighly in output of zinc, lead and gold. Minerals have traditionally been themost important source of export revenue, representing up to half of totalearnings: in 1996 minerals exports generated revenue of $2.65bn, 45% of totalexports. The dependence on minerals is likely to continue for the foreseeablefuture: it is estimated that under 10% of the country’s mineral wealth has beenidentified to date.
The mining sector is set to grow strongly from the mid-1990s as a result ofinvestment attracted by liberal foreign trade and investment regimes and theprivatisation of state mining assets. By 1995 almost all the holdings ofMineroperú had been disposed of, but the unwieldy state mining and refininggiant, Centromín, formed when the US-owned Cerro de Pasco Corporation wasnationalised under the Velasco military regime, did not attract bidders at auc-tion in May 1994. A piecemeal privatisation process for the company wasinitiated in 1996, and has proved more successful. Sales completed to date in-clude the Antamina and Quiqay mining prospects, Empresa Minera Yauliyacu(the Casaplaca polymetallic mine), a huge smelter and refinery complex at LaOroya and a zinc exploration contract at Yauricocha. Further Centromín units,including its largest mine, Cerro de Pasco, are due to be sold in 1998.
32 Peru: Mining
EIU Country Profile 1997-98 © The Economist Intelligence Unit Limited 1998

In early 1998 Mineroperú will resume the sale of its huge Bayovar phosphatedeposits and the Michiquillay copper deposit, both in northern Peru. Thecompany is also drawing up privatisation schedules for its remaining mineraldeposits of Winicocha, the Alta Chicama coal deposits and the copper-rich LasBambas.
Minerals production(’000 units)
% changeJan-Nov 1997/
1995 1996 Jan-Nov 1996
Copper (tonnes) 382 367 3.5
Silver (kg) 1,777 1,784 6.5
Lead (tonnes) 223 220 4
Zinc (tonnes) 592 635 14.3
Iron (tonnes) 3,835 2,876 2.2
Gold (kg) 48 55 15.5
Crude oil (barrels) 44,443 43,909 –1.4Source: Banco Central de Reserva, Nota Semanal.
Privatisations have brought in new, foreign owners, investment commitmentsand new technology. Quellaveco was acquired by the South African miningcompany, Anglo-American, Cerro Verde by Cyprus Minerals and Tintaya byMagma Copper, both of the US. In other mining privatisations, Canada’sCominco bought the zinc refinery of Cajamarquilla and Southern Peru CopperCorporation (SPCC), controlled by Asarco of the US, acquired the Mineroperúcopper refinery at Ilo. The iron producer, Hierroperú, was sold to the ShougangCorporation of China.
A host of other foreign mining companies have set up offices in Peru since1993. Many have been drawn by the spectacular success of the Yanacocha golddeposits in the northern department of Cajamarca. Yanacocha, a joint venturebetween Newmont Mining of the US and Peru’s Buenaventura mining groupwhich produced its first gold in mid-1993, is now Latin America’s leading golddeposit and one of the lowest-cost producers in the world: 1997 output topped1m oz and costs are little over $100 per ounce.
The level of international interest also reflects Peru’s macroeconomic stability.After the nationalisations of the 1970s and the generally hostile attitude ofAlan García’s government to foreign capital in the latter part of the 1980s,investors shunned Peru. Guerrilla violence, concentrated in the minerals-richAndes, obliged many small and medium-sized mines to close and deterredfresh investment. Yanacocha’s decision in mid-1992 to put $40m into develop-ing the Cajamarca deposits was the first new foreign mining investment inPeru for over 20 years. A host of smaller companies, such as SPCC, Cyprus andMagma, are spending big sums on upgrading machinery and equipment, whilelarge international companies such as RTZ of the UK, have large teams ofgeologists exploring throughout the country. (For statistics of mineral prod-uction in 1992-96 see Reference table 14.)
Peru: Mining 33
EIU Country Profile 1997-98 © The Economist Intelligence Unit Limited 1998

Agriculture, forestry and fishing
Agriculture The wide diversity of climatic conditions means there is almost no crop whichcannot be cultivated in Peru. Close to 40% of Peru’s economically active pop-ulation is employed in agriculture and some 1.3m ha are estimated to be undercultivation.
Apart from the coast, where some new irrigation technology has been adopted,farming remains primitive and productivity levels low. Since the Velasco landreforms of the early 1970s, when huge haciendas were expropriated, broken upinto small units called minifundios or converted into largely inefficient co-operatives, there has been little new investment. In an attempt to encourageinvestment and modernise agriculture, Mr Fujimori’s government has promul-gated a series of land laws. Low limits on land ownership have been raised andland has once again become a tradable commodity. Some of the survivingco-operatives have opted to turn themselves into limited companies. Othervital reforms are still pending. A law to ensure that users pay a realistic price forwater, a scarce commodity on Peru’s coast, has repeatedly been postponed forpolitical reasons despite heavy pressure from the multilateral organisations.
A series of factors combined to depress agricultural output in 1990-92. First,Mr Fujimori ended the subsidised import of seeds and fertilisers and subsidisedcredits which had boosted output in the 1980s. Second, subversive activity inthe countryside obliged many thousands of small farmers to abandon theirlands and crops and take refuge in towns. And third, crops were decimated bythe freak weather conditions of 1992 which brought drought to the Andes andflooding to the coast: agricultural output contracted by 7.4% in 1992.
Since then output and prospects for the sector have improved. The road repairprogramme had an impact on production. Improved transport conditions en-abled farmers in the north-eastern department of San Martín to return torice-growing. Pacification also boosted output by allowing farmers to return tothe land. After growing by 13.9% in 1994, agricultural output growth slowed to7.6% in 1995 and 5.8% in 1996. One encouraging sign for the future of agricul-ture in more remote areas is the establishment and apparent success of the cajasrurales, or rural savings and credit co-operatives, which are providing credit tosmall farmers once again, although this time at market rates. (For agriculturalproduction statistics see Reference table 15.)
Coca Although the eastern slopes of the Andes and the high jungle are suitable foragriculture, and excellent quality tea, coffee and cocoa can be grown, poortransport infrastructure and low prices have encouraged many farmers to turn toa more profitable crop: coca, from which cocaine is produced. Coca has beenproduced in Peru for thousands of years and is still extensively chewed byAndean peasants to counteract fatigue. Commercial growing commenced in thelate 1970s and expanded rapidly in the following decade as demand and pricesfor cocaine rose sharply in the US. The Carretera Marginal de la Selva, or tropicalforest highway, built during the first Belaunde government (1965-68) and in-tended to stimulate colonisation, opened up the country for the coca trade.Since the mid-1980s coca has largely displaced other crops in the tropical forest.
34 Peru: Agriculture, forestry and fishing
EIU Country Profile 1997-98 © The Economist Intelligence Unit Limited 1998

Estimates of the area under coca cultivation vary widely from 300,000 hadownwards. US State Department figures put the area under coca leaf at165,300 ha in 1994 with 115,000 ha under full production. Estimates from theUN Drugs Control Programme (UNDCP) are substantially higher. Severalnewer zones, such as the Apurimac valley and the Aguaytía area, now rival inproduction the traditional heartland of the Huallaga valley. Peru is by far andaway the largest producer of coca leaf in the world, and, like neighbouringBolivia, is moving into processing the leaf into basic cocaine paste, or purecocaine hydrochloride, for shipping abroad. Revenue to Peru from the trade isestimated at between $500m and $1bn per year.
Fishing The history of Peru’s fishing sector is one of boom and bust. The rich fishinggrounds of the Pacific coast formed the basis of a fishmeal processing andcanning industry which became a large foreign-exchange earner in the 1960sand 1970s. Up to 10m tonnes of anchovy and sardine were caught close toshore each year. But overfishing and the periodic appearance of the warm ElNiño current caused several reverses over the years. Post-Niño periods, how-ever, traditionally prove bountiful and the sector enjoyed two of its best everyears in 1993 and 1994, after the El Niño of 1992.
Fishing and production of fishmeal and oil were nationalised in 1973. How-ever, private industrialists gradually worked their way back into the sector and,by 1990, were producing over half of Peru’s fishmeal. Liberalisation has con-tinued apace under Mr Fujimori and by the end of 1997 all of Pescaperú’sfishmeal plants had been auctioned to the private sector. Fishmeal was Peru’ssecond most important export earner behind copper in 1996, with revenuetopping $909m (compared with $440m in 1992).
Most of the investment in the fishing industry since 1992 has been spent onboats to replace the antiquated fleet, and on new, high-technology plantswhich use steam drying at low temperatures to produce prime-quality meal.Much more highly digestible than the standard product, this is used for fishfarming and aquaculture, carrying a substantial price premium. The fish can-ning industry is also having something of a revival.
Anchovy and sardine make up the bulk of the 8-9m ton per year catch, most ofwhich is delivered to the fishmeal industry. The catches are threatened byover-fishing. Pollution has also become a serious problem in some coastaltowns. At Peru’s request, the UN Food and Agriculture Organisation (FAO)produced a report on how to ensure the sustainability of both the resource andthe industry. This report was followed by an anchovy and sardine managementprogramme drawn up by the government, to guide future policy. (For statisticson fishing see Reference table 16.)
Peru: Agriculture, forestry and fishing 35
EIU Country Profile 1997-98 © The Economist Intelligence Unit Limited 1998

The external sector
Merchandise trade
There has been a sharp deterioration in the trade balance since the liberalisation ofthe economy in 1990. A trade gap opened up in 1991 and widened rapidly in1994-95 as heavy investment and a consumer boom sucked in imports. The 1995trade deficit reached a record level of $2.2bn, 3.7% of official GDP despite animprovement in the terms of trade in that year (see Reference table 21). Thegovernment’s response was a sharp tightening of fiscal and monetary policy. Itsucceeded in slowing import growth sufficiently to narrow the trade deficit to3.3% of GDP in 1996 and 2.3% in 1997. The trade deficit/GDP ratio is understated,however. The GDP figures are under review, and are expected to be adjusteddownwards by at least 10% in 1998 to conform to international standards.
Exports Traditional products (minerals, oil, fishmeal and agricultural exports such ascotton, coffee and sugar) represent around 70% of total export earnings. Miningexports continue to dominate, and their share of the total is expected to rise atthe end of the 1990s as new projects, notably in copper and gold, come onstream. Non-traditional exports (the most important of which are textiles, fruitand vegetables, canned and frozen fish and steel and metal products) increasedat a rate of around 20% per year in 1994 and 1995, despite a real appreciation ofthe sol. The rate of growth eased in 1996, to 10%, but was restored in 1997, witha 29% increase reported in the first 11 months (see Reference table 19).
Exports(fob)
% change1996 Jan-Nov 1997 Jan-Nov 1997/($ m) ($ m) Jan-Nov 1996
Traditional exports 4,213.4 4,291.3 11.6 Mining 2,654.4 2,439.3 0.9 Oil & derivatives 353 354.2 6.4 Agricultural produce 297.1 448.2 55.8 Fishing 908.8 1,049.6 30.1
Non-traditional exports 1,589.7 1,842.0 29.3 Agricultural produce 323.3 306.9 9.1 Textiles 454.5 515.7 24.9 Fishing 212 253.5 32.9 Metal mechanicals 48.7 48.7 10.2 Chemicals 167.1 181.6 19.2 Iron metallurgical 141.2 212.9 65.6 Non-metallic minerals 37.3 45.9 33.9 Othersa 205.6 276.8 53.5
Others 94.2 72.9 –15.2 Fishing licences 20.6 7.6 –57.2 Othersb 73.6 65.3 –4.3
Total exports 5,897.2 6,206.2 15.9
a Mainly jewellery; wood and paper; skins and leather and crafts. b Includes sales of fuel and foodto foreign vessels.
Sources: Banco Central de Reserva; Customs Authority.
36 Peru: Merchandise trade
EIU Country Profile 1997-98 © The Economist Intelligence Unit Limited 1998

Having stagnated in 1990-93 because of recession and weak commodity prices,export earnings rose by 30% in 1994, reflecting higher volumes and firmercommodity prices (see Reference tables 18 and 23). Their 22% increase in 1995,however, was mainly attributable to the continued commodity price boomrather than volume growth. In 1996 the fall in the price of copper, the largestexport earner, slowed export earnings growth to a modest 5.5%. Despite poorminerals prices, export earnings grew by 15.9% year on year in the first 11months of 1997, with strong performances across a wide range of products.
Imports Having been held back by protectionism and recession in the latter part of the1980s, imports have recovered strongly since 1990. A surge in imports in 1994-95 threatened to cause external financing problems. As a result of governmentpolicy designed to improve the trade balance, import growth slowed to 1.8% in1996. However, consumer goods imports continued to grow faster than GDP,at 3.5%, while capital goods imports grew by only 1%. In the first 11 monthsof 1997, however, the pattern of import growth was more encouraging: withinthe overall growth rate of 7.8% (only slightly above GDP growth) consumergoods imports rose by only 1.5% while capital goods imports rose by 15.8%.(For import statistics see Reference table 20.)
Imports($ m; fob)
% changeJan-Nov Jan-Nov 1997/
1996 1997 Jan-Nov 1996
Consumer goods 1,847 1,716 1.5
Intermediate goods 3,237 3,147 5.4
Capital goods 2,417 2,578 15.8
Total incl others 7,897 7,815 7.8Source: Banco Central de Reserva, Nota Semanal.
The US is Peru’s most important trading partner, accounting for one-quarter ofexports and almost one-third of imports. Apart from the US, trade is distributedwidely, with no single trading partner holding a share much over 5%. Efforts atregional integration (see Regional trading associations) have slightly increasedLatin America’s share. In 1990 15.4% of Peru’s exports were destined for theregion, and in 1996 the proportion was 17.1%; of Peru’s imports, 27.5% camefrom the region in 1990, and in 1996 this was 34.4%. However, it does notappear that this is a continuous trend: the proportion of trade carried outwithin the region peaked in 1991 and 1992, and did not grow between 1994and 1996 (see Reference table 22).
Main trading partners, 1996
Exports to: % of total Imports from: % of total
US 19.9 US 30.7
Japan 6.7 Germany 3.9
UK 7.3 Brazil 4.2
Germany 5.2 Japan 3.7
Italy 3.4 Chile 5.7Source: IMF, Direction of Trade Statistics.
Peru: Merchandise trade 37
EIU Country Profile 1997-98 © The Economist Intelligence Unit Limited 1998

Invisibles and the current account
Invisibles Peru has run a deficit on both factor and non-factor services in the 1990s (seeReference tables 23 and 24). Rising income from tourism has prevented thenon-factor services deficit from widening significantly in 1992-96 despite in-creased outgoings on insurance and freight. The deficit on factor services hasfluctuated between $1.5bn and $2bn since 1992, according to national figures.Net transfers have been on a rising trend, growing from $446m in 1992 to$647m in 1996.
Largely reflecting the trend in the trade balance, the current-account deficitwidened steadily in 1990-95, reaching a record $4.3bn in 1995, 7.2% of GDP(based on overstated GDP figures). Concern that the current account wasreaching unsustainable levels and exposing the economy to potential financ-ing problems was the reason for the government’s decision to tighten mone-tary and fiscal policy to slow demand in 1995. The concern is heightened bythe additional burden which interest payments on Peru’s commercial bankdebt (estimated at around $300m per year) place on the current account asfrom 1997 following the implementation of the Brady plan.
Current account, Jan-Sep($ m)
1996 1997
Merchandise exports fob 4,380 5,195
Merchandise imports fob –5,842 –6,352
Trade balance –1,462 –1,157
Non-factor services balance –501 –568
Factor services balance 1,111 –983
Net transfers 472 490
Current account balance –2,600 –2,218 % of GDP –5.67 –4.55Source: Banco Central de Reserva, Nota Semanal.
Capital flows and foreign debt
Peru ran overall balance-of-payments deficits in 1990-93, according to IMF fig-ures. Large inflows of foreign investment (including $2.1bn from the telecom-munications privatisation alone) swung the balance of payments into surplus in1994. In 1995, with a widening trade deficit and fall in inward private invest-ment flows, there was a deficit once again, but as import growth slowed andinvestment flows recovered in 1996, the overall balance reverted to a surplus.
Foreign investment Most foreign direct investment (FDI) is registered officially with the govern-ment body, the Comisión Nacional de Inversiones y Tecnología Extranjera(Conité). Registration permits investors to benefit from tax stabilisation con-tracts and assures free remittance of profits and royalties. After a decade whichsaw almost no capital inflow from foreign private sources, investment has risenstrongly since 1992. Much of the foreign investment since 1992 stems fromprivatisation, and particularly the 1993 telecommunications sale. In 1996,privatisation receipts were $1.7bn, and non-privatisation direct investment
38 Peru: Invisibles and the current account
EIU Country Profile 1997-98 © The Economist Intelligence Unit Limited 1998

$1.9bn. The main sources of foreign direct investment are Spain, the US andthe UK. Chileans have shown keen interest in Peru since 1992, acquiringcompanies outright and setting up joint ventures: Chilean investment regis-tered was estimated at $220m at the end of 1996.
Foreign investment regulations
The foreign investment regime—contained in Legislative Decrees 662 and 757—isamong the most liberal in Latin America. There are no restrictions on foreigninvestment and foreign investors receive the same treatment as national investors.Important rights granted to foreign investors in these decrees include the following:• Free remittance of dividends, capital, royalties and profits, after payment of tax, ifapplicable. Foreign investors may make transfers through commercial banks in thecurrency of their choice without prior authorisation.• The option of tax stability contracts, which guarantee a fixed rate for a period often years. Such contracts involve a minimum investment commitment of $2m.• No tax payable on dividends and a 10% tax on royalties.• The government is signatory to several internationally recognised guaranteeagreements. These include the World Bank’s Multilateral Investment GuaranteeAgency (MIGA), International Convention on the Settlement of Investment Disputes(ICSID) and Overseas Private Investment Corporation (OPIC). Bilateral agreementshave been signed with at least a dozen countries, mainly in Europe and Asia.
In addition to FDI, since 1992 there have been substantial inflows of foreignportfolio capital into the Bolsa de Valores de Lima (BVL), the Lima StockExchange. In 1991 only $70m in foreign capital was recorded on the BVL. InDecember 1996 the figure was $3.22bn. The largest investors in Peruvian stocksare from the US (accounting for 74% of total foreign investment registered atthe end of 1996) and the UK (14%).
A combination of confidence in the economic outlook, a strong sol and thehigh returns offered by the banking system have also attracted large inflows ofrepatriated capital from Peruvians in the 1990s.
Capital account and balance of payments($ m)
Jan-Sep1996 1997
Current account –2,600 –2,218
Capital account 2,941 4,176 Public sector –280 667 Private sector 3,430 2,149 Short-term capital –209 1,360
Net errors & omissions 885 232
Balance of payments 1,226 2,190
Exceptional financing 587 19
Change in international reservesa –1,812 –1,208
a Minus sign (–) indicates increase.
Source: Banco Central de Reserva, Nota Semanal.
Peru: Capital flows and foreign debt 39
EIU Country Profile 1997-98 © The Economist Intelligence Unit Limited 1998

Foreign debt According to the World Bank, Peru’s external debt totalled $30.8bn at end-1995. Public and publicly guaranteed long-term debt amounted to $18.9bn, ofwhich $14.2bn was owed to official creditors and $4.8bn to private creditors.Of the total debt, 34% was short-term.
Peru defaulted on its external debt service between 1985 and 1990 and built uplarge arrears of principal and interest. In the first term of the president, AlbertoFujimori (1990-95), Peru resumed payments to official creditors, with whom ithas reached several rescheduling agreements. In October 1995 Peru announceda Brady-style restructuring agreement of its debt with commercial bank credi-tors. The agreement, endorsed in March 1997, completed the normalisation ofPeru’s relations with the international financial community. Under the Bradyplan creditors could exchange their debt for one of the following:
• 30-year bonds at a 45% discount to face value with floating interest rates;
• 30-year par bonds with interest payments increasing gradually from 3% peryear in the first 15 years to 5% for the last five years; and
• 20-year bonds with 25 semi-annual payments beginning eight years afterissuance or ten years of fixed interest rates followed by ten years of floatingrates.
The Brady deal has normalised relations between the country and its commer-cial creditors, reopening access to the international capital markets for both thePeruvian private and public sector. A total of $10.6bn in commercial bank andsupplier debt was restructured, comprising principal of $4.4bn and interestarrears of $6.2bn. At the same time, $2.6bn of eligible debt was repurchased bythe government under a buyback.
In July 1996 the government announced that a restructuring deal had beenreached with Peru’s Paris Club creditors. (Paris Club debt amounts to around40% of the country’s total foreign debt.) Payments have been rescheduled over20 years, with the annual servicing bill to be reduced to around half, to $450m,by 2000. The accord covers debt contracted before 1983, which is $7bn of thetotal $9.3bn owed. This debt could give rise to future debt-service outflowsconsiderably higher than those on the Brady bonds. (For further details of theexternal debt see Reference tables 25 and 26.)
Foreign reserves and the exchange rate
Foreign reserves After collapsing in 1987-88 foreign reserves have since recovered steadily. Byend-1996, international reserves (including gold) stood at $10.9bn, equivalentto 13 months of imports of goods and services. At end-November 1997 thelevel was $10.8bn. However, reserve requirements of the banking sector com-prise a large part of the total (over $4bn in late December 1997). The bankshave to place 45% of dollar deposits with the Central Bank. The level of foreignreserves has been a key determinant of monetary policy since 1993 when theCentral Bank began operating an informal currency board whereby local cur-rency is fully backed by foreign reserves. (For statistics on foreign reserves seeReference table 27.)
40 Peru: Foreign reserves and the exchange rate
EIU Country Profile 1997-98 © The Economist Intelligence Unit Limited 1998
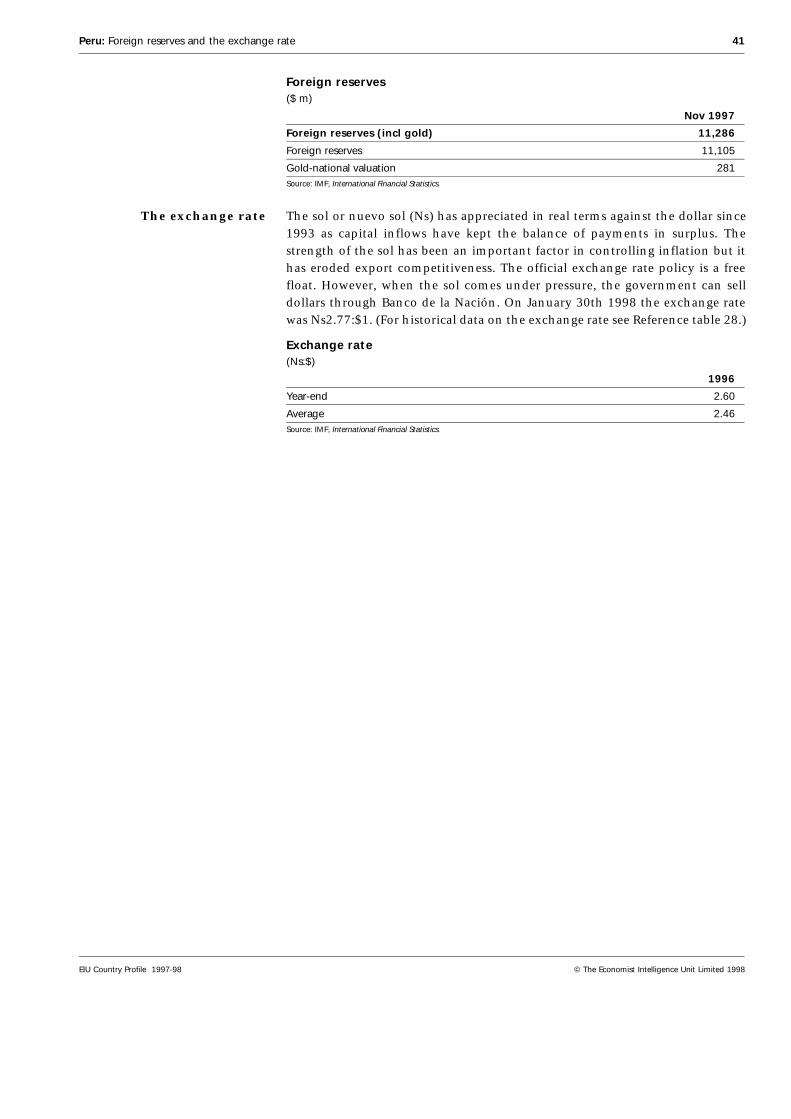
Foreign reserves($ m)
Nov 1997
Foreign reserves (incl gold) 11,286
Foreign reserves 11,105
Gold-national valuation 281Source: IMF, International Financial Statistics.
The exchange rate The sol or nuevo sol (Ns) has appreciated in real terms against the dollar since1993 as capital inflows have kept the balance of payments in surplus. Thestrength of the sol has been an important factor in controlling inflation but ithas eroded export competitiveness. The official exchange rate policy is a freefloat. However, when the sol comes under pressure, the government can selldollars through Banco de la Nación. On January 30th 1998 the exchange ratewas Ns2.77:$1. (For historical data on the exchange rate see Reference table 28.)
Exchange rate(Ns:$)
1996
Year-end 2.60
Average 2.46Source: IMF, International Financial Statistics.
Peru: Foreign reserves and the exchange rate 41
EIU Country Profile 1997-98 © The Economist Intelligence Unit Limited 1998

Appendices
Regional trading associations
Latin AmericanIntegration Association
(ALADI)
In 1960 a Latin American Free Trade Association (Asociación Latinoamericanade Libre Comercio—ALALC) was set up by the Treaty of Montevideo. The mainobjective of the treaty was to remove trade restrictions between the signatories(Argentina, Bolivia, Brazil, Chile, Colombia, Ecuador, Mexico, Paraguay, Peru,Uruguay and Venezuela). However, little progress was made until 1980 whenthe Montevideo Treaty created the Asociación Latinoamericana de Integración(ALADI). The association presided over a significant increase in regional tradein the late 1980s, based largely on bilateral trade agreements, with intra-regional exports climbing from $7.1bn in 1987 to $12.2bn in 1990. However,intra-regional exports still amounted to only 10.8% of the region’s total exportearnings in 1990.
Dissatisfaction with the low level of intra-regional trade, and the new possibili-ties created by the spread of free-market economies through the region, gavefresh impetus to trade negotiations in the 1990s, and progress in the first halfof the decade was spectacular. Intra-regional exports grew by over 20% per yearfrom 1990 onwards, to reach $28.2bn in 1994. Over the same period ALADI’stotal exports grew by a still impressive 11% per year, but intra-regional exportsaccounted for 16.7% of total exports in 1994.
The Andean Group Bolivia, Colombia, Chile, Ecuador and Peru signed the Cartagena Agreement (orAndean Pact) in 1969 which was designed to speed up the process of integrationinitiated by the 1960 Montevideo Treaty, creating an economic unit whichcould deal on a more equitable basis with the larger economic powers in LatinAmerica. Participation in the Andean Pact has altered somewhat over the years,with Venezuela joining in 1973 and Chile withdrawing in 1976.
In November 1990 the five Andean Pact countries signed the La Paz declarationin which they agreed to eliminate tariffs on intra-regional imports by January1st 1992, and committed themselves to setting a common external tariff (CET).Actual implementation was delayed by disagreements on the CET and onexceptions to the free-trade regime. Peru suspended its membership in 1990,due to disagreements over the level of protection envisaged. The CET finallycame into effect at the beginning of February 1995, although only for Ecuador,Colombia and Venezuela. It established duties of 5% for raw materials importsfrom outside the Andean Pact free-trade zone, 10-15% for semi-finished prod-ucts and 20% for finished products. Peru agreed to become a full member oncemore in 1997.
42 Peru: Regional trading associations
EIU Country Profile 1997-98 © The Economist Intelligence Unit Limited 1998

Sources of information
National statistical sources Apoyo SA, Perú Económico (monthly)
Banco Central de Reserva del Perú, Boletín Mensual (monthly)
Banco Central de Reserva del Perú, Memoria (annual)
Banco Central de Reserva del Perú, Nota Semanal (weekly)
Richard Webb and Graciela Fernández Baca, Perú en Números 1994, Cúanto SA,Lima, 1994
International sources IMF, International Financial Statistics
Inter-American Development Bank, Economic and Social Progress in LatinAmerica
UN Development Programme, World Development Report
UN Economic Commission for Latin America and the Caribbean, EconomicSurvey of Latin America and the Caribbean
World Bank, Global Development Finance
Select bibliography Jeff Daeschner, The War of the End of Democracy: Mario Vargas Llosa versusAlberto Fujimori, Peru Reporting, Lima, 1993
John Hemming, The Conquest of the Incas, Macmillan, London, 1970
Luis Jochamowitz, Ciudadano Fujimori: La constitución de un político, EditorialBeisa, Lima, 1993
Peru, The Top 5,000 (1996 edition), Peru Reporting, Lima, 1995
Deborah Poole and Gerardo Renique, Peru: Time of Fear, Latin AmericanBureau, London, 1992
Orin Starn, Carlos Ivan Degregori and Robin Kirk (eds), The Peru Reader: History,Culture, Politics, Duke University Press, Durham and London, 1995
Simon Strong, Shining Path: The World’s Deadliest Revolutionary Force, Harper-Collins, London, 1992
Peru: Sources of information 43
EIU Country Profile 1997-98 © The Economist Intelligence Unit Limited 1998

Reference tables
Reference table 1
Central government finances(Ns m)
1992 1993 1994 1995 1996
Current budget balance –413 –85 711 494 2,302 Income 5,941 9,271 14,179 18,010 21,212 Tax 5,173 8,016 12,180 15,341 17,894 Non-tax 768 1,255 1,999 2,669 3,318 Expenditure 6,354 9,356 13,468 17,516 18,910 Staff 1,656 2,502 3,622 4,700 5,021 Goods & services 862 1,258 2,239 3,482 4,609 Transfers 1,838 2,710 4,047 5,319 5,991 Interest 1,998 2,886 3,560 4,015 3,289
Capital balance –1,256 –2,097 1,186 –2,671 1,057 Capital incomea 79 236 5,144 2,026 5,604 Expenditure 1,363 2,339 4,121 4,795 4,856 Gross fixed capital formation 836 1,393 2,617 3,222 3,228 Others 527 946 1,504 1,573 1,628
Overall balance –1,669 –2,182 1,897 –2,177 3,359 External 1,426 2,141 2,453 2,878 1,007 Internal 243 40 –4,348 –700 –4,436
Memorandum itemPrimary balance (excl interest payments & capital revenue) 250 468 –11 3,617 1,044
a Includes privatisation receipts and capital transfers.
Source: Banco Central de Reserva, Memoria.
Reference table 2
Non-financial public sector accounts(% of GDP)
1992 1993 1994 1995 1996a
Current-account balance 0.6 1.7 2.6 2.1 3.5 Interest payments 4.4 3.9 3.4 3.2 2.3 Current-account balance net of interest 5.0 5.6 6.0 5.3 5.8
Capital-account balance –3.8 –4.1 –0.6 –3.3 –1.1 Capital revenueb 0.4 0.4 4.6 1.7 3.7 Capital expenditure 4.2 4.5 5.2 5.0 4.8 Public investment 3.2 3.4 4.0 4.0 3.8 Other capital costs 1.0 1.1 1.2 1.0 1.0
Overall balance –3.2 –2.4 2.0 –1.2 2.4
Net financing 1.5 2.0 –2.1 1.3 1.3 External 1.1 2.3 2.2 2.3 2.3 Internal 0.4 –0.3 –4.3 –1.0 –1.0
a Preliminary. b Includes privatisation receipts and capital transfers.
Source: Banco Central de Reserva, Memoria.
44 Peru: Reference tables
EIU Country Profile 1997-98 © The Economist Intelligence Unit Limited 1998

Reference table 3
Money supply(Ns m unless otherwise indicated; year-end)
1992 1993 1994 1995 1996
M1 2,843 4,337 5,589 7,498 8,972 % change, year-on-year 77 53 29 34 20
Quasi-money 5,341 9,722 13,703 17,440 25,254
M2 8,184 14,059 19,292 24,938 34,226 % change, year-on-year 88 72 37 29 37
Domestic credit 5,029 8,947 9,588 14,025 17,181 Net claims on central government 416 625 –3,830 –5,303 –11,768 Claims on local government 19 35 50 31 170 Claims on official entities 331 369 270 204 264 Claims on private sector 4,083 7,702 13,095 19,090 28,512 Claims on other banking institutions 179 216 3 3 3
Net foreign assets 4,372 8,311 14,802 17,089 24,784Source: IMF, International Financial Statistics.
Reference table 4
Interest rates(%; annual average)
1992 1993 1994 1995 1996
Discount rate (end-period) 48.5 28.6 16.1 18.4 18.2
Deposit rate 59.7 44.1 22.3 15.7 14.9
Lending rate 173.8 97.4 53.6 27.2 26.1Source: IMF, International Financial Statistics.
Reference table 5
Gross domestic producta
1992 1993 1994 1995 1996b
GDP (Ns m)At current prices 51,887 81,757 110,252 132,905 149,481 At constant (1990) prices 6,435 6,848 7,747 8,304 8,517 Real change (%) –1.8 6.4 13.1 7.2 2.6
Per head (Ns)At current prices 2,321 3,595 4,767 5,648 6,243 At constant (1990) prices 287.9 301.1 334.9 352.9 355.7 Real change (%) –3.5 4.6 11.2 5.4 0.8
a The official GDP figures are believed to overstate GDP by around 15%. At the end of 1997 theeconomy ministry was reassessing the methodology, and is expected to publish revised figures in1998. b Preliminary.
Source: Banco Central de Reserva.
Peru: Reference tables 45
EIU Country Profile 1997-98 © The Economist Intelligence Unit Limited 1998

Reference table 6
Gross domestic product by expenditure(Ns m; constant 1979 prices; percentage change year on year in brackets)
1992 1993 1994 1995a 1996a
Private consumption 2,223.1 2,326.1 2,556.0 2,764.1 2,796.2 (–1.0) (4.6) (9.9) (8.1) (1.2)
Public consumption 276.7 280.3 307.1 343.7 366.1 (2.9) (1.3) (9.6) (11.9) (6.5)
Gross fixed investment 792.5 898.7 1,167.7 1,403.6 1,348.7 (–3.9) (13.4) (29.9) (20.2) (–3.9)
Public 135.7 153.6 192.0 207.8 190.2 (13.5) (13.2) (25.0) (8.2) (–8.5)
Private 656.8 745.1 975.7 1,195.8 1,158.5 (–6.9) (13.4) (30.9) (22.6) (–3.1)
Exports of goods & non-financial services 843.1 857.6 1,000.2 1,060.8 1181.3 (4.4) (1.7) (16.6) (6.1) (11.4)
Imports of goods & non-financial services 726.8 734.5 927.3 1,173 1,180.4 (7.4) (1.1) (26.2) (26.5) (0.6)
GDP 3,408.6 3,628.2 4,103.7 4,399.2 4,512 (–1.8) (6.4) (13.1) (7.2) (2.6)
a Preliminary.
Source: Banco Central de Reserva, Memoria.
Reference table 7
Gross domestic product by sector(Ns; constant 1979 prices; percentage change year on year in brackets)
1992 1993 1994 1995a 1996a
Agriculture & livestock 401.8 436.7 497.5 535.5 566.3 (–7.4) (8.7) (13.9) (7.6) (5.8)
Fishing 39.1 47.3 61.0 49.3 51.9 (12.7) (21.0) (29.0) (–19.2) (5.3)
Mining 399.9 436.5 456.0 468.1 481.2 (–2.1) (9.2) (4.5) (2.7) (2.8)
Manufacturing 758.5 794.8 923.2 962.2 988.3 (–2.9) (4.8) (16.2) (4.2) (2.7)
Construction 225.8 257.6 346.6 407.3 388.5 (4.0) (14.1) (34.5) (17.5) (–4.6)
Commerce 460.9 477.2 559.7 629.0 649.1 (–4.0) (3.5) (17.3) (12.4) (3.2)
Other services 1,123.5 1,178.1 1,259.7 1,347.8 1,386.8 (0.8) (4.9) (6.9) (7.0) (2.9)
GDP 3,409.5 3,628.2 4,103.7 4,399.2 4,512.1 (–1.7) (6.4) (13.1) (7.2) (2.6)
a Preliminary.
Source: Banco Central de Reserva, Memoria.
46 Peru: Reference tables
EIU Country Profile 1997-98 © The Economist Intelligence Unit Limited 1998

Reference table 8
Prices and earnings
1992 1993 1994 1995 1996
Consumer price inflation (% average) 71.6 48.6 23.6 11.2 11.5
Consumer price inflation (% year-end) 56.7 39.5 15.4 10.2 11.8
Wholesale price inflation (% year-end) 50.5 34.1 10.5 8.8 11.4
Average wage (nominal Ns)a 312.1 461.7 655.5 665.0 711.0
Real wages index (Aug 1990 = 100) 216.7 214.9 248.6 227.7 216.9
Minimum wage (nominal Ns) 69.2 72.0 117.0 132.1 153.0
Real minimum wage index (Aug 1990 = 100) 73.5 59.8 77.5 79.2 81.8
Salaries (nominal Ns)ab 607.0 1,054.9 1,552.9 1,644.0 1,860.0
Real salaries index (Aug 1990 =100)ab 206.7 241.4 290.3 277.2 279.8
a Based on survey data from private-sector firms of ten or more staff in Metropolitan Lima. b Includes managers and executives.
Sources: Banco Central de Reserva, Memoria; Nota Semanal.
Reference table 9
Population
1992 1993 1994 1995 1996
Population (m) 22.35 22.74 23.13 23.53 23.94
Annual growth rate (%) 1.77 1.73 1.72 1.74 1.74Source: Banco Central de Reserva, Memoria.
Reference table 10
Transport statistics
1991 1992 1993 1994 1995
RailNo. of passengers (m) 2.3 1.7 1.5 2.0 1.8Passenger-km (’000) 319.8 225.7 165.3 240.1 216.0Cargo (m tonnes) 5.8 5.7 6.1 6.1 1.5Cargo tonne-km (’000) 825.1 817.4 844.4 897.9 407.4
RoadLength of road network (’000 km)a 69,942 69,942 69,942 69,942 73,439No. of vehicles (’000) 623.9 673 707.4 760.8 862.6
AirNo. of flightsb 144,224 153,409 156,213 n/a 106,953No. of passengers (’000) 2,711 2,716 2,949 3,538 4,272Cargo (m tonnes) 52 44 50 54 69
a No survey since 1987. b Scheduled flights and two companies offering non-scheduled flights.
Source: Ministry of Transport, Communications, Housing and Construction.
Peru: Reference tables 47
EIU Country Profile 1997-98 © The Economist Intelligence Unit Limited 1998

Reference table 11
Electricity production
1991 1992 1993 1994 1995
Electricity production (gwh) 13,901 13,132 14,580 15,863 16,058 Hydroelectric 11,231 9,781 11,572 12,864 12,760 Thermal 2,670 3,351 3,008 2,999 3,298Source: Ministry of Energy and Mines.
Reference table 12
Stockmarket indicators
1992 1993 1994 1995 1996
No. of listed companiesBolsa de Valores de Lima 287 233 218 246 231
Market capitalisationNs m 4,300 10,993 17,835 27,482 31,957$ m 2,630 5,113 8,178 11,795 12,291
Trading valueNs m 519 3,332 6,742 9,114.96 9,206.6$ m 417 1,672 3,080 3,912 3,541
Turnover ratio 19.3 43.8 46.8 2.6 2
Local indexIGBVL (December 1991 = 100) 372.9 930.5 1,414.9 1,243.4 1,429 % change 272.9 149.5 52.1 –12.1 14.9
IFC global indexNo. of stocks 18 18 35 35 36
Share of market capitalisation (%) 47.7 46 64.5 63 61.9
P/E ratio 25.9 44 43.9 14.5 14.2
P/BV ratio 2.7 3.6 2 2.8 2.5
Dividend yield (%) n/a 0.8 0.7 1.3 2.4
Total return index (Dec 1992 = 100) 100 137.2 210.6 233.8 241.1 % change n/a 37.2 53.5 11.0 3.1Source: International Finance Corporation.
48 Peru: Reference tables
EIU Country Profile 1997-98 © The Economist Intelligence Unit Limited 1998

Reference table 13
Manufacturing production(1979=100)
1992 1993 1994 1995 1996
Processing of primary products 100.8 109.3 127.1 118.6 125.1 Fishmeal 209.6 257.1 351.4 260.1 274.1 Refined petroleum 108.4 112.5 116.5 114.7 114.1 Non-ferrous base metals 91.6 95.0 97.8 100.6 112.4
Rest of industry 89.2 92.1 106.7 116.9 118.8 Food, beverages & tobacco 123.8 122.9 137.1 143.1 142.6 Textiles & leather 90.9 86.3 103.0 107.7 114.9 Paper 26.6 28.0 54.5 72.1 71.2 Chemicals, rubber & plastics 85.0 96.3 106.6 119.2 124.4 Non-metallic minerals 78.0 92.7 115.1 138.3 145.7 Base metals 80.7 90.0 122.9 127.0 140.4
Capital goods 53.5 52.4 62.0 77.1 69.4 Metal products 48.9 66.0 78.0 80.7 85.2 Machinery & equipment 57.9 47.2 66.3 85.3 53.1 Transport machinery 21.8 12.5 32.1 36.1 24.7
Total 92.5 96.9 112.2 117.4 120.6Source: Banco Central de Reserva, Memoria.
Reference table 14
Minerals production(’000 tonnes unless otherwise indicated)
1992 1993 1994 1995a 1996a
Copper 356 358 344 382 367
Silver (’000 kg) 1,584 1,587 1,655 1,777 1,784
Lead 201 211 219 223 220
Zinc 532 568 587 592 635
Iron 1,977 3,474 4,549 3,835 2,876
Gold (’000 kg) 24 30 39 48 55
Crude oil (’000 barrels) 42,298 46,092 46,468 44,443 43,909
a Preliminary.
Source: Banco Central de Reserva, Memoria.
Peru: Reference tables 49
EIU Country Profile 1997-98 © The Economist Intelligence Unit Limited 1998

Reference table 15
Agricultural production(’000 tonnes)
1992 1993 1994 1995a 1996a
Rice 829.4 967.6 1,401.4 1,140.0 1,203.0
Maize 519.9 772.4 725.0 722.2 559.4
Wheat 73.1 108.1 127.0 125.0 147.7
Bananas 699.0 710.2 845.4 1,066.3 1,349.8
Onion 149.7 150.8 187.1 184.5 236.6
Sweetcorn 157.5 173.5 195.6 222.9 258.2
Asparagus 73.7 97.3 131.4 108.1 127.6
Cotton 108.0 97.8 167.7 216.9 268.6
Coffee 86.5 85.6 91.3 98.7 106.4
Sugar cane 4,740.8 4,342.7 5,429.5 6,305.7 6,119.0
Beans 46.0 39.0 51.7 60.2 69.0
Potatoes 997.6 1,492.7 1,767.2 2,362.3 2,327.3
Yucca 386.4 438.5 512.5 551.4 702.9
Poultry 320.2 302.7 353.7 410.8 410.5
Pork 72.8 75.8 77.7 80.1 83.0
Beef 110.7 106.6 101.7 107.1 110.1
Eggs 106.7 107.0 115.9 144.2 130.0
Milk 768.4 802.7 830.1 857.5 904.9
a Preliminary.
Source: Banco Central de Reserva, Memoria.
Reference table 16
Fishing production(’000 tonnes)
1992 1993 1994 1995 1996a
Offshore fishingIndustrial use Peruvian anchovy 4,869.8 7,008.5 9,799.5 6,557.7 7,452.1 Other species 2,202.9 1,489.0 1,599.6 1,646.4 1,370.5 Human consumption Fresh 204.8 229.2 239.6 267.6 259.7 Frozen 155.7 242.0 312.8 277.8 204.9 Canned 120.5 113.4 149.1 196.8 213.3 Dried/salted 10.3 16.3 17.6 24.6 29.6
Deep-sea fishingHuman consumption Fresh 15.6 16.8 19.4 15.6 22.3 Dried/salted 18.3 22.7 30.1 34.8 33.3
a Preliminary.
Source: Banco Central de Reserva, Memoria.
50 Peru: Reference tables
EIU Country Profile 1997-98 © The Economist Intelligence Unit Limited 1998

Reference table 17
Private construction(’000 sq metres)
1992 1993 1994 1995 1996
Total 3,228 2,551 3,966 4,052 3,918a
of which: housing 2,243 1,460 2,449 n/a n/a
Metropolitan Lima 1,241 979 1,505 n/a n/a of which: housing 863 561 942 n/a n/a
a Estimate to November.
Source: Camara Peruana de la Construccion (CAPECO).
Reference table 18
Exports($ m; fob)
1992 1993 1994 1995 1996
Traditional exports 2,562 2,318 3,163 3,990 4,213 Mining 1,820 1,473 1,971 2,616 2,654 Oil & derivatives 196 182 165 241 353 Agricultural produce 112 81 246 345 297 Fishing 435 581 780 787 909
Non-traditional exports 966 1,017 1,215 1,445 1,590 Agricultural produce 167 187 226 275 323 Textiles 343 324 396 441 455 Fishing 93 137 201 224 212 Metal manufactures 44 42 40 40 49 Chemicals 74 74 102 133 167 Iron metallurgical 125 123 120 145 141 Non-metallic minerals 23 25 29 30 37 Othersa 97 103 102 157 206
Others 133 182 221 157 94
Fishing licences 83 132 173 97 21
Restb 50 50 48 60 74
Total exports 3,661 3,516 4,598 5,591 5,897
a Mainly jewellery; wood and paper; skins and leather and crafts. b Includes sales of fuel and food toforeign vessels.
Sources: Banco Central de Reserva; Customs Authority.
Peru: Reference tables 51
EIU Country Profile 1997-98 © The Economist Intelligence Unit Limited 1998

Reference table 19
Key exports by volume(’000 tonnes unless otherwise indicated)
1992 1993 1994 1995 1996
Fishmeal 993 1,723 2,211 1,816 1,610
Cotton (46-kg bags) 164 41 48 175 252
Sugar 43 29 70 65 83
Coffee 63 49 68 105 100
Copper 349 359 387 418 475
Iron (m long tonnes) 3 5 6 6 4
Gold (’000 troy ounces) 1,173 636 885 1,197 1,478
Refined silver (m troy ounces) 18 19 19 21 23
Lead 170 175 178 197 201
Zinc 442 523 536 507 599
Crude oil & derivatives (m barrels) 18 16 14 17 21Source: Banco Central de Reserva, Memoria.
Reference table 20
Imports($ m; fob)
1992 1993 1994 1995 1996
Consumer goods 904 934 1,365 1,784 1,847
Intermediate goods 1,781 1,859 2,302 3,236 3,237
Capital goods 1,063 1,143 1,698 2,393 2,417
Total (incl others) 4,001 4,123 5,596 7,761 7,897
Memorandum itemsImports into Tacna Free Zone 196 145 139 138 102Principal food importsa 480 476 523 633 821 Wheat 104 123 119 169 231 Maize & sorghum 81 65 82 129 131 Rice 78 80 47 53 137 Sugar 67 70 95 83 105 Dairy produce 74 67 78 88 106 Soya 58 55 78 91 85 Meat 16 18 24 21 26
a Excluding donations.
Sources: Banco Central de Reserva; Customs Authority; Comisión Nacional de Zonas Francas y Zonas de Tratamiento Especial
(Conafran).
52 Peru: Reference tables
EIU Country Profile 1997-98 © The Economist Intelligence Unit Limited 1998

Reference table 21
External trade price and volume indices(1990=100)
1992 1993 1994 1995 1996a
Weighted price index of exports 96.9 90.5 100.5 114.1 112.4
Weighted price index of imports 104.3 104.8 108.2 114.9 117.6
Terms of trade index 92.8 86.4 92.9 99.3 95.6
a Preliminary.
Source: Banco Central de Reserva, Memoria.
Reference table 22
Main trading partners($ m)
1992 1993 1994 1995 1996
Exports to:US 21.4 21.2 16.6 17.3 19.9Japan 9.9 10.2 10.3 9.1 6.7UK 6.4 8.6 8.9 7.4 7.3Germany 4.1 5.8 6.2 6.0 5.2Italy 6.0 4.7 4.4 4.5 3.4China 7.0 3.6 6.3 6.4 7.2Brazil 2.9 2.4 2.7 2.8 4.1
Imports from:US 27.2 30.1 28.2 26.7 30.7Germany 4.6 4.2 4.6 3.8 3.9Brazil 7.7 6.6 6.9 5.9 4.2Japan 5.2 6.8 6.4 5.1 3.7Chile 5.0 5.2 7.9 8.3 5.7Spain 6.8 6.7 5.4 4.6 5.7Colombia 8.9 5.8 4.7 8.6 7.3Source: IMF, Direction of Trade Statistics.
Peru: Reference tables 53
EIU Country Profile 1997-98 © The Economist Intelligence Unit Limited 1998

Reference table 23
Balance of payments, IMF estimates($ m)
1992 1993 1994 1995 1996
Merchandise exports fob 3,661 3,516 4,598 5,591 5,897
Merchandise imports fob –4,002 –4,123 –5,596 –7,761 –7,897
Trade balance –341 –607 –998 –2,170 –2,000
Exports of services 836 837 1,064 1,131 1,371
Imports of services –1,411 –1,412 –1,565 –1,904 –2,050
Income credit 204 209 343 578 608
Income debit –1,836 –1,824 –2,183 –2,580 –2,183
Transfers credit 440 476 639 647 655
Transfers debit –8 –6 –7 –5 –8
Current-account balance –2,116 –2,327 –2,667 –4,303 –3,607
Direct investment abroad 0 0 0 48 –10
Direct investment in Peru 136 670 3,084 2,035 3,581
Portfolio investment assets 0 0 0 0 0
Portfolio investment liabilities 0 228 572 145 341
Other investment assets 318 269 –263 –566 –529
Other investment liabilities –3 –1,426 –73 775 –274
Financial balance 451 –259 3,320 2,437 3,109
Capital account nie credit 40 47 31 65 51
Capital account nie debit –90 –125 –124 –44 –45
Capital-account balance 401 –337 3,227 2,458 3,115
Errors & omissions 417 1,232 267 537 876
Overall balance –1,298 –1,432 827 –1,308 384
Financing ( – indicates inflow)Movement of reserves –554 –667 –3,068 –915 –1,768Use of IMF credit & loans –49 254 – – –Exceptional financing 1,901 1,845 2,241 2,222 1,386Source: IMF, International Financial Statistics.
54 Peru: Reference tables
EIU Country Profile 1997-98 © The Economist Intelligence Unit Limited 1998

Reference table 24
Balance of payments, national estimates($ m)
1992 1993 1994 1995 1996
Exports of goods fob 3,661 3,516 4,598 5,591 5,897
Imports of goods fob –4,002 –4,123 –5,596 –7,761 –7,897
Trade balance –341 –607 –998 –2,170 –2,000
Exports of services 836 837 1,064 1,131 1,371
Imports of services –1,411 –1,412 –1,565 –1,904 –2,050
Service balance –575 –575 –501 –773 –679
Factor services –1,632 –1,615 –1,800 –2,001 –1,575 Public –1,406 –1,376 –1,447 –1,402 –896 Private –226 –239 –353 –599 –679
Current transfers 446 495 637 642 647
Current-account balance –2,102 –2,302 –2,662 –4,302 –3,607
Public sector long-term loans –381 497 –337 –141 –414
Private sector 206 1,204 3,863 2,643 4,130
Short-term lending 1,087 164 382 676 –57
Capital-account balance 912 1,865 3,908 3,178 3,659
Errors & omissions (net) 394 532 175 559 880
Balance of payments –796 95 –1,421 –565 932
Official financing 795 –95 –1,421 566 –931
Net flow of reserves to Central Banka –695 –724 –3,032 –938 –1,853
Exceptional financing 1,490 629 1,611 1,504 922 Refinancing 672 1,313 705 676 586 External debt forgiveness 53 7 138 20 60 Net arrears 746 –691 768 808 276
a Minus sign indicates increase in net reserves.
Source: Banco Central de Reserva, Memoria.
Peru: Reference tables 55
EIU Country Profile 1997-98 © The Economist Intelligence Unit Limited 1998

Reference table 25
External debt($ m unless otherwise indicated; debt stocks as at year-end)
1991 1992 1993 1994 1995
Total external debt 20,713 20,335 23,571 26,526 30,831
Long-term debt 15,657 15,805 16,946 18,852 20,199
Short-term debt 4,350 3,899 5,741 6,736 9,677 of which: interest arrears on long-term debt 2,431 1,793 4,090 4,450 4,602Use of IMF credit 706 631 883 938 955
Public & publicly guaranteed long-term debt 15,439 15,577 16,382 17,679 18,929
Official creditors 9,898 11,108 11,845 13,029 14,172
Multilateral 1,884 2,081 2,743 3,187 3,717
Bilateral 8,013 9,026 9,102 9,842 10,455
Private creditors 5,541 4,469 4,538 4,650 4,756 of which: banks 3,147 3,120 3,075 3,056 3,040 bonds 0 0 0 0 0
Total debt service 1,152 1,003 2,758 1,142 1,182
Principal 627 539 1,620 600 519
Interest 524 464 1,138 542 663 of which: short-term debt 132 101 94 102 184
Ratios (%)Total external debt/GNP 71.9 49.9 60.1 54.1 54.1Debt-service ratioa 24.6 20.2 56.2 17.8 15.3Short-term debt/total external debt 21.0 19.2 24.4 25.4 31.4Concessional long-term debt/ total long-term debt 21.1 23.1 23.3 23.1 22.8Variable interest long-term debt/ total long-term debt 41.1 44.8 47.9 48.9 49.3
Note. Long-term debt is defined as having original maturity of more than one year.a Debt service as a percentage of earnings from exports of goods and services.
Source: World Bank, Global Development Finance.
Reference table 26
External debt, national estimates($ m)
1992 1993 1994 1995 1996
Medium- & long-term 21,616 22,870 25,917 28,115 27,845 Banco Central de Reserva 661 960 1,016 1,037 1,004 Public sectora 20,476 21,126 23,890 25,652 25,196 Private sector 479 784 1,011 1,426 1,645
Short-term debt 3,892 3,500 4,219 5,400 5,668 Banco Central de Reserva 493 162 199 176 89 Financial system (excl Banco Central de Reserva) 956 1,163 812 1,586 1,866 Othersab 2,443 2,175 3,208 3,638 3,713
Total foreign debt 25,508 26,370 30,136 33,515 33,513
a Includes arrears. b Includes public-sector debt.
Source: Banco Central de Reserva, Memoria.
56 Peru: Reference tables
EIU Country Profile 1997-98 © The Economist Intelligence Unit Limited 1998

Reference table 27
Foreign reserves($ m)
1992 1993 1994 1995 1996
Foreign reserves 2,849 3,407 6,992 8,221 10,578
Golda 516 434 363 367 350
Foreign reserves (incl gold) 3,365 3,841 7,355 8,588 10,928
Commercial banks’ foreign assets 991 872 1,184 1,545 2,047
Memorandum itemGold (m fine troy oz) 1.822 1.305 1.116 1.116 1.115
a Year-end holdings valued at 75% of fourth-quarter London price.
Source: IMF, International Financial Statistics.
Reference table 28
Exchange rate(Ns:$1)
1992 1993 1994 1995 1996
Year-end 1.63 2.16 2.18 2.31 2.60
Average 1.25 1.99 2.20 2.25 2.45Source: IMF, International Financial Statistics.
Editor:All queries:
Emily MorrisTel: (44.171) 830 1007 Fax: (44.171) 830 1023
Peru: Reference tables 57
EIU Country Profile 1997-98 © The Economist Intelligence Unit Limited 1998