perspectives on global manufacturing global cost...
TRANSCRIPT

Perspectives on Global Manufacturing Global Cost Comparison and Near-Shoring Trends Russ Dillion

Overview AlixPartners publishes an annual Global Manufacturing Study which compares the landed costs of components to the US marketplace
– Includes a Global Manufacturing Index which considers various cost factors (e.g. wages, freight costs to US, currency)
– Looks at different parts individually and collectively as a market basket
The 2011 Study indicated that the US has regained some competitiveness – U.S. regained some competitiveness relative to the LCCs (largely due to a weaker dollar and LCC wage
inflation) – Mexico had the lowest landed costs – Other key/emerging LCCs (e.g., India, Vietnam, Russia, Romania) remain more competitive than China,
but with higher costs than Mexico
Based on the changes in the global manufacturing landscape, we surveyed 80 executives to see if US companies are changing their views on near-shoring or off-shoring manufacturing
Contents AlixPartners Global Manufacturing Study and Index
Global Trends and their Implications
Near-shoring Survey
Survey Findings
What this means to US Companies – “Is it time to Near-shore?”
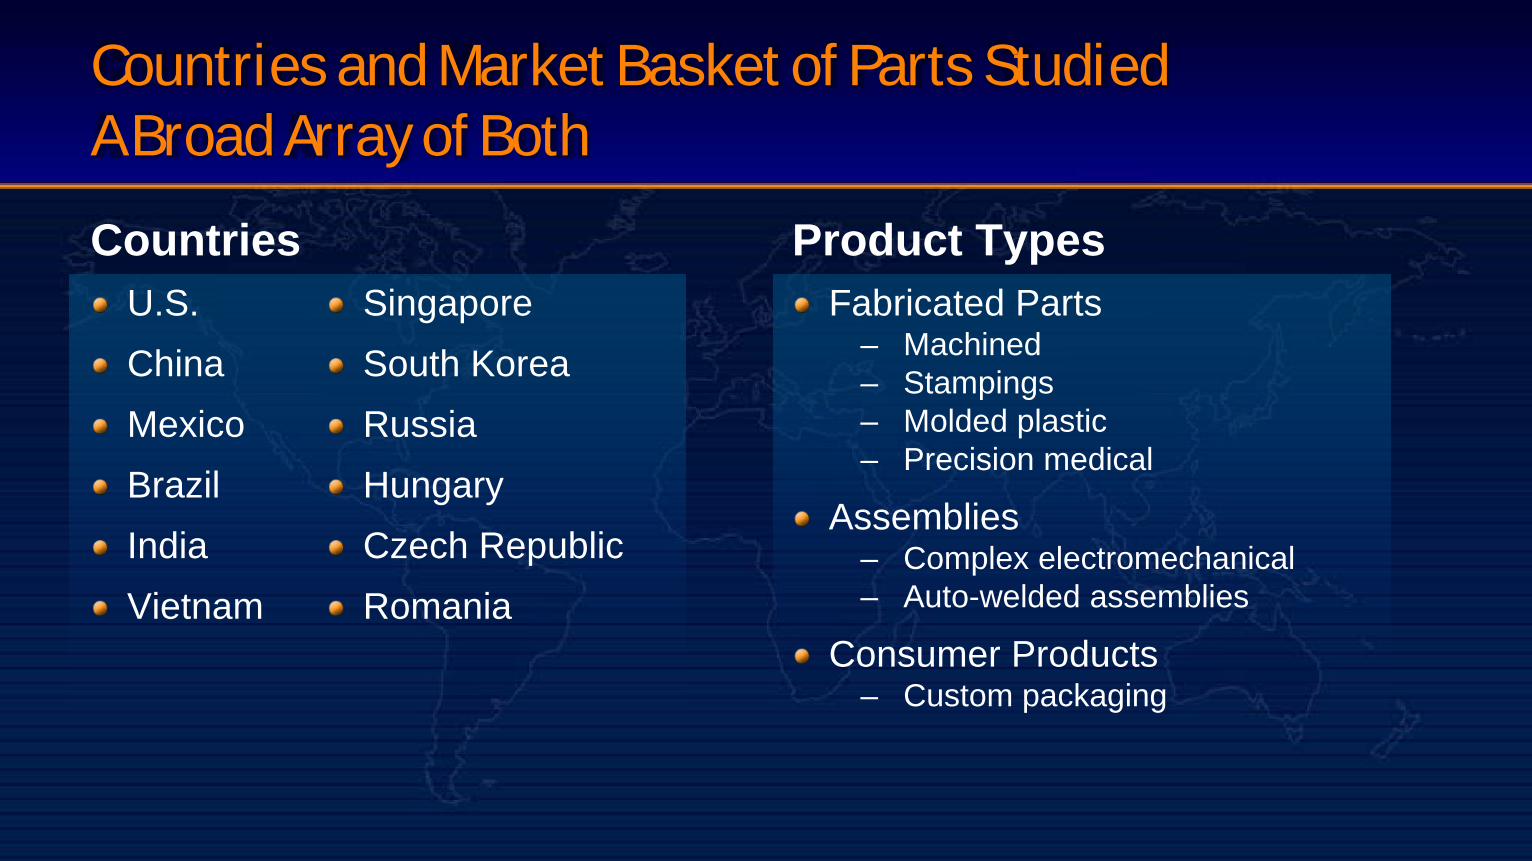
Countries and Market Basket of Parts Studied A Broad Array of Both Countries
U.S. China Mexico Brazil India Vietnam
Product Types Fabricated Parts
– Machined – Stampings – Molded plastic – Precision medical
Assemblies – Complex electromechanical – Auto-welded assemblies
Consumer Products – Custom packaging
Singapore South Korea Russia Hungary Czech Republic Romania
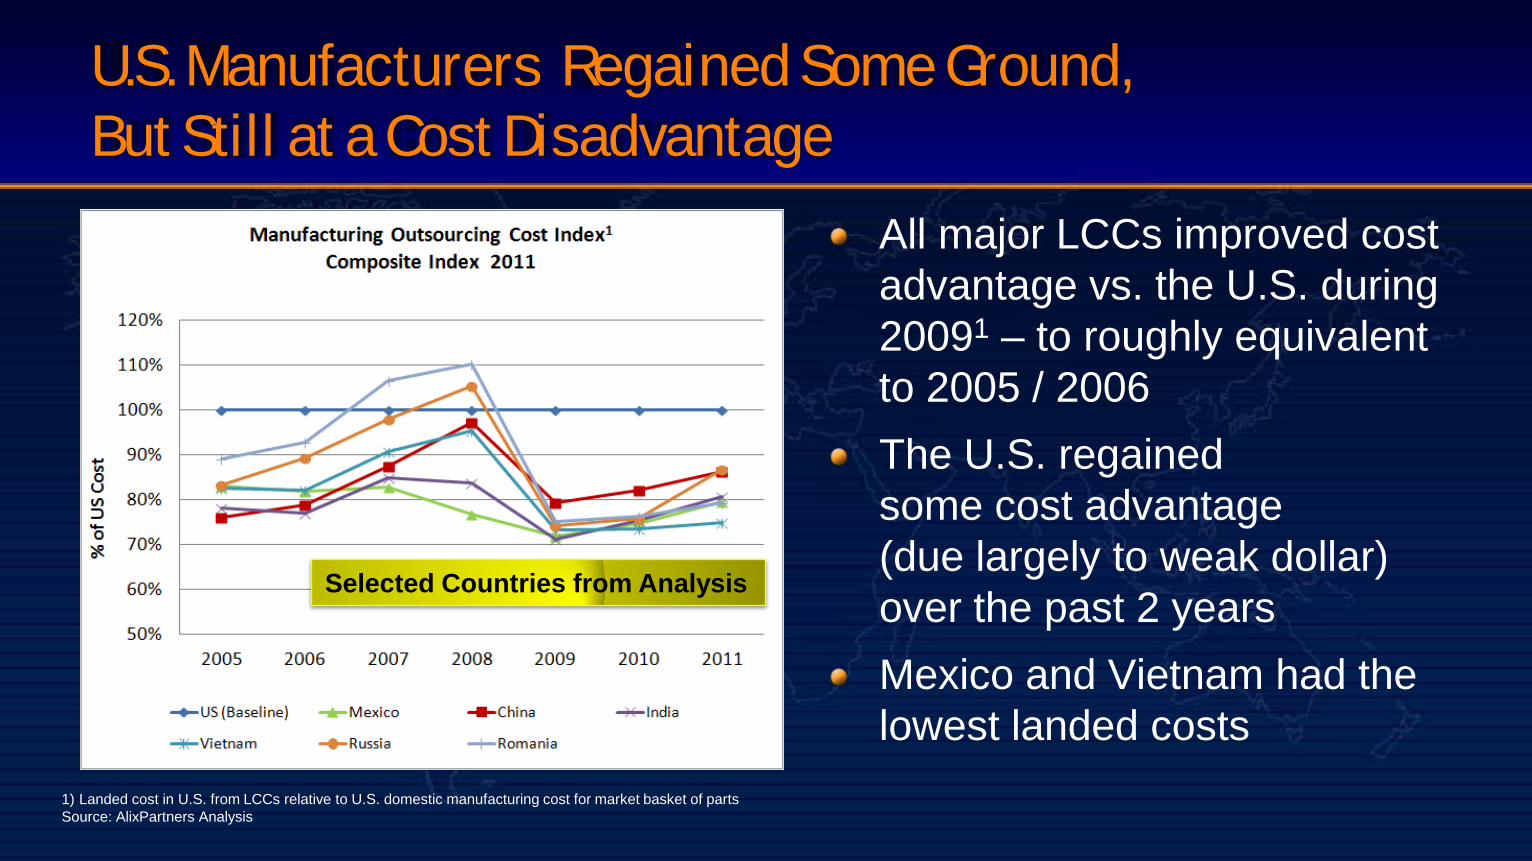
U.S. Manufacturers Regained Some Ground, But Still at a Cost Disadvantage
All major LCCs improved cost advantage vs. the U.S. during 20091 – to roughly equivalent to 2005 / 2006 The U.S. regained some cost advantage (due largely to weak dollar) over the past 2 years Mexico and Vietnam had the lowest landed costs
1) Landed cost in U.S. from LCCs relative to U.S. domestic manufacturing cost for market basket of parts Source: AlixPartners Analysis
Selected Countries from Analysis

Exchange Rates Continue To Be a Key Driver, with Most Currencies Gaining Against the USD in 2011
Most currencies (Eastern Europe, China, India, Mexico) saw gains against the weak U.S. dollar Vietnam’s currency weakened again in 2011 by ~5% against the dollar
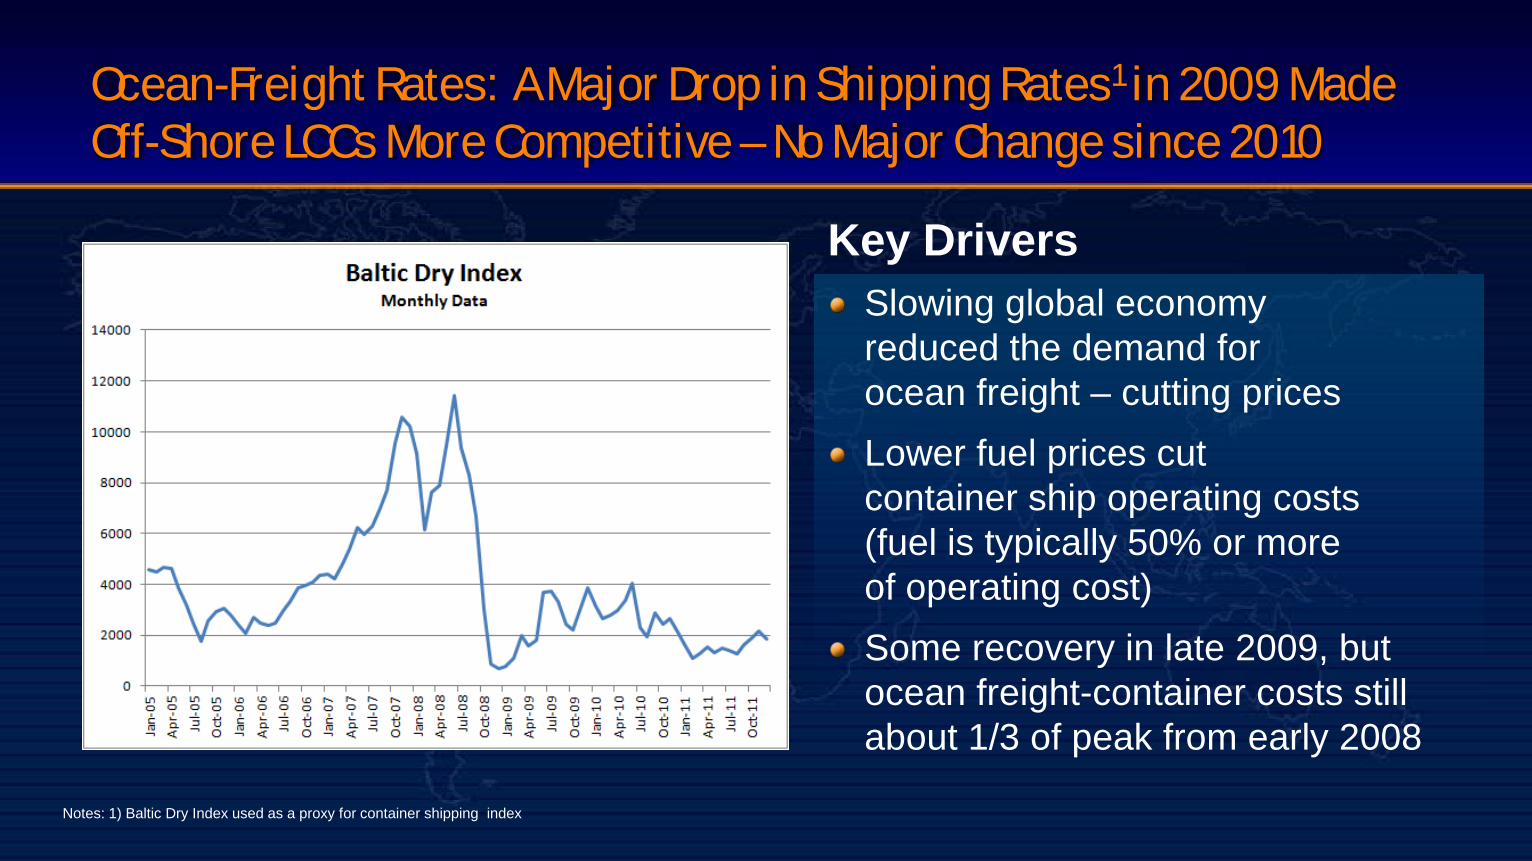
Ocean-Freight Rates: A Major Drop in Shipping Rates1 in 2009 Made Off-Shore LCCs More Competitive – No Major Change since 2010
Key Drivers Slowing global economy reduced the demand for ocean freight – cutting prices Lower fuel prices cut container ship operating costs (fuel is typically 50% or more of operating cost) Some recovery in late 2009, but ocean freight-container costs still about 1/3 of peak from early 2008
Notes: 1) Baltic Dry Index used as a proxy for container shipping index

Contents AlixPartners Global Manufacturing Study and Index
Global Trends and their Implications
Near-shoring Survey
Survey Findings
What this means to US Companies – “Is it time to Near-shore?”

A Combination of Assumptions for China Would Increase the Landed Cost of the China Part to that of the US-Manufactured Part
Annual Increases – China wage rate = 30% – China exchange rate = 5% – China freight rate = 5% – US wage rate = 2.5%
Landed cost of China part equals the cost of a US manufactured part by 2015 for the market basket of parts analyzed
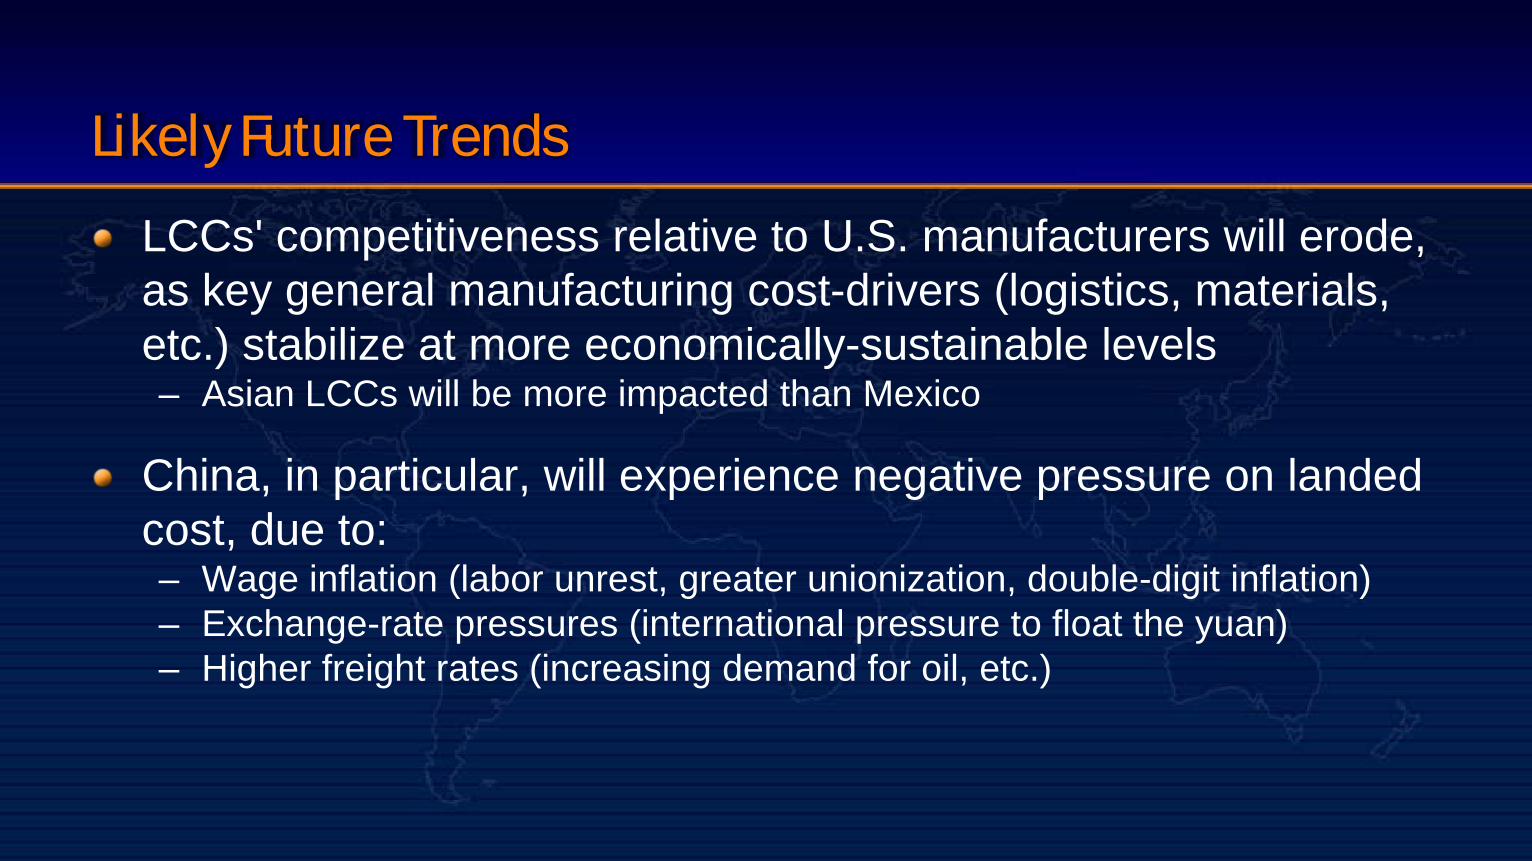
Likely Future Trends LCCs' competitiveness relative to U.S. manufacturers will erode, as key general manufacturing cost-drivers (logistics, materials, etc.) stabilize at more economically-sustainable levels – Asian LCCs will be more impacted than Mexico
China, in particular, will experience negative pressure on landed cost, due to: – Wage inflation (labor unrest, greater unionization, double-digit inflation) – Exchange-rate pressures (international pressure to float the yuan) – Higher freight rates (increasing demand for oil, etc.)

What Does This Mean For Companies’ Supply-Chain Strategies?
Basic considerations – What is the end market? – What is the appropriate risk-reward profile? – What is the demand fluctuation profile?
Increased cash focus – We are seeing more involvement by private equity sponsors – Extended supply chains can tie up excessive cash
Understanding the rapid changes in global cost-competitiveness – The correct strategy is product-dependent – The necessary analysis takes more time, effort and expertise than it has in the past – Analyses needs to be done more frequently to remain relevant – Simple rules / conclusions are usually not optimal
Is it time to Near-shore?
Contents AlixPartners Global Manufacturing Study and Index
Global Trends and their Implications
Near-shoring Survey
Survey Findings
What this means to US Companies – “Is it time to Near-shore?”
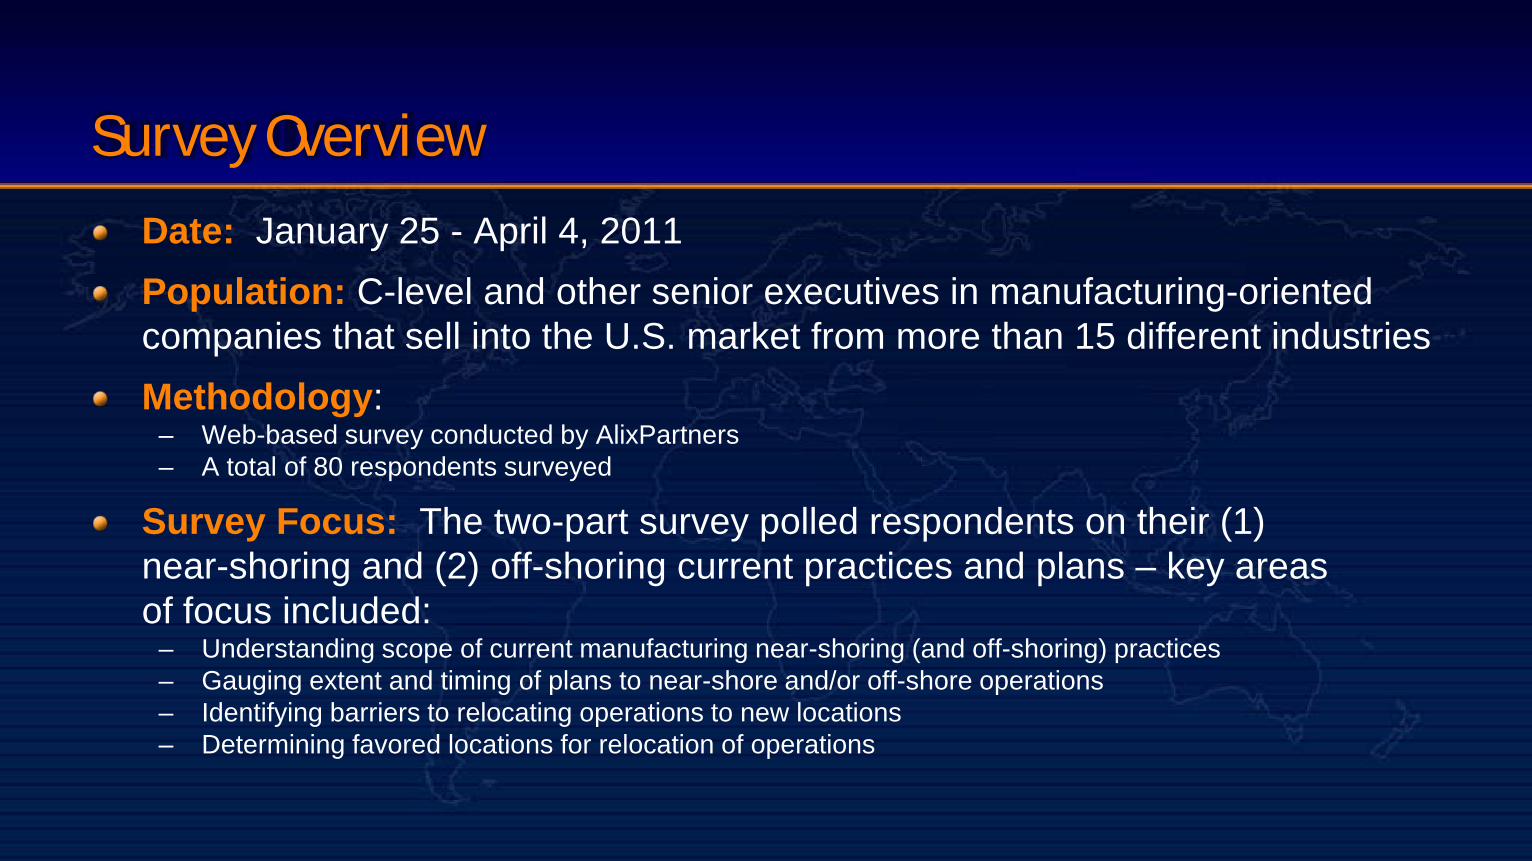
Survey Overview Date: January 25 - April 4, 2011 Population: C-level and other senior executives in manufacturing-oriented companies that sell into the U.S. market from more than 15 different industries Methodology:
– Web-based survey conducted by AlixPartners – A total of 80 respondents surveyed
Survey Focus: The two-part survey polled respondents on their (1) near-shoring and (2) off-shoring current practices and plans – key areas of focus included:
– Understanding scope of current manufacturing near-shoring (and off-shoring) practices – Gauging extent and timing of plans to near-shore and/or off-shore operations – Identifying barriers to relocating operations to new locations – Determining favored locations for relocation of operations
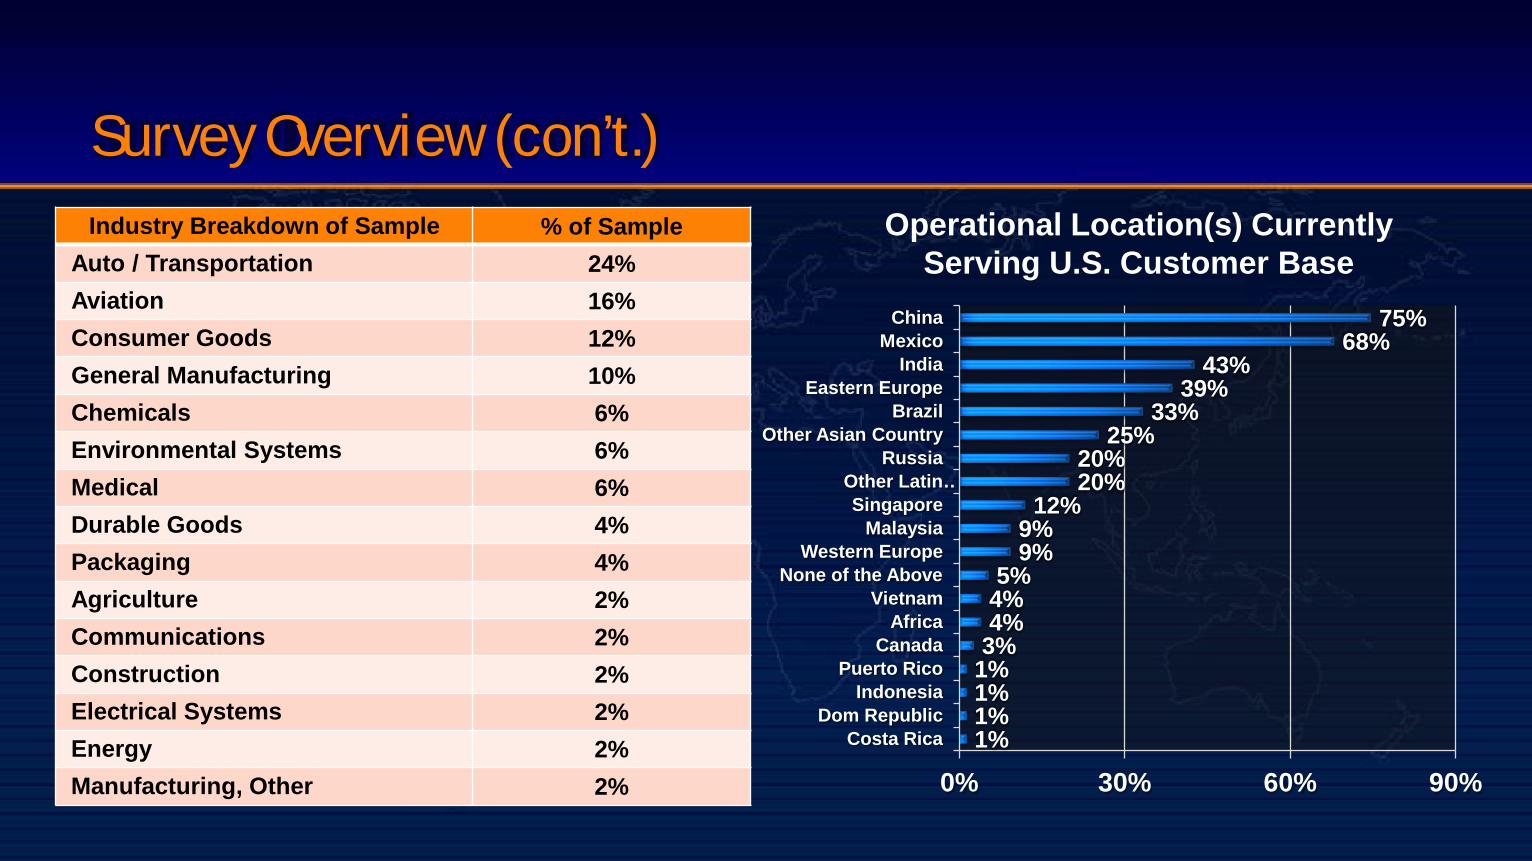
Survey Overview (con’t.) Industry Breakdown of Sample % of Sample
Auto / Transportation 24% Aviation 16% Consumer Goods 12% General Manufacturing 10% Chemicals 6% Environmental Systems 6% Medical 6% Durable Goods 4% Packaging 4% Agriculture 2% Communications 2% Construction 2% Electrical Systems 2% Energy 2% Manufacturing, Other 2%
1% 1% 1% 1% 3% 4% 4% 5%
9% 9%
12% 20% 20%
25% 33%
39% 43%
68% 75%
0% 30% 60% 90%
Costa Rica Dom Republic
Indonesia Puerto Rico
Canada Africa
Vietnam None of the Above
Western Europe Malaysia
Singapore Other Latin …
Russia Other Asian Country
Brazil Eastern Europe
India Mexico
China
Operational Location(s) Currently Serving U.S. Customer Base

87% Own or Operate Operations Outside the U.S.; 83% have Third-Party Operations Relationships Outside the U.S. How many manufacturing operations and / or suppliers do you own / operate in Asia, India, Eastern Europe, Russia, or Latin America (combined)?
How many third-party contract-manufacturing and / or sourcing relationships do you have in Asia, India, Russia, Eastern Europe, or Latin America (combined)?
61%
5%
20% 13%
0%
15%
30%
45%
60%
75%
5 or more 3-4 1-2 None
53%
8%
22% 17%
0%
15%
30%
45%
60%
75%
5 or more 3-4 1-2 None
The majority of those surveyed are consider international companies; less than 20% source strictly from the US.
Contents AlixPartners Global Manufacturing Study and Index
Global Trends and their Implications
Near-shoring Survey
Survey Findings
What this means to US Companies – “Is it time to Near-shore?”
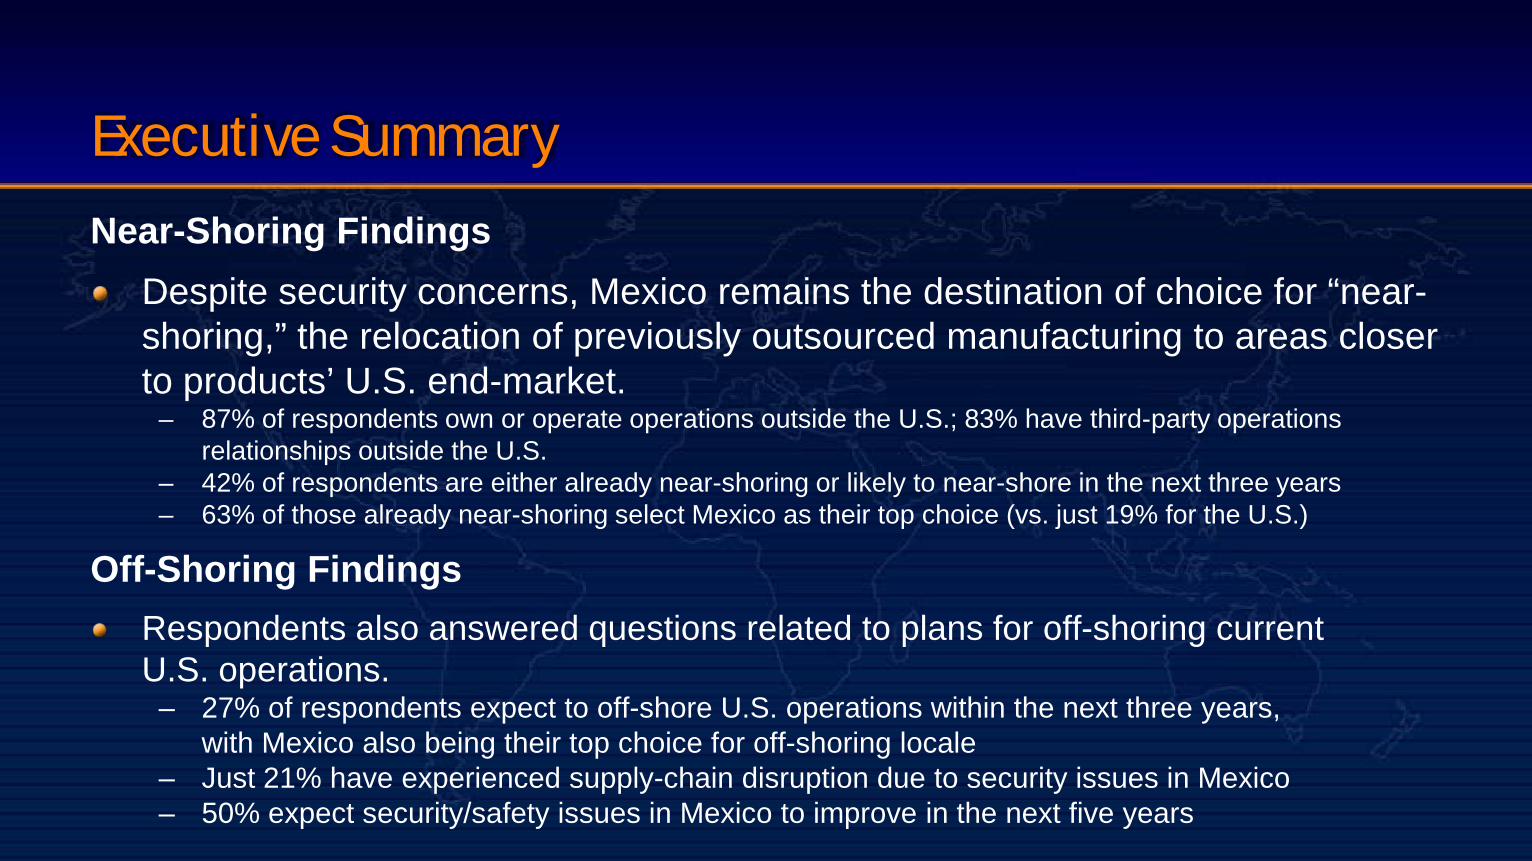
Executive Summary Near-Shoring Findings
Despite security concerns, Mexico remains the destination of choice for “near-shoring,” the relocation of previously outsourced manufacturing to areas closer to products’ U.S. end-market.
– 87% of respondents own or operate operations outside the U.S.; 83% have third-party operations relationships outside the U.S.
– 42% of respondents are either already near-shoring or likely to near-shore in the next three years – 63% of those already near-shoring select Mexico as their top choice (vs. just 19% for the U.S.)
Off-Shoring Findings Respondents also answered questions related to plans for off-shoring current U.S. operations.
– 27% of respondents expect to off-shore U.S. operations within the next three years, with Mexico also being their top choice for off-shoring locale
– Just 21% have experienced supply-chain disruption due to security issues in Mexico – 50% expect security/safety issues in Mexico to improve in the next five years

42% Say They Are Either Already Near-Shoring or Will Be Within the Next Three Years… If near-shoring is a consideration, what is your time horizon for near-shoring
Asian / Indian operations to the Americas, including Latin America?
54%
9% 12% 21%
1% 3% 0%
15% 30% 45% 60% 75%
Not under consideration
In process, or completed within last three years
1 year 2-3 years 4-5 years 5+ years
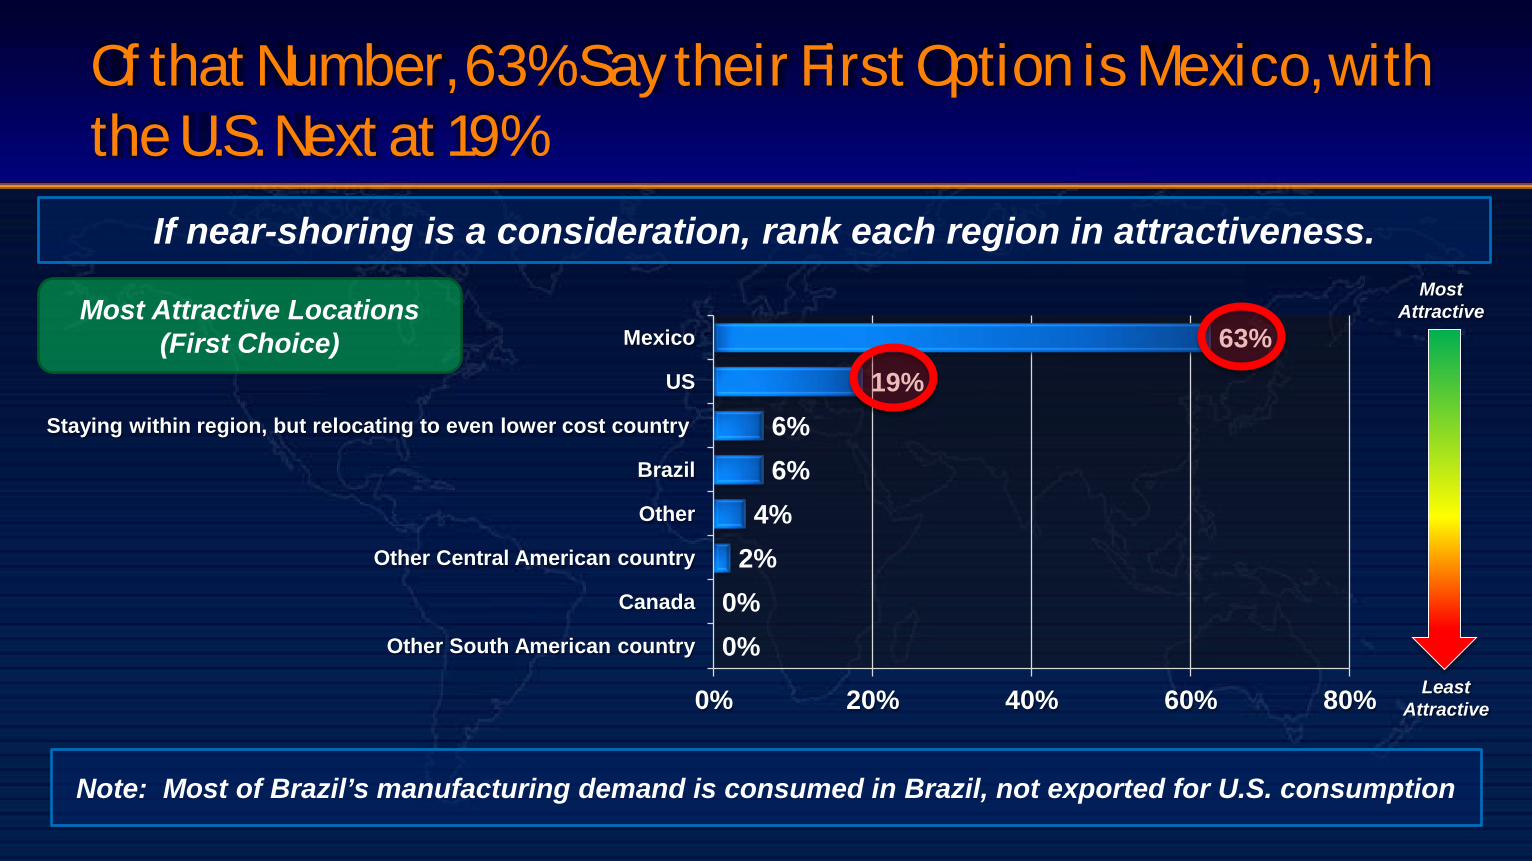
Of that Number, 63% Say their First Option is Mexico, with the U.S. Next at 19%
If near-shoring is a consideration, rank each region in attractiveness.
0% 0%
2% 4%
6% 6%
19% 63%
0% 20% 40% 60% 80%
Other South American country
Canada
Other Central American country
Other
Brazil
Staying within region, but relocating to even lower cost country
US
Mexico
Note: Most of Brazil’s manufacturing demand is consumed in Brazil, not exported for U.S. consumption
Most Attractive
Least Attractive
Most Attractive Locations (First Choice)

The Most Attractive Advantages Expected From Near-Shoring: Lower Freight Costs and Improved Speed to Market
Rank the advantages you expect from a near-shoring decision.
11%
16%
18%
25%
30%
0% 10% 20% 30% 40%
Improved cultural alignment with North American managers
“Time-zone advantages” (easier management coordination, etc.)
Lower inventory (in-transit) costs
Improved speed-to-market
Lower freight costs
Rising fuel prices and a renewed focus on working capital has increased the attractiveness of Near-Shoring
Most Attractive
Least Attractive
Most Attractive Locations (First Choice)

37% Are in the Process or Have Completed Off-Shoring Within the Last Three Years; 27% Expect to Off-Shore Within Three Years...
What is your time horizon for off-shoring operations and / or supply outside the U.S.?
37%
15% 12% 7%
2%
28%
0%
15%
30%
45%
In process, or completed within last three years
1 year 2-3 years 4-5 years 5+ years Not under consideration

Of that Number, 43% Say their First Option is Mexico; No BRIC Country Higher than 30%
If off-shoring is an option, rank each region in attractiveness. (1=most attractive; 11=least attractive)
3%
3%
3%
5%
14%
30%
43%
0% 10% 20% 30% 40% 50%
Brazil
Canada
Other
Eastern Europe
India
China
Mexico
Most Attractive
Least Attractive
Preferred Location (% of Sample)

Primary Concerns Associated with Off-Shoring: Safety / Security of Operations and Extension of the Supply Chain…
Rank the concerns you expect from an Off-Shoring decision. (1=most concerned; 8=least concerned)
38%
17% 13% 12% 10% 8%
2% 0%
15%
30%
45%
Safety / Security
Extension of Supply Chain
Performance Deterioration
Political Stability
Loss of Direct Control
Language / Cultural Barriers
Customs / tariffs
Most Concern Least Concern
Top Concern for Off-Shoring Decision (% of Sample)

But, Just 19% of Respondents Have Experienced Supply-Chain Disruption Due to Security Issues in Mexico
Have you experienced any supply chain disruption due to security issues in Mexico?
59%
22% 19%
0% 10% 20% 30% 40% 50% 60% 70%
No Not applicable Yes
Experienced Supply-Chain Disruption?
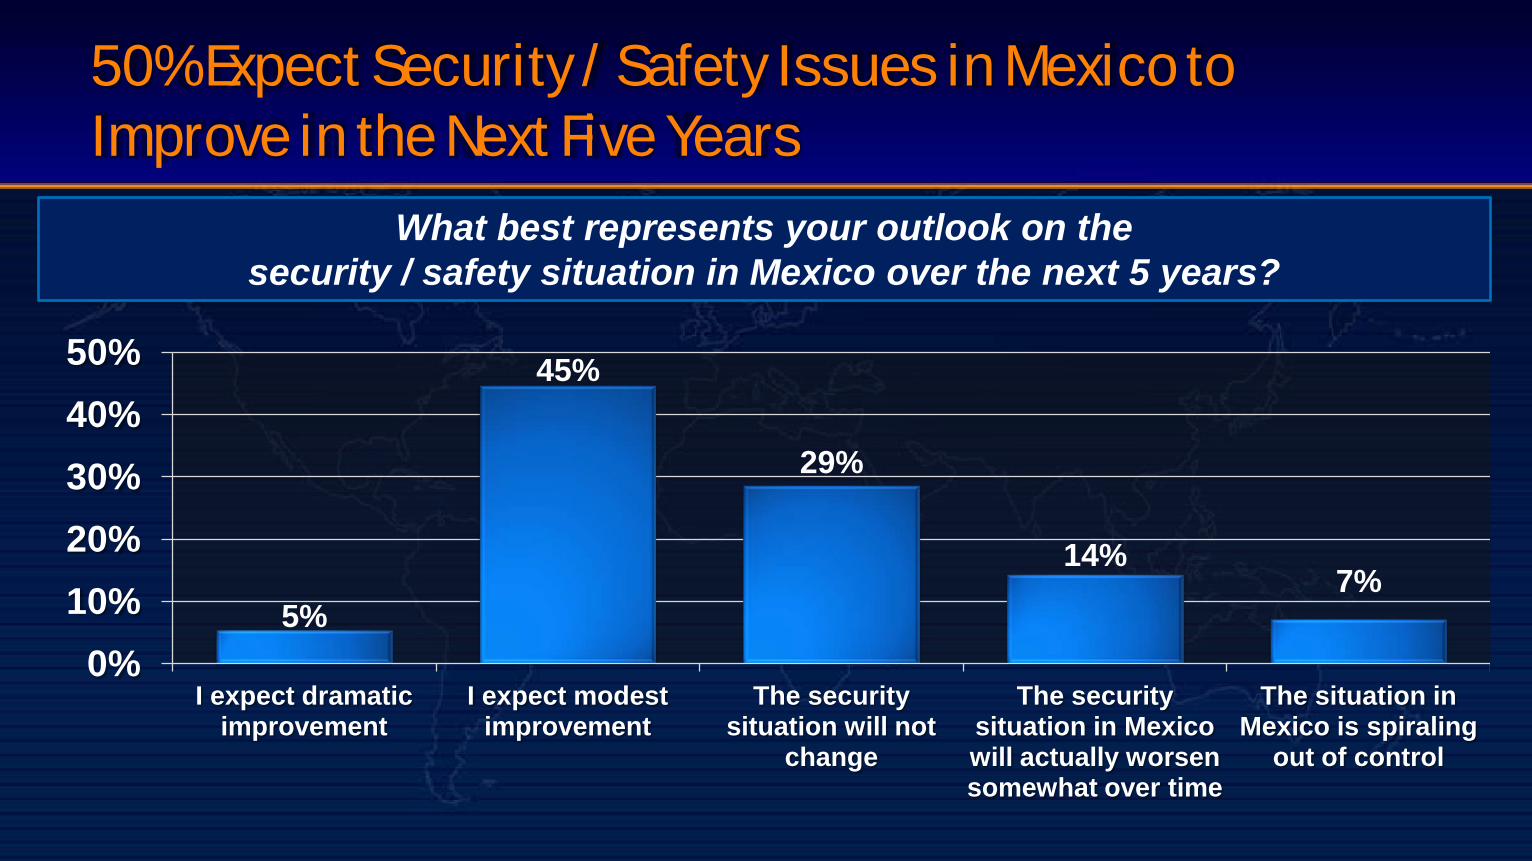
50% Expect Security / Safety Issues in Mexico to Improve in the Next Five Years
What best represents your outlook on the security / safety situation in Mexico over the next 5 years?
5%
45%
29%
14% 7%
0% 10% 20% 30% 40% 50%
I expect dramatic improvement
I expect modest improvement
The security situation will not
change
The security situation in Mexico will actually worsen somewhat over time
The situation in Mexico is spiraling
out of control
Contents AlixPartners Global Manufacturing Study and Index
Global Trends and their Implications
Near-shoring Survey
Survey Findings
What this means to US Companies – “Is it time to Near-shore?”
Is It Time To “Near-Shore”? From AlixPartners observations, most US companies did not make big supply-chain changes during or immediately after the global recession – High level of uncertainty – was not clear when economy would hit bottom – In many cases, the infrastructure (plants, supply base, etc.) needed to be rebuilt to bring
work back from Asia to the U.S. or Mexico – China is now the second-largest economy in the world, and still very attractive as a target
for long-term growth
Manufacturing in China may not be the best solution for certain products – Continued wage and freight cost pressure – Mexico had the most attractive landed cost (to U.S.) for our market basket of parts
We are seeing an uptick in near-shoring activity, with strong bias towards Mexico1
Notes: 1) AlixPartners Near Shoring Survey

Global Locations
AlixPartners is a Global Firm of Senior Business and Consulting Professionals That Specializes in Improving Corporate Financial and Operational Performance, Executing Corporate Turnarounds
and Providing Litigation Consulting and Forensic Accounting Services When It Really Matters—in Urgent, High-impact Situations
Dallas 2101 Cedar Springs Road
Suite 1100 Dallas, TX 75201
214.647.7500
London 20 North Audley Street
London W1K 6WE United Kingdom
+44.20.7098.7400
Chicago 300 N. LaSalle Street
Suite 1900 Chicago, IL 60654
312.346.2500
Detroit 2000 Town Center
Suite 2400 Southfield, MI 48075
248. 358.4420
Los Angeles 515 S. Flower Street
Suite 3050 Los Angeles, CA 90071
213.437.7100
New York 40 West 57th Street
New York, NY 10019 212.490.2500
Milan Corso Matteotti 9
20121 Milan Italy
+39.02.360.12000
Munich Mauerkircherstr. 1 a
81679 Munchen Germany
+49.89.20.30.40.00
Düsseldorf Königsallee 59 a 40215 Düsseldorf
Germany +49.211.97.55.10.00
Tokyo Marunouchi Building 33F
2-4-1 Marunouchi Chiyoda-ku
Tokyo 100-6333 Japan +81.3.5533.4800
Shanghai Suite 6111
Plaza 66 Building I 1266 Nan Jing West Road Shanghai, 200040 China
+8621.6171.7555
Paris 49/51 Avenue George V
75008 Paris France
+33.1.76.74.72.00
San Francisco 4 Embarcadero Center 31st Floor, Suite 3110
San Francisco, CA 94111 415.848.0283
Washington, DC 1602 L Street, NW
Suite 300 Washington, DC 20036
202.756.9000
Dubai Gate Village 10, Level 03
P.O. Box 125115 Dubai Intl Financial Centre
Dubai, United Arab Emirates +971.4.401.9246