permian basin primer target energy limited
TRANSCRIPT
PERMIAN BASIN PRIMER TARGET ENERGY LIMITED MAY 2013
DISCLAIMER AND FORWARD-LOOKING STATEMENTS
2
This Presentation is provided on the basis that none of the Company nor its respective officers, shareholders, related bodies corporate, partners, affiliates, employees, representatives and advisers make any representation or warranty (express or implied) as to the accuracy, reliability, relevance or completeness of the material contained in the Presentation and nothing contained in the Presentation is, or may be relied upon as, a promise, representation or warranty, whether as to the past or the future. The Company hereby excludes all warranties that can be excluded by law. All persons should consider seeking appropriate professional advice in reviewing the Presentation and all other information with respect to the Company and evaluating the business, financial performance and operations of the Company. Neither the provision of the Presentation nor any information contained in the Presentation or subsequently communicated to any person in connection with the Presentation is, or should be taken as, constituting the giving of investment advice to any person.
Certain statements in this presentation contain ‘forward-looking statements’ including, without limitation to: expectations, beliefs, plans and objectives regarding production and exploration activities. Any matters that are not historical facts are forward-looking and accordingly, involve estimates, assumptions, risks and uncertainties and other factors discussed in our most recently lodged Annual Report our website, http://www.targetenergy.com.au, and in our other public documents and press releases. These forward-looking statements are based on Target Energy Limited’s (“Target”) current expectations, estimates and projections about the company, its industry, its management’s beliefs and certain assumptions made by management. No assurance can be given that such expectations, estimates or projections will prove to have been correct. A number of factors could cause actual results to differ materially from the projections, anticipated results or other expectations expressed in this presentation, including, Target’s ability to meet its production targets, successfully manage its capital expenditures and to complete, test and produce the wells and prospects identified in this presentation; to successfully plan, secure necessary government approvals, finance and to achieve its production and budget expectations on its projects.
Whenever possible, these ‘forward-looking statements’ are identified by words such as “expects,” “believes,” “anticipates,” “projects,” and similar phrases. Because such statements involve risks and uncertainties, Target’s actual results and performance may differ materially from the results expressed or implied by such forward-looking statements. Given these risks and uncertainties, you are cautioned not to place undue reliance on such forward-looking statements, which speak only as of the date hereof. Unless legally required, we assume no duty to update these statements as of any future date. However, you should review carefully reports and documents that Target lodges periodically with the Australian Securities Exchange. NOTE: In accordance with ASX Listing Rules, any hydrocarbon reserves and/or drilling update information in this report has been reviewed and signed off by Mr Laurence Roe, B Sc, Managing Director of Target Energy, who is a member of the Society of Exploration Geophysicists and has over 30 years experience in the sector. He consents to that information in the form and context in which it appears.

WHERE IS THE PERMIAN BASIN?
3
The West Texas Permian Basin is the largest hydrocarbon basin in the US, covering 52 counties and over 75,000 square miles.
Map of US Lower 48 States
Midland Basin (TEX)
Delaware Basin
Val Verde Basin
Permian Basin
Regional Map of Permian Basin 1
Source: Apache Energy Corporation
PERMIAN BASIN – A TIGHT OIL ‘RESOURCE PLAY’
4
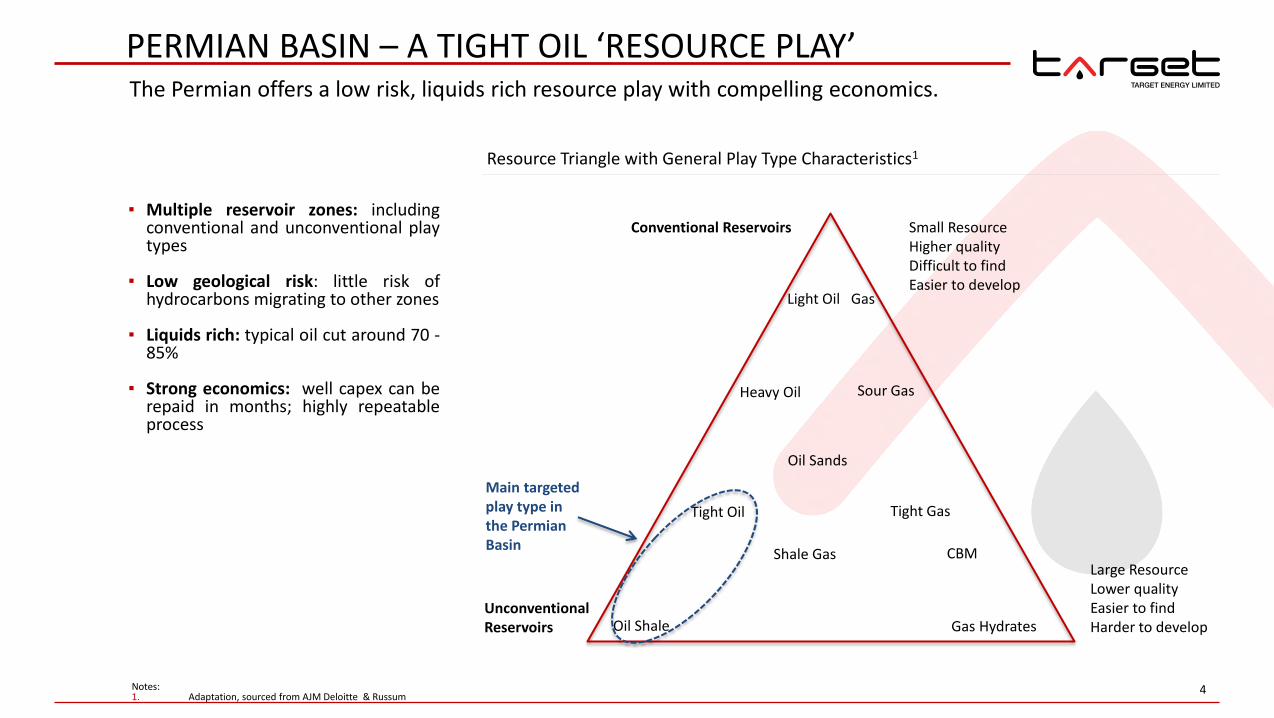
The Permian offers a low risk, liquids rich resource play with compelling economics.
▪ Multiple reservoir zones: including conventional and unconventional play types
▪ Low geological risk: little risk of hydrocarbons migrating to other zones
▪ Liquids rich: typical oil cut around 70 - 85%
▪ Strong economics: well capex can be repaid in months; highly repeatable process
Conventional Reservoirs
Unconventional Reservoirs
Heavy Oil Sour Gas
Oil Sands
Tight Oil Tight Gas
Oil Shale
Shale Gas
Gas Hydrates
CBM
Resource Triangle with General Play Type Characteristics1
Main targeted play type in the Permian Basin
Small Resource Higher quality Difficult to find Easier to develop
Large Resource Lower quality Easier to find Harder to develop
Light Oil Gas
Notes: 1. Adaptation, sourced from AJM Deloitte & Russum

PERMIAN BASIN – ACTIVITY AND SUCCESS
5
Permian Basin oil production started in the 1920s, today the basin produces more than double Australia’s annual oil output.1
▪ Historic production: 29 billion barrels of oil and 75 trillion cubic feet of gas
▪ Current daily production: 1.3 million barrels of oil and 4 billion cubic feet of gas2
▪ Relative production: Permian Basin oil production is more than double Australia’s oil production and the gap is expected to widen1
▪ Production growth: oil production is expected to grow to 1.8
million barrels per day (1.8 mmbopd) by 20163
▪ Gas quality: gas produced is often liquids rich, attracting substantial premiums to the US ‘dry gas’ (methane) price
▪ Reserve growth: 29% of estimated US oil reserve growth in the US is expected to come from the Permian Basin 4
▪ Current activity: 397 drilling rigs are operating in the
Permian Basin, compared to Australia’s total rig count of 21 rigs6
Average Daily Oil Production - Australia vs. US Permian Basin1
Notes: 1. US EIA, HPDI, LLC, BP and APPEA - figures relate to 2011 production. 2. Bentek, University of Texas estimates 3. Bentek estimates 4. Hart Energy 5. North American Shale Quarterly 6. Baker Hughes rig count
0
200
400
600
800
1,000
1,200
2008 2009 2010 2011
mb
op
d
Australia Permian Basin
0
200
400
600
800
1,000
1,200
1,400
1,600
1,800
2008 2009 2010 2011 2012 2013 2014 2015 2016 2017 2018 2019 2020
mb
oep
d
Oil and Condensate Natural Gas Liquids Gas
Permian Basin Tight Oil and Shale Oil Production Forecast5
PERMIAN BASIN – MULTIPLE TARGET ZONES
6
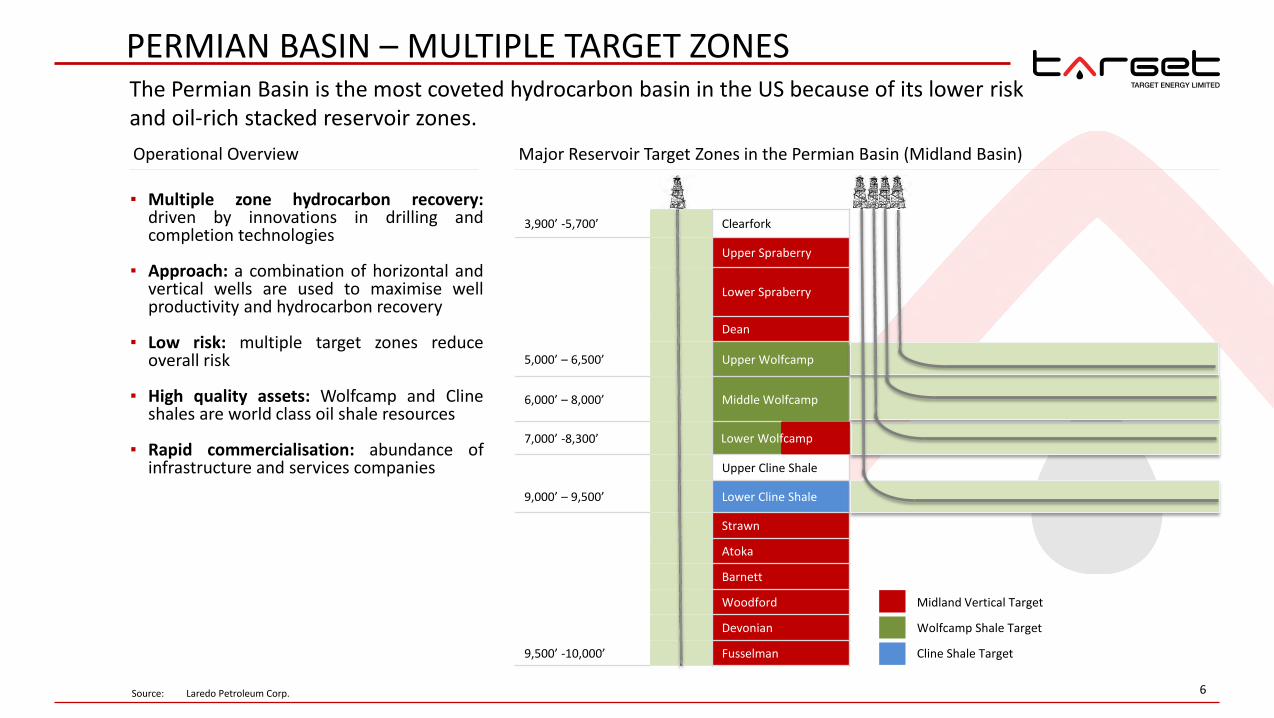
The Permian Basin is the most coveted hydrocarbon basin in the US because of its lower risk and oil-rich stacked reservoir zones.
3,900’ -5,700’ Clearfork
Upper Spraberry
Lower Spraberry
Dean
5,000’ – 6,500’ Upper Wolfcamp
6,000’ – 8,000’ Middle Wolfcamp
7,000’ -8,300’
Upper Cline Shale
9,000’ – 9,500’ Lower Cline Shale
Strawn
Atoka
Barnett
Woodford
Devonian
9,500’ -10,000’ Fusselman
Lower Wolfcamp
Midland Vertical Target
Wolfcamp Shale Target
Cline Shale Target
Major Reservoir Target Zones in the Permian Basin (Midland Basin)
▪ Multiple zone hydrocarbon recovery: driven by innovations in drilling and completion technologies
▪ Approach: a combination of horizontal and
vertical wells are used to maximise well productivity and hydrocarbon recovery
▪ Low risk: multiple target zones reduce overall risk
▪ High quality assets: Wolfcamp and Cline shales are world class oil shale resources
▪ Rapid commercialisation: abundance of
infrastructure and services companies
Operational Overview
Source: Laredo Petroleum Corp.
PERMIAN BASIN – ECLIPSES OTHER US BASINS
7 Notes: 1. Credit Suisse estimates 2. Adaptation of table presented by Pioneer Natural Resources
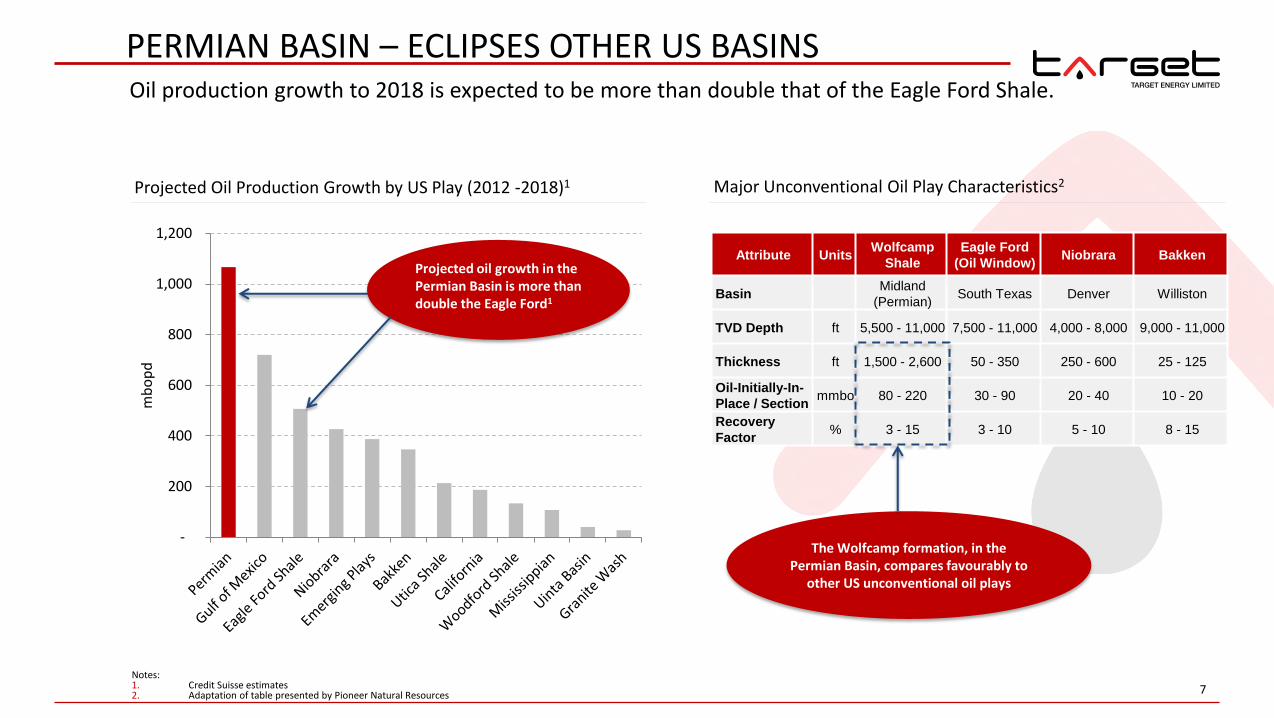
Oil production growth to 2018 is expected to be more than double that of the Eagle Ford Shale.
-
200
400
600
800
1,000
1,200
mb
op
d
Projected oil growth in the Permian Basin is more than double the Eagle Ford1
Projected Oil Production Growth by US Play (2012 -2018)1
Attribute Units Wolfcamp
Shale
Eagle Ford
(Oil Window) Niobrara Bakken
Basin Midland
(Permian) South Texas Denver Williston
TVD Depth ft 5,500 - 11,000 7,500 - 11,000 4,000 - 8,000 9,000 - 11,000
Thickness ft 1,500 - 2,600 50 - 350 250 - 600 25 - 125
Oil-Initially-In-
Place / Section mmbo 80 - 220 30 - 90 20 - 40 10 - 20
Recovery
Factor % 3 - 15 3 - 10 5 - 10 8 - 15
Major Unconventional Oil Play Characteristics2
The Wolfcamp formation, in the Permian Basin, compares favourably to
other US unconventional oil plays
PERMIAN BASIN – COMPELLING ECONOMICS
8
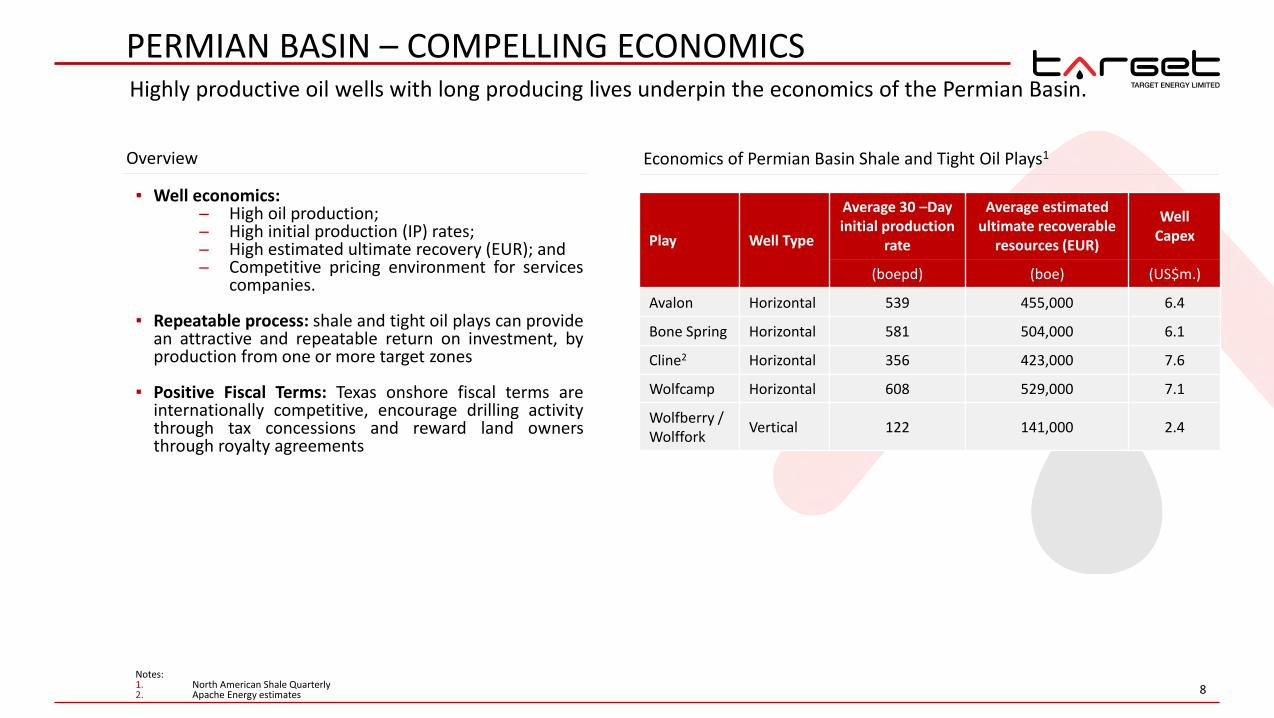
Highly productive oil wells with long producing lives underpin the economics of the Permian Basin.
▪ Well economics: ─ High oil production; ─ High initial production (IP) rates; ─ High estimated ultimate recovery (EUR); and ─ Competitive pricing environment for services
companies.
▪ Repeatable process: shale and tight oil plays can provide an attractive and repeatable return on investment, by production from one or more target zones
▪ Positive Fiscal Terms: Texas onshore fiscal terms are internationally competitive, encourage drilling activity through tax concessions and reward land owners through royalty agreements
Play Well Type
Average 30 –Day initial production
rate
Average estimated ultimate recoverable
resources (EUR)
Well Capex
(boepd) (boe) (US$m.)
Avalon Horizontal 539 455,000 6.4
Bone Spring Horizontal 581 504,000 6.1
Cline2 Horizontal 356 423,000 7.6
Wolfcamp Horizontal 608 529,000 7.1
Wolfberry / Wolffork
Vertical 122 141,000 2.4
Economics of Permian Basin Shale and Tight Oil Plays1
Notes: 1. North American Shale Quarterly 2. Apache Energy estimates
Overview
PERMIAN BASIN – A BLUE CHIP BASIN
9
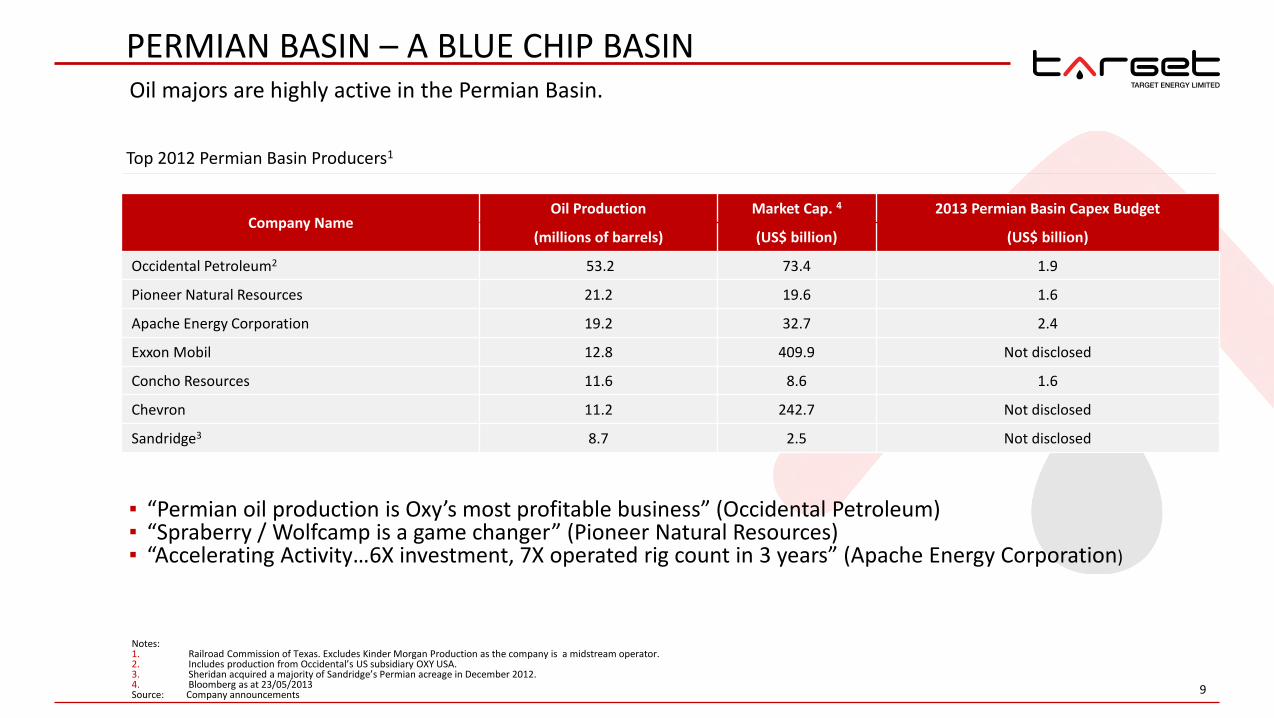
Oil majors are highly active in the Permian Basin.
Notes: 1. Railroad Commission of Texas. Excludes Kinder Morgan Production as the company is a midstream operator. 2. Includes production from Occidental’s US subsidiary OXY USA. 3. Sheridan acquired a majority of Sandridge’s Permian acreage in December 2012. 4. Bloomberg as at 23/05/2013 Source: Company announcements
Company Name Oil Production Market Cap. 4 2013 Permian Basin Capex Budget
(millions of barrels) (US$ billion) (US$ billion)
Occidental Petroleum2 53.2 73.4 1.9
Pioneer Natural Resources 21.2 19.6 1.6
Apache Energy Corporation 19.2 32.7 2.4
Exxon Mobil 12.8 409.9 Not disclosed
Concho Resources 11.6 8.6 1.6
Chevron 11.2 242.7 Not disclosed
Sandridge3 8.7 2.5 Not disclosed
Top 2012 Permian Basin Producers1
▪ “Permian oil production is Oxy’s most profitable business” (Occidental Petroleum) ▪ “Spraberry / Wolfcamp is a game changer” (Pioneer Natural Resources) ▪ “Accelerating Activity…6X investment, 7X operated rig count in 3 years” (Apache Energy Corporation)

TARGET’S POSITION IN THE PERMIAN BASIN
10
Target is a Permian Basin focused company and is committed to building upon a high quality portfolio.
Gross Acres 3,492
Net Acres 2,095
Working Interest
60%
Net Production
320 boepd 1
Reserves Expected H2 2013
Planned 2013 Work Program
4 low-risk step out wells commencing August 2013
Ongoing petrophysical analysis
Comments Fairway Project is in the heart of the Midland Basin
Oil majors in adjacent acreage
Target’s relationships with the Midland community has afforded the company multiple bolt-on acreage opportunities
Notes: 1. Pre royalty interest to land owners
Howard Glasscock Field (1925)
1 mile
1.6 km
Howard County Glasscock County
Target acreage Target acquiring acreage Post 2009 Producer Proposed well location
Map of Target’s Fairway Project in the Midland Basin
BOA 12 #1
Darwin #1 & #2
Sydney #1

PERMIAN VALUATIONS - TRANSACTION COMPARABLES
11
The Permian M&A market is robust with valuations increasing for both producing and non-producing acreage as a result of drilling success and extensive basin activity.
-
50,000
100,000
150,000
200,000
250,000
US$
Transaction Enterprise Value (EV) / barrel of oil equivalent per day (boepd) 1
▪ Permian Basin valuations are rising generally but particularly in the Midland Basin with greater horizontal activity in the Wolfcamp and Cline shales
▪ The value of mergers and acquisitions (M&A) in the
Permian Basin in 2012 surpassed all other onshore basins.
▪ Permian Basin M&A outlook is strong as resource plays continue to be de-risked through extensive drilling
Median US$ 110,708 / boepd
Central Basin Platform Midland Basin
25%
14%
10% 10%
9%
7%
25%
Permian Basin Mid -Continent Bakken Gulf Coast Eagle Ford Utica Other
2012 US Onshore Mergers & Acquisitions 1
Notes: 1. RBC Richardson Barr. US onshore M&A includes transactions over US$100m. 2. Gulf Coast relates to Arkansas, Louisiana and other Texas plays. 3. Transaction values often include a premium for control.
2
Overview

DEFINED TERMS
12
DEFINED TERMS “$” or “US$” means United States (US) dollars, unless otherwise stated. “B” or “b” prefix means billion “bbl/s” means barrel/ s “bopd” or “boepd” means barrels of oil per day and barrels of oil equivalent per day, respectively “boe” means barrels of oil equivalent. Target reports boe using a gas to oil conversion based on equivalent thermal energy , i.e. 6000 cubic feet of gas = 1 barrel of oil “M” or “m” prefix means thousand “mcfgpd” means thousand cubic feet of gas per day “MM” or “mm” prefix means million “NGL” means natural gas liquids. “NRI” means net revenue interest (after deduction of royalties) “pd” or “/d” suffix means per day “PV10” or “NPV10” means, unless otherwise stated, the net present value of future net revenue, after deductions for operating and capital expenses, production
taxes and ad valorem taxes, but before corporate income tax and corporate overheads, using a real, pre-tax discount rate of 10%. “scf” means standard cubic feet “WI” means working interest within leases
13
TARGET ENERGY LIMITED AUSTRALIA 6 RICHARDSON STREET, SUITE 5 WEST PERTH, WA 6005 T: +61 8 9476 9000 | F: +61 8 9476 9099 USA 1900 ST JAMES PLACE, SUITE 425 HOUSTON, TEXAS 77056 T:+1 713 275 9800 | F: +1 713 275 0999