performance reporting essentials
TRANSCRIPT
A Prophix white paper
Accelerate Your Business: Performance Reporting Essentials
Reporting is a vital means of communicating internally and externally between key financiers and other stakeholders of an organization. The ability to compile timely reports with accurate data is an essential component to operating a successful business, and can spawn a myriad of other activities aimed at meeting corporate objectives, including forecasting and predictive analytics.
2
Inside this documentExecutive summary
Performance Reporting Essentials
End-to-end Reporting Solution
Visual Reporting Capabilities
Stakeholder Involvement
Secure Interface
Integration Capabilities
From Reporting to Data Analysis
Enabling a Rolling Forecast
Audit Control
Full Software Solution
About Prophix
3
6
6
8
9
10
11
11
13
14
14
16
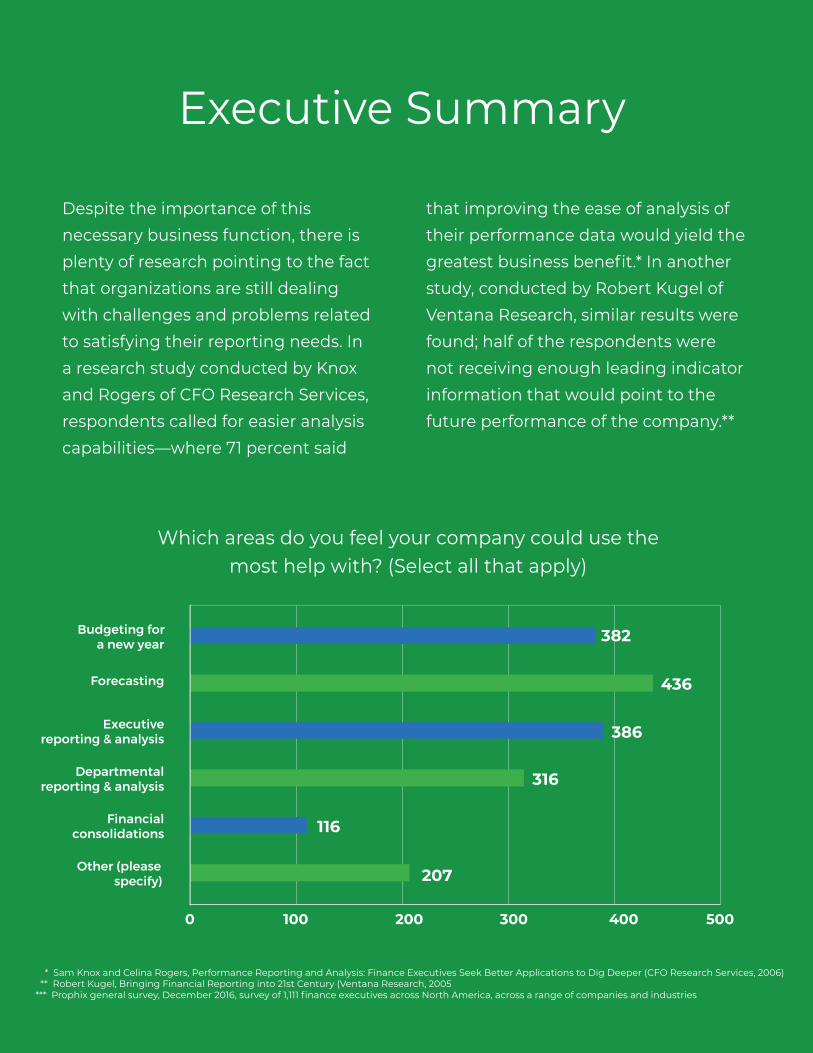
Despite the importance of this necessary business function, there is plenty of research pointing to the fact that organizations are still dealing with challenges and problems related to satisfying their reporting needs. In a research study conducted by Knox and Rogers of CFO Research Services, respondents called for easier analysis capabilities—where 71 percent said
that improving the ease of analysis of their performance data would yield the greatest business benefit.* In another study, conducted by Robert Kugel of Ventana Research, similar results were found; half of the respondents were not receiving enough leading indicator information that would point to the future performance of the company.**
Executive Summary
Which areas do you feel your company could use themost help with? (Select all that apply)
* Sam Knox and Celina Rogers, Performance Reporting and Analysis: Finance Executives Seek Better Applications to Dig Deeper (CFO Research Services, 2006) ** Robert Kugel, Bringing Financial Reporting into 21st Century (Ventana Research, 2005 *** Prophix general survey, December 2016, survey of 1,111 finance executives across North America, across a range of companies and industries
A recent Prophix survey (Prophix General Survey, December 2016, survey of 1,111 finance executives across North America, across a range of companies and industries) of finance executives across North America showed similar results, along with a desire to streamline and automate the reporting process to enable more analysis vs. production.*** These research papers, along with findings from the Prophix survey, point out problems that organizations are experiencing when examining the performance of their company. Specifically, reporting corporate results and the ability to analyze this information. In addition to the analysis issue, activities relating to planning, accurate consolidation, and budget projections are often wasted opportunities to effect business change. The old adage “garbage in, garbage out” comes to mind when reporting inefficiencies exist. Reporting is only the starting point, and when companies spend time working out reporting issues, they often spend less time, or no time at all performing analysis, and planning their next course of action
Many of the difficulties companies endure stem from the fact that numerous organizations are still using reporting and planning systems that are not conducive to their growing needs, separate systems, or systems that do not evolve to easily accommodate add-on functions such as ad hoc analysis, forecasting, or personnel planning. For example, Microsoft Excel is a flexible tool that is easily deployable to stakeholders, and therefore, continues to be a tool used to create various financial and non-financial reports and analysis. The Prophix survey found that 79% of respondents are using Excel to create budgets. However, with the flexibility of Excel comes challenges; it is a double-edged sword. Using Excel to create reports can be time consuming, and when it comes to updating, managing, and analyzing them, it can be even more laborious and time-consuming. Multiple versions of the same report, incorrect formulas, and the required extra oversight and manual manipulation can be labor-intensive. In addition, Excel does not expand well to allow other abilities, such as forecasting, consolidation, ad hoc analysis or automated revenue and cost allocations across multiple departments or entities.
Companies have begun to move away from Excel and now understand that there are improved tools that are better equipped to meet all their business needs and that reporting is only one requirement. Companies are investing in dedicated tools that enhance reporting and other business processes. Analysis and planning capabilities can be brought to the desktops of stakeholders, providing an environment that allows complex planning and effective decision making. With proper setup, reporting for an organization can be a catalyst to improving a business’ bottom line. A complete performance management system can be obtained, which allows your organization to spend more time analyzing and planning instead of manipulating data into useful forms. This creates an environment that empowers end users and stakeholders to understand the current business situation, allowing for quick reaction to foreseen and unforeseen business changes.
A complete performance management system also enables the implementation of a rolling forecast. Adopted by an increasing number of organizations, a
rolling forecast provides greater insight and vision into the future. Once a performance management system is in place, setting up a rolling forecast is simple and straightforward.
The ideal reporting and performance management package should offer key capabilities and function ality permitting financial and non-financial users to find the answers they need to perform their job more effectively. To improve your current reporting process, find a package that gives you easy access to more information while still providing an ample amount of detail. It should slso give you the ability to per form other functions, built upon the reporting data and infrastructure. With such a reporting tool, analysis and forecasting becomes more efficient and accurate, and effective decisions can be made in a consis tent manner.
6
Listed below are some of these core functionalities. Prior to investment, find out what features and tools are fundamental in a reporting package.
1. End-to-end Reporting Solution The ability to structure financial and non-fi nancial reports around business require ments is essential to a useful reporting pro cess. Business requirements are changing at lightning speed and having the proper tools to react in a timely manner has become invaluable.
Having the ability to pull various report types from one system is not only a timesaver but has become a corporate necessity. Finan cial statements measure corporate success, management boardroom reports can pin point troubled or distressed areas, ad hoc data reports bring accuracy and relevance during the planning periods, and a rolling forecast provides an informed perspective on the future. Advanced reporting software provides an easy interface for gathering this type of information.
By realizing the key components and features that should be taken into
account when looking for a reporting package, a substantial return on
investment can be expected. This white paper focuses on those core
capabilities and helps to define what a company should be receiving
from a reporting package. This not only ensures that the best solution
is found to solve your reporting issues but it also addresses the need for
a full performance management solution that can propel your business
forward with visible benefits in business analysis, consolidation, allocations,
planning, workflow tracking, and forecasting.
Performance Reporting Essentials

7
Once this information is stored within such a system, it is available for multiple reporting types and satisfies various reporting needs.
Financial Reporting Fully detailed financial statements: income statement, balance sheet, cash flow statement, and pro-forma financial statements.
Management Reporting Non-financial and financial visual reports displaying the overall health of the organization.
Transaction Reporting Detailed views of transactional data, helping to analyze errors and anomalies.
Rolling Forecast Financial insight over a selected time period (remainder of the year, 12 months out, 3 years, etc.) to more effectively manage budget and market/product/company changes and enable improved decision-making.
Reporting should be an ongoing process with frequent opportunities for managers and other stakeholders to view the latest internal and external data on the performance of the company. This information should be available in various forms to adequately address the interests of all vested individuals.This information should be available in various forms to adequately address the interests of all vested individuals.
www.prophix.com Financial Consolidation: Get a true picture of your
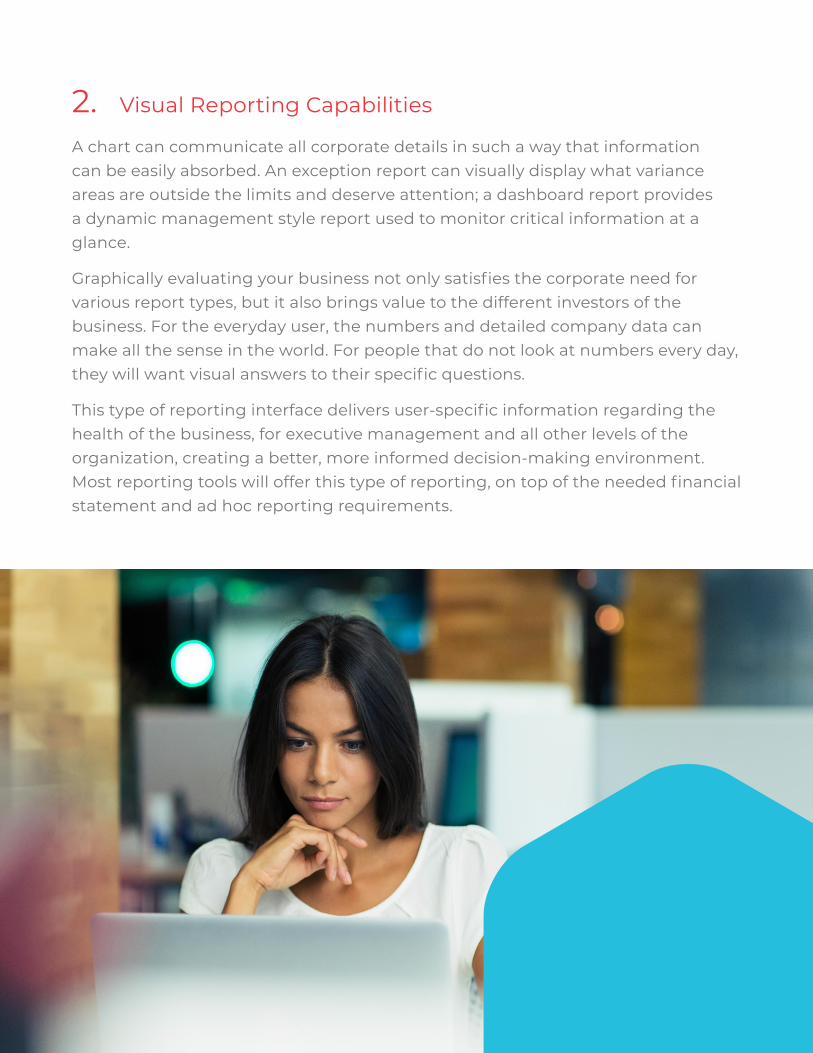
2. Visual Reporting Capabilities A chart can communicate all corporate details in such a way that information can be easily absorbed. An ex ception report can visually display what variance areas are outside the limits and deserve attention; a dash board report provides a dynamic management style report used to monitor critical information at a glance.
Graphically evaluating your business not only satisfies the corporate need for various report types, but it also brings value to the different investors of the business. For the everyday user, the numbers and detailed company data can make all the sense in the world. For people that do not look at numbers every day, they will want visual answers to their specific questions.
This type of reporting interface delivers user-specific information regarding the health of the business, for executive management and all other levels of the organization, creating a better, more informed decision-making environment. Most reporting tools will offer this type of reporting, on top of the needed financial statement and ad hoc reporting requirements.

9
3. Stakeholder Involvement Remember that people often reject products that are difficult to learn or do not meet their needs. Avoid investments in tools that encourage users to revert to old processes. Sixty-four percent of respondents in the Prophix survey indicated that between 5-10 non-finance personnel were involved in the budget process. For finance and non-finance colleagues alike, when the tools are hard to use or confusing, the process can get bogged down and frustrating.
Invest in a reporting tool that is user driven and encourages control. One key feature to assist in this is providing a reporting tool that allows various stakeholders to be involved in the planning and reporting process. Ensure that your software program provides the ability to disseminate corporate information to key stakeholders, in a timely manner and with security intact. For 30% of survey respondents, the management reporting package is distributed to more than 10 people, and for 38% it is distributed to between 5 and 10. With manual preparation of reports, this can be a significant numbers of reports and recipients to manage.
One method of guaranteeing this is to distribute corporate reports to individuals from a reporting software
50%
Less than 5
Between 6 & 10
40%
30%
20%
10%
0%Between11& 20
More than 20
41%
24% 20%
15%
Less than 5
Between5 & 10
40%
30%
20%
10%
0%Between10 & 20
More than 20
38%
26%
18% 18%
How many non-finance people are involved in creating budget numbers for a new year? This
would typically include department owners and non-finance executives.
How many people does the departmental reporting package get distributed to in total
across all departments?
10
program. Scheduling reports to be distributed will put the correct information into the correct hands, at the correct time. There will no longer be excuses for unfinished analysis or reporting of information. Another assurance of stakeholder involvement revolves around ease of use. Microsoft Excel is one of the most dominant players in reporting. Why is this the case? One of the main reasons is that it is easy to navigate the simple interface for building and formatting reports. Excel is so easy to use and has large user acceptance because it provides a graphical user interface (GUI).
However, there can be a significant downside to using Excel to prepare reports. As your business and your finance system expands, it becomes harder to keep track of different reports and report owners, as well as expanded requirements for data integration.
Introducing a reporting package that provides an attractive, easy-to-use GUI interface will significantly shorten learning curves. Software packages that support a similar GUI interface allow users to build on their skills and increase user buy-in. All departments will become involved in the reporting loop.
Lastly, a large reason why stakeholders are often not included in the planning and reporting process is because of control. How can you control the process and guarantee that individuals are only participating in what they should be participating in? Managing access levels and the information approval process is necessary for accurate analysis and reporting. Ensuring that stakeholders’ tasks are well defined and can be managed is possible. The tool of choice should have a full workflow process that visually displays the stages and responsibilities of the individual, providing a concise and timely portrait of the process.
4. Secure Interface Some corporate information is privy to only a select few, within or outside of an organization. One of the biggest criticisms against certain software programs, such as Excel, is that nothing is truly locked down and secure in an Excel worksheet. A locked sheet can simply be copied and pasted to another location and then changed. You want users to be able to access enough data in order to ask the right questions and perform the required analysis, but you also want to limit the kind of data accessible to them, such as another department’s payroll information.
11
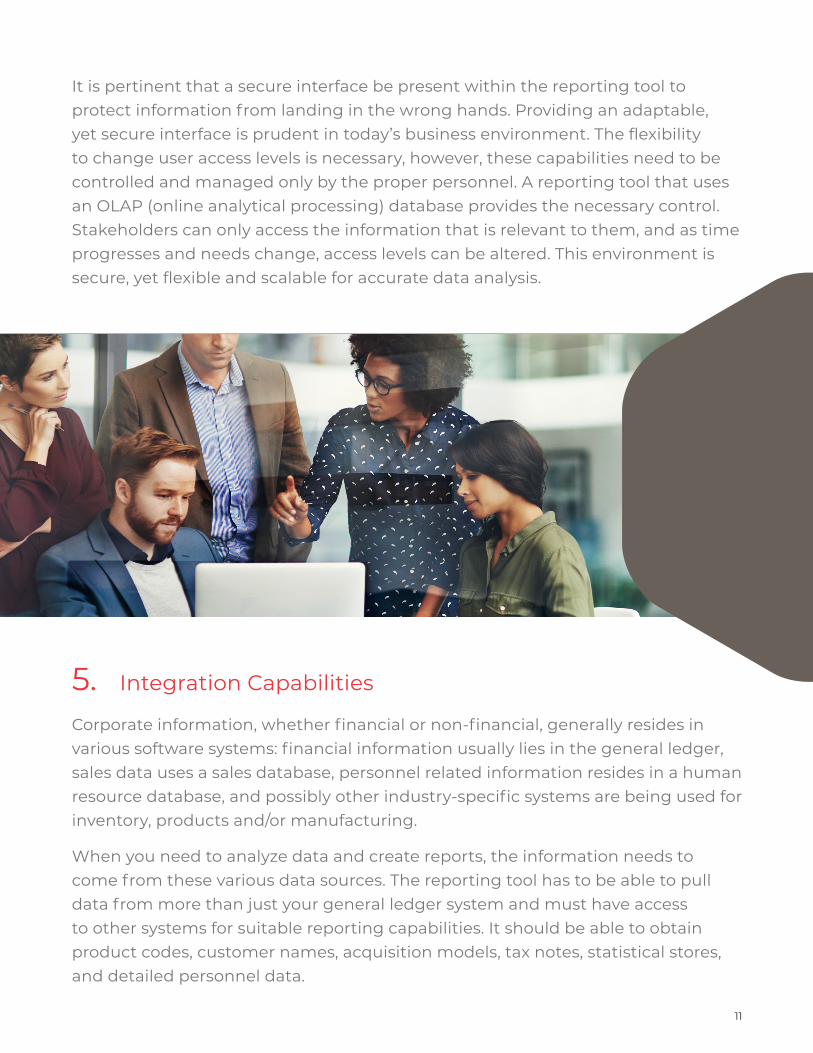
It is pertinent that a secure interface be present within the reporting tool to protect information from landing in the wrong hands. Providing an adaptable, yet secure interface is prudent in today’s business environment. The flexibility to change user access levels is necessary, however, these capabilities need to be controlled and managed only by the proper personnel. A reporting tool that uses an OLAP (online analytical processing) database provides the necessary control. Stakeholders can only access the information that is relevant to them, and as time progresses and needs change, access levels can be altered. This environment is secure, yet flexible and scalable for accurate data analysis.
5. Integration Capabilities Corporate information, whether financial or non-financial, generally resides in various software systems: financial information usually lies in the general ledger, sales data uses a sales database, personnel related information resides in a human resource database, and possibly other industry-specific systems are being used for inventory, products and/or manufacturing.
When you need to analyze data and create reports, the information needs to come from these various data sources. The reporting tool has to be able to pull data from more than just your general ledger system and must have access to other systems for suitable reporting capabilities. It should be able to obtain product codes, customer names, acquisition models, tax notes, statistical stores, and detailed personnel data.

12
The reporting tool should act as a consolidation tool, bringing together various data sources and accurately reporting this information in a precise manner. Reporting tools that offer Open Database Connectivity (ODBC) provide a user interface that requires little to no IT involvement and creates a menu-driven import functionality. The integration of systems and the consolidation of information can be a business-driven process based on your requirements.
6. From Reporting to Data Analysis Providing stakeholders with information is good practice, however, the usability and flexibility of this information are two very important components that will determine if it is valuable. Having all of your data staged in one database creates an environment that gives users a nice and organized interface to quickly access data.
An OLAP database and the technology inherent within it provides the ability to analyze data from many points of view. For example, viewing your corporate income statement and then drilling through to view specific departments or cost centers’ operating expenses or viewing sales reports and drilling through to transactional detail to analyze the products sold and the sales managers who sold them.
Selecting this information and slicing and dicing through a simple drag-and-drop functionality should be inherent within the reporting software. Reporting software needs to offer a valuable experience for stakeholders, creating an atmosphere where stakeholders can take ownership and manage the information that is necessary to do their jobs, all with little to no IT involvement.
“Finance executives say that their ability to analyze
data - to perform what-if, drill-down analysis
to answer non-routine, unstructured questions—
holds them back from delivering real business
benefit.”
Sam Knox, CFO Research

13
7. Enabling a Rolling Forecast The ability to “see” into the future offers a significant competitive advantage. A rolling forecast offers flexibility and the ability to respond quickly to market, economic or competitor changes. Decisions can be made on relevant data, enabling managing to the market, rather than managing to a budget that may have been created as far as 12 months in the past.
Once the reporting process has been automated, it is easy to set up a rolling forecast. It’s just a matter of populating the selected time periods with your key drivers and your assumptions. Most performance management systems offer built-in templates; a rolling forecast leverages these templates, requiring only the addition of time periods. Changing your assumptions as you introduce new products or change pricing is also straightforward.
Many organizations have eliminated the annual budget process entirely, in favor of a rolling forecast. Eliminating the huge production process required to produce an annual budget frees up time and resources that can be applied to more in-depth analysis and more informed decision-making.
40%
30%
20%
10%
0%No, there is
no need
18%
No, but we would like to
10%
We forecast operating revenues
1 or 2 4 times a
year
23%
We forecast operating revenues
3 or 4 4 times a
year
20%
We forecast operating revenues more than4 times a
year
28%
40%
30%
20%
10%
0%No, there is
no need
19%
No, but we would like to
10%
We forecast operating expenses
1 or 2 times a year
29%
We forecast operating expenses
3 or 4 times a year
21%
We forecast operating expenses
more than4 times a
year
23%
Once the budget is complete and you are operating your business, do you create a
forecast for your revenue that reflects changes from your original budget throughout
the year?
Once the budget is complete and you are operating your business, do you create a forecast for your operating expenses that reflect changes from your original budget
throughout the year?
14
8. Audit Control Today’s business environment demands that companies adhere to industry standards and follow all compliance-related issues. Being able to control, track, approve, and review during different business processes is a necessary component of doing business today. For example, creating comments related to certain business actions will aid in the planning cycle.
Given that reporting is one of these required business processes that a company must adhere to, control throughout the process is mandatory. The reporting software should provide the tools to review and approve reports, track report changes, and manage the reporting process. Many reporting software programs have these capabilities and make it a user-friendly process that is easy to follow.
9. Full Software Solution Implementing an application for reporting may only be part of your solution; where can you analyze data prior to and after reporting? Where do the necessary forecasting, budgeting, advanced planning, and consolidations happen? How do you implement a rolling forecast? There are solutions that offer a feature-rich, comprehensive planning software suite—complete solutions for budgeting, reporting, forecasting, consolidation, and planning.
One way to ensure this is to invest in a solution that has a centralized database, where all information, historical and plan, is stored. A centralized database will have the data staged in one database, giving stakeholders a complete and organized interface to quickly access data. Because there is only one interface, it is a good place to start the planning process. Plan numbers can be forecasted out and trend analysis can be used to accurately estimate the variances based on the previous year. A reforecast can be created to truthfully portray whether targets will be reached. Your reporting package should also make it easy to create variance reports and process advanced consolidation calculations.
Extend the capabilities of your existing accounting, ERP, and other data source systems and protect the investments already made in reporting software. When researching reporting software programs, ensure that the solution can offer more analytical capabilities than just reporting, including the implementation
15
of a rolling forecast. Innovative organizations use software systems in other
ways beyond reporting. A partial list of applications and business challenges
that software programs address includes customer profitability analysis,
product line analysis, inventory management, sales forecasting, cash flow
forecasting, scenario planning, multi-year budgeting, forecasting, and workflow
management.
The closer you are to live data, the more accurate the analysis, and a better
return on investment will be reached. Ensure a centralized database is a core
component of the reporting tool.
About ProphixYour business is evolving. And the way you plan and report on your business should evolve too. Prophix helps mid-market companies achieve their goals more successfully with innovative, cloud-based Corporate Performance Management (CPM) software. With Prophix, finance leaders improve profitability and minimize risk by automating budgeting, forecasting and reporting and puts the focus back on what matters most – uncovering business opportunities. Prophix supports your future with AI innovation that flexes to meet your strategic realities, today and tomorrow. Over 1,500 global companies rely on Prophix to transform the way they work.
Europe
Sankt Knuds Vej 41 1903 Frederiksberg CDenmark
+ 45 7023 2375 [email protected]/dk
United Kingdom
Davidson HouseThe ForburyReadingRG1 3EU
+44 (0) 118 900 [email protected]
South America
Rio de Janeiro – BrasilAv. Marechal Câmara 160 cj 932Centro – RJ20.020-080
+55 21 [email protected]/br
Head office
350 Burnhamthorpe Road West, Suite 1000 Mississauga, OntarioCanada • L5B 3J1
+1 (800) 387-5915 1- 905 - 279 - 8711 [email protected]
South America
São Paulo – SP – BrasilRua André Ampére,153/7o andarNovo Brooklin – SP04562-080
+55 11 3583-1678 [email protected]/br
United States
707 SW Washington St.Suite 1100Portland, OR 97205 +1 (800) 387 5915 [email protected]
DACH Region
Messeturm60308 Frankfurt am MainGermany
+49 69 509 565 [email protected]