performance plan summary - u.s. department of education · fy 2013 annual performance report and fy...
TRANSCRIPT
FY 2013 Annual Performance Report and FY 2015 Annual Performance Plan—U.S. Department of Education 18
Performance Plan Summary
Looking Ahead and Addressing Challenges
Education is key to the nation’s long-term economic prosperity and is an investment in its future. A highly educated workforce is necessary for American competitiveness in the global economy. The Department continues to maintain strong support for traditional state formula grant programs while continuing to fund competitive initiatives, including, but not limited to, Race to the Top, Promise Neighborhoods, Investing in Innovation (i3) grants, and a redesigned School Improvement Grants program. Almost every state is supporting higher standards that ensure students will be college- and career-ready.
The United States is seeing the highest high school graduation rate in three decades, and over the past four years, postsecondary financial assistance available to students and families has increased significantly. Moreover, the Department has seen an increase of more than 50 percent in the number of students accessing higher education on Pell Grants.
Finally, the Department’s efforts to support and strengthen the teaching profession through improved teacher evaluation and professional development are predicted to pay long-term dividends.
Going forward, the Department will build on what it has already established:
• • • • • •
state-driven accountability that demands progress for all children; high-quality early education for more low-income children; more flexibility for state decision-making; more support for principals and teachers to apply high standards to practice; reforming career education in high schools and community colleges; and reforming and simplifying the application process for student aid to help drive college affordability and completion.
The Department cannot stop here, however. It needs to continue to strengthen the support systems necessary for all students to reach the middle class and beyond. Preschool should be accessible for all children. The Department needs to fund a set of pre-K–12 strategic reforms, including improving teaching for the benefit of students and making schools safer. The Department needs to ensure that college is more affordable. Ultimately, the Department looks to creating ladders of opportunity to support states and help students living in poverty advance beyond their means.
Data Verification and Validation
The GPRA Modernization Act of 2010 requires agencies to prepare information on the reliability of data presented. OMB guidance indicates:
Agencies may develop a single data verification and validation appendix used to communicate the agency’s approaches, and/or may also choose to provide information about data quality wherever the performance information is communicated (e.g., websites). Agencies should discuss their verification and validation techniques with their respective OMB Resource Management Office, if necessary. The transmittal letter included in Annual Performance Reports must contain an assessment by the agency
PERFORMANCE PLAN SUMMARY
FY 2013 Annual Performance Report and FY 2015 Annual Performance Plan—U.S. Department of Education 19
head of the completeness and reliability of the performance data presented and a description of agency plans to improve completeness, reliability, and quality, where needed.11
The data presented in the Department’s FY 2014–18 Strategic Plan are assessed based on the type of data and its source:
•
•
•
•
•
statistical data,
program and enforcement data collections,
monitoring and grant applications,
management information systems/business operations, and
external (nonstatistical) data sources.
The full data verification and validation summary for the FY 2014–18 Strategic Plan metrics is provided in appendix A of this report. The appendix also includes known limitations of the data and the Department’s plans to address those limitations. Improvement efforts include revising program and enforcement data collections and improving grantee monitoring processes.
Also in appendix A, the Secretary has provided a high-level assessment of the completeness and reliability of the performance data presented.
FY 2014–18 Strategic Plan Goals
The U.S. Department of Education Strategic Plan for Fiscal Years 2014–2018 provides a framework for the key policy and operational priorities for the agency, in alignment with the administration’s vision for education and in collaboration with Congress, state and local partners, and other education stakeholders. From its mission and core values, the plan was developed by building upon and updating the FY 2011–14 Strategic Plan. It comprises six foundational strategic goals and six priority goals. The updated plan for FY 2014–18 includes the same six strategic goals as the Department’s previous plan. These six goals will help to align the administration’s annual budget requests and the Department’s legislative agenda.
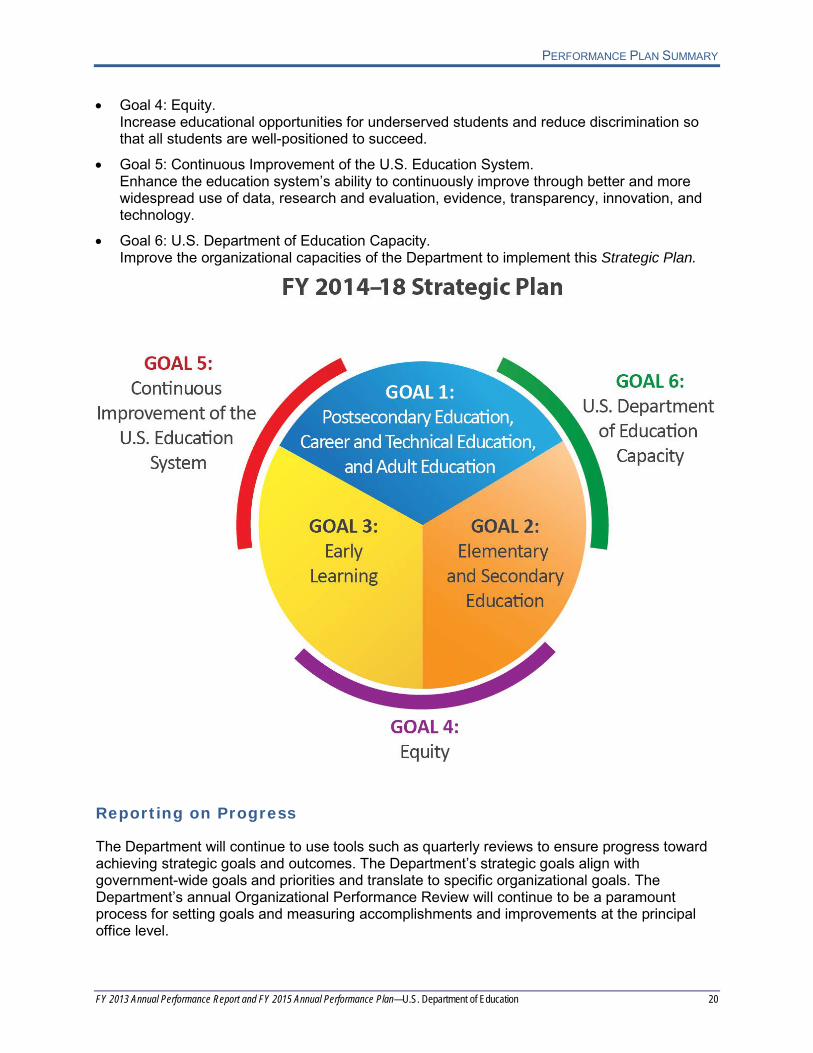
The Department’s FY 2014–18 Strategic Plan stands on a foundation of six strategic goals:
•
•
•
Goal 1: Postsecondary Education, Career and Technical Education, and Adult Education. Increase college access, affordability, quality, and completion by improving postsecondary education and lifelong learning opportunities for youths and adults.
Goal 2: Elementary and Secondary Education. Improve the elementary and secondary education system’s ability to consistently deliver excellent instruction aligned with rigorous academic standards while providing effective support services to close achievement and opportunity gaps, and ensure all students graduate high school college- and career-ready.
Goal 3: Early Learning. Improve the health, social-emotional, and cognitive outcomes for all children from birth through 3rd grade, so that all children, particularly those with high needs, are on track for graduating from high school college- and career-ready.
11 OMB Circular A-11, Preparation, Submission, and Execution of the Budget, Part 6, Section 260.9, July 2013.
PERFORMANCE PLAN SUMMARY
FY 2013 Annual Performance Report and FY 2015 Annual Performance Plan—U.S. Department of Education 20
•
•
•
Goal 4: Equity. Increase educational opportunities for underserved students and reduce discrimination so that all students are well-positioned to succeed.
Goal 5: Continuous Improvement of the U.S. Education System. Enhance the education system’s ability to continuously improve through better and more widespread use of data, research and evaluation, evidence, transparency, innovation, and technology.
Goal 6: U.S. Department of Education Capacity. Improve the organizational capacities of the Department to implement this Strategic Plan.
Reporting on Progress
The Department will continue to use tools such as quarterly reviews to ensure progress toward achieving strategic goals and outcomes. The Department’s strategic goals align with government-wide goals and priorities and translate to specific organizational goals. The Department’s annual Organizational Performance Review will continue to be a paramount process for setting goals and measuring accomplishments and improvements at the principal office level.
PERFORMANCE PLAN SUMMARY
FY 2013 Annual Performance Report and FY 2015 Annual Performance Plan—U.S. Department of Education 21
To support the tracking and reporting of progress against the Strategic Plan’s goals and objectives, the Department has created and continues to develop its data profile on http://goals.performance.gov/agency/ed. It is also creating a set of information dashboards and data analysis tools to provide more relevance and context for senior leaders in gauging the impact of the agency’s performance as a part of its ongoing strategic decision-making.
The effective implementation of the Department’s priority and strategic goals will depend, in part, on the effective use of high-quality and timely data, including evaluations and performance measures, throughout the lifecycle of policies and programs. The Department is committed to increasing the number of programs and initiatives that are evaluated using methods that include those consistent with the What Works Clearinghouse Evidence Standards and incorporating cost-effectiveness measures into evaluations and program improvement systems.
The Department has identified performance measures centered on desired outcomes for each of the six strategic goals established by the FY 2011–14 Strategic Plan and carried forward in the FY 2014–18 Strategic Plan. Each goal section provides insight into how the Department will work to achieve its strategic goals, including key resources and programs that support each goal and its objectives. Note that while the Department designates only one strategic goal for each program, many Department programs support more than one other strategic goal as well, but are not listed under those goals. For example, while the formula-based Title I College- and Career-Ready Students program is shown as a key contributor to Goal 2 (Elementary and Secondary Education), this $14.4 billion program also provides significant resources in support of Goal 4 (Equity). Similarly, the portion of the Race to the Top competitive grants program shown under Goal 5 also makes significant contribution to Goal 2.
Some performance measures are based on trend data over several years. The baseline data for the FY 2014–18 Strategic Plan measures are the most current data available to the Department. Unless noted, targets are based upon the most current data the Department expects to have available at the time of the Annual Performance Reports. For example, if the baseline data from annual data sets are from FY 2012, the Department developed its FY 2014 target assuming that the Department will report FY 2013 data in its FY 2014 Annual Performance Report.12
While the Department has trend data for many of its performance measures, since the Department is in its first year of reporting on its FY 2014–18 Strategic Plan, it is continuing to establish baselines to collect data for a number of newly established performance measures.
12 The Department includes program-specific measures and targets in its Congressional Budget Justification that are based on what the Department expects will occur in a given fiscal year. That is, the Congressional Budget Justification typically contains targets up to and including the budget year, but performance data often lag two or three years. The FY 2011–14 Strategic Plan included targets that were developed and reported on similar to the Department’s process for its Congressional Budget Justification.
PERFORMANCE PLAN SUMMARY
FY 2013 Annual Performance Report and FY 2015 Annual Performance Plan—U.S. Department of Education 22
Summary of Performance Targets
Performance Targets Summary Baseline Target
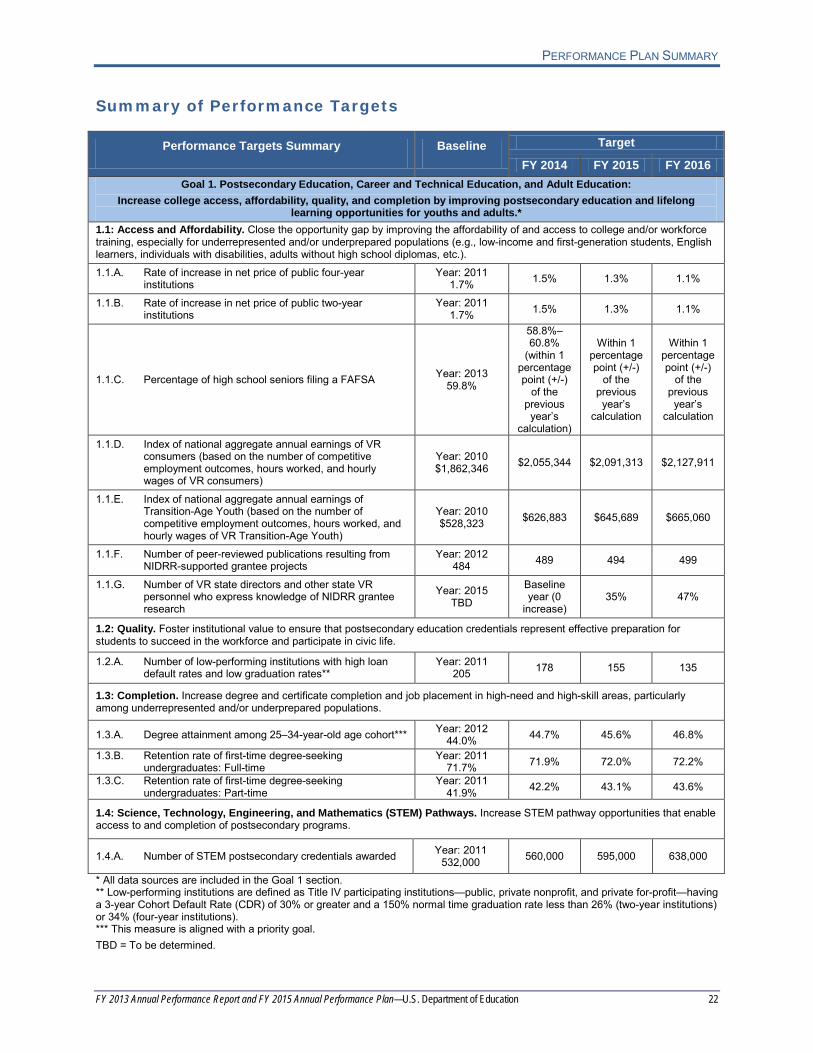
FY 2014 FY 2015 FY 2016 Goal 1. Postsecondary Education, Career and Technical Education, and Adult Education:
Increase college access, affordability, quality, and completion by improving postsecondary education and lifelong learning opportunities for youths and adults.*
1.1: Access and Affordability. Close the opportunity gap by improving the affordability of and access to college and/or workforce training, especially for underrepresented and/or underprepared populations (e.g., low-income and first-generation students, English learners, individuals with disabilities, adults without high school diplomas, etc.). 1.1.A. Rate of increase in net price of public four-year
institutions Year: 2011
1.7% 1.5% 1.3% 1.1%
1.1.B. Rate of increase in net price of public two-year institutions
Year: 2011 1.7% 1.5% 1.3% 1.1%
1.1.C. Percentage of high school seniors filing a FAFSA Year: 2013 59.8%
58.8%–60.8%
(within 1 percentage point (+/-)
of the previous year’s
calculation)
Within 1 percentage point (+/-)
of the previous year’s
calculation
Within 1 percentage point (+/-)
of the previous year’s
calculation
1.1.D. Index of national aggregate annual earnings of VR consumers (based on the number of competitive employment outcomes, hours worked, and hourly wages of VR consumers)
Year: 2010 $1,862,346 $2,055,344 $2,091,313 $2,127,911
1.1.E. Index of national aggregate annual earnings of Transition-Age Youth (based on the number of competitive employment outcomes, hours worked, and hourly wages of VR Transition-Age Youth)
Year: 2010 $528,323 $626,883 $645,689 $665,060
1.1.F. Number of peer-reviewed publications resulting from NIDRR-supported grantee projects
Year: 2012 484 489 494 499
1.1.G. Number of VR state directors and other state VR personnel who express knowledge of NIDRR grantee research
Year: 2015 TBD
Baseline year (0
increase) 35% 47%
1.2: Quality. Foster institutional value to ensure that postsecondary education credentials represent effective preparation for students to succeed in the workforce and participate in civic life.
1.2.A. Number of low-performing institutions with high loan default rates and low graduation rates**
Year: 2011 205 178 155 135
1.3: Completion. Increase degree and certificate completion and job placement in high-need and high-skill areas, particularly among underrepresented and/or underprepared populations.
1.3.A. Degree attainment among 25–34-year-old age cohort*** Year: 2012 44.0% 44.7% 45.6% 46.8%
1.3.B. Retention rate of first-time degree-seeking undergraduates: Full-time
Year: 2011 71.7% 71.9% 72.0% 72.2%
1.3.C. Retention rate of first-time degree-seeking undergraduates: Part-time
Year: 2011 41.9% 42.2% 43.1% 43.6%
1.4: Science, Technology, Engineering, and Mathematics (STEM) Pathways. Increase STEM pathway opportunities that enable access to and completion of postsecondary programs.
1.4.A. Number of STEM postsecondary credentials awarded Year: 2011 532,000 560,000 595,000 638,000
* All data sources are included in the Goal 1 section. ** Low-performing institutions are defined as Title IV participating institutions—public, private nonprofit, and private for-profit—having a 3-year Cohort Default Rate (CDR) of 30% or greater and a 150% normal time graduation rate less than 26% (two-year institutions) or 34% (four-year institutions). *** This measure is aligned with a priority goal. TBD = To be determined.

PERFORMANCE PLAN SUMMARY
FY 2013 Annual Performance Report and FY 2015 Annual Performance Plan—U.S. Department of Education 23
Performance Targets Summary Baseline Target
FY 2014 FY 2015 FY 2016 Goal 2. Elementary and Secondary Education:
Improve the elementary and secondary education system’s ability to consistently deliver excellent instruction aligned with rigorous academic standards while providing effective support services to close achievement and opportunity gaps, and
ensure all students graduate high school college- and career-ready.*
2.1: Standards and Assessments. Support implementation of internationally benchmarked college- and career-ready standards, with aligned, valid, and reliable assessments.
2.1.A. Number of states that have adopted college- and career-ready standards**
Year: 2013 49, plus DC 50 50 50
2.1.B. Number of states that are implementing next-generation reading and mathematics assessments, aligned with college- and career-ready standards**
Year: 2013 0 0 50 50
2.2: Effective Teachers and Strong Leaders. Improve the preparation, recruitment, retention, development, support, evaluation, recognition, and equitable distribution of effective teachers and leaders.***
2.2.A. Number of states that have fully implemented teacher and principal evaluation and support systems that consider multiple measures of effectiveness, with student growth as a significant factor**
Year: 2013 7 18 37 43
2.3: School Climate and Community. Increase the success, safety, and health of students, particularly in high-need schools, and deepen family and community engagement.
2.3.A. Disparity in the rates of out-of-school suspensions for students with disabilities and youth of color (youth of color metric)†
Year: 2012 10.7% point
disparity
8.7% point disparity NA 6.7% point
disparity
2.3.B. Disparity in the rates of out-of-school suspensions for students with disabilities and youth of color (SWD, IDEA only metric)†
Year: 2012 5.7% point disparity
4.2% point disparity NA 2.7% point
disparity
2.4: Turn Around Schools and Close Achievement Gaps. Accelerate achievement by supporting states and districts in turning around low-performing schools and closing achievement gaps, and developing models of next-generation high schools.
2.4.A. Number of persistently low graduation rate high schools****
Year: 2012 766
5% annual reduction
5% annual reduction
5% annual reduction
2.4.B. Percentage of Cohort 1 priority schools that have met the state exit criteria and exited priority school status†
Year: 2013 NA 10% 15% 20%
2.4.C. Percentage of Cohort 1 focus schools that have met the state exit criteria and exited focus school status†
Year: 2013 NA 10% 15% 20%
2.5: STEM Teaching and Learning. Increase the number and quality of STEM teachers and increase opportunities for students to access rich STEM learning experiences.
2.5.A. Percentage of high school and middle school teachers who teach STEM as their main assignment who hold a corresponding undergraduate degree††
Year: 2012 62.2% NA NA NA
2.5.B. Number of public high school graduates who have taken at least one STEM AP exam‡
Year: 2012 497,922 536,810 581,419 632,642
* All data sources are included in the Goal 2 section. ** This measure is aligned with a priority goal. *** States with approved Elementary and Secondary Education Act (ESEA) Flexibility requests are required to implement teacher and principal evaluation and support systems by 2014–15 or 2015–16, depending on the school year of initial approval. Under recently announced additional flexibility, personnel decisions based on those systems are not required until 2016–17. **** Persistently low graduation rate high schools are defined as regular and vocational high schools with an average minimum cohort size of 65 or more, and an average adjusted cohort graduation rate (ACGR) of 60 percent or less over two years. † Targets for this measure are based on what the Department expects will occur in a given fiscal year. †† Data are produced every four years; thus, the Department will only receive one set of data (collected in 2015–16) during this Strategic Plan cycle. ‡ STEM AP fields include Biology, Calculus, Chemistry, Computer Science, Environmental Science, Physics, and Statistics. NA = Not applicable.
PERFORMANCE PLAN SUMMARY
FY 2013 Annual Performance Report and FY 2015 Annual Performance Plan—U.S. Department of Education 24
Performance Targets Summary Baseline Target
FY 2014 FY 2015 FY 2016
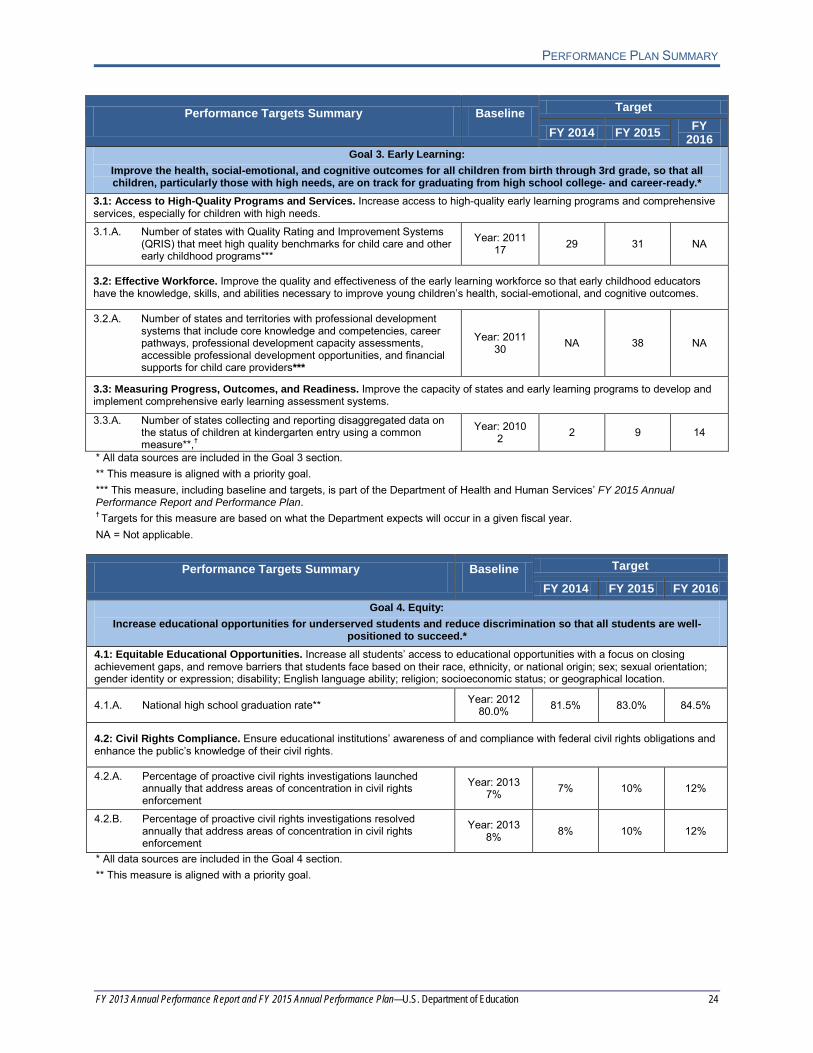
Goal 3. Early Learning: Improve the health, social-emotional, and cognitive outcomes for all children from birth through 3rd grade, so that all children, particularly those with high needs, are on track for graduating from high school college- and career-ready.*
3.1: Access to High-Quality Programs and Services. Increase access to high-quality early learning programs and comprehensive services, especially for children with high needs. 3.1.A. Number of states with Quality Rating and Improvement Systems
(QRIS) that meet high quality benchmarks for child care and other early childhood programs***
Year: 2011 17 29 31 NA
3.2: Effective Workforce. Improve the quality and effectiveness of the early learning workforce so that early childhood educators have the knowledge, skills, and abilities necessary to improve young children’s health, social-emotional, and cognitive outcomes.
3.2.A. Number of states and territories with professional development systems that include core knowledge and competencies, career pathways, professional development capacity assessments, accessible professional development opportunities, and financial supports for child care providers***
Year: 2011 30 NA 38 NA
3.3: Measuring Progress, Outcomes, and Readiness. Improve the capacity of states and early learning programs to develop and implement comprehensive early learning assessment systems.
3.3.A. Number of states collecting and reporting disaggregated data on the status of children at kindergarten entry using a common measure**,†
Year: 2010 2 2 9 14
* All data sources are included in the Goal 3 section. ** This measure is aligned with a priority goal. *** This measure, including baseline and targets, is part of the Department of Health and Human Services’ FY 2015 Annual Performance Report and Performance Plan. † Targets for this measure are based on what the Department expects will occur in a given fiscal year. NA = Not applicable.
Performance Targets Summary Baseline Target
FY 2014 FY 2015 FY 2016 Goal 4. Equity:
Increase educational opportunities for underserved students and reduce discrimination so that all students are well-positioned to succeed.*
4.1: Equitable Educational Opportunities. Increase all students’ access to educational opportunities with a focus on closing achievement gaps, and remove barriers that students face based on their race, ethnicity, or national origin; sex; sexual orientation; gender identity or expression; disability; English language ability; religion; socioeconomic status; or geographical location.
4.1.A. National high school graduation rate** Year: 2012 80.0% 81.5% 83.0% 84.5%
4.2: Civil Rights Compliance. Ensure educational institutions’ awareness of and compliance with federal civil rights obligations and enhance the public’s knowledge of their civil rights.
4.2.A. Percentage of proactive civil rights investigations launched annually that address areas of concentration in civil rights enforcement
Year: 2013 7% 7% 10% 12%
4.2.B. Percentage of proactive civil rights investigations resolved annually that address areas of concentration in civil rights enforcement
Year: 2013 8% 8% 10% 12%
* All data sources are included in the Goal 4 section. ** This measure is aligned with a priority goal.
PERFORMANCE PLAN SUMMARY
FY 2013 Annual Performance Report and FY 2015 Annual Performance Plan—U.S. Department of Education 25
Performance Targets Summary Baseline Target
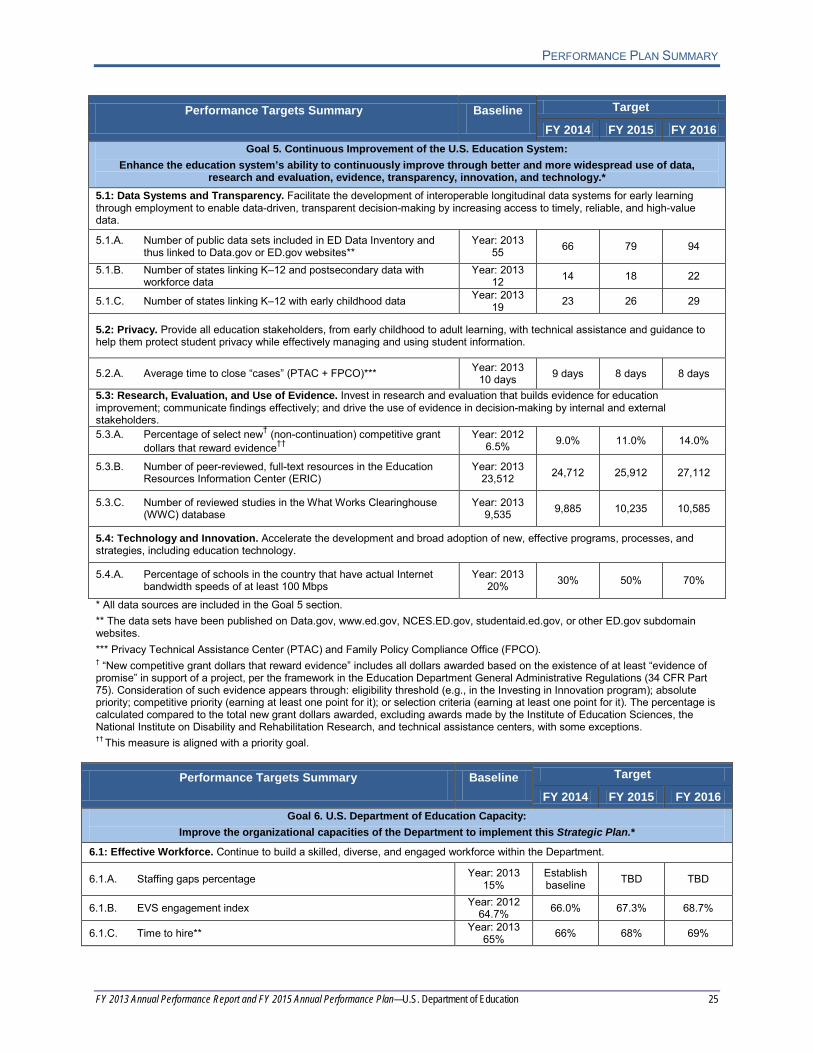
FY 2014 FY 2015 FY 2016 Goal 5. Continuous Improvement of the U.S. Education System:
Enhance the education system’s ability to continuously improve through better and more widespread use of data, research and evaluation, evidence, transparency, innovation, and technology.*
5.1: Data Systems and Transparency. Facilitate the development of interoperable longitudinal data systems for early learning through employment to enable data-driven, transparent decision-making by increasing access to timely, reliable, and high-value data.
5.1.A. Number of public data sets included in ED Data Inventory and thus linked to Data.gov or ED.gov websites**
Year: 2013 55 66 79 94
5.1.B. Number of states linking K–12 and postsecondary data with workforce data
Year: 2013 12 14 18 22
5.1.C. Number of states linking K–12 with early childhood data Year: 2013 19 23 26 29
5.2: Privacy. Provide all education stakeholders, from early childhood to adult learning, with technical assistance and guidance to help them protect student privacy while effectively managing and using student information.
5.2.A. Average time to close “cases” (PTAC + FPCO)*** Year: 2013 10 days 9 days 8 days 8 days
5.3: Research, Evaluation, and Use of Evidence. Invest in research and evaluation that builds evidence for education improvement; communicate findings effectively; and drive the use of evidence in decision-making by internal and external stakeholders. 5.3.A. Percentage of select new† (non-continuation) competitive grant
dollars that reward evidence†† Year: 2012
6.5% 9.0% 11.0% 14.0%
5.3.B. Number of peer-reviewed, full-text resources in the Education Resources Information Center (ERIC)
Year: 2013 23,512 24,712 25,912 27,112
5.3.C. Number of reviewed studies in the What Works Clearinghouse (WWC) database
Year: 2013 9,535 9,885 10,235 10,585
5.4: Technology and Innovation. Accelerate the development and broad adoption of new, effective programs, processes, and strategies, including education technology.
5.4.A. Percentage of schools in the country that have actual Internet bandwidth speeds of at least 100 Mbps
Year: 2013 20% 30% 50% 70%
* All data sources are included in the Goal 5 section. ** The data sets have been published on Data.gov, www.ed.gov, NCES.ED.gov, studentaid.ed.gov, or other ED.gov subdomain websites. *** Privacy Technical Assistance Center (PTAC) and Family Policy Compliance Office (FPCO). † “New competitive grant dollars that reward evidence” includes all dollars awarded based on the existence of at least “evidence of promise” in support of a project, per the framework in the Education Department General Administrative Regulations (34 CFR Part 75). Consideration of such evidence appears through: eligibility threshold (e.g., in the Investing in Innovation program); absolute priority; competitive priority (earning at least one point for it); or selection criteria (earning at least one point for it). The percentage is calculated compared to the total new grant dollars awarded, excluding awards made by the Institute of Education Sciences, the National Institute on Disability and Rehabilitation Research, and technical assistance centers, with some exceptions. †† This measure is aligned with a priority goal.
Performance Targets Summary Baseline Target
FY 2014 FY 2015 FY 2016 Goal 6. U.S. Department of Education Capacity:
Improve the organizational capacities of the Department to implement this Strategic Plan.*
6.1: Effective Workforce. Continue to build a skilled, diverse, and engaged workforce within the Department.
6.1.A. Staffing gaps percentage Year: 2013 15%
Establish baseline TBD TBD
6.1.B. EVS engagement index Year: 2012 64.7% 66.0% 67.3% 68.7%
6.1.C. Time to hire** Year: 2013 65% 66% 68% 69%
PERFORMANCE PLAN SUMMARY
FY 2013 Annual Performance Report and FY 2015 Annual Performance Plan—U.S. Department of Education 26
Performance Targets Summary Baseline Target
FY 2014 FY 2015 FY 2016
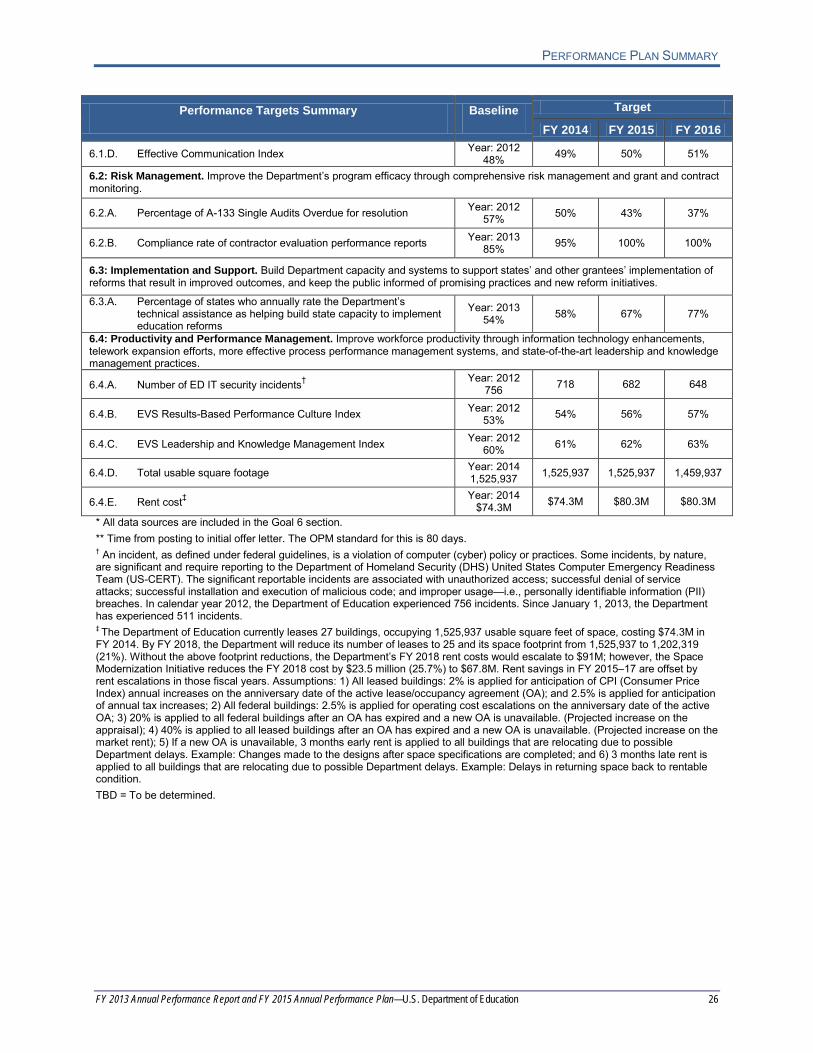
6.1.D. Effective Communication Index Year: 2012 48% 49% 50% 51%
6.2: Risk Management. Improve the Department’s program efficacy through comprehensive risk management and grant and contract monitoring.
6.2.A. Percentage of A-133 Single Audits Overdue for resolution Year: 2012 57% 50% 43% 37%
6.2.B. Compliance rate of contractor evaluation performance reports Year: 2013 85% 95% 100% 100%
6.3: Implementation and Support. Build Department capacity and systems to support states’ and other grantees’ implementation of reforms that result in improved outcomes, and keep the public informed of promising practices and new reform initiatives.
6.3.A. Percentage of states who annually rate the Department’s technical assistance as helping build state capacity to implement education reforms
Year: 2013 54% 58% 67% 77%
6.4: Productivity and Performance Management. Improve workforce productivity through information technology enhancements, telework expansion efforts, more effective process performance management systems, and state-of-the-art leadership and knowledge management practices.
6.4.A. Number of ED IT security incidents† Year: 2012 756 718 682 648
6.4.B. EVS Results-Based Performance Culture Index Year: 2012 53% 54% 56% 57%
6.4.C. EVS Leadership and Knowledge Management Index Year: 2012 60% 61% 62% 63%
6.4.D. Total usable square footage Year: 2014 1,525,937 1,525,937 1,525,937 1,459,937
6.4.E. Rent cost‡ Year: 2014 $74.3M $74.3M $80.3M $80.3M
* All data sources are included in the Goal 6 section. ** Time from posting to initial offer letter. The OPM standard for this is 80 days. † An incident, as defined under federal guidelines, is a violation of computer (cyber) policy or practices. Some incidents, by nature, are significant and require reporting to the Department of Homeland Security (DHS) United States Computer Emergency Readiness Team (US-CERT). The significant reportable incidents are associated with unauthorized access; successful denial of service attacks; successful installation and execution of malicious code; and improper usage—i.e., personally identifiable information (PII) breaches. In calendar year 2012, the Department of Education experienced 756 incidents. Since January 1, 2013, the Department has experienced 511 incidents. ‡ The Department of Education currently leases 27 buildings, occupying 1,525,937 usable square feet of space, costing $74.3M in FY 2014. By FY 2018, the Department will reduce its number of leases to 25 and its space footprint from 1,525,937 to 1,202,319 (21%). Without the above footprint reductions, the Department’s FY 2018 rent costs would escalate to $91M; however, the Space Modernization Initiative reduces the FY 2018 cost by $23.5 million (25.7%) to $67.8M. Rent savings in FY 2015–17 are offset by rent escalations in those fiscal years. Assumptions: 1) All leased buildings: 2% is applied for anticipation of CPI (Consumer Price Index) annual increases on the anniversary date of the active lease/occupancy agreement (OA); and 2.5% is applied for anticipation of annual tax increases; 2) All federal buildings: 2.5% is applied for operating cost escalations on the anniversary date of the active OA; 3) 20% is applied to all federal buildings after an OA has expired and a new OA is unavailable. (Projected increase on the appraisal); 4) 40% is applied to all leased buildings after an OA has expired and a new OA is unavailable. (Projected increase on the market rent); 5) If a new OA is unavailable, 3 months early rent is applied to all buildings that are relocating due to possible Department delays. Example: Changes made to the designs after space specifications are completed; and 6) 3 months late rent is applied to all buildings that are relocating due to possible Department delays. Example: Delays in returning space back to rentable condition. TBD = To be determined.
PERFORMANCE PLAN SUMMARY
FY 2013 Annual Performance Report and FY 2015 Annual Performance Plan—U.S. Department of Education 27
Goal 1. Postsecondary Education, Career and Technical Education, and Adult Education:
Increase college access, affordability, quality, and completion by improving postsecondary education and lifelong learning opportunities for youths and adults.
Goal Leader: Jamienne Studley
Objective/Sub-goal 1.1: Access and Affordability. Close the opportunity gap by improving the affordability of and access to college and/or workforce training, especially for underrepresented and/or underprepared populations (e.g., low-income and first-generation students, English learners, individuals with disabilities, adults without high school diplomas, etc.). Objective Leaders: Jon O’Bergh, Jim Runcie, and Michael Yudin
Measure 1.1.A: Rate of increase in net price of public four-year institutions
Measure 1.1.B: Rate of increase in net price of public two-year institutions
Measure 1.1.C: Percentage of high school seniors filing a FAFSA
Measure 1.1.D: Index of national annual aggregate earnings of VR consumers (based on the number of competitive employment outcomes, hours worked, and hourly wages)
Measure 1.1.E: Index of national annual aggregate earnings of Transition-Age Youth (based on the number of competitive employment outcomes, hours worked, and hourly wages)
Measure 1.1.F: Number of peer-reviewed publications resulting from NIDRR-supported grantee projects
Measure 1.1.G: Number of VR state directors and other state VR personnel who express knowledge of NIDRR grantee research
Objective/Sub-goal 1.2: Quality. Foster institutional value to ensure that postsecondary education credentials represent effective preparation for students to succeed in the workforce and participate in civic life. Objective Leader: Jon O’Bergh
Measure 1.2.A: Number of low-performing institutions with high loan default rates and low graduation rates
Objective/Sub-goal 1.3: Completion. Increase degree and certificate completion and job placement in high-need and high-skill areas, particularly among underrepresented and/or underprepared populations. Objective Leader: Jon O’Bergh
Measure 1.3.A: Degree attainment among 25–34-year-old age cohort
Measure 1.3.B: Retention rate of first-time degree-seeking undergraduates: Full-time
Measure 1.3.C: Retention rate of first-time degree-seeking undergraduates: Part-time
PERFORMANCE PLAN SUMMARY
FY 2013 Annual Performance Report and FY 2015 Annual Performance Plan—U.S. Department of Education 28
Objective/Sub-goal 1.4: Science, Technology, Engineering, and Mathematics (STEM) Pathways. Increase STEM pathway opportunities that enable access to and completion of postsecondary programs. Objective Leader: Camsie McAdams
Measure 1.4.A: Number of STEM postsecondary credentials awarded
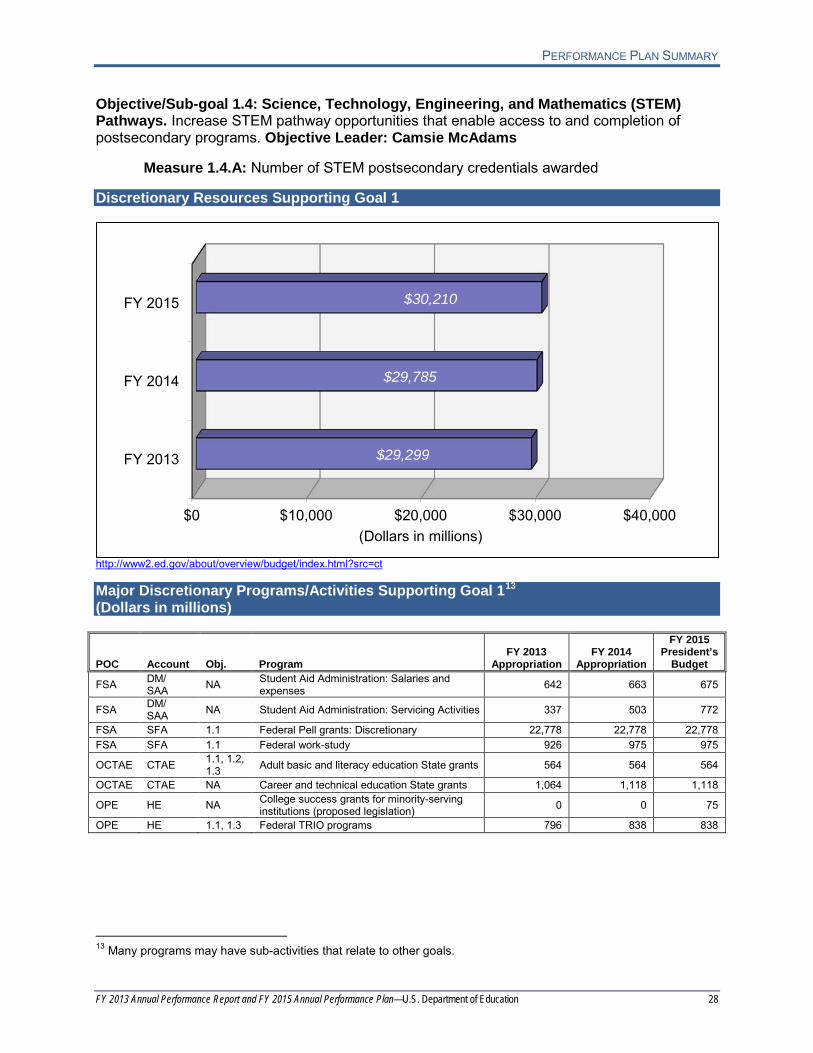
Discretionary Resources Supporting Goal 1
$0 $10,000 $20,000 $30,000 $40,000
FY 2013
FY 2014
FY 2015
$29,299
$29,785
$30,210
(Dollars in millions)
http://www2.ed.gov/about/overview/budget/index.html?src=ct Major Discretionary Programs/Activities Supporting Goal 113 (Dollars in millions)
POC Account Obj. Program FY 2013
Appropriation FY 2014
Appropriation
FY 2015 President’s
Budget
FSA DM/ SAA NA Student Aid Administration: Salaries and
expenses 642 663 675
FSA DM/ SAA NA Student Aid Administration: Servicing Activities 337 503 772
FSA SFA 1.1 Federal Pell grants: Discretionary 22,778 22,778 22,778 FSA SFA 1.1 Federal work-study 926 975 975
OCTAE CTAE 1.1, 1.2, 1.3 Adult basic and literacy education State grants 564 564 564
OCTAE CTAE NA Career and technical education State grants 1,064 1,118 1,118
OPE HE NA College success grants for minority-serving institutions (proposed legislation) 0 0 75
OPE HE 1.1, 1.3 Federal TRIO programs 796 838 838
13 Many programs may have sub-activities that relate to other goals.
PERFORMANCE PLAN SUMMARY
FY 2013 Annual Performance Report and FY 2015 Annual Performance Plan—U.S. Department of Education 29
POC Account Obj. Program FY 2013
Appropriation FY 2014
Appropriation
FY 2015 President’s
Budget OPE HE NA First in the World 0 75 100
OPE HE 1.1 Gaining early awareness and readiness for undergraduate programs (GEAR UP) 286 302 302
Subtotal 27,394 27,816 28,196 Other Discretionary Programs/Activities 1,905 1,970 2,013
TOTAL, GOAL 1 29,299 29,785 30,210 NA = Not applicable. Note: Detail may not add to total due to rounding. Public Benefit
Increasing college access, affordability, quality, and completion by improving postsecondary education and lifelong learning opportunities for youths and adults are matters that require equal parts information, motivation, and opportunity to be successful.
Prior to entering postsecondary education, prospective students need easily accessible information on the cost of attendance, career placement and graduation rates, college loan default rates, earnings of graduates, public-service and private-sector opportunities, loan management options, and other subjects crucial to understanding the affordability and value of the postsecondary institutions and/or programs of study that they are considering. Students deserve to know that, whether they enter a college, university, postsecondary career training program, or adult education program, the credential they earn will be affordable and its value will be recognized as an indication that they possess the necessary knowledge and skills for success in the workplace and in life.
Providing federal student aid in a simple, reliable, and efficient manner is the main way that the Department supports college access, affordability, quality, and completion. In FY 2013, the Department delivered nearly $138 billion in grants, work-study, and loan assistance to approximately 14 million postsecondary students and their families. These students attended approximately 6,200 institutions of postsecondary education accredited by dozens of agencies. In addition, the Department administers $2 billion annually in grants to strengthen postsecondary institutions and promote college readiness, and another $2 billion in grant funds for Career and Technical Education (CTE), adult education (including literacy and civics education), and correctional education to help adults secure the skills that equip them for work, civic participation, and lifelong learning.
The Department has already taken significant steps to increase college access, affordability, quality, and completion. Through the SAFRA Act, passed as part of the Healthcare and Education Reconciliation Act of 2010 (HCERA), Congress ended student loan subsidies to banks, saving billions of dollars that are now used for financial aid through the Pell Grant program and for reducing borrowers’ monthly repayment amounts. Resources developed by the Department, such as the College Affordability and Transparency Center, the Financial Aid Shopping Sheet, the College Scorecard, and a consolidated student aid website from the Department’s Federal Student Aid office (www.studentaid.gov), now provide students and families with better tools for informed decision-making. In addition, the Department has simplified the Free Application for Federal Student Aid (FAFSA) so it is easier and faster for students to apply for aid.
PERFORMANCE PLAN SUMMARY
FY 2013 Annual Performance Report and FY 2015 Annual Performance Plan—U.S. Department of Education 30
The Department will build on these efforts to ensure that all Americans, regardless of background, will have the opportunity to access and complete an affordable postsecondary degree or other postsecondary credential.
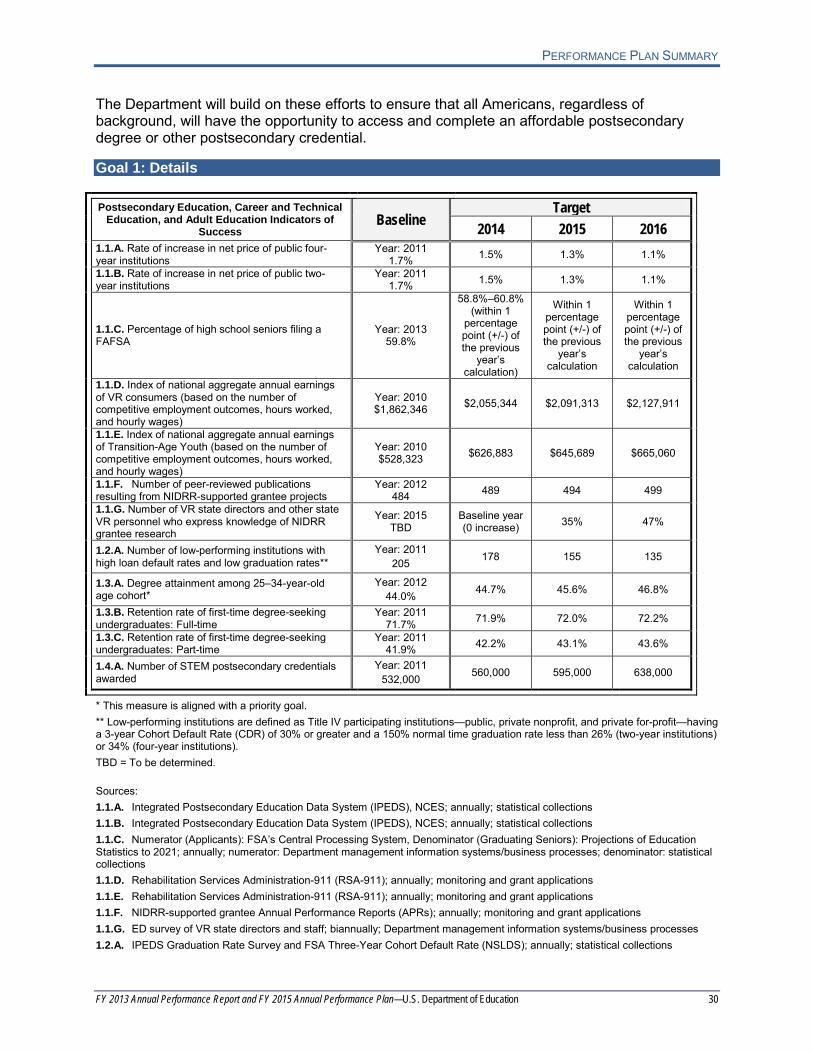
Goal 1: Details
Postsecondary Education, Career and Technical Education, and Adult Education Indicators of
Success Baseline
Target 2014 2015 2016
1.1.A. Rate of increase in net price of public four-year institutions
Year: 2011 1.7% 1.5% 1.3% 1.1%
1.1.B. Rate of increase in net price of public two-year institutions
Year: 2011 1.7% 1.5% 1.3% 1.1%
1.1.C. Percentage of high school seniors filing a FAFSA
Year: 2013 59.8%
58.8%–60.8% (within 1
percentage point (+/-) of the previous
year’s calculation)
Within 1 percentage point (+/-) of the previous
year’s calculation
Within 1 percentage point (+/-) of the previous
year’s calculation
1.1.D. Index of national aggregate annual earnings of VR consumers (based on the number of competitive employment outcomes, hours worked, and hourly wages)
Year: 2010 $1,862,346 $2,055,344 $2,091,313 $2,127,911
1.1.E. Index of national aggregate annual earnings of Transition-Age Youth (based on the number of competitive employment outcomes, hours worked, and hourly wages)
Year: 2010 $528,323 $626,883 $645,689 $665,060
1.1.F. Number of peer-reviewed publications resulting from NIDRR-supported grantee projects
Year: 2012 484 489 494 499
1.1.G. Number of VR state directors and other state VR personnel who express knowledge of NIDRR grantee research
Year: 2015 TBD
Baseline year (0 increase) 35% 47%
1.2.A. Number of low-performing institutions with high loan default rates and low graduation rates**
Year: 2011 205 178 155 135
1.3.A. Degree attainment among 25–34-year-old age cohort*
Year: 2012 44.0% 44.7% 45.6% 46.8%
1.3.B. Retention rate of first-time degree-seeking undergraduates: Full-time
Year: 2011 71.7% 71.9% 72.0% 72.2%
1.3.C. Retention rate of first-time degree-seeking undergraduates: Part-time
Year: 2011 41.9% 42.2% 43.1% 43.6%
1.4.A. Number of STEM postsecondary credentials awarded
Year: 2011 532,000 560,000 595,000 638,000
* This measure is aligned with a priority goal. ** Low-performing institutions are defined as Title IV participating institutions—public, private nonprofit, and private for-profit—having a 3-year Cohort Default Rate (CDR) of 30% or greater and a 150% normal time graduation rate less than 26% (two-year institutions) or 34% (four-year institutions). TBD = To be determined. Sources: 1.1.A. Integrated Postsecondary Education Data System (IPEDS), NCES; annually; statistical collections 1.1.B. Integrated Postsecondary Education Data System (IPEDS), NCES; annually; statistical collections 1.1.C. Numerator (Applicants): FSA’s Central Processing System, Denominator (Graduating Seniors): Projections of Education Statistics to 2021; annually; numerator: Department management information systems/business processes; denominator: statistical collections 1.1.D. Rehabilitation Services Administration-911 (RSA-911); annually; monitoring and grant applications 1.1.E. Rehabilitation Services Administration-911 (RSA-911); annually; monitoring and grant applications 1.1.F. NIDRR-supported grantee Annual Performance Reports (APRs); annually; monitoring and grant applications 1.1.G. ED survey of VR state directors and staff; biannually; Department management information systems/business processes 1.2.A. IPEDS Graduation Rate Survey and FSA Three-Year Cohort Default Rate (NSLDS); annually; statistical collections
PERFORMANCE PLAN SUMMARY
FY 2013 Annual Performance Report and FY 2015 Annual Performance Plan—U.S. Department of Education 31
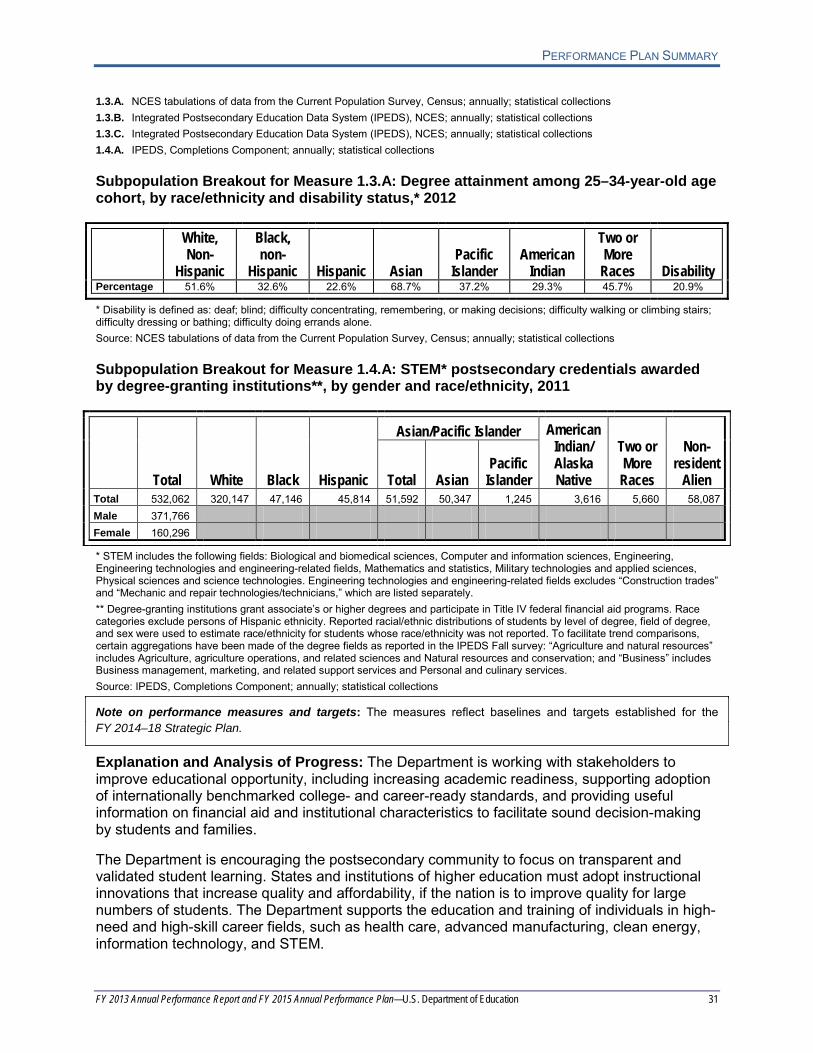
1.3.A. NCES tabulations of data from the Current Population Survey, Census; annually; statistical collections 1.3.B. Integrated Postsecondary Education Data System (IPEDS), NCES; annually; statistical collections 1.3.C. Integrated Postsecondary Education Data System (IPEDS), NCES; annually; statistical collections 1.4.A. IPEDS, Completions Component; annually; statistical collections Subpopulation Breakout for Measure 1.3.A: Degree attainment among 25–34-year-old age cohort, by race/ethnicity and disability status,* 2012
White, Non-
Hispanic
Black, non-
Hispanic Hispanic Asian Pacific
Islander American
Indian
Two or More
Races Disability Percentage 51.6% 32.6% 22.6% 68.7% 37.2% 29.3% 45.7% 20.9%
* Disability is defined as: deaf; blind; difficulty concentrating, remembering, or making decisions; difficulty walking or climbing stairs; difficulty dressing or bathing; difficulty doing errands alone. Source: NCES tabulations of data from the Current Population Survey, Census; annually; statistical collections Subpopulation Breakout for Measure 1.4.A: STEM* postsecondary credentials awarded by degree-granting institutions**, by gender and race/ethnicity, 2011
Total White Black Hispanic
Asian/Pacific Islander American Indian/ Alaska Native
Two or More Races
Non-resident
Alien Total Asian Pacific
Islander Total 532,062 320,147 47,146 45,814 51,592 50,347 1,245 3,616 5,660 58,087 Male 371,766 Female 160,296
* STEM includes the following fields: Biological and biomedical sciences, Computer and information sciences, Engineering, Engineering technologies and engineering-related fields, Mathematics and statistics, Military technologies and applied sciences, Physical sciences and science technologies. Engineering technologies and engineering-related fields excludes “Construction trades” and “Mechanic and repair technologies/technicians,” which are listed separately. ** Degree-granting institutions grant associate’s or higher degrees and participate in Title IV federal financial aid programs. Race categories exclude persons of Hispanic ethnicity. Reported racial/ethnic distributions of students by level of degree, field of degree, and sex were used to estimate race/ethnicity for students whose race/ethnicity was not reported. To facilitate trend comparisons, certain aggregations have been made of the degree fields as reported in the IPEDS Fall survey: “Agriculture and natural resources” includes Agriculture, agriculture operations, and related sciences and Natural resources and conservation; and “Business” includes Business management, marketing, and related support services and Personal and culinary services. Source: IPEDS, Completions Component; annually; statistical collections
Note on performance measures and targets: The measures reflect baselines and targets established for the FY 2014–18 Strategic Plan.
Explanation and Analysis of Progress: The Department is working with stakeholders to improve educational opportunity, including increasing academic readiness, supporting adoption of internationally benchmarked college- and career-ready standards, and providing useful information on financial aid and institutional characteristics to facilitate sound decision-making by students and families.
The Department is encouraging the postsecondary community to focus on transparent and validated student learning. States and institutions of higher education must adopt instructional innovations that increase quality and affordability, if the nation is to improve quality for large numbers of students. The Department supports the education and training of individuals in high-need and high-skill career fields, such as health care, advanced manufacturing, clean energy, information technology, and STEM.
PERFORMANCE PLAN SUMMARY
FY 2013 Annual Performance Report and FY 2015 Annual Performance Plan—U.S. Department of Education 32
Results for measures 1.1.A, 1.1.B, 1.1.C, 1.1.D, 1.1.E, 1.1.G, 1.2.A, 1.3.A, 1.3.B, 1.3.C, and 1.4.A are influenced by actions taken by the Department, but are most influenced by factors that are beyond the control of the Department. Results for measures 1.1.A, 1.1.B, 1.1.F, and 1.4.A are most influenced by actions taken by postsecondary institutions, by funding decisions made at the state and local levels, and by market forces and jobs creation trends.
In addition, modifications to statewide longitudinal data systems and other data systems are necessary to better track the nation’s progress on improving access to postsecondary education, completion of postsecondary degrees and certificates, and success in the workforce and society.
Selected Strategies to Achieve Goal 1 Include:
The Department must ensure that all students—recent high school graduates and adult learners alike—are well prepared for college and careers, help more of them enroll in postsecondary education, and increase the number of those who complete programs of study with a degree or certificate.
To spur reforms at the state level and most effectively impact attainment rates, the Department will implement the President’s College Value and Affordability Agenda. One central strategy promotes innovation and competition (such as in course redesign and student services, accelerating time to degree by fostering dual enrollment, pilot projects, and competency-based education), facilitated by a reduction in federal regulatory requirements that may constrain innovation. A second major strategy fosters better investment in college education, and holds institutions and students accountable for completion and postsecondary outcomes, through an improved College Scorecard and also a ratings system that will initially help students compare value (e.g., access, affordability, and student outcomes) and then tie financial aid to performance and improvement. The Department will continue to spotlight model state programs and draw on them to shape federal strategies. Furthermore, the Department is shifting to an evidence-based approach for institutional grants, and in FY 2013 began a pilot through the Strengthening Institutions Program which incorporates a competitive priority to implement evidence-based practices for improving student outcomes. The net effect of these strategies will be to boost completion rates and, by extension, educational attainment.

PERFORMANCE PLAN SUMMARY
FY 2013 Annual Performance Report and FY 2015 Annual Performance Plan—U.S. Department of Education 33
Goal 2. Elementary and Secondary Education:
Improve the elementary and secondary education system’s ability to consistently deliver excellent instruction aligned with rigorous academic standards while providing effective support services to close achievement and opportunity gaps, and ensure all students graduate high school college- and career-ready.
Goal Leader: Deb Delisle
Objective/Sub-goal 2.1: Standards and Assessments. Support implementation of internationally benchmarked college- and career-ready standards, with aligned, valid, and reliable assessments. Objective Leader: Alex Goniprow
Measure 2.1.A: Number of states that have adopted college- and career-ready standards
Measure 2.1.B: Number of states that are implementing next-generation reading and mathematics assessments, aligned with college- and career-ready standards
Objective/Sub-goal 2.2: Effective Teachers and Strong Leaders. Improve the preparation, recruitment, retention, development, support, evaluation, recognition, and equitable distribution of effective teachers and leaders.14 Objective Leader: Alex Goniprow
Measure 2.2.A: Number of states that have fully implemented teacher and principal evaluation and support systems that consider multiple measures of effectiveness, with student growth as a significant factor
Objective/Sub-goal 2.3: School Climate and Community. Increase the success, safety, and health of students, particularly in high-need schools, and deepen family and community engagement. Objective Leader: Alex Goniprow
Measure 2.3.A: Disparity in the rates of out-of-school suspensions for students with disabilities and youth of color (youth of color metric)
Measure 2.3.B: Disparity in the rates of out-of-school suspensions for students with disabilities and youth of color (SWD, IDEA only metric)
Objective/Sub-goal 2.4: Turn Around Schools and Close Achievement Gaps. Accelerate achievement by supporting states and districts in turning around low-performing schools and closing achievement gaps, and developing models of next-generation high schools. Objective Leader: Alex Goniprow
Measure 2.4.A: Number of persistently low graduation rate high schools
Measure 2.4.B: Percentage of Cohort 1 priority schools that have met the state exit criteria and exited priority school status
14 States with approved Elementary and Secondary Education Act (ESEA) flexibility requests are required to implement teacher and principal evaluation and support systems by 2014–15 or 2015–16, depending on the school year of initial approval. Under recently announced additional flexibility, personnel decisions based on those systems are not required until 2016–17.
PERFORMANCE PLAN SUMMARY
FY 2013 Annual Performance Report and FY 2015 Annual Performance Plan—U.S. Department of Education 34
Measure 2.4.C: Percentage of Cohort 1 focus schools that have met the state exit criteria and exited focus school status
Objective/Sub-goal 2.5: STEM Teaching and Learning. Increase the number and quality of STEM teachers and increase opportunities for students to access rich STEM learning experiences. Objective Leader: Camsie McAdams
Measure 2.5.A: Percentage of high school and middle school teachers who teach STEM as their main assignment who hold a corresponding undergraduate degree
Measure 2.5.B: Number of public high school graduates who have taken at least one STEM AP exam
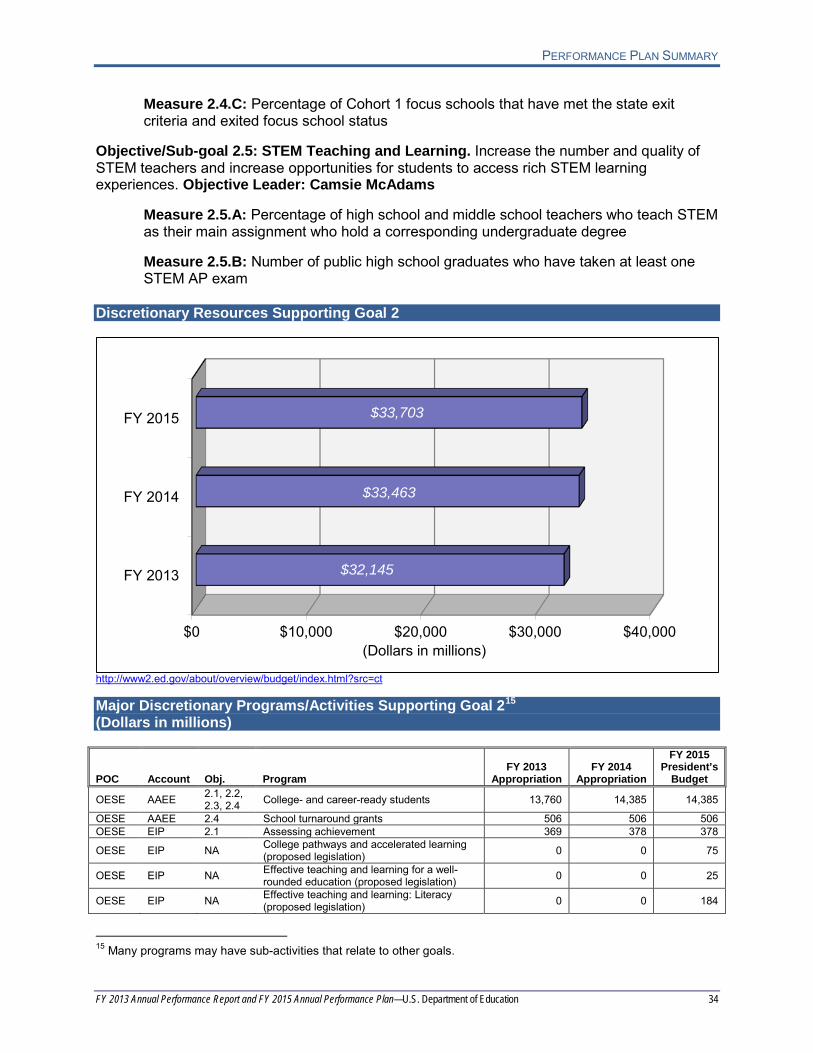
Discretionary Resources Supporting Goal 2
$0 $10,000 $20,000 $30,000 $40,000
FY 2013
FY 2014
FY 2015
$32,145
$33,463
$33,703
(Dollars in millions)
http://www2.ed.gov/about/overview/budget/index.html?src=ct Major Discretionary Programs/Activities Supporting Goal 215 (Dollars in millions)
POC Account Obj. Program FY 2013
Appropriation FY 2014
Appropriation
FY 2015 President’s
Budget
OESE AAEE 2.1, 2.2, 2.3, 2.4 College- and career-ready students 13,760 14,385 14,385
OESE AAEE 2.4 School turnaround grants 506 506 506 OESE EIP 2.1 Assessing achievement 369 378 378
OESE EIP NA College pathways and accelerated learning (proposed legislation) 0 0 75
OESE EIP NA Effective teaching and learning for a well-rounded education (proposed legislation) 0 0 25
OESE EIP NA Effective teaching and learning: Literacy (proposed legislation) 0 0 184
15 Many programs may have sub-activities that relate to other goals.

PERFORMANCE PLAN SUMMARY
FY 2013 Annual Performance Report and FY 2015 Annual Performance Plan—U.S. Department of Education 35
POC Account Obj. Program FY 2013
Appropriation FY 2014
Appropriation
FY 2015 President’s
Budget OESE IA 2.2, 2.3 Impact Aid 1,160 1,222 1,222
OESE IIT 2.2 Effective teachers and leaders state grants (proposed legislation) 0 0 2,000
OESE IIT 2.2 Teacher and leader innovation fund (proposed legislation) 0 0 320
OESE SSS NA 21st century community learning centers 1,092 1,149 1,149
OESE SSS 2.3 Successful, safe, and healthy students (proposed legislation) 0 0 214
OII IIT 2.1, 2.2, 2.3, 5.4 ConnectEDucators 0 0 200
OII IIT 2.2, 2.3, 2.4
Expanding educational options (proposed legislation) 0 0 248
OII IIT 2.1, 2.4, 2.5 High school redesign (proposed legislation) 0 0 150
OII IIT 2.2, 2.3, 2.6 Magnet schools assistance 92 92 92
OII IIT 2.2 School leadership 28 26 35
OII IIT 2.5 STEM Innovation: STEM innovation network (proposed legislation) 0 0 320
OII SSS 2.1, 2.2, 2.3 Promise Neighborhoods 57 57 100
OSERS SE 2.1, 2.2, 2.3 Special Education grants to states 10,975 11,473 11,573
Subtotal 28,037 29,287 33,175 Other Discretionary Programs/Activities 4,108 4,176 529
TOTAL, GOAL 2 32,145 33,463 33,703 NA = Not applicable. Note: Detail may not add to total due to rounding. Public Benefit
The goal for America’s educational system is clear: every student should graduate from high school ready for college and a career. Every student should have meaningful opportunities from which to choose upon graduation from high school. Over the past few years, states, districts, and schools have initiated groundbreaking reforms and innovations to try to meet this goal. For the first time, almost every state is supporting higher standards that will demonstrate that students are truly college- and career-ready. States are also coming together to develop the next generation of assessments that are not only aligned with these new standards, but also advance essential skills that promote critical thinking, problem solving, and the application of knowledge. At the same time, states, districts, and schools are working to meet the challenges of putting a highly qualified teacher in every classroom and a strong and effective leader in every school; building local capacity to support successful school turnarounds; redesigning high school education by building stronger connections among secondary education, postsecondary education, and the workplace; and improving teacher preparation and classroom instruction in STEM education.
However, while many schools are increasing the quality of instruction and improving academic achievement, there is also broad agreement that the U.S. education system fails to consistently provide all students with the excellent education necessary to achieve college- and career-readiness. The result is that too many U.S. students are failing to reach their full potential. Recent National Assessment of Educational Progress (NAEP) scores show that low-income students are “roughly two years of learning behind the average better-off student of the same age.” Also, according to the 2009 McKinsey report The Economic Impact of the Achievement
PERFORMANCE PLAN SUMMARY
FY 2013 Annual Performance Report and FY 2015 Annual Performance Plan—U.S. Department of Education 36
Gap in American Schools, on average, “black and Latino students are roughly two to three years of learning behind white students of the same age.”
Many children, particularly low-income children, students with disabilities, English learners, and children of color, confront not only an achievement gap, but also an opportunity gap. Today, a student in a school with high minority enrollment is much less likely to go to a school that offers calculus and physics than a student in a high school with low minority enrollment. Closing the opportunity gap will require that school resources, talent, and spending be targeted to the kids who need help the most.
The Department’s elementary and secondary education reforms focus on the building blocks needed for schools, school districts, and states to more consistently deliver excellent classroom instruction for all students. The foundation of these reforms is a system for improving learning and teaching that aligns with internationally benchmarked college- and career-ready standards, high-quality formative and summative assessments, and engaging and effective instructional content. Ensuring that U.S. students have the critical thinking skills and other tools they need to be effective in the 21st-century economy means improving teaching and learning in all content areas—from literacy, science, technology, engineering, and mathematics to history, civics and government, geography, foreign languages, the arts, economics and financial literacy, environmental education, computer science, health education, and other subjects.
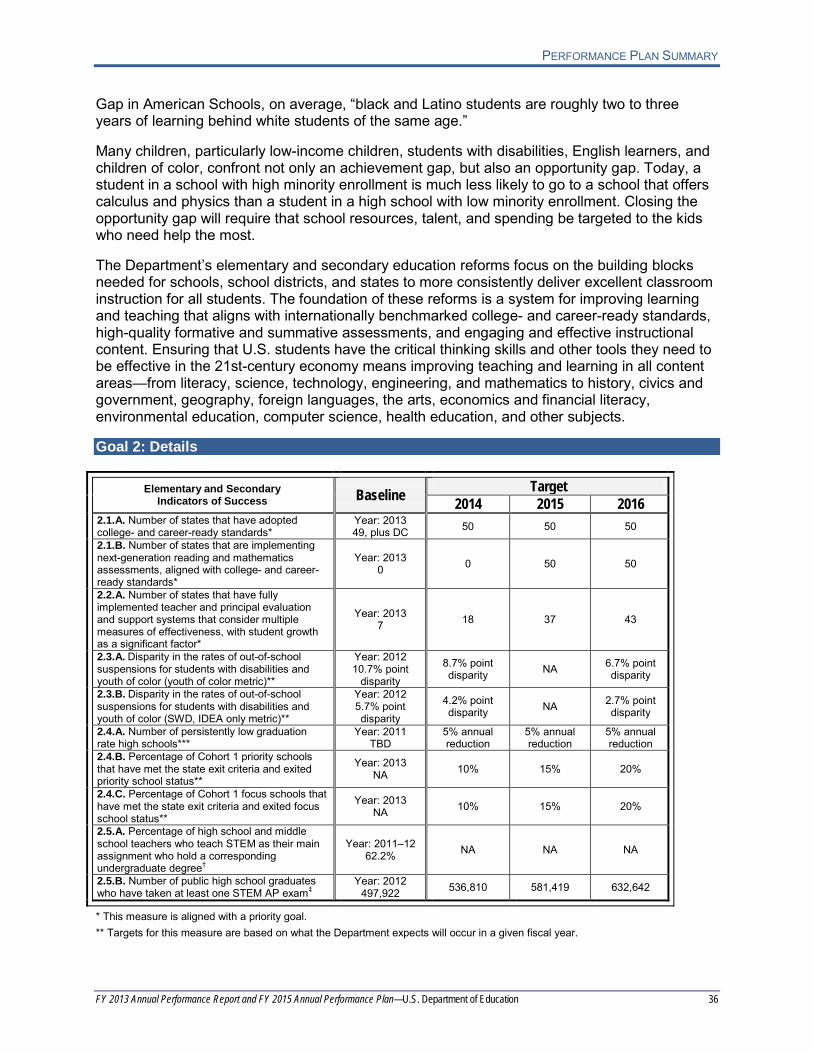
Goal 2: Details
Elementary and Secondary Indicators of Success Baseline Target
2014 2015 2016 2.1.A. Number of states that have adopted college- and career-ready standards*
Year: 2013 49, plus DC 50 50 50
2.1.B. Number of states that are implementing next-generation reading and mathematics assessments, aligned with college- and career-ready standards*
Year: 2013 0 0 50 50
2.2.A. Number of states that have fully implemented teacher and principal evaluation and support systems that consider multiple measures of effectiveness, with student growth as a significant factor*
Year: 2013 7 18 37 43
2.3.A. Disparity in the rates of out-of-school suspensions for students with disabilities and youth of color (youth of color metric)**
Year: 2012 10.7% point
disparity
8.7% point disparity NA 6.7% point
disparity
2.3.B. Disparity in the rates of out-of-school suspensions for students with disabilities and youth of color (SWD, IDEA only metric)**
Year: 2012 5.7% point disparity
4.2% point disparity NA 2.7% point
disparity
2.4.A. Number of persistently low graduation rate high schools***
Year: 2011 TBD
5% annual reduction
5% annual reduction
5% annual reduction
2.4.B. Percentage of Cohort 1 priority schools that have met the state exit criteria and exited priority school status**
Year: 2013 NA 10% 15% 20%
2.4.C. Percentage of Cohort 1 focus schools that have met the state exit criteria and exited focus school status**
Year: 2013 NA 10% 15% 20%
2.5.A. Percentage of high school and middle school teachers who teach STEM as their main assignment who hold a corresponding undergraduate degree†
Year: 2011–12 62.2% NA NA NA
2.5.B. Number of public high school graduates who have taken at least one STEM AP exam‡
Year: 2012 497,922 536,810 581,419 632,642
* This measure is aligned with a priority goal. ** Targets for this measure are based on what the Department expects will occur in a given fiscal year.
PERFORMANCE PLAN SUMMARY
FY 2013 Annual Performance Report and FY 2015 Annual Performance Plan—U.S. Department of Education 37
*** Persistently low graduation rate high schools are defined as regular and vocational high schools with an average minimum cohort size of 65 or more, and an average adjusted cohort graduation rate (ACGR) of 60 percent or less over two years. † Data are produced every four years; thus the Department will only receive one set of data (collected in 2015–16) during this Strategic Plan cycle. ‡ STEM fields include biology, calculus, chemistry, computer science, environmental science, physics, and statistics. NA = Not applicable. Sources: 2.1.A. ESEA Flexibility Monitoring; annually; monitoring and grant applications 2.1.B. ESEA Flexibility Monitoring; annually; monitoring and grant applications 2.2.A. ESEA Flexibility Applications and Monitoring; annually; monitoring and grant applications 2.3.A. Civil Rights Data Collection, ED/OCR; biennially; program and enforcement data collections 2.3.B. Civil Rights Data Collection, ED/OCR; biennially; program and enforcement data collections 2.4.A. EDFacts universe collection, annual reports; annually; program and enforcement data collections 2.4.B. EDFacts universe collection, annual reports; annually; program and enforcement data collections 2.4.C. EDFacts universe collection, annual reports; annually; program and enforcement data collections 2.5.A. Schools and Staffing Survey (SASS), NCES; quadrennially; statistical collections 2.5.B. College Board/AP administrative records; annually; external (nonstatistical) data sources
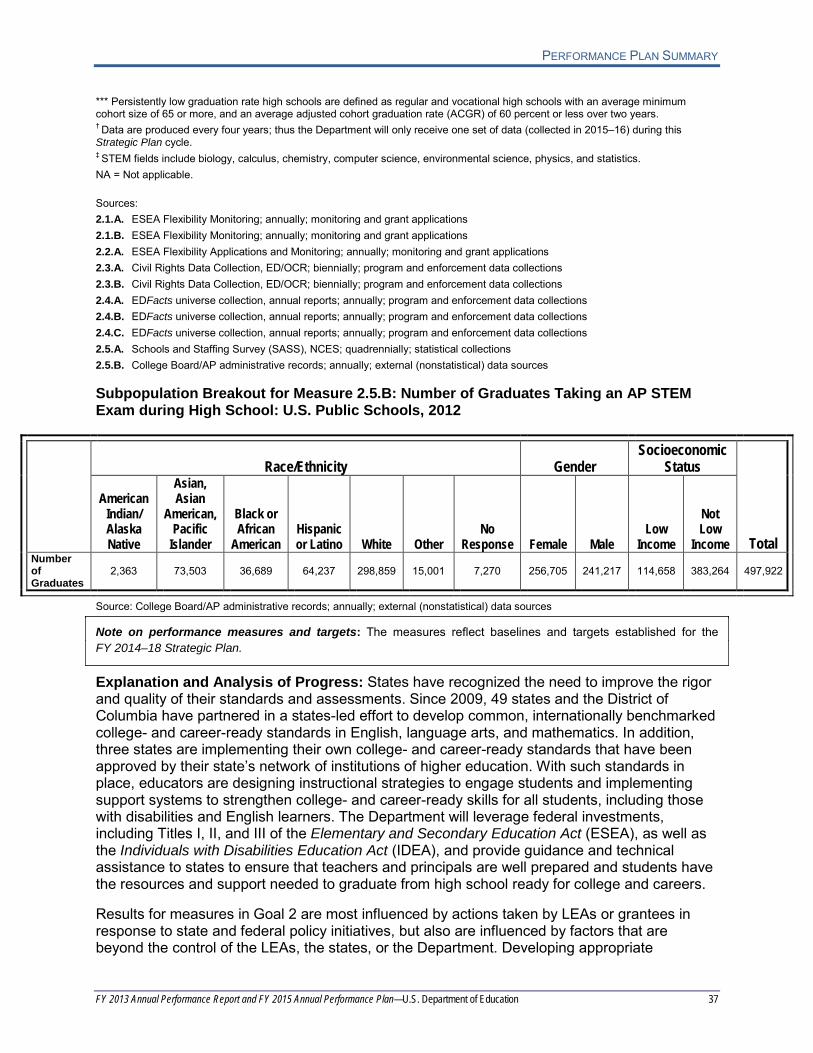
Subpopulation Breakout for Measure 2.5.B: Number of Graduates Taking an AP STEM Exam during High School: U.S. Public Schools, 2012
Race/Ethnicity Gender
Socioeconomic Status
Total
American Indian/ Alaska Native
Asian, Asian
American, Pacific
Islander
Black or African
American Hispanic or Latino White Other
No Response Female Male
Low Income
Not Low
Income Number of Graduates
2,363 73,503 36,689 64,237 298,859 15,001 7,270 256,705 241,217 114,658 383,264 497,922
Source: College Board/AP administrative records; annually; external (nonstatistical) data sources
Note on performance measures and targets: The measures reflect baselines and targets established for the FY 2014–18 Strategic Plan.
Explanation and Analysis of Progress: States have recognized the need to improve the rigor and quality of their standards and assessments. Since 2009, 49 states and the District of Columbia have partnered in a states-led effort to develop common, internationally benchmarked college- and career-ready standards in English, language arts, and mathematics. In addition, three states are implementing their own college- and career-ready standards that have been approved by their state’s network of institutions of higher education. With such standards in place, educators are designing instructional strategies to engage students and implementing support systems to strengthen college- and career-ready skills for all students, including those with disabilities and English learners. The Department will leverage federal investments, including Titles I, II, and III of the Elementary and Secondary Education Act (ESEA), as well as the Individuals with Disabilities Education Act (IDEA), and provide guidance and technical assistance to states to ensure that teachers and principals are well prepared and students have the resources and support needed to graduate from high school ready for college and careers.
Results for measures in Goal 2 are most influenced by actions taken by LEAs or grantees in response to state and federal policy initiatives, but also are influenced by factors that are beyond the control of the LEAs, the states, or the Department. Developing appropriate
PERFORMANCE PLAN SUMMARY
FY 2013 Annual Performance Report and FY 2015 Annual Performance Plan—U.S. Department of Education 38
assessment instruments and approaches for young students poses significant challenges, especially for children from low-income families, children who are English learners, and children with disabilities. Developing and administering the next generation of assessments and supporting teachers through training related to the new standards will require continuing financial support. As teacher and school leader evaluation systems and compensation decisions are governed by state and local policies, without revisions in state policies and new partnerships with teacher organizations, reforms of existing evaluation and compensation systems are unlikely to be successful.
Selected Strategies to Achieve Goal 2 Include:
The Department continues to use the ESEA Flexibility monitoring process to track state implementation and identify areas where technical assistance is needed. This monitoring approach follows on the different kind of relationship the Department built internally across its offices and externally with states during the ESEA Flexibility approval process, including the use of cross-Departmental teams (including staff from the ISU, OSEP, and the Office of School Turnaround), reducing burden and duplication, and reducing overlap between other Department programs and ESEA Flexibility.
A strong reauthorization of the Elementary and Secondary Education Act (ESEA) that reinforces and extends the progress already being made to strengthen the quality of elementary and secondary education would further this goal.
PERFORMANCE PLAN SUMMARY
FY 2013 Annual Performance Report and FY 2015 Annual Performance Plan—U.S. Department of Education 39
Goal 3. Early Learning:
Improve the health, social-emotional, and cognitive outcomes for all children from birth through 3rd grade, so that all children, particularly those with high needs, are on track for graduating from high school college- and career-ready.
Goal Leader: Deb Delisle
Objective/Sub-goal 3.1: Access to High-Quality Programs and Services. Increase access to high-quality early learning programs and comprehensive services, especially for children with high needs. Objective Leader: Libby Doggett
Measure 3.1.A: Number of states with Quality Rating and Improvement Systems (QRIS) that meet high quality benchmarks for child care and other early childhood programs
Objective/Sub-goal 3.2: Effective Workforce. Improve the quality and effectiveness of the early learning workforce so that early childhood educators have the knowledge, skills, and abilities necessary to improve young children’s health, social-emotional, and cognitive outcomes. Objective Leader: Libby Doggett
Measure 3.2.A: Number of states and territories with professional development systems that include core knowledge and competencies, career pathways, professional development capacity assessments, accessible professional development opportunities, and financial supports for child care providers
Objective/Sub-goal 3.3: Measuring Progress, Outcomes, and Readiness. Improve the capacity of states and early learning programs to develop and implement comprehensive early learning assessment systems. Objective Leader: Libby Doggett
Measure 3.3.A: Number of states collecting and reporting disaggregated data on the status of children at kindergarten entry using a common measure
PERFORMANCE PLAN SUMMARY
FY 2013 Annual Performance Report and FY 2015 Annual Performance Plan—U.S. Department of Education 40
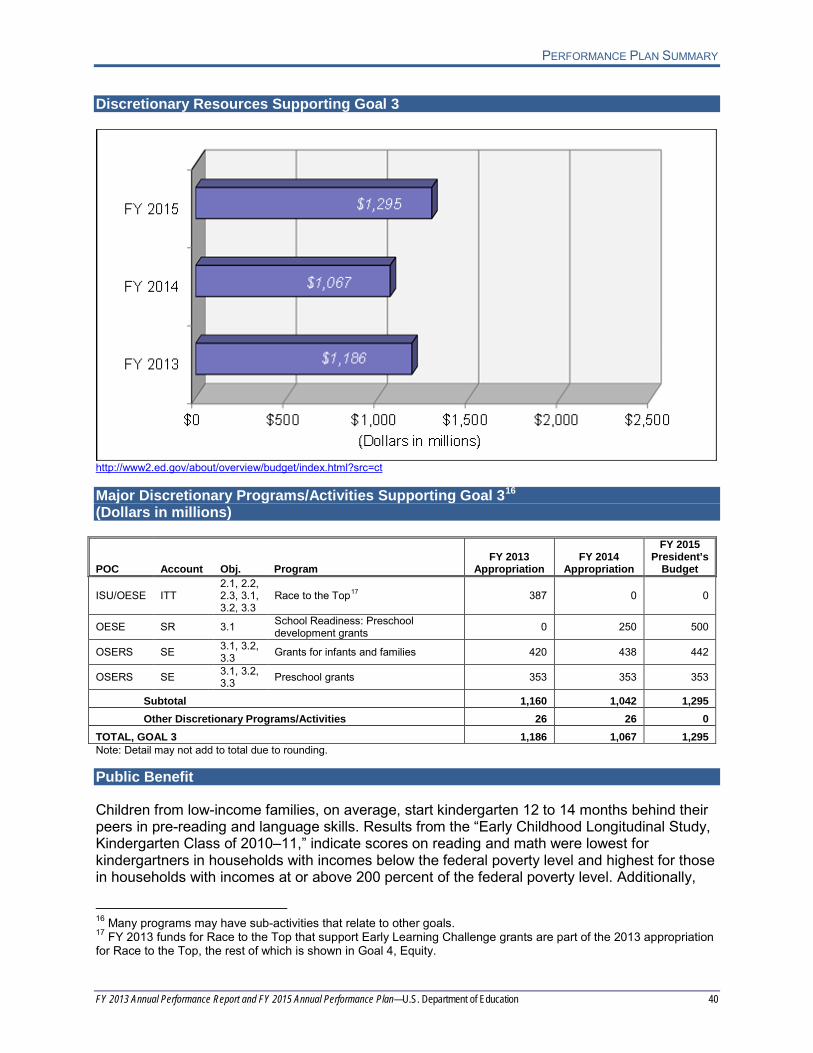
Discretionary Resources Supporting Goal 3
http://www2.ed.gov/about/overview/budget/index.html?src=ct
Major Discretionary Programs/Activities Supporting Goal 316 (Dollars in millions)
POC Account Obj. Program FY 2013
Appropriation FY 2014
Appropriation
FY 2015 President’s
Budget
ISU/OESE ITT 2.1, 2.2, 2.3, 3.1, 3.2, 3.3
Race to the Top17 387 0 0
OESE SR 3.1 School Readiness: Preschool development grants 0 250 500
OSERS SE 3.1, 3.2, 3.3 Grants for infants and families 420 438 442
OSERS SE 3.1, 3.2, 3.3 Preschool grants 353 353 353
Subtotal 1,160 1,042 1,295 Other Discretionary Programs/Activities 26 26 0
TOTAL, GOAL 3 1,186 1,067 1,295 Note: Detail may not add to total due to rounding. Public Benefit
Children from low-income families, on average, start kindergarten 12 to 14 months behind their peers in pre-reading and language skills. Results from the “Early Childhood Longitudinal Study, Kindergarten Class of 2010–11,” indicate scores on reading and math were lowest for kindergartners in households with incomes below the federal poverty level and highest for those in households with incomes at or above 200 percent of the federal poverty level. Additionally,
16 Many programs may have sub-activities that relate to other goals. 17 FY 2013 funds for Race to the Top that support Early Learning Challenge grants are part of the 2013 appropriation for Race to the Top, the rest of which is shown in Goal 4, Equity.
PERFORMANCE PLAN SUMMARY
FY 2013 Annual Performance Report and FY 2015 Annual Performance Plan—U.S. Department of Education 41
children with a primary home language of English scored higher in reading and math than those coming from homes with a primary home language other than English. High-quality early learning provides the foundation for children's success in school and helps to mitigate educational gaps that exist for children with high needs before they enter kindergarten. By increasing access to high-quality early learning programs and services, the country can work to close, or even prevent, the achievement gap.
Preschool for All, a federal-state partnership that would provide voluntary, high-quality preschool to all 4-year-olds from low- and moderate-income families, would help eliminate that gap. The program would also create incentives for states to expand publicly funded preschool to middle-class families above 200 percent of the federal poverty level, and promote access to high-quality, full-day kindergarten and early learning programs for children under the age of 4. The administration is also proposing Preschool Development Grants to support state efforts to establish the infrastructure for high-quality preschool. This will enable more states with preschool systems at various stages of development to provide universal access to high-quality preschool for 4-year-old children from low- and moderate-income families. In addition, the administration has proposed an increase in funding for the Individuals with Disabilities Education Act (IDEA) Part C program to continue to support high-quality services for infants and toddlers with disabilities and their families.
These quality early learning efforts build on significant work from the administration’s first term and ongoing federal investments in programs serving young children, including more than $5 billion invested in early childhood programs through the American Recovery and Reinvestment Act (Recovery Act), as well as Race to the Top – Early Learning Challenge (RTT-ELC), a program jointly administered by the Department of Education and the Department of Health and Human Services (HHS). The program has rewarded states that have agreed to raise the bar on the quality of their early learning programs; establish higher standards; and provide critical links with health, nutrition, mental health, and family support. RTT-ELC states serve as model early learning and development systems, and are part of a national technical assistance strategy to reach all states. Only by coordinating the patchwork of early learning programs and services, and better integrating them with the elementary and secondary education system, can an integrated early learning system be built that improves health, social-emotional, and cognitive outcomes for children from birth through third grade. A high-quality, coordinated early learning system includes program standards, comprehensive assessment systems, workforce and professional development systems, family and community engagement, health promotion, and data systems.
In supporting the alignment of these systems, the administration will focus its efforts on improving outcomes for children with high needs by ensuring that they have access to high-quality early learning programs with demonstrated success in closing achievement gaps and reducing grade retention rates in later years. To enhance the quality of these programs and services, and improve outcomes for children from birth through third grade, including children with disabilities and those who are English learners, the Department will promote initiatives that increase access to high-quality, effective programs; improve the quality of the early childhood workforce; and support comprehensive assessment systems.
PERFORMANCE PLAN SUMMARY
FY 2013 Annual Performance Report and FY 2015 Annual Performance Plan—U.S. Department of Education 42
Goal 3: Details
Early Learning Indicators of Success Baseline Target
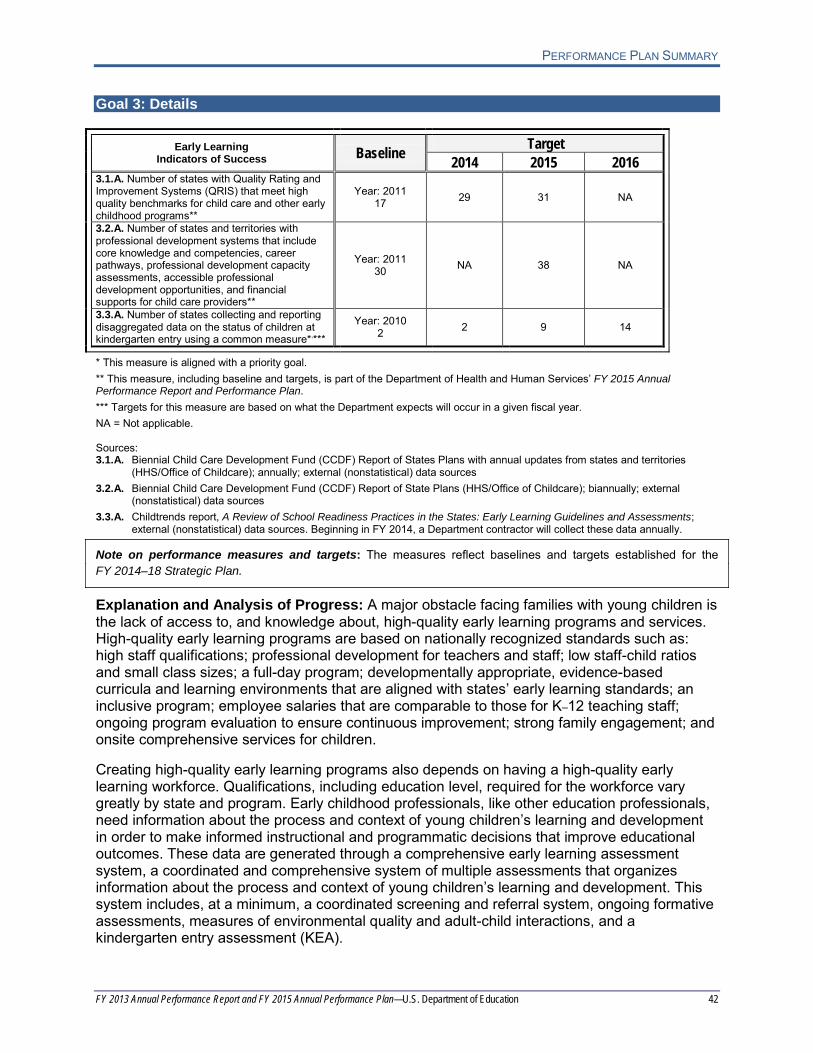
2014 2015 2016 3.1.A. Number of states with Quality Rating and Improvement Systems (QRIS) that meet high quality benchmarks for child care and other early childhood programs**
Year: 2011 17 29 31 NA
3.2.A. Number of states and territories with professional development systems that include core knowledge and competencies, career pathways, professional development capacity assessments, accessible professional development opportunities, and financial supports for child care providers**
Year: 2011 30 NA 38 NA
3.3.A. Number of states collecting and reporting disaggregated data on the status of children at kindergarten entry using a common measure*,***
Year: 2010 2 2 9 14
* This measure is aligned with a priority goal. ** This measure, including baseline and targets, is part of the Department of Health and Human Services’ FY 2015 Annual Performance Report and Performance Plan. *** Targets for this measure are based on what the Department expects will occur in a given fiscal year. NA = Not applicable. Sources: 3.1.A. Biennial Child Care Development Fund (CCDF) Report of States Plans with annual updates from states and territories
(HHS/Office of Childcare); annually; external (nonstatistical) data sources 3.2.A. Biennial Child Care Development Fund (CCDF) Report of State Plans (HHS/Office of Childcare); biannually; external
(nonstatistical) data sources 3.3.A. Childtrends report, A Review of School Readiness Practices in the States: Early Learning Guidelines and Assessments;
external (nonstatistical) data sources. Beginning in FY 2014, a Department contractor will collect these data annually.
Note on performance measures and targets: The measures reflect baselines and targets established for the FY 2014–18 Strategic Plan.
Explanation and Analysis of Progress: A major obstacle facing families with young children is the lack of access to, and knowledge about, high-quality early learning programs and services. High-quality early learning programs are based on nationally recognized standards such as: high staff qualifications; professional development for teachers and staff; low staff-child ratios and small class sizes; a full-day program; developmentally appropriate, evidence-based curricula and learning environments that are aligned with states’ early learning standards; an inclusive program; employee salaries that are comparable to those for K–12 teaching staff; ongoing program evaluation to ensure continuous improvement; strong family engagement; and onsite comprehensive services for children.
Creating high-quality early learning programs also depends on having a high-quality early learning workforce. Qualifications, including education level, required for the workforce vary greatly by state and program. Early childhood professionals, like other education professionals, need information about the process and context of young children’s learning and development in order to make informed instructional and programmatic decisions that improve educational outcomes. These data are generated through a comprehensive early learning assessment system, a coordinated and comprehensive system of multiple assessments that organizes information about the process and context of young children’s learning and development. This system includes, at a minimum, a coordinated screening and referral system, ongoing formative assessments, measures of environmental quality and adult-child interactions, and a kindergarten entry assessment (KEA).
PERFORMANCE PLAN SUMMARY
FY 2013 Annual Performance Report and FY 2015 Annual Performance Plan—U.S. Department of Education 43
Measures in Goal 3 are influenced most by actions taken by SEAs or grantees in response to state and federal policy initiatives, but also are influenced by factors that are beyond the control of the LEAs, the states, or the Department. A baseline of 19 states was established in FY 2012 for measure 3.1.A and outyear targets have been adjusted. A baseline of 31 states was established in FY 2011 for measure 3.2.A and outyear targets have been adjusted. A baseline of two states was established in FY 2010 for measure 3.3.A.
Selected Strategies to Achieve Goal 3 Include:
The Department and its early childhood technical assistance center will support both RTT-ELC grantee states and non-grantee states by establishing learning communities and providing technical assistance webinars, briefs, and reports on KEAs. The Department will use an electronic grant monitoring tool, GRADS 360, and other means to monitor and report on KEA progress. Additionally, the Department will work with its Office of Elementary and Secondary Education’s (OESE) newly funded national comprehensive center, the Center on Enhancing Early Learning Outcomes (CEELO), to provide targeted technical assistance on KEA development or enhancement.
In supporting the alignment of early childhood education delivery systems, the administration will focus its efforts on improving outcomes for children with high needs by ensuring that children from birth through third grade have access to high-quality early learning programs with demonstrated success in closing achievement gaps and reducing grade retention rates in later years. To enhance the quality of these programs and services, and improve children’s outcomes, including children with disabilities and those who are English learners, the Department will promote initiatives that increase access to high-quality, effective programs, improve the quality of the early childhood workforce, and support comprehensive assessment systems.
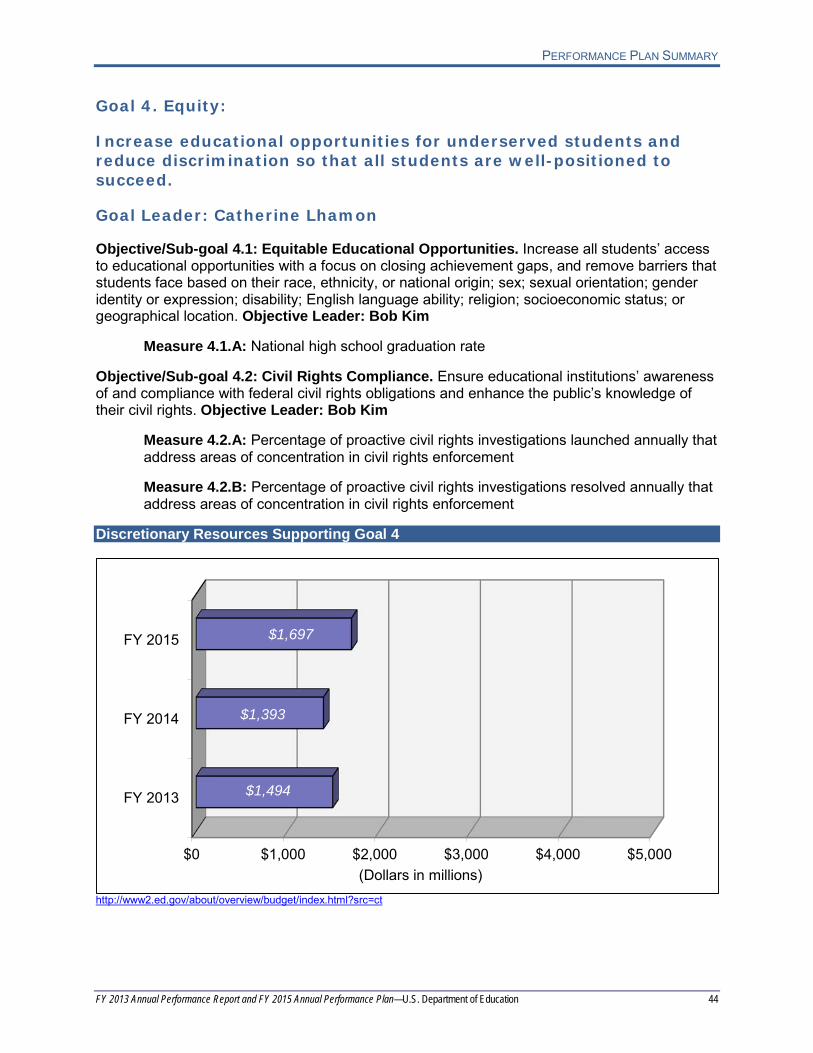
PERFORMANCE PLAN SUMMARY
FY 2013 Annual Performance Report and FY 2015 Annual Performance Plan—U.S. Department of Education 44
Goal 4. Equity:
Increase educational opportunities for underserved students and reduce discrimination so that all students are well-positioned to succeed.
Goal Leader: Catherine Lhamon
Objective/Sub-goal 4.1: Equitable Educational Opportunities. Increase all students’ access to educational opportunities with a focus on closing achievement gaps, and remove barriers that students face based on their race, ethnicity, or national origin; sex; sexual orientation; gender identity or expression; disability; English language ability; religion; socioeconomic status; or geographical location. Objective Leader: Bob Kim
Measure 4.1.A: National high school graduation rate
Objective/Sub-goal 4.2: Civil Rights Compliance. Ensure educational institutions’ awareness of and compliance with federal civil rights obligations and enhance the public’s knowledge of their civil rights. Objective Leader: Bob Kim
Measure 4.2.A: Percentage of proactive civil rights investigations launched annually that address areas of concentration in civil rights enforcement
Measure 4.2.B: Percentage of proactive civil rights investigations resolved annually that address areas of concentration in civil rights enforcement
Discretionary Resources Supporting Goal 4
$0 $1,000 $2,000 $3,000 $4,000 $5,000
FY 2013
FY 2014
FY 2015
$1,494
$1,393
$1,697
(Dollars in millions)
http://www2.ed.gov/about/overview/budget/index.html?src=ct
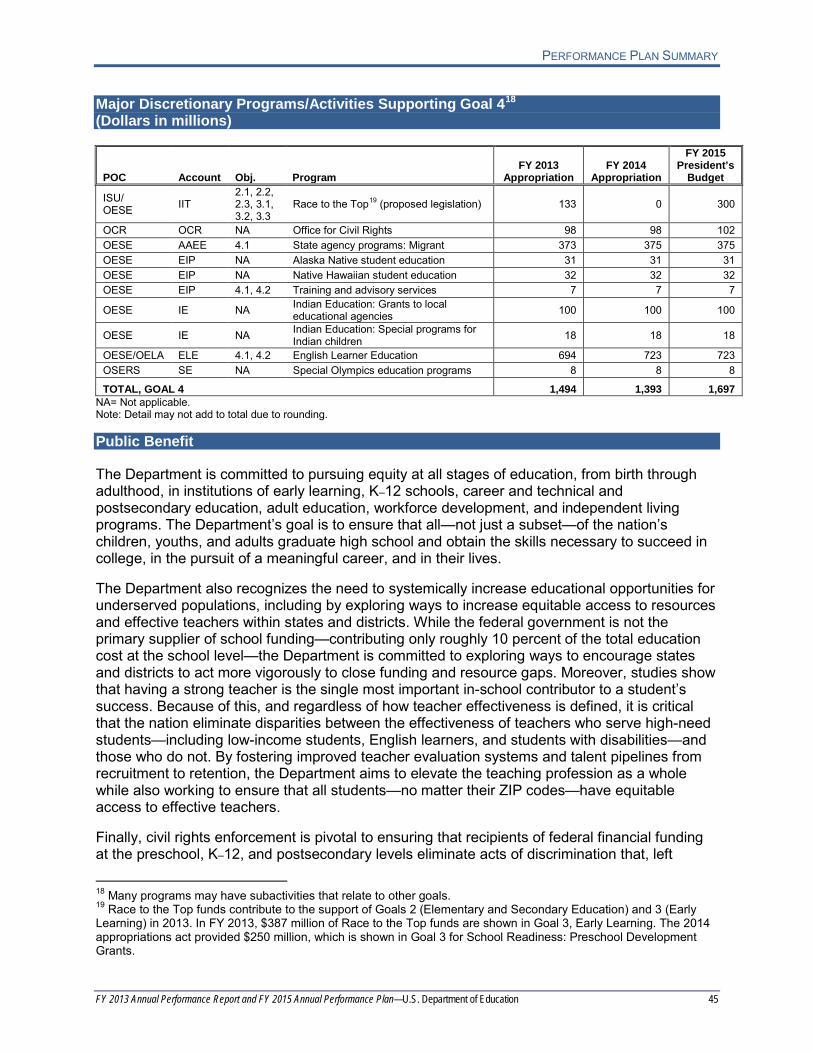
PERFORMANCE PLAN SUMMARY
FY 2013 Annual Performance Report and FY 2015 Annual Performance Plan—U.S. Department of Education 45
Major Discretionary Programs/Activities Supporting Goal 418 (Dollars in millions)
POC Account Obj. Program FY 2013
Appropriation FY 2014
Appropriation
FY 2015 President’s
Budget
ISU/ OESE IIT
2.1, 2.2, 2.3, 3.1, 3.2, 3.3
Race to the Top19 (proposed legislation) 133 0 300
OCR OCR NA Office for Civil Rights 98 98 102 OESE AAEE 4.1 State agency programs: Migrant 373 375 375 OESE EIP NA Alaska Native student education 31 31 31 OESE EIP NA Native Hawaiian student education 32 32 32 OESE EIP 4.1, 4.2 Training and advisory services 7 7 7
OESE IE NA Indian Education: Grants to local educational agencies 100 100 100
OESE IE NA Indian Education: Special programs for Indian children 18 18 18
OESE/OELA ELE 4.1, 4.2 English Learner Education 694 723 723 OSERS SE NA Special Olympics education programs 8 8 8
TOTAL, GOAL 4 1,494 1,393 1,697 NA= Not applicable. Note: Detail may not add to total due to rounding. Public Benefit
The Department is committed to pursuing equity at all stages of education, from birth through adulthood, in institutions of early learning, K–12 schools, career and technical and postsecondary education, adult education, workforce development, and independent living programs. The Department’s goal is to ensure that all—not just a subset—of the nation’s children, youths, and adults graduate high school and obtain the skills necessary to succeed in college, in the pursuit of a meaningful career, and in their lives.
The Department also recognizes the need to systemically increase educational opportunities for underserved populations, including by exploring ways to increase equitable access to resources and effective teachers within states and districts. While the federal government is not the primary supplier of school funding—contributing only roughly 10 percent of the total education cost at the school level—the Department is committed to exploring ways to encourage states and districts to act more vigorously to close funding and resource gaps. Moreover, studies show that having a strong teacher is the single most important in-school contributor to a student’s success. Because of this, and regardless of how teacher effectiveness is defined, it is critical that the nation eliminate disparities between the effectiveness of teachers who serve high-need students—including low-income students, English learners, and students with disabilities—and those who do not. By fostering improved teacher evaluation systems and talent pipelines from recruitment to retention, the Department aims to elevate the teaching profession as a whole while also working to ensure that all students—no matter their ZIP codes—have equitable access to effective teachers.
Finally, civil rights enforcement is pivotal to ensuring that recipients of federal financial funding at the preschool, K–12, and postsecondary levels eliminate acts of discrimination that, left
18 Many programs may have subactivities that relate to other goals. 19 Race to the Top funds contribute to the support of Goals 2 (Elementary and Secondary Education) and 3 (Early Learning) in 2013. In FY 2013, $387 million of Race to the Top funds are shown in Goal 3, Early Learning. The 2014 appropriations act provided $250 million, which is shown in Goal 3 for School Readiness: Preschool Development Grants.
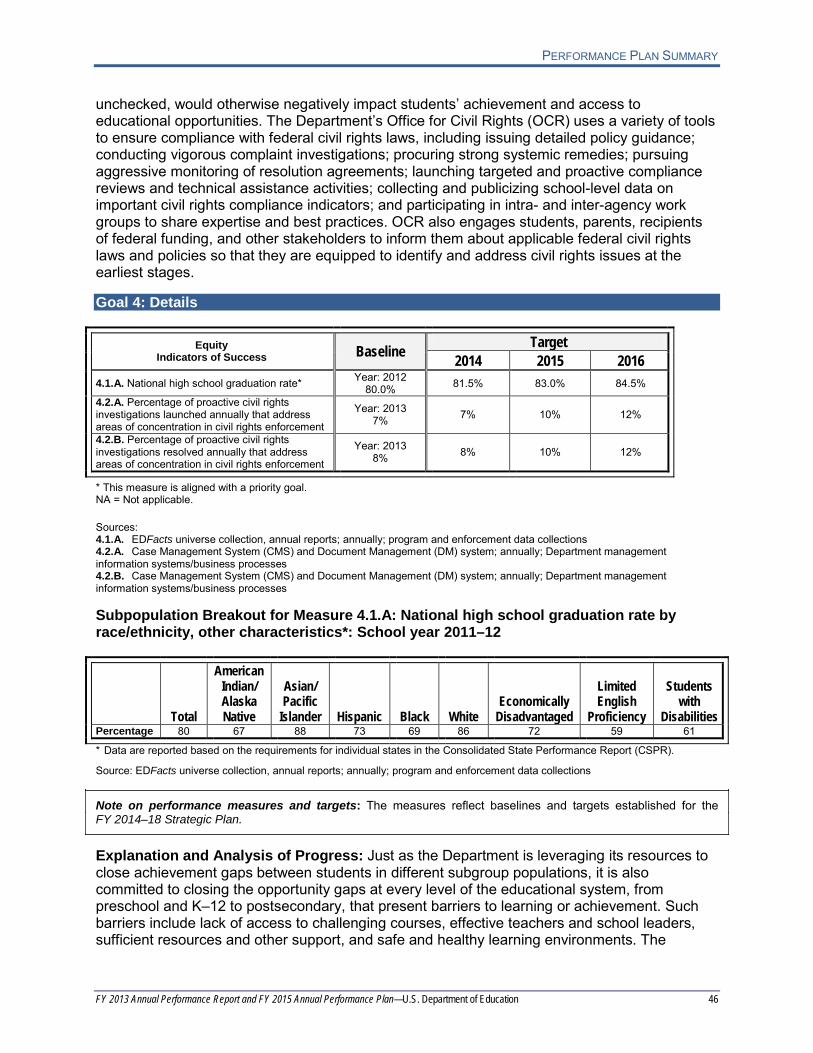
PERFORMANCE PLAN SUMMARY
FY 2013 Annual Performance Report and FY 2015 Annual Performance Plan—U.S. Department of Education 46
unchecked, would otherwise negatively impact students’ achievement and access to educational opportunities. The Department’s Office for Civil Rights (OCR) uses a variety of tools to ensure compliance with federal civil rights laws, including issuing detailed policy guidance; conducting vigorous complaint investigations; procuring strong systemic remedies; pursuing aggressive monitoring of resolution agreements; launching targeted and proactive compliance reviews and technical assistance activities; collecting and publicizing school-level data on important civil rights compliance indicators; and participating in intra- and inter-agency work groups to share expertise and best practices. OCR also engages students, parents, recipients of federal funding, and other stakeholders to inform them about applicable federal civil rights laws and policies so that they are equipped to identify and address civil rights issues at the earliest stages.
Goal 4: Details
Equity Indicators of Success Baseline Target
2014 2015 2016 4.1.A. National high school graduation rate* Year: 2012
80.0% 81.5% 83.0% 84.5%
4.2.A. Percentage of proactive civil rights investigations launched annually that address areas of concentration in civil rights enforcement
Year: 2013 7% 7% 10% 12%
4.2.B. Percentage of proactive civil rights investigations resolved annually that address areas of concentration in civil rights enforcement
Year: 2013 8% 8% 10% 12%
* This measure is aligned with a priority goal. NA = Not applicable. Sources: 4.1.A. EDFacts universe collection, annual reports; annually; program and enforcement data collections 4.2.A. Case Management System (CMS) and Document Management (DM) system; annually; Department management information systems/business processes 4.2.B. Case Management System (CMS) and Document Management (DM) system; annually; Department management information systems/business processes Subpopulation Breakout for Measure 4.1.A: National high school graduation rate by race/ethnicity, other characteristics*: School year 2011–12
Total
American Indian/ Alaska Native
Asian/ Pacific
Islander Hispanic Black White Economically
Disadvantaged
Limited English
Proficiency
Students with
Disabilities Percentage 80 67 88 73 69 86 72 59 61
* Data are reported based on the requirements for individual states in the Consolidated State Performance Report (CSPR).
Source: EDFacts universe collection, annual reports; annually; program and enforcement data collections
Note on performance measures and targets: The measures reflect baselines and targets established for the FY 2014–18 Strategic Plan.
Explanation and Analysis of Progress: Just as the Department is leveraging its resources to close achievement gaps between students in different subgroup populations, it is also committed to closing the opportunity gaps at every level of the educational system, from preschool and K–12 to postsecondary, that present barriers to learning or achievement. Such barriers include lack of access to challenging courses, effective teachers and school leaders, sufficient resources and other support, and safe and healthy learning environments. The

PERFORMANCE PLAN SUMMARY
FY 2013 Annual Performance Report and FY 2015 Annual Performance Plan—U.S. Department of Education 47
Department recognizes that these barriers may, depending on their nature, disproportionately affect one or more student subpopulations, including racial and ethnic minority students; low-income students; students of faith; English learners; students with disabilities; girls and women; lesbian, gay, bisexual, and transgender students; and students who live in geographical locations with greater barriers or fewer opportunities. The lack of student diversity may perpetuate inequitable access to opportunities and fail to prepare students for an increasingly diverse workplace and society.
As the Department pursues programs and activities designed to serve all students, it must ensure that the specific needs of these underserved student subpopulations are being met. The Department also recognizes the need to foster student diversity and to systemically increase educational opportunities for all students, by exploring ways to better research, measure, and support the efficient use and equitable distribution of resources within states and districts based upon what each student needs in order to achieve at a high level.
In addition, through complementary activities that include proactive technical assistance, complaint investigations, targeted compliance reviews, strong systemic remedies, aggressive monitoring of resolution agreements, policy guidance, and intra- and inter-agency sharing of best practices, the Department is using, and will continue to pursue in FY 2014–18, an integrated approach to civil rights enforcement to address key civil rights areas.
Below is a link to the Civil Rights Data Collection (CRDC), which the Department has expanded to include a wealth of new data to assist the Department, states, districts, teachers, administrators, researchers, students, and parents in identifying civil rights trends and issues at the local, state, and national levels: http://ocrdata.ed.gov.
Selected Strategies to Achieve Goal 4 Include:
The Department’s Office for Civil Rights (OCR) will continue to use a variety of tools to ensure compliance with federal civil rights laws, including issuing detailed policy guidance; conducting vigorous complaint investigations; procuring strong systemic remedies; pursuing aggressive monitoring of resolution agreements; launching targeted and proactive compliance reviews and technical assistance activities; collecting and publicizing school-level data on important civil rights compliance indicators; and participating in intra- and inter-agency work groups to share expertise and best practices.
Additionally, the Department will continue to work with states towards implementing key reforms that will increase graduation rates and close gaps in graduation rates between student groups. In particular, the Department will continue to monitor states, through ESEA Flexibility, to ensure that schools in which subgroups are not meeting graduation rate targets receive interventions and supports.
PERFORMANCE PLAN SUMMARY
FY 2013 Annual Performance Report and FY 2015 Annual Performance Plan—U.S. Department of Education 48
Goal 5. Continuous Improvement of the U.S. Education System:
Enhance the education system’s ability to continuously improve through better and more widespread use of data, research and evaluation, evidence, transparency, innovation, and technology.
Goal Leader: Jim Shelton
Objective/Sub-goal 5.1: Data Systems and Transparency. Facilitate the development of interoperable longitudinal data systems for early learning through employment to enable data-driven, transparent decision-making by increasing access to timely, reliable, and high-value data. Objective Leader: John Easton
Measure 5.1.A: Number of public data sets included in ED Data Inventory and thus linked to Data.gov or ED.gov websites
Measure 5.1.B: Number of states linking K–12 and postsecondary data with workforce data
Measure 5.1.C: Number of states linking K–12 with early childhood data
Objective/Sub-goal 5.2: Privacy. Provide all education stakeholders, from early childhood to adult learning, with technical assistance and guidance to help them protect student privacy while effectively managing and using student information. Objective Leader: Kathleen Styles
Measure 5.2.A: Average time to close “cases” (PTAC + FPCO)20
Objective/Sub-goal 5.3: Research, Evaluation, and Use of Evidence. Invest in research and evaluation that builds evidence for education improvement; communicate findings effectively; and drive the use of evidence in decision-making by internal and external stakeholders. Objective Leaders: Sue Betka, Gabriella Gomez, and Marisa Bold
Measure 5.3.A: Percentage of select new21 (non-continuation) competitive grant dollars that reward evidence
Measure 5.3.B: Number of peer-reviewed, full-text resources in the Education Resources Information Center (ERIC)
Measure 5.3.C: Number of reviewed studies in the What Works Clearinghouse (WWC) database
Objective 5.4: Technology and Innovation. Accelerate the development and broad adoption of new, effective programs, processes, and strategies, including education technology. Objective Leader: Richard Culatta
20 Privacy Technical Assistance Center (PTAC) and Family Policy Compliance Office (FPCO). 21 “New competitive grant dollars that reward evidence” includes all dollars awarded based on the existence of at least “evidence of promise” in support of a project, per the framework in the Education Department General Administrative Regulations (34 CFR Part 75). Consideration of such evidence appears through: eligibility threshold (e.g., in the Investing in Innovation program); absolute priority; competitive priority (earning at least one point for it); or selection criteria (earning at least one point for it). The percentage is calculated compared to the total new grant dollars awarded, excluding awards made by the Institute of Education Sciences, the National Institute on Disability and Rehabilitation Research, and technical assistance centers, with some exceptions.
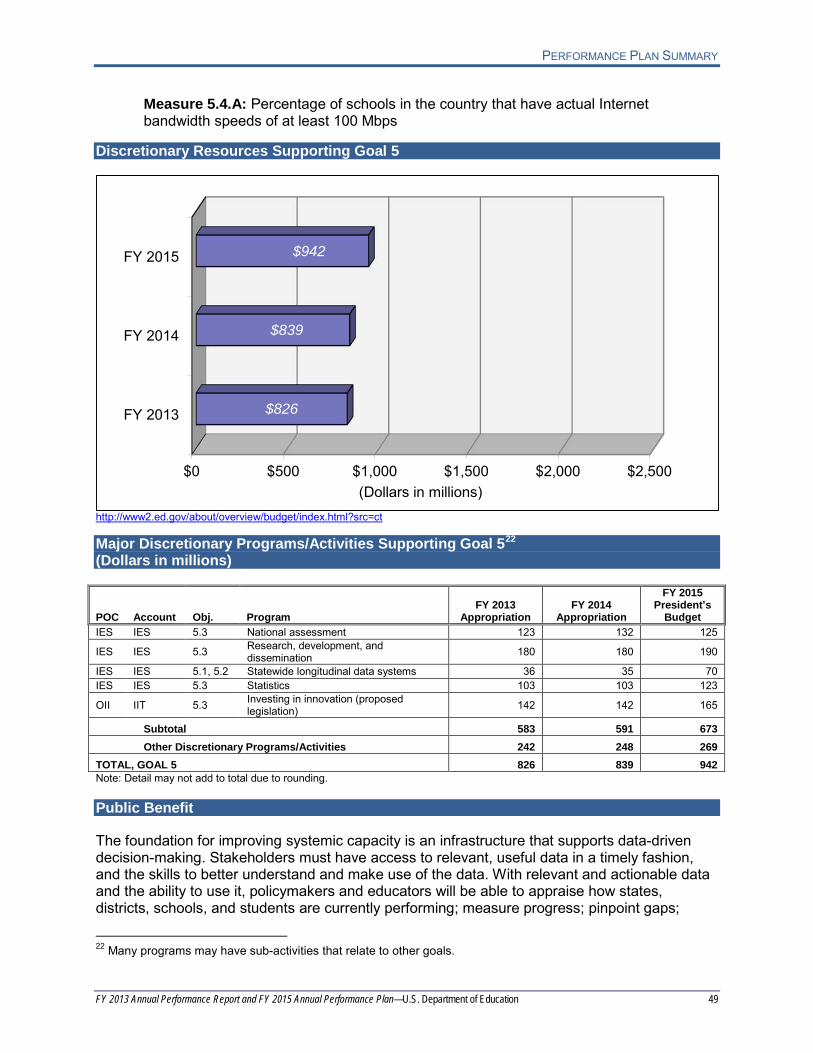
PERFORMANCE PLAN SUMMARY
FY 2013 Annual Performance Report and FY 2015 Annual Performance Plan—U.S. Department of Education 49
Measure 5.4.A: Percentage of schools in the country that have actual Internet bandwidth speeds of at least 100 Mbps
Discretionary Resources Supporting Goal 5
$0 $500 $1,000 $1,500 $2,000 $2,500
FY 2013
FY 2014
FY 2015
$826
$839
$942
(Dollars in millions)
http://www2.ed.gov/about/overview/budget/index.html?src=ct Major Discretionary Programs/Activities Supporting Goal 522 (Dollars in millions)
POC Account Obj. Program FY 2013
Appropriation FY 2014
Appropriation
FY 2015 President’s
Budget IES IES 5.3 National assessment 123 132 125
IES IES 5.3 Research, development, and dissemination 180 180 190
IES IES 5.1, 5.2 Statewide longitudinal data systems 36 35 70 IES IES 5.3 Statistics 103 103 123
OII IIT 5.3 Investing in innovation (proposed legislation) 142 142 165
Subtotal 583 591 673 Other Discretionary Programs/Activities 242 248 269
TOTAL, GOAL 5 826 839 942 Note: Detail may not add to total due to rounding.
Public Benefit
The foundation for improving systemic capacity is an infrastructure that supports data-driven decision-making. Stakeholders must have access to relevant, useful data in a timely fashion, and the skills to better understand and make use of the data. With relevant and actionable data and the ability to use it, policymakers and educators will be able to appraise how states, districts, schools, and students are currently performing; measure progress; pinpoint gaps;
22 Many programs may have sub-activities that relate to other goals.
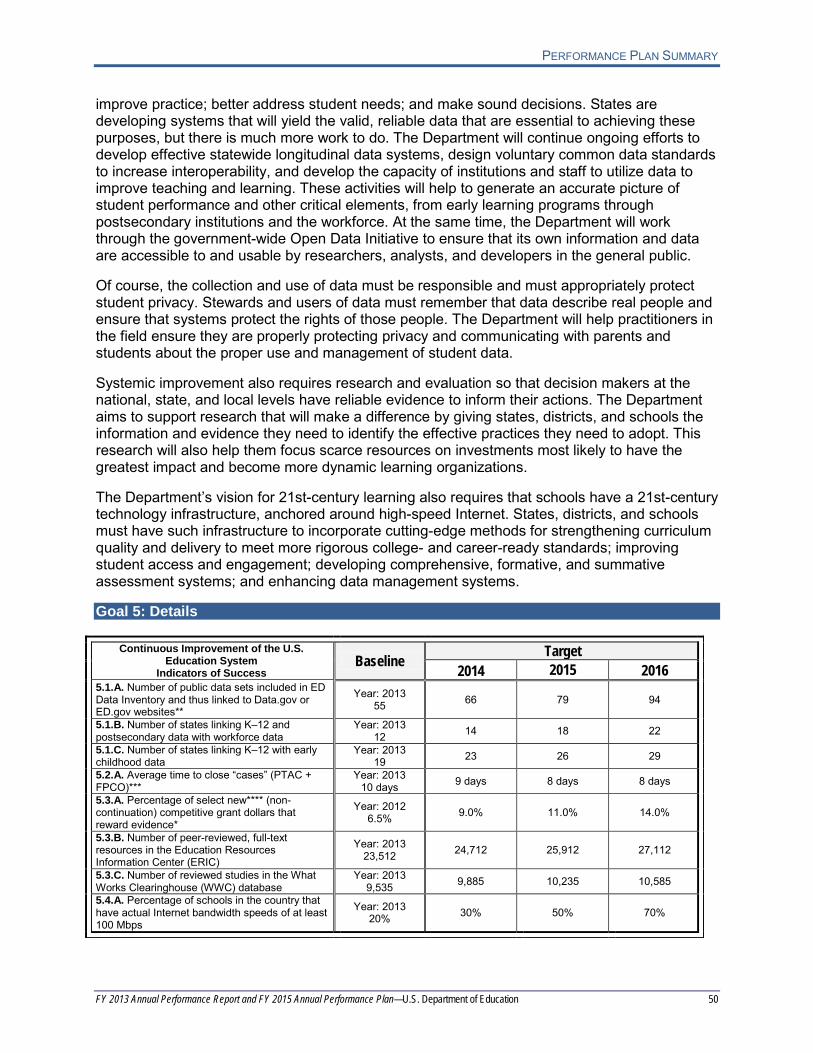
PERFORMANCE PLAN SUMMARY
FY 2013 Annual Performance Report and FY 2015 Annual Performance Plan—U.S. Department of Education 50
improve practice; better address student needs; and make sound decisions. States are developing systems that will yield the valid, reliable data that are essential to achieving these purposes, but there is much more work to do. The Department will continue ongoing efforts to develop effective statewide longitudinal data systems, design voluntary common data standards to increase interoperability, and develop the capacity of institutions and staff to utilize data to improve teaching and learning. These activities will help to generate an accurate picture of student performance and other critical elements, from early learning programs through postsecondary institutions and the workforce. At the same time, the Department will work through the government-wide Open Data Initiative to ensure that its own information and data are accessible to and usable by researchers, analysts, and developers in the general public.
Of course, the collection and use of data must be responsible and must appropriately protect student privacy. Stewards and users of data must remember that data describe real people and ensure that systems protect the rights of those people. The Department will help practitioners in the field ensure they are properly protecting privacy and communicating with parents and students about the proper use and management of student data.
Systemic improvement also requires research and evaluation so that decision makers at the national, state, and local levels have reliable evidence to inform their actions. The Department aims to support research that will make a difference by giving states, districts, and schools the information and evidence they need to identify the effective practices they need to adopt. This research will also help them focus scarce resources on investments most likely to have the greatest impact and become more dynamic learning organizations.
The Department’s vision for 21st-century learning also requires that schools have a 21st-century technology infrastructure, anchored around high-speed Internet. States, districts, and schools must have such infrastructure to incorporate cutting-edge methods for strengthening curriculum quality and delivery to meet more rigorous college- and career-ready standards; improving student access and engagement; developing comprehensive, formative, and summative assessment systems; and enhancing data management systems.
Goal 5: Details
Continuous Improvement of the U.S. Education System
Indicators of Success Baseline Target
2014 2015 2016 5.1.A. Number of public data sets included in ED Data Inventory and thus linked to Data.gov or ED.gov websites**
Year: 2013 55 66 79 94
5.1.B. Number of states linking K–12 and postsecondary data with workforce data
Year: 2013 12 14 18 22
5.1.C. Number of states linking K–12 with early childhood data
Year: 2013 19 23 26 29
5.2.A. Average time to close “cases” (PTAC + FPCO)***
Year: 2013 10 days 9 days 8 days 8 days
5.3.A. Percentage of select new**** (non-continuation) competitive grant dollars that reward evidence*
Year: 2012 6.5% 9.0% 11.0% 14.0%
5.3.B. Number of peer-reviewed, full-text resources in the Education Resources Information Center (ERIC)
Year: 2013 23,512 24,712 25,912 27,112
5.3.C. Number of reviewed studies in the What Works Clearinghouse (WWC) database
Year: 2013 9,535 9,885 10,235 10,585
5.4.A. Percentage of schools in the country that have actual Internet bandwidth speeds of at least 100 Mbps
Year: 2013 20% 30% 50% 70%
PERFORMANCE PLAN SUMMARY
FY 2013 Annual Performance Report and FY 2015 Annual Performance Plan—U.S. Department of Education 51
* This measure is aligned with a priority goal. ** The data sets have been published on Data.gov, www.ed.gov, NCES.ED.gov, studentaid.ed.gov, or other ED.gov subdomain websites. *** Privacy Technical Assistance Center (PTAC) and Family Policy Compliance Office (FPCO). **** “New competitive grant dollars that reward evidence” includes all dollars awarded based on the existence of at least “evidence of promise” in support of a project, per the framework in the Education Department General Administrative Regulations (34 CFR Part 75). Consideration of such evidence appears through: eligibility threshold (e.g., in the Investing in Innovation program); absolute priority; competitive priority (earning at least one point for it); or selection criteria (earning at least one point for it). The percentage is calculated compared to the total new grant dollars awarded, excluding awards made by the Institute of Education Sciences, the National Institute on Disability and Rehabilitation Research, and technical assistance centers, with some exceptions. Sources: 5.1.A. Count provided by Department staff, based upon the data sets on ed.gov, and public use data identified in the ED Data
Inventory; annually; Department management information systems/business processes 5.1.B. Grant monitoring; quarterly; monitoring and grant applications 5.1.C. Grant monitoring; quarterly; monitoring and grant applications 5.2.A. Case Tracking System (CTS); quarterly; Department management information systems/business processes 5.3.A. ED calculations based upon multiple Department-controlled data sources, including G5; annually; Department management
information systems/business processes 5.3.B. Education Resources Information Center (ERIC); quarterly; Department management information systems/business
processes 5.3.C. What Works Clearinghouse (WWC); quarterly; Department management information systems/business processes 5.4.A. Education Superhighway; annually; external (nonstatistical) data sources
Note on performance measures and targets: The measures reflect baselines and targets established for the FY 2014–18 Strategic Plan.
Explanation and Analysis of Progress: To bring about a culture of continuous improvement, teachers, leaders, and other stakeholders in the education community need timely access to high-value data that will enable them to see and understand the factors related to student achievement and child development. However, for many, the infrastructure for this kind of data-driven decision-making is not readily accessible.
While states are making significant progress in developing data systems, too often data are maintained in a system particular to only one sector of the education community or are not shared in a timely manner with policymakers and practitioners. Time lags, data gaps, and difficulty accessing the information make it challenging for schools and districts to identify best practices, measure growth in student performance, and improve teaching and learning. Even when data are available and widely shared, in many cases they are not used to drive instructional practices or decision-making.
During the past decade, the Department has made significant progress in this area by supporting rigorous, independent evaluations of education initiatives; defining and promoting standards for research on effectiveness; funding long-term research projects in education, as well as short-term work in response to immediate practitioner needs; investing in a variety of types of research, ranging from design and development to large-scale impact studies; using innovative models for tiered-evidence grant-making; and promoting the use of evidence to drive decision-making.
Data sets published through the Data.gov or ED.gov websites include data sets that are available online for public use as a downloadable file—for example, a .CSV (comma-separated values) file—or via application programming interfaces (APIs)—for example, a .JSON file. The data sets have been published on http://www.data.gov/, Data.ed.gov, nces.ed.gov, studentaid.ed.gov, or other ed.gov subdomain websites.
PERFORMANCE PLAN SUMMARY
FY 2013 Annual Performance Report and FY 2015 Annual Performance Plan—U.S. Department of Education 52
Results for measures 5.1.B, 5.1.C, and 5.4.A are most influenced by actions taken by LEAs or grantees in response to state and federal policy initiatives, but also are influenced by factors that are beyond the control of the LEAs, the states, or the Department.
Efforts to develop robust, integrated data systems will be constrained by the amount of time, financial resources, and support available to SEAs and LEAs. Wide variations in state and district data systems present unique challenges for each state. Some district data systems, for example, far surpass their own state’s data system. Efforts to ensure that data systems lead to data-driven decision-making also need to address privacy concerns.
Selected Strategies to Achieve Goal 5 Include:
The Department will continue to assist states in developing longitudinal data systems capable of sharing key data elements across the education continuum from early learning to the workforce. Through these systems, for example, secondary schools can know how many of their students are enrolled in a postsecondary program, how many required remediation before actual courses for credit could be taken, and how many students continue in postsecondary education and obtain a postsecondary degree or credential.

PERFORMANCE PLAN SUMMARY
FY 2013 Annual Performance Report and FY 2015 Annual Performance Plan—U.S. Department of Education 53
Goal 6. U.S. Department of Education Capacity:
Improve the organizational capacities of the Department to implement this Strategic Plan.
Goal Leader: Jim Shelton
Objective/Sub-goal 6.1: Effective Workforce. Continue to build a skilled, diverse, and engaged workforce within the Department. Objective Leader: Pam Malam
Measure 6.1.A: Staffing gaps percentage
Measure 6.1.B: EVS engagement index
Measure 6.1.C: Time to hire
Measure 6.1.D: Effective Communication Index
Objective 6.2: Risk Management. Improve the Department’s program efficacy through comprehensive risk management, and grant and contract monitoring. Objective Leaders: Phil Maestri and Jim Ropelewski
Measure 6.2.A: Percentage of A-133 Single Audits Overdue for resolution
Measure 6.2.B: Compliance rate of contractor evaluation performance reports
Objective 6.3: Implementation and Support. Build Department capacity and systems to support states’ and other grantees’ implementation of reforms that result in improved outcomes, and keep the public informed of promising practices and new reform initiatives. Objective Leader: Alex Goniprow
Measure 6.3.A: Percentage of states who annually rate the Department’s technical assistance as helping build state capacity to implement education reforms
Objective 6.4: Productivity and Performance Management. Improve workforce productivity through information technology enhancements, telework expansion efforts, more effective process performance management systems, and state-of-the-art leadership and knowledge management practices. Objective Leaders: Danny Harris, Pam Malam, and Denise Carter
Measure 6.4.A: Number of ED IT security incidents
Measure 6.4.B: EVS Results-Based Performance Culture Index
Measure 6.4.C: EVS Leadership and Knowledge Management Index
Measure 6.4.D: Total usable square footage
Measure 6.4.E: Rent cost
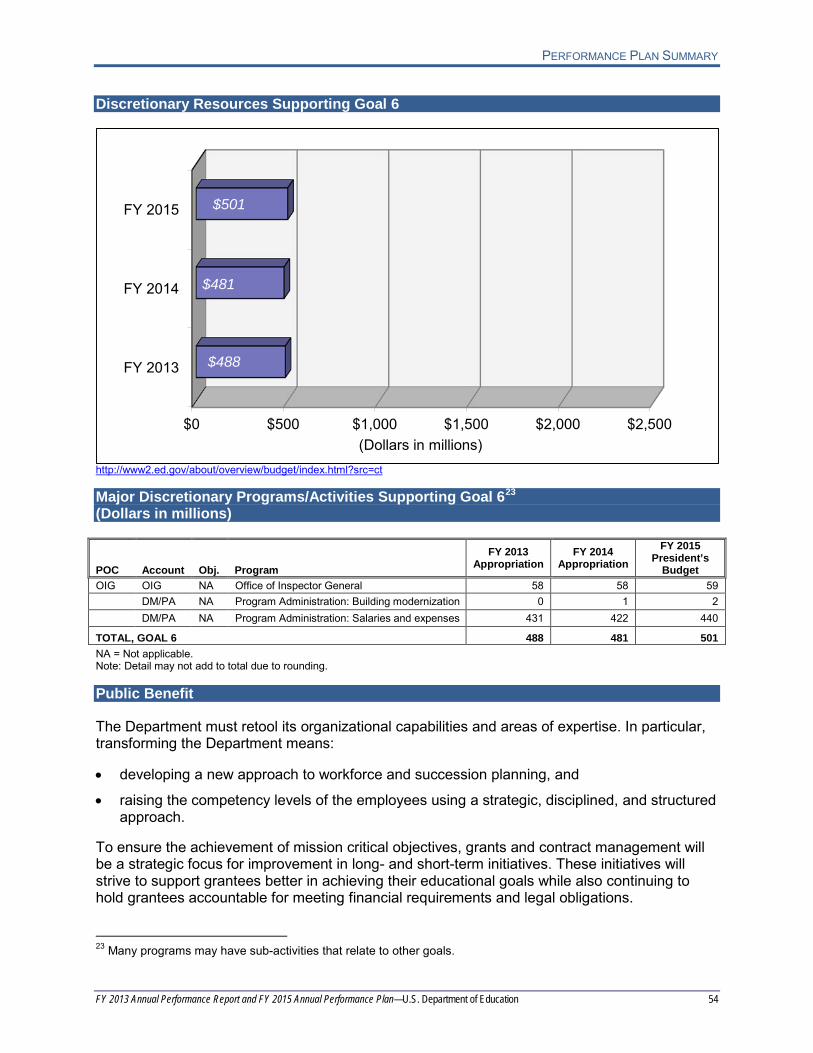
PERFORMANCE PLAN SUMMARY
FY 2013 Annual Performance Report and FY 2015 Annual Performance Plan—U.S. Department of Education 54
Discretionary Resources Supporting Goal 6
$0 $500 $1,000 $1,500 $2,000 $2,500
FY 2013
FY 2014
FY 2015
$488
$481
$501
(Dollars in millions)
http://www2.ed.gov/about/overview/budget/index.html?src=ct Major Discretionary Programs/Activities Supporting Goal 623 (Dollars in millions)
POC Account Obj. Program
FY 2013 Appropriation
FY 2014 Appropriation
FY 2015 President’s
Budget OIG OIG NA Office of Inspector General 58 58 59 DM/PA NA Program Administration: Building modernization 0 1 2 DM/PA NA Program Administration: Salaries and expenses 431 422 440
TOTAL, GOAL 6 488 481 501 NA = Not applicable. Note: Detail may not add to total due to rounding. Public Benefit
The Department must retool its organizational capabilities and areas of expertise. In particular, transforming the Department means:
•
•
developing a new approach to workforce and succession planning, and
raising the competency levels of the employees using a strategic, disciplined, and structured approach.
To ensure the achievement of mission critical objectives, grants and contract management will be a strategic focus for improvement in long- and short-term initiatives. These initiatives will strive to support grantees better in achieving their educational goals while also continuing to hold grantees accountable for meeting financial requirements and legal obligations.
23 Many programs may have sub-activities that relate to other goals.
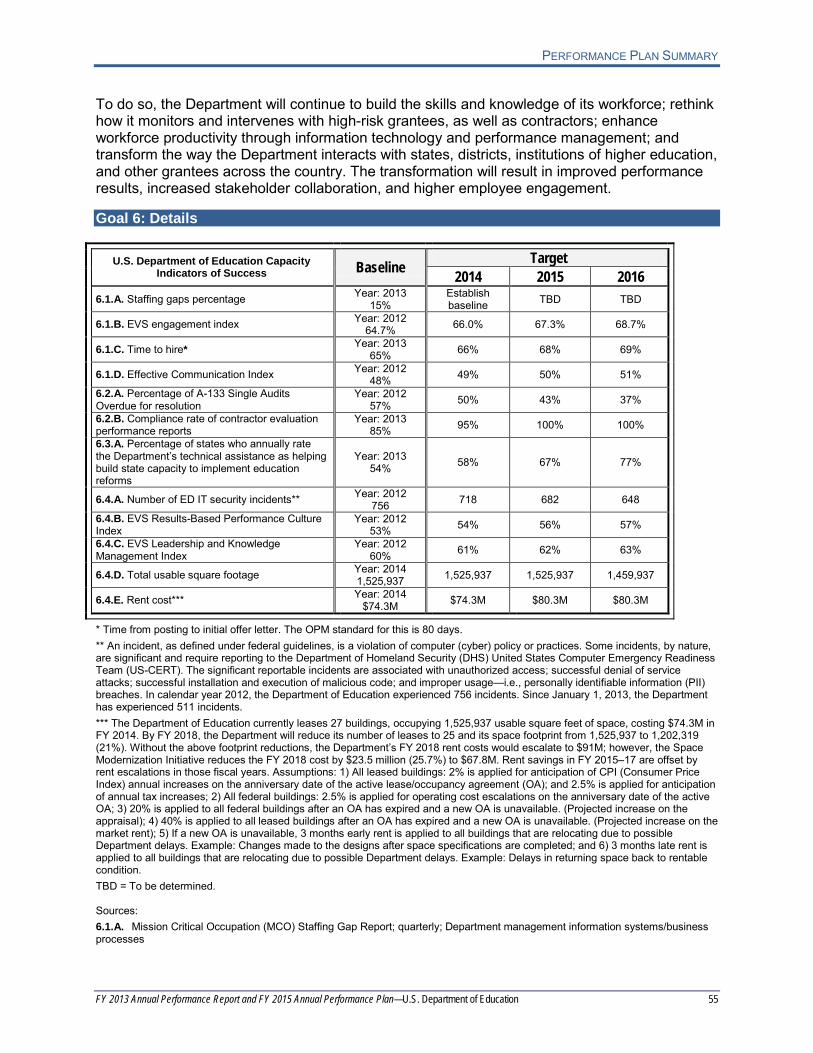
PERFORMANCE PLAN SUMMARY
FY 2013 Annual Performance Report and FY 2015 Annual Performance Plan—U.S. Department of Education 55
To do so, the Department will continue to build the skills and knowledge of its workforce; rethink how it monitors and intervenes with high-risk grantees, as well as contractors; enhance workforce productivity through information technology and performance management; and transform the way the Department interacts with states, districts, institutions of higher education, and other grantees across the country. The transformation will result in improved performance results, increased stakeholder collaboration, and higher employee engagement.
Goal 6: Details
U.S. Department of Education Capacity Indicators of Success Baseline Target
2014 2015 2016 6.1.A. Staffing gaps percentage Year: 2013
15% Establish baseline TBD TBD
6.1.B. EVS engagement index Year: 2012 64.7% 66.0% 67.3% 68.7%
6.1.C. Time to hire* Year: 2013 65% 66% 68% 69%
6.1.D. Effective Communication Index Year: 2012 48% 49% 50% 51%
6.2.A. Percentage of A-133 Single Audits Overdue for resolution
Year: 2012 57% 50% 43% 37%
6.2.B. Compliance rate of contractor evaluation performance reports
Year: 2013 85% 95% 100% 100%
6.3.A. Percentage of states who annually rate the Department’s technical assistance as helping build state capacity to implement education reforms
Year: 2013 54% 58% 67% 77%
6.4.A. Number of ED IT security incidents** Year: 2012 756 718 682 648
6.4.B. EVS Results-Based Performance Culture Index
Year: 2012 53% 54% 56% 57%
6.4.C. EVS Leadership and Knowledge Management Index
Year: 2012 60% 61% 62% 63%
6.4.D. Total usable square footage Year: 2014 1,525,937 1,525,937 1,525,937 1,459,937
6.4.E. Rent cost*** Year: 2014 $74.3M $74.3M $80.3M $80.3M
* Time from posting to initial offer letter. The OPM standard for this is 80 days. ** An incident, as defined under federal guidelines, is a violation of computer (cyber) policy or practices. Some incidents, by nature, are significant and require reporting to the Department of Homeland Security (DHS) United States Computer Emergency Readiness Team (US-CERT). The significant reportable incidents are associated with unauthorized access; successful denial of service attacks; successful installation and execution of malicious code; and improper usage—i.e., personally identifiable information (PII) breaches. In calendar year 2012, the Department of Education experienced 756 incidents. Since January 1, 2013, the Department has experienced 511 incidents. *** The Department of Education currently leases 27 buildings, occupying 1,525,937 usable square feet of space, costing $74.3M in FY 2014. By FY 2018, the Department will reduce its number of leases to 25 and its space footprint from 1,525,937 to 1,202,319 (21%). Without the above footprint reductions, the Department’s FY 2018 rent costs would escalate to $91M; however, the Space Modernization Initiative reduces the FY 2018 cost by $23.5 million (25.7%) to $67.8M. Rent savings in FY 2015–17 are offset by rent escalations in those fiscal years. Assumptions: 1) All leased buildings: 2% is applied for anticipation of CPI (Consumer Price Index) annual increases on the anniversary date of the active lease/occupancy agreement (OA); and 2.5% is applied for anticipation of annual tax increases; 2) All federal buildings: 2.5% is applied for operating cost escalations on the anniversary date of the active OA; 3) 20% is applied to all federal buildings after an OA has expired and a new OA is unavailable. (Projected increase on the appraisal); 4) 40% is applied to all leased buildings after an OA has expired and a new OA is unavailable. (Projected increase on the market rent); 5) If a new OA is unavailable, 3 months early rent is applied to all buildings that are relocating due to possible Department delays. Example: Changes made to the designs after space specifications are completed; and 6) 3 months late rent is applied to all buildings that are relocating due to possible Department delays. Example: Delays in returning space back to rentable condition. TBD = To be determined. Sources: 6.1.A. Mission Critical Occupation (MCO) Staffing Gap Report; quarterly; Department management information systems/business processes
PERFORMANCE PLAN SUMMARY
FY 2013 Annual Performance Report and FY 2015 Annual Performance Plan—U.S. Department of Education 56
6.1.B. Employee Viewpoint Survey (EVS); annually; Department management information systems/business processes 6.1.C. Workforce Transformation Tracking System (WTTS) and Entrance on Duty System (EOS); quarterly; Department management information systems/business processes 6.1.D. Employee Viewpoint Survey (EVS); annually; Department management information systems/business processes 6.2.A. OCFO’s Audit Accountability & Resolution Tracking System (AARTS); annually; Department management information systems/business processes 6.2.B. Past Performance Information Retrieval System (PPIRS) Compliance Metric Report; annually; Department management information systems/business processes 6.3.A. Baseline is from the Race to the Top State Lead Survey, n=19. Future data will come from the Annual Grantee Satisfaction Survey; annually; Department management information systems/business processes 6.4.A. Operational Vulnerability Management Solution (OVMS) system; quarterly; Department management information systems/business processes 6.4.B. Employee Viewpoint Survey (EVS); annually; Department management information systems/business processes 6.4.C. Employee Viewpoint Survey (EVS); annually; Department management information systems/business processes 6.4.D. Department’s Master Space Management Plan; annually; Department management information systems/business processes 6.4.E. Department’s Master Space Management Plan; annually; Department management information systems/business processes
Note on performance measures and targets: The measures reflect baselines and targets established for the FY 2014–18 Strategic Plan.
Explanation and Analysis of Progress: The agency’s strategic goals must support postsecondary education, career and technical education, adult education, elementary and secondary education, early learning, equity, and continuous improvement of the U.S. education system. To accomplish this, the Department’s workforce must be in the right position, at the right time, with the right skills, and at the right cost, led by skilled and engaging supervisors and managers. The Department is focusing on enhancing employee productivity and aligning performance management practices with Departmental strategic objectives by aligning priorities and goals at every level in the organization.
The Department has an important role to play in providing differentiated support and technical assistance to those pursuing this challenging work—even while continuing to improve the quality and reduce the burden of its fundamental stewardship function. To do so, the Department is moving from being an organization narrowly focused on one-size-fits-all compliance monitoring to an organization dedicated to progress and outcomes, and adept at both differentiating support to states and holding them accountable for meeting their programmatic, financial, and legal obligations.
Risk management plays a critical role in enhancing the capacity of grantees to implement needed reforms. It helps assess the ability of applicants to fulfill grant requirements, focus grant monitoring efforts, and identify performance challenges that can be addressed through measures such as enhanced technical assistance. Risk management is also an essential aspect of contract monitoring, achieved by actively assessing program and performance risk inherent in contracts through oversight and support, and issuance of policy and guidance to program and contract officials.
Selected Strategies to Achieve Goal 6 Include:
The Department must continue to prioritize and support the learning and development of its leaders to become more adept at assessing employee competency gaps and developmental needs, distinguishing performance versus conduct issues, and providing meaningful and ongoing feedback and coaching to achieve planned outcomes so that employees will better understand and fulfill their roles, and be accountable for producing the expected results.
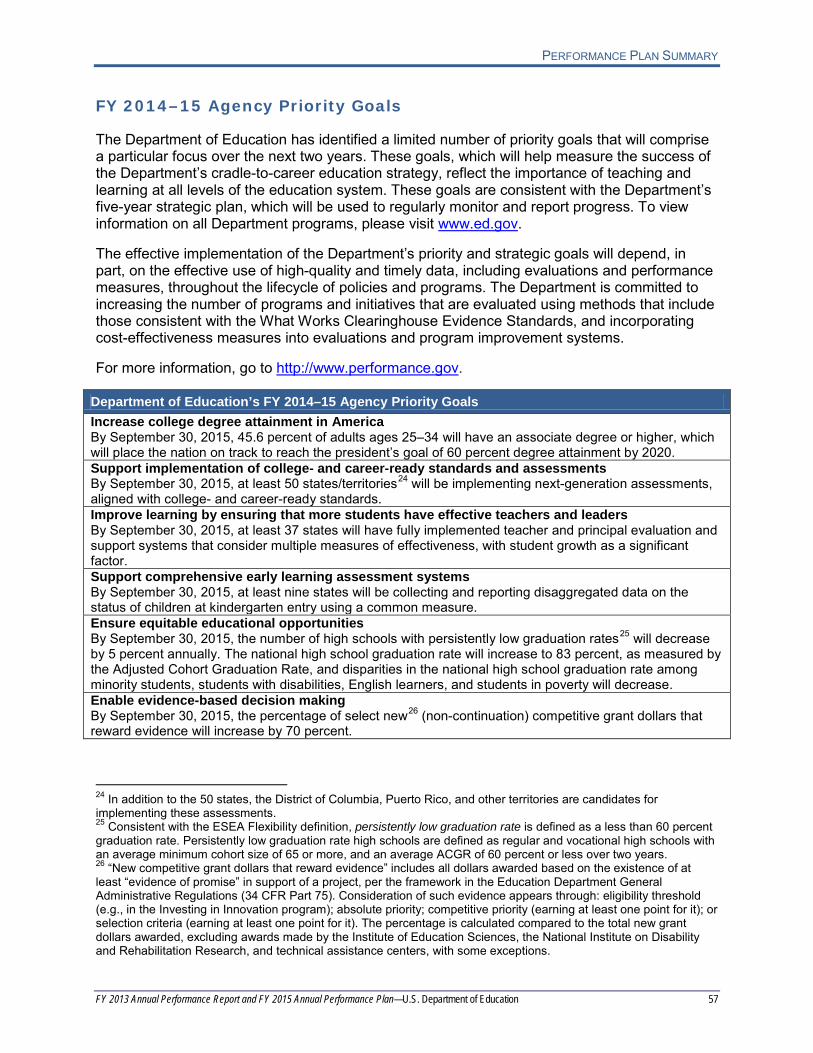
PERFORMANCE PLAN SUMMARY
FY 2013 Annual Performance Report and FY 2015 Annual Performance Plan—U.S. Department of Education 57
FY 2014–15 Agency Priority Goals
The Department of Education has identified a limited number of priority goals that will comprise a particular focus over the next two years. These goals, which will help measure the success of the Department’s cradle-to-career education strategy, reflect the importance of teaching and learning at all levels of the education system. These goals are consistent with the Department’s five-year strategic plan, which will be used to regularly monitor and report progress. To view information on all Department programs, please visit www.ed.gov.
The effective implementation of the Department’s priority and strategic goals will depend, in part, on the effective use of high-quality and timely data, including evaluations and performance measures, throughout the lifecycle of policies and programs. The Department is committed to increasing the number of programs and initiatives that are evaluated using methods that include those consistent with the What Works Clearinghouse Evidence Standards, and incorporating cost-effectiveness measures into evaluations and program improvement systems.
For more information, go to http://www.performance.gov.
Department of Education’s FY 2014–15 Agency Priority Goals Increase college degree attainment in America By September 30, 2015, 45.6 percent of adults ages 25–34 will have an associate degree or higher, which will place the nation on track to reach the president’s goal of 60 percent degree attainment by 2020. Support implementation of college- and career-ready standards and assessments By September 30, 2015, at least 50 states/territories24 will be implementing next-generation assessments, aligned with college- and career-ready standards. Improve learning by ensuring that more students have effective teachers and leaders By September 30, 2015, at least 37 states will have fully implemented teacher and principal evaluation and support systems that consider multiple measures of effectiveness, with student growth as a significant factor. Support comprehensive early learning assessment systems By September 30, 2015, at least nine states will be collecting and reporting disaggregated data on the status of children at kindergarten entry using a common measure. Ensure equitable educational opportunities By September 30, 2015, the number of high schools with persistently low graduation rates25 will decrease by 5 percent annually. The national high school graduation rate will increase to 83 percent, as measured by the Adjusted Cohort Graduation Rate, and disparities in the national high school graduation rate among minority students, students with disabilities, English learners, and students in poverty will decrease. Enable evidence-based decision making By September 30, 2015, the percentage of select new26 (non-continuation) competitive grant dollars that reward evidence will increase by 70 percent.
24 In addition to the 50 states, the District of Columbia, Puerto Rico, and other territories are candidates for implementing these assessments. 25 Consistent with the ESEA Flexibility definition, persistently low graduation rate is defined as a less than 60 percent graduation rate. Persistently low graduation rate high schools are defined as regular and vocational high schools with an average minimum cohort size of 65 or more, and an average ACGR of 60 percent or less over two years. 26 “New competitive grant dollars that reward evidence” includes all dollars awarded based on the existence of at least “evidence of promise” in support of a project, per the framework in the Education Department General Administrative Regulations (34 CFR Part 75). Consideration of such evidence appears through: eligibility threshold (e.g., in the Investing in Innovation program); absolute priority; competitive priority (earning at least one point for it); or selection criteria (earning at least one point for it). The percentage is calculated compared to the total new grant dollars awarded, excluding awards made by the Institute of Education Sciences, the National Institute on Disability and Rehabilitation Research, and technical assistance centers, with some exceptions.
PERFORMANCE PLAN SUMMARY
FY 2013 Annual Performance Report and FY 2015 Annual Performance Plan—U.S. Department of Education 58
Cross-Agency Priority Goals and Collaborations
In accordance with the GPRA Modernization Act of 2010, interim Cross-Agency Priority Goals (CAP Goals) were published concurrent with the FY 2013 President’s budget on Performance.gov in February 2012 and will be active until February 2014 when they will be revised with the FY 2015 budget. Performance.gov is updated on a quarterly basis for each CAP Goal. The website will include the information required by law, such as goal leader(s), contributing agencies, organizations, programs, targets, key milestones, major management challenges, and plans to address these challenges. Quarterly Performance Updates (QPUs) for the website on progress will be provided by the goal leader in coordination with the PIC, OMB, corresponding government-wide management (CXO) council and contributing agencies. (A-11, part 6, 220.5)
Each Cross-Agency Priority Goal has a goal leader(s) and deputy goal leader(s) who will manage the processes by which goals are executed. Goal leaders are given flexibility in how to manage CAP Goals and are encouraged to leverage existing structures as much as practicable, (e.g., existing working groups, interagency policy committees, councils). Every CAP Goal will have a governance team chaired by the goal leader and deputy goal leader and consisting of representatives from agencies contributing to the goal, OMB, and others as determined by the goal leader.
Each governance team will develop an action plan explaining how the Federal Government will execute on the goal, including agencies’ contributions, areas where cross-agency coordination is needed, and anticipated risks or obstacles. The action plan will be updated as experience is gained and new information is learned. (A-11 Part 6, 220.9)
Management Priorities and Challenges
The Department is delivering greater impact through innovation, increasing effectiveness and efficiency, and better customer service. Management priorities and progress to address challenges are noted throughout this report, along with performance goals, indicators and/or milestones, and other measurements of progress. Data-driven reviews and analysis is used to identify areas of success and challenge.
In summary, as reported in the closeout of the FY 2011–14 Strategic Plan, the Department results are mixed—presenting both accomplishments and challenges moving forward. The Department has shown progress toward established goals in such important areas as increasing state commitments to high-quality outcome metrics for preschools and better use of data to evaluate teachers and colleges and to help students identify their own strengths and remediate areas where they face challenges. The nation continues to face serious challenges in promoting high standards while at the same time increasing the number of students who successfully complete their formal education and find employment.
Accomplishments and Notable Progress
Education is key to the nation’s long-term economic prosperity and is an investment in its future. A highly educated workforce is necessary for American competitiveness in the global economy. As such, the Department continues to maintain strong support for traditional state formula grant programs while continuing to fund competitive initiatives, such as the Race to the Top (RTT), Promise Neighborhoods, Investing in Innovation (i3) grants, and a redesigned School Improvement Grants program. Almost every state is supporting higher standards that ensure students will be college- and career-ready.
PERFORMANCE PLAN SUMMARY
FY 2013 Annual Performance Report and FY 2015 Annual Performance Plan—U.S. Department of Education 59
The United States is seeing the highest high school graduation rate in three decades, and over the past four years, postsecondary financial assistance available to students and families has increased significantly. Moreover, the Department has seen an increase of more than 50 percent in the number of students accessing higher education on Pell Grants. To help students and their families make decisions about college, the Department developed a number of resources, such as College Navigator, the College Affordability and Transparency Center, and the Net Price Calculator (See appendix E).
The Department has identified several priorities to reflect the focus on a cradle-to-career education strategy and to concentrate efforts on the importance of teaching and learning at all levels of the education system. In FY 2013, the Department made significant progress in leveraging its programs to support state- and district-led efforts to ensure that more students have effective teachers by better training, recruiting, identifying, and retaining effective teachers, especially in areas with high needs. Through RTT, the SIG program, Elementary and Secondary Education Act (ESEA) Flexibility, and other federal programs, the Department is providing significant resources to improve the nation’s lowest-achieving schools dramatically by using intensive turnaround models.
On April 16, 2013, the Department and Health and Human Services (HHS) announced an investment of the majority of the 2013 Race to the Top funds ($370 million) for both a new competition and to provide supplemental awards for six state grantees—California, Colorado, Illinois, New Mexico, Oregon, and Wisconsin—who had only received 50 percent of their initial request. The Department is working to increase the number of states approved for ESEA Flexibility, those that have adopted college- and career-ready standards, by working with states that submitted ESEA Flexibility requests to meet the high bar for approval and developing and targeting technical assistance activities to leverage states’ limited resources and continue to identify promising practices across multiple states. Further, the Department is facilitating the development of interoperable state data systems from early learning through the workforce and will provide support to the education community, including teachers and administrators, on how to understand and appropriately use data to inform policies, instructional practices, and leadership decisions. The Department has increased coordination with Department of Labor and the Workforce Data Quality Initiative grants program, including joint sessions at an annual grantee conference.
Challenges and Risk Mitigation
The challenges to achieving the goals set forth in the new Strategic Plan lie in the Department’s funding and capacity. Facing fiscal uncertainty, the Department has achieved savings in salaries and expenses and by reducing lease costs, utilities, travel, printing, supplies, and some contract costs. The Department continues to meet and address financial challenges with efficiency and responsibility and in compliance with the Balanced Budget and Emergency Deficit Control Act. Employing a comprehensive risk management and grant and contract monitoring, the Department ensures prudent use of public dollars and mitigates risk through oversight and support of grantees and contractors.
Supporting a skilled, diverse, and engaged workforce in a climate that is resource constrained continues to be a challenge. Through careful management of funds, the Department was able to avert furloughing employees in FY 2013 so that its customers and stakeholders continued to receive the best possible service. The Department is judiciously investing in continuous improvement, productivity, and communication.
PERFORMANCE PLAN SUMMARY
FY 2013 Annual Performance Report and FY 2015 Annual Performance Plan—U.S. Department of Education 60
Accomplishing all of the priorities outlined in the FY 2014–18 Strategic Plan will require strong coordination and collaboration from Department staff working with Congress, partners at the state and local levels, and stakeholders in the education community. This includes meeting numerous legislative challenges. In addition, state and federal fiscal constraints may impact the Department’s ability to provide the necessary incentives and resources to increase quality, transparency, and accountability—and most of important of all—student achievement.
Office of Inspector General’s (OIG) Management Challenges
OIG works to promote efficiency, effectiveness, and integrity in the programs and operations of the U.S. Department of Education. Through audits, inspections, investigations, and other reviews, OIG continues to identify areas of concern within the Department’s programs and operations and recommend actions the Department should take to address these weaknesses. The Reports Consolidation Act of 2000 requires the OIG to identify and report annually on the most serious management challenges the Department faces. The Government Performance and Results Modernization Act of 2010 requires the Department to include in its agency performance plan information on its planned actions, including performance goals, indicators, and milestones, to address these challenges.
Last year OIG presented four management challenges: improper payments, information technology security, oversight and monitoring, and data quality and reporting. Although OIG noted some progress by the Department in addressing these areas, each remains as a management challenge for FY 2014 and a new challenge was added related to the Department’s information technology system development and implementation.
The FY 2014 management challenges are:
(1) Improper Payments, (2) Information Technology Security, (3) Oversight and Monitoring, (4) Data Quality and Reporting, and (5) Information Technology System Development and Implementation.
These challenges reflect continuing vulnerabilities and emerging issues faced by the Department as identified though OIG’s recent audit, inspection, and investigative work.
The full report is published by the OIG. To view the full report, go to: http://www2.ed.gov/about/offices/list/oig/managementchallenges.html.
OIG noted some progress by the Department in addressing the FY 2013 management challenges. The Department remains committed to improved governance and better business processes. Management has worked closely with OIG to gain its perspective about the Department’s most significant management and performance challenges.
Lower-Priority Program Activities
The Cuts, Consolidations and Savings volume of the President’s Budget identifies the lower-priority program activities, where applicable, as required under the GPRA Modernization Act, 31 U.S.C. 1115(b)(10). The public can access the volume at http://www.whitehouse.gov/omb/budget.