annual performance plan for fiscal year 2010 and revised ... · annual performance plan for fy 2010...
TRANSCRIPT


Annual Performance Plan for FY 2010 and Revised Final Annual Performance Plan for FY 2009
an
nu
al
pe
rf
or
ma
nc
e p
la
n

Annual Performance Plan for FY 2010 and Revised Final Annual Performance Plan for FY 2009i
Commissioner’s Message
co
mm
iss
ion
er
’s m
es
sa
ge
Co m m i s s i o n e r’s me s sag e
I am pleased to present the Social Security Administration’s Fiscal Year (FY) 2010 Annual Performance Plan and Revised Final Performance Plan for FY 2009, the first under our new FY 2008 — FY 2013 Agency Strategic Plan released in September 2008. Our Annual Performance Plan demonstrates our commitment to openness in government, as well as fostering public trust through transparency, public participation, and collaboration. This Plan sets forth our performance commitments and concentrates on our four strategic goals: 1) eliminate our hearings backlog and prevent its recurrence; 2) improve the speed and quality of our disability process; 3) improve our retiree and other core services; and 4) preserve the public’s trust in our programs.
Stemming from our country’s current economic challenges, individuals are seeking our services and applying for Social Security benefits more than ever. I am grateful for Congress providing ongoing support of our programs that allows us to better serve the American public. In addition to granting us a seven percent budget increase in FY 2009, the recently-enacted American Recovery and Reinvestment Act included $500 million to process our rapidly growing disability and retirement workloads, and $500 million to replace our National Computer Center that is nearing the end of its functional life. These additional funds will truly make a difference in people’s lives.
Our Annual Performance Plan charts the course for transforming the way we do business by integrating new tech-nologies into our processes and enhancing our current services to provide a better experience for the public to conduct their business with us online, on the phone, and in our offices. We have also undertaken many initiatives to accomplish our strategic goals, for example:
To address the hearings backlog, we will follow our •
•
•
•
Hearings Backlog Reduction Plan and continue to improve our hearing office procedures to increase our ability to hear and decide cases and accelerate processing of hearings;
To enhance our disability process, we will fast-track disability claims highly likely or certain to meet our disability requirements, and make it easier for disabled individuals who are entitled to benefits to return to work under our work incentive programs such as our Ticket to Work program;
To improve our retirement process, we will develop innovative ways to handle the influx of baby-boomer retirements. In addition, we will address our other core services such as strengthening the Social Security Number and earnings processes; and
To preserve trust in our programs, we will safeguard our programs from waste, fraud, and abuse by minimizing improper payments, protecting personally identifiable information, and increasing the use of “green” solutions in our daily operations.
We must work more efficiently to close the gap between limited resources and increasing workloads so that we may continue serving more than 165 million workers and 60 million individuals receiving benefits. This Annual Performance Plan addresses the challenges we face and lays out the initial approach to implementing our multi-year Agency Strategic Plan. We must be proactive and aggressive in achieving our mission to deliver Social Security services that meet the changing needs of the public.

iiOur Values
ou
r V
al
ue
s
Annual Performance Plan for FY 2010 and Revised Final Annual Performance Plan for FY 2009
ou r Va lu e s
Our Mission
Deliver Socia l Security ser vices that meet the changing needs of the publ ic
Our Vision
Provide the highest st andard of considerate and thoughtful ser vice for generat ions to come
Our Motto
Social Security Benef i t s America
Our Service Principles
We ser ve with empathy, creat iv i ty, integri ty, and “an unbeatable determination to do the job at
hand”by fol lowing these ser vice principles :
Adherence to the law•Clarity•
Commitment to best demonstrated practices•Cultural sensitivity•
Honesty•Prevention of waste, fraud, and abuse•
Protection of privacy and personal information•Recruitment and training of the best public servants•
Safety of the public and our employees•
Annual Performance Plan for FY 2010 and Revised Final Annual Performance Plan for FY 2009iii
Summary of Our Goals and Objectives
su
mm
ar
y o
f o
ur
go
al
s a
nd
ob
jec
tiV
es
su m m a ry o f ou r goa l s a n d ob j e C t i V e s
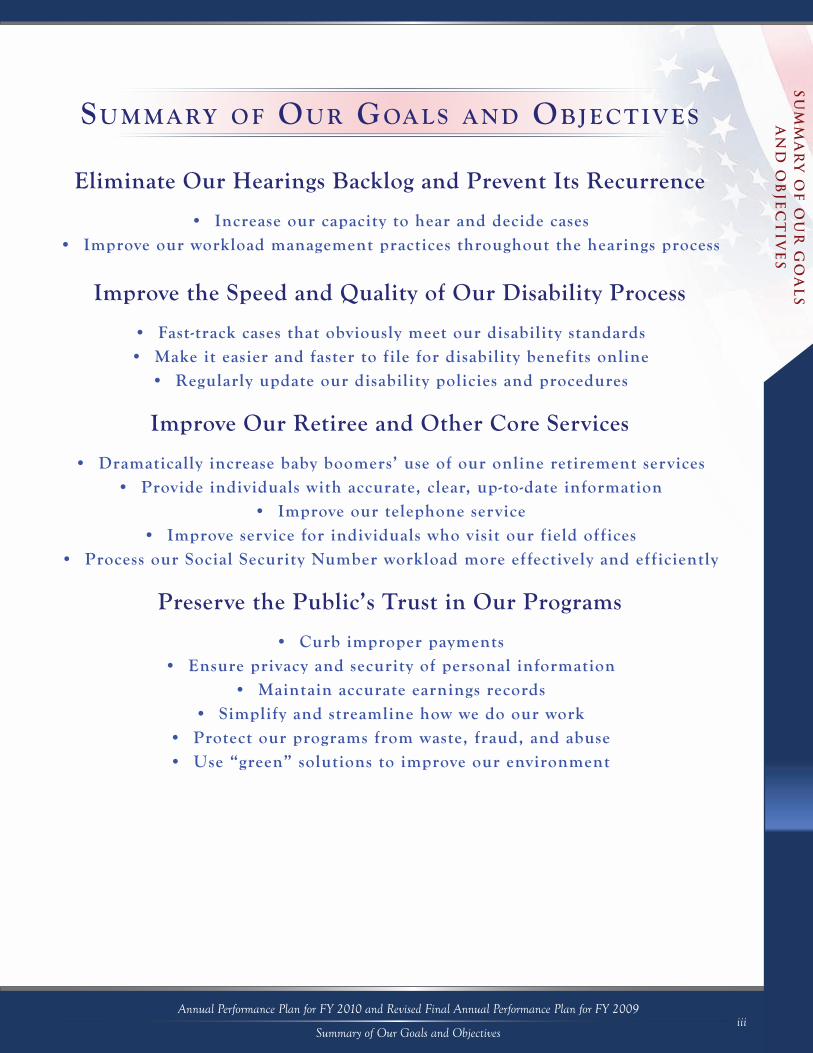
Eliminate Our Hearings Backlog and Prevent Its Recurrence
Increase our capacity to hear and decide cases•Improve our workload management practices throughout the hearings process•
Improve the Speed and Quality of Our Disability Process
Fast-track cases that obviously meet our disability standards•Make it easier and faster to file for disability benefits online•
Regularly update our disability policies and procedures•
Improve Our Retiree and Other Core Services
Dramatically increase baby boomers’ use of our online retirement services•Provide individuals with accurate, clear, up-to-date information•
Improve our telephone service•Improve service for individuals who visit our field offices•
Process our Social Security Number workload more effectively and efficiently•
Preserve the Public’s Trust in Our Programs
Curb improper payments•Ensure privacy and security of personal information•
Maintain accurate earnings records•Simplify and streamline how we do our work•
Protect our programs from waste, fraud, and abuse•Use “green” solutions to improve our environment•

ivSocial Security Benefits America
Annual Performance Plan for FY 2010 and Revised Final Annual Performance Plan for FY 2009
So
cia
l S
ec
ur
ity
Be
ne
fit
S a
me
ric
a

Annual Performance Plan for FY 2010 and Revised Final Annual Performance Plan for FY 20091
Table of Contents
ta
bl
e o
f c
on
te
nt
s
an n ua l Pe r f o r m a n C e Pl a n f o r 2010
a n d re V i s e d fi n a l an n ua l
Pe r f o r m a n C e Pl a n f o r fy 2009
ta b l e o f Co n t e n t s
Summary of Government Performance and Results Act Performance Measures ....................................................2
Summary of Program Assessment Rating Tool Measures .......................................................................................6
Strategic Goal 1 ....................................................................................................................................................7
Strategic Goal 2: ................................................................................................................................................13
Strategic Goal 3: .................................................................................................................................................19
Strategic Goal 4: ................................................................................................................................................28
Appendix A: Fiscal Year 2009 Major Evaluation ..................................................................................................39
Appendix B: Federal Information Security Management Act ............................................................................... 41
Appendix C: Performance Measure Changes From Fiscal Year 2008 ....................................................................42
Appendix D: Summary of Program Assessment Rating Tool (PART) — Only Measures .......................................45

2Summary of Government Performance and Results Act Performance Measures – Strategic Goal 1
Annual Performance Plan for FY 2010 and Revised Final Annual Performance Plan for FY 2009
su
mm
ar
y —
st
ra
te
gic
go
al
1
su m m a ry o f goV e r n m e n t Pe r f o r m a n C e a n d re s u lt s aC t Pe r f o r m a n C e me a s u r e s
We continually seek to improve our business processes, policies, and procedures to uphold the principles of good government, accountability, and integrity. These principles form the basis of the Government Performance and Results Act (GPRA) of 1993, which seeks to improve Government performance and
ensure accountability by linking budget to performance and connecting resources to results. As such, targets for several measures are tied directly to our budget and are set by the amount of money dedicated to this workload. These measures include “budgeted number” in the title.
The following chart lists our performance measures and targets for Fiscal Year (FY) 2009 and FY 2010. We use these performance measures to gauge our progress in meeting our strategic goals and objectives as outlined in our Agency Strategic Plan (http://www.socialsecurity.gov/asp/index.htm). These measures specifically address how we will improve performance, accountability, effectiveness, and efficiency over the next 2 fiscal years.
STRATEGIC GOAl 1: ElIMINATE OUR HEARINGS BACKlOG AND PREVENT ITS RECURRENCE
Strategic Objective 1.1: Increase our capacity to hear and decide cases
Performance Measure FY 2009 Target FY 2010 Target Page
1.1a Process the budgeted number of hearings 647,000 726,000 9
Strategic Objective 1.2: Improve our workload management practices throughout the hearing process
Performance Measures FY 2009 Target FY 2010 Target Page
1.2aAchieve the target for number of hearings pending
755,000 727,000 11
1.2bAchieve the target to eliminate the oldest hearings pending
Less than 1% of hearings pending 850 days or older
Less than 0.5% of hearings pending 825 days or older
11
1.2cAchieve the budgeted goal for average processing time in days for hearings*
516 days 508 days 12
1.2dAchieve the target to eliminate the oldest Appeals Council cases pending
Less than 1% of Appeals Council cases pending 750 days or older
Less than 1% of Appeals Council cases pending 700 days or older
12
1.2eAchieve the target for average processing time of Appeals Council decisions
265 days 370 days 12
*This is also a Program Assessment Rating Tool measure (see page 6)
Annual Performance Plan for FY 2010 and Revised Final Annual Performance Plan for FY 20093
Summary of Government Performance and Results Act Performance Measures – Strategic Goal 2
su
mm
ar
y —
st
ra
te
gic
go
al
2
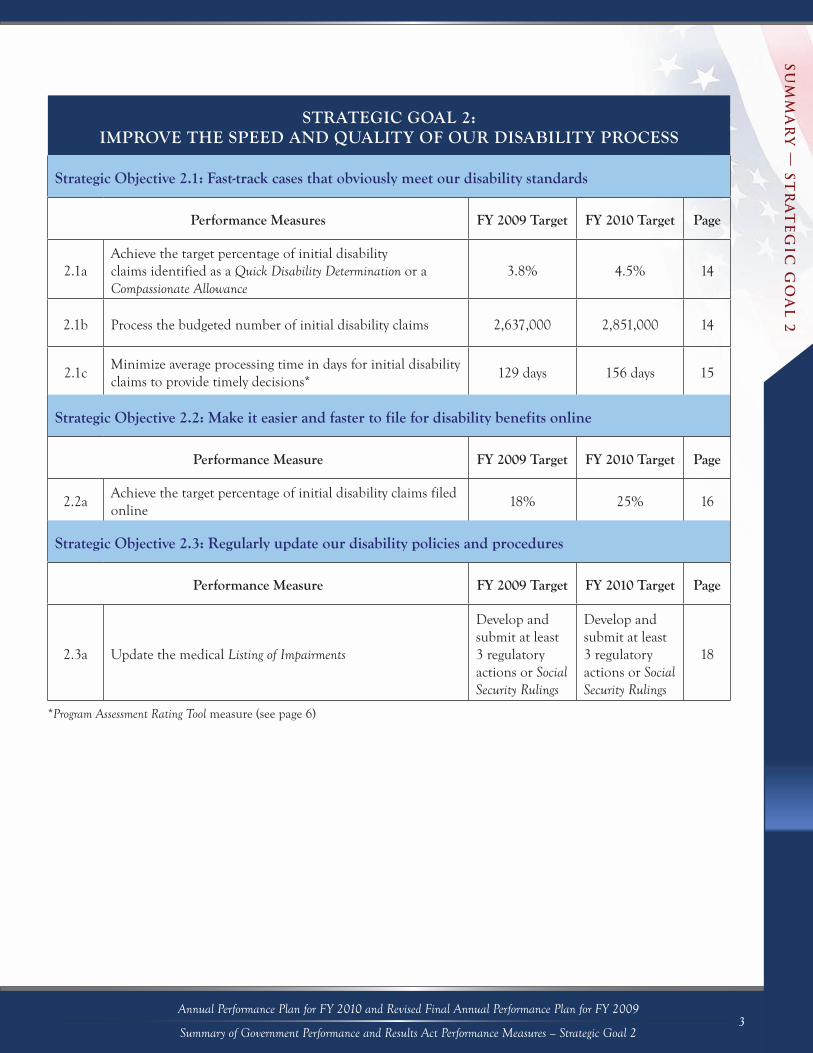
STRATEGIC GOAl 2: IMPROVE THE SPEED AND QUAlITY OF OUR DISABIlITY PROCESS
Strategic Objective 2.1: Fast-track cases that obviously meet our disability standards
Performance Measures FY 2009 Target FY 2010 Target Page
2.1aAchieve the target percentage of initial disability claims identified as a Quick Disability Determination or a Compassionate Allowance
3.8% 4.5% 14
2.1b Process the budgeted number of initial disability claims 2,637,000 2,851,000 14
2.1cMinimize average processing time in days for initial disability claims to provide timely decisions*
129 days 156 days 15
Strategic Objective 2.2: Make it easier and faster to file for disability benefits online
Performance Measure FY 2009 Target FY 2010 Target Page
2.2aAchieve the target percentage of initial disability claims filed online
18% 25% 16
Strategic Objective 2.3: Regularly update our disability policies and procedures
Performance Measure FY 2009 Target FY 2010 Target Page
2.3a Update the medical Listing of Impairments
Develop and submit at least 3 regulatory actions or Social Security Rulings
Develop and submit at least 3 regulatory actions or Social Security Rulings
18
*Program Assessment Rating Tool measure (see page 6)

4Summary of Government Performance and Results Act Performance Measures – STRATEGIC GOAL 3
Annual Performance Plan for FY 2010 and Revised Final Annual Performance Plan for FY 2009
su
mm
ar
y —
st
ra
te
gic
go
al
3
STRATEGIC GOAl 3: IMPROVE OUR RETIREE AND OTHER CORE SERVICES
Strategic Objective 3.1: Dramatically increase baby boomers’ use of our online retirement services
Performance Measures FY 2009 TargetFY 2010 Target
Page
3.1aPercent of Retirement and Survivors claims receipts processed up to the budgeted level*
100% (4,543,000)
100% (4,565,000)
21
3.1bAchieve the target percentage of retirement claims filed online
26% 38% 21
Strategic Objective 3.3: Improve our telephone service
Performance Measures FY 2009 TargetFY 2010 Target
Page
3.3aAchieve the target speed in answering National 800 Number calls
330 seconds 300 seconds 23
3.3b Achieve the target busy rate for National 800 Number calls 10% 9% 23
Strategic Objective 3.4: Improve service for individuals who visit our field offices
Performance Measure FY 2009 TargetFY 2010 Target
Page
3.4aPercent of individuals who do business with SSA rating the overall services as “excellent,” “very good,” or “good”*
83% 83% 25
Strategic Objective 3.5: Process our Social Security Number workload more effectively and efficiently
Performance Measure FY 2009 TargetFY 2010 Target
Page
3.5aAchieve the target percentage for assigning original Social Security Numbers correctly
95% 95% 27
*Program Assessment Rating Tool measure (see page 6)

Annual Performance Plan for FY 2010 and Revised Final Annual Performance Plan for FY 20095
Summary of Government Performance and Results Act Performance Measures – STRATEGIC GOAL 4
su
mm
ar
y —
st
ra
te
gic
go
al
4
STRATEGIC GOAl 4: PRESERVE THE PUBlIC’S TRUST IN OUR PROGRAMS
Strategic Objective 4.1: Curb improper payments
Performance Measures FY 2009 Target FY 2010 Target Page
4.1aProcess the budgeted number of Supplemental Security Income non-disability redeterminations
1,711,000 2,322,000 30
4.1bProcess the budgeted number of continuing disability reviews
1,079,000 794,000 30
4.1cPercent of Supplemental Security Income payments free of overpayment (O/P) and underpayment (U/P) errors*
96% (O/P) 96% (O/P)31
98.8% (U/P) 98.8% (U/P)
4.1dPercentage of Old-Age, Survivors, and Disability Insurance payments free of overpayment (O/P) and underpayment (U/P) error*
99.8% (O/P) 99.8% (O/P)32
99.8% (U/P) 99.8% (U/P)
Strategic Objective 4.3: Maintain accurate earnings record
Performance Measure FY 2009 Target FY 2010 Target Page
4.3aAchieve the target percentage of paper Forms W-2 received
17% 17% 35
Strategic Objective 4.5: Protect our programs from waste, fraud, and abuse
Performance Measure FY 2009 Target FY 2010 Target Page
4.5aReceive an unqualified audit opinion on SSA’s financial statements
Receive an unqualified opinion
Receive an unqualified opinion
37
Strategic Objective 4.6: Use “green” solutions to improve our environment
Performance Measures FY 2009 Target FY 2010 Target Page
4.6aReplace gasoline-powered vehicles with alternative-fuel vehicles
20 50 38
4.6bDevelop and implement an agency Environmental Management System
Develop a high-level project plan
Provide training needed for implementation
38
*Program Assessment Rating Tool measure (see page 6)

6Annual Performance Plan for FY 2010 and Revised Final Annual Performance Plan for FY 2009
Summary of Program Assessment Rating Tool Measures
su
mm
ar
y o
f p
ro
gr
am
a
ss
es
sm
en
t r
at
ing
to
ol
me
as
ur
es
su m m a ry o f Pro g r a m as s e s s m e n t rat i n g to o l me a s u r e s
We use a variety of methods to measure program performance. In addition to the Government Performance and Results Act (GPRA) performance measures listed earlier, we use the Program Assessment Rating Tool (PART). PART is a diagnostic tool that the Office of Management and Budget (OMB) developed to
assess and improve program performance so that the Federal Government can achieve better results. A PART review helps identify a program’s strengths and weaknesses to inform funding and management decisions aimed at making the program more effective. OMB has selected three of our programs for review under the PART process — Old-Age and Survivors Insurance, Disability Insurance, and Supplemental Security Income. Most of the PART measures are also GPRA performance measures.
PART/GPRA Performance MeasuresPerformance Measures FY 2009 Target FY 2010 Target
Achieve the budgeted goal for average processing time in days for hearings 516 days 508 days
Minimize average processing time in days for initial disability claims to provide timely decisions
129 days 156 days
Percent of Retirement and Survivors claims receipts processed up to the budgeted level100%
(4,543,000)100%
(4,565,000)Percent of individuals who do business with SSA rating the overall services as “excellent,” “very good,” or “good”
83% 83%
Percent of Supplemental Security Income payments free of overpayment error 96% 96%
Percent of Supplemental Security Income payments free of underpayment error 98.8% 98.8%
Percentage of Old-Age, Survivors, and Disability Insurance payments free of overpayment error
99.8% 99.8%
Percentage of Old-Age, Survivors, and Disability Insurance payments free of underpayment error
99.8% 99.8%
PART-only Performance Measures (see Appendix D)Achieve target percentage of hearing level cases pending over 365 days 50% 40%
Achieve the budgeted goal for SSA hearings case production per workyear 107 109
Disability Determination Services net accuracy rate for combined initial disability allowances and denials
97% 97%
Disability Determination Services cases processed per workyear 265 268
Number of Disability Insurance and Supplemental Security Income beneficiaries, with Tickets in use, who work
TBD (July 2009)
TBD (July 2009)
Percent of Supplemental Security Income aged claims processed by the time the first payment is due or within 14 days of the effective filing date
80% 80%
Issue an annual SSA-initiated Social Security Statement to eligible individuals age 25 and older
100% 100%
Average Agency productivity 2% TBD
Cumulative productivity improvement for Retirement and Survivors Insurance claims (compared to FY 2005)
7% 7%
Through changes in the law, achieve and maintain sustainable solvency such that today’s and tomorrow’s workers can expect to receive the benefits scheduled in law as reformed rather than as determined by Trust Fund solvency, while continuing to protect those who depend on Social Security the most
Conduct Analysis
Conduct Analysis

Annual Performance Plan for FY 2010 and Revised Final Annual Performance Plan for FY 20097
st
ra
te
gic
go
al
1
Strategic Goal 1
st r at e g i C goa l 1Eliminate Our Hearings Backlog And Prevent Its Recurrence
long-Term Outcomes
Reduce the number of pending hearings to 466,000 by FY 2013;
Reduce the time it takes an individual to receive a hearing decision to an average of 270 days;
Increase productivity by automating labor-intensive tasks necessary to issue a hearing decision; and
Establish standardized electronic hearing business processes.
•
•
•
•
For more than half a century, we have helped disabled workers and their families cope with the loss of income caused by severe disability. However, in recent years, we have experienced an unprecedented backlog of cases at the hearing level. This backlog has significantly affected our ability to provide the level of service that the
public deserves. For some, the long wait has led to homelessness and the loss of family and friends. Tragically, individuals have died while waiting for a hearing. We have a moral imperative to fix this problem — the American people deserve better from their Government. To address these issues, we have improved our processes, added new staff, utilized new technologies, and introduced several initiatives.
We continue to concentrate on processing our oldest pending hearing cases. In fiscal year (FY) 2008, we processed almost all of our aged hearing cases, at which time were defined as those cases pending 900 days or more. In FY 2009, we redefine aged cases to those cases pending 850 days or more, and in FY 2010, to those cases pending 825 days or more. In FY 2010, we will be focusing on the largest group of aged cases since we initiated this effort. We will continue to lower the aged-case threshold incrementally as we work towards our hearings processing time goal of 270 days. We will also reduce the time for an individual to receive a hearing decision, increase productivity through automation of labor-intensive tasks, and establish a standardized electronic hearings business process. We expect to reduce the number of pending hearings to 466,000 by FY 2013 — our optimal pending level necessary to ensure a sufficient “pipeline” of cases to maximize the efficiency of our hearings process. Prior to FY 2008, our optimal pending level was 400,000 hearings, but due to the increase in our ALJ cadre, we raised it in FY 2008.
Despite our progress, we still face considerable challenges in processing the large backlog of requests for hearings. We anticipate receiving approximately 50,000 more hearing requests in FY 2009 than FY 2008, and we have prepared for this surge in hearing requests. However, the short- and long-term state of the economy and the significant growth in hearings receipts anticipated in FYs 2009 and 2010 will pose more challenges and undoubtedly influence our decisions about future initiatives.

8
st
ra
te
gic
go
al
1
Annual Performance Plan for FY 2010 and Revised Final Annual Performance Plan for FY 2009
Strategic Goal 1
Strategic Objective 1.1: Increase our capacity to hear and decide cases
We have developed and begun implementing the Plan to Eliminate the Hearing Backlog and Prevent its Recurrence. Our plan includes improving hearing office procedures, increasing our ability to hear and decide cases, increasing efficiency through automation and improving business processes, and
accelerating review of cases that are likely to result in a favorable decision. Although we do not anticipate eliminating this backlog until 2013, we have already made considerable progress. To accomplish our goals, we will adopt and expand several initiatives.
Increase the number of administrative law judges (AlJs) and support staff at the hearings level. • We will build a cadre of at least 1,400 to 1,450 ALJs by FY 2010 and request each ALJ to issue 500 to 700 hearing decisions each year. We will hire additional support staff, better balance workloads between hearing offices, and add 13 new hearing offices in locations where we are unable to handle the pending caseloads effectively and efficiently. We will also add centralized centers for case pulling and decision writing in regional office sites to support more quickly and flexibly our growing workloads.
Screen hearing requests quickly to identify any possible allowances. • We will continue to refine computer models to screen and triage hearing requests to identify cases where we can issue a fully-favorable decision without a hearing. In addition, to augment our decision-making capacity, we will continue to use Attorney Adjudicators and disability specialists to screen pending hearing requests to determine if they can issue fully-favorable decisions based on the evidence already in our files. This process conserves ALJ resources for the more complex cases requiring a hearing.
Increase the use of video hearings. • We will increase the use of video hearing technology across the Nation. Video hearing technology will minimize travel to hearing sites for individuals, their representatives, expert witnesses, and ALJs. In remote areas, this secure technology enables individuals to attend a video hearing rather than travel long distances to a hearing site. Additionally, video hearings allow ALJs to be more productive by providing them more time to hold hearings and issue decisions. We will also expand the Representative Video Project. Under this project, claimant representatives may use their personal video equipment to participate in hearings from their own office.
Open National Hearing Centers. • In October 2007, we opened a National Hearing Center in Falls Church, Virginia. We will open a second National Hearing Center in Albuquerque, New Mexico, in the Spring of 2009, and will add another in Chicago, Illinois in late May 2009. We also will open a National Hearing Center in Baltimore, Maryland, early in FY 2010. These sites will use video hearing technology to process electronic disability cases. National Hearing Centers give us flexibility in addressing our hearings backlog and swiftly targeting assistance to the most heavily backlogged hearing offices across the country. As we gain experience with National Hearing Centers, we will evaluate our projected workload levels and consider opening additional centers.

Annual Performance Plan for FY 2010 and Revised Final Annual Performance Plan for FY 20099
st
ra
te
gic
go
al
1
Strategic Goal 1
Performance Measure — Strategic Objective 1.11.1a: Process the budgeted number of hearing
Fiscal Year 2009 2010
Target 647,000 726,000
FY 2005 – FY 2008 Historical Performance
Fiscal Year 2005 2006 2007 2008
Performance 519,359 558,978 547,951 575,380
Data definition: The number of hearing requests processed in the current fiscal year up to the number budgeted.
Data source: Case Processing and Management System
Frequency reported: Monthly

10
st
ra
te
gic
go
al
1
Annual Performance Plan for FY 2010 and Revised Final Annual Performance Plan for FY 2009
Strategic Goal 1
Strategic Objective 1.2: Improve our workload management practices
throughout the hearing process
We will continue to revisit the way we perform work in hearing offices by establishing best demonstrated
practices, increasing automation, and testing a variety of models to determine the most efficient methods of doing our work. Our transition from paper to electronic disability folders allows us to further automate and standardize our hearings processes.
Streamline and automate case tasks. • We will improve hearing office business processes using automation to assist us with labor-intensive tasks such as preparing for and scheduling hearings, centralizing printing and mailing of notices, and transferring electronic workloads. The accompanying chart, Automation Initiatives to Improve Hearing Office Business Processes, reflects some of these initiatives. We will also continue to refine and expand the centralized printing and mailing of notices to streamline the processing of the millions of notices hearings offices send annually.
Eliminate use of temporary sites. • We use a variety of sites to hold hearings, including temporary space in hotels, motels, courthouses, schools, and conference centers. The increased use of electronic disability files makes holding hearings in temporary space more difficult as we are generally not able to connect to our electronic system at these sites. We will begin to eliminate use of temporary hearing sites and replace them with video hearing rooms in field offices and other Social Security facilities. This change will allow us to operate more efficiently and provide individuals with a more convenient, secure, and professional environment for their hearing.
Establish standardized electronic hearings business processes. • We will implement standardized electronic business processes in every hearing office and integrate advanced information technology initiatives to support these processes. We will build on these efforts to ensure consistency within hearing offices, reduce operating expenses, and help us determine the ideal ratio of staff needed to support an ALJ in our electronic environment. As a first step, we will complete the rollout of the standardized electronic business process to pilot sites in each region in 2009.
Automation Initiatives to Improve Hearing Office Business Processes
ePulling — A project, currently in pilot, that assembles files electronically. We are working on software improvements to improve its accuracy and efficiency.
Representative Suite of Services — A pilot to allow authorized representatives access to the electronic folder through Electronic Records Express. We anticipate expanding the pilot in FY 2010 to additional authorized representatives.
Increase the Amount of Data Propagated to the Case Processing and Management System (CPMS) — An enhancement of the electronic capabilities of CPMS, our hearing-level case control and tracking system.
Electronic Signature — This new capability will allow ALJs and Attorney Adjudicators to sign decisions electronically, eliminating the need for a wet signature and saving time and paper.
Central Printing and Mailing — An initiative to remove notice printing and mailing tasks from hearing offices, thereby freeing staff to perform other duties.
Video Teleconferencing Expansion — Expansion of our video teleconferencing capability by creating claimant-only video rooms and allowing representatives to purchase their own equipment for use during hearings.

Annual Performance Plan for FY 2010 and Revised Final Annual Performance Plan for FY 200911
st
ra
te
gic
go
al
1
Strategic Goal 1
As we increase our capacity to hear and decide cases, we are mindful of the resulting effect on the Appeals Council workloads. We anticipate receiving more than 20,000 requests for Appeals Council reviews in FY 2009 compared to FY 2008. More requests, coupled with our concentration on processing our oldest and more complex Appeals Council cases, will significantly increase the overall time to process these cases. We estimate aver-age processing time to increase 55 percent between FYs 2008 and 2010. We will closely monitor Appeals Council workloads and take necessary actions. For example, we will invoke new authority that allows the Appeals Council to make final decisions on cases with technical errors, eliminating the need to return them for ALJ review. We will also provide additional support staff and implement early screening initiatives to reduce the time for Appeals Council decisions.
Performance Measures — Strategic Objective 1.21.2a: Achieve the target for number of hearings pending
Fiscal Year 2009 2010
Target 755,000 727,000
FY 2005 – FY 2008 Historical Performance
Fiscal Year 2005 2006 2007 2008
Performance 708,164 715,568 746,744 760,813
Data definition: The number of hearing requests pending at the end of the fiscal year compared to the target.
Data source: Case Processing and Management System
Frequency reported: Monthly
1.2b: Achieve the target to eliminate the oldest hearings pending
Fiscal Year 2009 2010
TargetLess than 1% of hearings pending
850 days or olderLess than 0.5% of hearings pending
825 days or older
FY 2008 Historical Performance
Fiscal Year 2008
Performance Less than 1% of hearings pending 900 days or older
Data definition: The percentage of oldest hearings pending. The oldest hearings are those cases identified as those cases that are pending or will be pending 850 days or more at the end of the fiscal year. The percentage is derived by dividing the total number of hearings pending 850 days or more at the end of the fiscal year by the universe of oldest hearings identified.
Data source: Case Processing and Management System
Frequency reported: Monthly

12
st
ra
te
gic
go
al
1
Annual Performance Plan for FY 2010 and Revised Final Annual Performance Plan for FY 2009
Strategic Goal 1
1.2c: Achieve the budgeted goal for average processing time in days for hearings
Fiscal Year 2009 2010
Target 516 days 508 days
FY 2005 – FY 2008 Historical Performance
Fiscal Year 2005 2006 2007 2008
Performance 415 days 483 days 512 days 514 days
Data definition: The average processing time for hearing decisions compared to the target. The average processing time is the cumulative processing time for all hearings processed divided by the total number of hearings processed in the fiscal year.
Data source: Case Processing and Management System Frequency reported: Monthly
Note: This is also a Program Assessment Rating Tool measure.
1.2d: Achieve the target to eliminate the oldest Appeals Council cases pending
Fiscal Year 2009 2010
TargetLess than 1% of Appeals Council cases
pending 750 days or olderLess than 1% of Appeals Council cases pend-
ing 700 days or older
Data definition: The percentage of oldest Appeals Council cases pending. Oldest cases are identified as those cases that are pending, or will be pending 750 days or more at the end of the fiscal year. The percentage is derived by dividing the total number of cases pending 750 days or more at the end of the fiscal year by the universe of oldest Appeals Council cases identified.
Data source: Appeals Review Processing System Frequency reported: Monthly
Note: This is a new performance measure for FY 2009.
1.2e: Achieve the target for average processing time of Appeals Council decisions
Fiscal Year 2009 2010
Target 265 days 370 days
FY 2005 – FY 2008 Historical Performance
Fiscal Year 2005 2006 2007 2008
Performance 242 days 203 days 227 days 238 days
Data definition: The average processing time for Appeals Council decisions compared to the target. The average pro-cessing time is the cumulative processing time for all Appeals Council decisions divided by the total number of Appeals Council decisions processed in the fiscal year.
Data source: Appeals Review Processing System Frequency reported: Monthly

Annual Performance Plan for FY 2010 and Revised Final Annual Performance Plan for FY 200913
st
ra
te
gic
go
al
2:
Strategic Goal 2:
st r at e g i C goa l 2:Improve the Speed and Quality of Our Disability Process
long-Term Outcomes
Ensure individuals who are clearly disabled receive a decision within 20 calendar days of filing;
Reach an online filing rate of 25 percent for disability applications by 2012;
Regularly update our regulations and policies to incorporate the most recent medical advances;
Develop and implement a common case processing system for the Disability Determination Services; and
Make it easier for disabled individuals to return to work.
•
•
•
•
•
We are responsible for the Nation’s two primary Federal disability programs: Social Security Disability Insurance and Supplemental Security Income. Over the last 5 years, our disability workloads have grown significantly, and this trend will accelerate as baby boomers reach their most disability-prone
years. Studies suggest a correlation between increases in unemployment and increases in disability filings, and we have seen a sizable increase in filings. We expect more than 2.9 million disability applications in FY 2009, a 12 percent increase from FY 2008. Due to the significant growth in disability applications, the increased complexity of those applications, limited resources, advances in medical treatments, changing health information technology, and outdated policies and procedures, our ability to process disability applications has fallen short of our own expectations. Furthermore, we anticipate a 20 percent increase in the average amount of time it will take to process an initial disability claim.
Strategic Objective 2.1: Fast-track cases that obviously meet our disability standards
We are obligated to provide benefits quickly to individuals whose medical conditions are so serious that they obviously meet our disability standards. This is particularly critical in Supplemental Security Income claims to ensure these individuals immediately get the vital medical coverage they need. The
Quick Disability Determination (QDD) process and the Compassionate Allowances (CAL) initiative enable us to fast-track these cases by utilizing computer technology to identify those individuals with the most severe disabilities. Moreover, these fast-track disability processes help free up resources so we can better cope with a projected increase of about 300,000 disability cases. We will continue to refine our fast-tracking capabilities by:
Expanding• Quick Disability Determinations: The QDD decision process uses a computer predictive model to screen initial applications to identify individuals for whom a favorable disability determination is highly likely and medical evidence is quickly and easily obtainable; e.g., low birth-weight babies, cancer, and end-stage renal disease. On average, we process allowances on those cases we identify as QDD in about 10 days. QDD is now in use across the country. We will expand our QDD process by refining the predictive model and using it to its maximum capacity to accurately identify these cases.

14
st
ra
te
gic
go
al
2:
Annual Performance Plan for FY 2010 and Revised Final Annual Performance Plan for FY 2009
Strategic Goal 2:
Refining Compassionate Allowances• : The CAL decision process provides quick identification of individuals who are clearly disabled by the nature of their disease or condition. With CAL, we can favorably decide these claims based on confirmation of the diagnosis alone for such diseases as acute leukemia, amyotrophic lateral sclerosis, and pancreatic cancer. Currently 50 impairments and conditions are identified as CAL cases. We are also working with the National Institutes of Health to identify the most up-to-date scientific information to assist us in identifying CAL cases so that we can accelerate the processing of these claims. We implemented CAL nationally in 2008, and we will continue to refine and expand CAL as we gain additional insight into how we might better recognize and fast-track disability claims.
Performance Measures — Strategic Objective 2.12.1a: Achieve the target percentage of initial disability claims identified as a Quick Disability Determination or a Compassionate Allowance
Fiscal Year 2009 2010
Target 3.8% 4.5%
Data definition: The percentage is derived by dividing the total number of initial disability claims identified as Quick Disability Determinations or Compassionate Allowances by the total number of electronic initial disability claims filed in the current fiscal year.
Data source: Executive and Management Information System, Claims/Post-eligibility Report, Disability Management Information
Frequency reported: Monthly
Note: This is a new performance measure for FY 2009.
2.1b: Process the budgeted number of initial disability claims
Fiscal Year 2009 2010
Target 2,637,000 2,851,000
FY 2007 – 2008 Historical Performance
Fiscal Year 2007 2008
Performance 2,529,721 2,607,282
Data definition: The number of Social Security and Supplemental Security Income initial disability claims processed in the Disability Determination Services and other agency components in the current fiscal year up to the budgeted number.
Data source: National Disability Determination Services System and Disability Operational Data Store
Frequency reported: Monthly

Annual Performance Plan for FY 2010 and Revised Final Annual Performance Plan for FY 200915
st
ra
te
gic
go
al
2:
Strategic Goal 2:
2.1c: Minimize average processing time in days for initial disability claims to provide timely decisions
Fiscal Year 2009 2010
Target 129 days 156 days
FY 2008 Historical Performance
Fiscal Year 2008
Performance 106 days
Data definition: The average processing time is the overall, cumulative number of elapsed days, including both Disabil-ity Determination Services and field office processing times, from the date of filing through the date payment is made or the denial notice is issued for all initial claims that require a medical determination. The total number of days to process all initial disability claims requiring a medical determination is divided by the total number of initial disability claims requiring a medical determination that are processed during the fiscal year.
Data source: Social Security Unified Measurement Systems
Frequency reported: Monthly
Note: This is also a Program Assessment Rating Tool measure.
Strategic Objective 2.2: Make it easier and faster to file for disability benefits online
In the next 10 years, we project initial disability claims will increase by at least 10 percent, mainly due to the aging baby boomers reaching their most disability-prone years and because more people are filing for disability benefits due to the current economic crisis. To handle this anticipated growth, as well as fulfill the rapidly
growing expectation for convenient, effective, and secure electronic service delivery options, we will:
Implement Disability Direct: Disability Direct is a new initiative that will make it easier and faster for individuals to apply for disability benefits online by using iClaim, a tool that enables individuals to file electronically for disability benefits from the comfort and convenience of their home or office. Disability Direct provides a simplified, secure, and user-friendly application process. It only asks questions relevant to the particular individual, thereby streamlining the process by making it easier and faster to file for disability benefits online. Disability Direct also includes links, prompts, and other tools to assist individuals.
Increasingly, representatives transact business with us on behalf of individuals filing for disability benefits. To meet the demand for service from representatives (such as attorneys, non-attorneys, representative payees, and third parties) and alleviate workloads in our field offices, as a second element of Disability Direct, we will build a comprehensive package of online services for representatives.

16
st
ra
te
gic
go
al
2:
Annual Performance Plan for FY 2010 and Revised Final Annual Performance Plan for FY 2009
Strategic Goal 2:
Performance Measure — Strategic Objective 2.22.2a: Achieve the target percentage of initial disability claims filed online
Fiscal Year 2009 2010
Target 18% 25%
Data definition: The percentage of initial Social Security disability claims filed online. The percentage is derived by dividing the number of initial Social Security disability claims filed online by the total number of initial disability claims that could be filed online in the current fiscal year.
Data source: Executive and Management Information System, Electronic Service Delivery, Localized Management Information Report
Frequency reported: Monthly
Note: This is a new performance measure for FY 2009.
Strategic Objective 2.3: Regularly update our disability policies and procedures
With the dramatic growth in the number of people applying for disability benefits, we cannot continue to process cases as we have in the past. Testing for and treatment of impairments have changed over the years. By comparison, the way we process medical information to define disability has not changed in
any fundamental way in years. Therefore, we will update our disability policies and procedures and use automation as outlined below:
Improve the • Ticket to Work program. In 1999, Congress established the Ticket to Work program to encourage individuals receiving disability benefits to return to work. For a number of reasons, the Ticket to Work program did not achieve the goals intended by Congress. As a result, we published new regulations in 2008, revising the Ticket to Work program to provide more incentives to increase participation. We expect these changes to lead to a 150 percent increase in the number of participants from 200,000 to 500,000 by the end of FY 2013. We will also conduct research to help us better identify individuals likely to participate in the Ticket to Work program and to improve its efficiency.
Simplify work incentive programs. • When individuals return to work, they must deal with complex rules regarding how much they can earn and when, and how these earnings affect their benefits. We are simplifying these rules to further encourage individuals with disabilities to return to work without fear of losing their monthly benefit payments and Medicare or Medicaid coverage. We are seeking input from key disability advocates on simplifying these rules and streamlining the process. The result will be a program that is less complicated to explain, administer, and understand. We will also continue to conduct research and demonstration projects to study ways to improve and simplify our services and address the varied needs of individuals with disabilities. One project, Benefit Offset National Demonstration, will test the effect of allowing individuals returning to work to continue receiving disability benefits at a reduced rate rather than losing all of their benefits, as they would under our current policy.

Annual Performance Plan for FY 2010 and Revised Final Annual Performance Plan for FY 200917
st
ra
te
gic
go
al
2:
Strategic Goal 2:
Update our • listing of Impairments. One of the most effective tools we have for adjudicating disability claims is the Listing of Impairments, which allows us to determine if an individual is disabled when his or her impairment meets specified criteria. The Listing of Impairments improves the consistency and accuracy of our decisions throughout all levels of the disability process. In the last two years, we have published final regulations for three of the 14 adult body systems so they now reflect updated advancements in medicine and technology. We are on schedule to update all of the medical Listings every 5 years, and in the future, we plan to update the Listings as often as every 3 years. We also are in the process of expanding the Listings to include rare diseases and conditions that clearly represent permanently disabling conditions.
Develop an • Occupational Information System. We rely on the occupational information found in the Dictionary of Occupational Titles (DOT), produced by the Department of Labor, to determine whether individuals can do their usual work or any other work in the U.S. economy. The Department of Labor no longer updates the DOT; consequently, we are developing a long-term strategy to create a new Occupational Information System tailored to our disability programs. We are also exploring whether comparable information is available in the private sector that our decision-makers can use in the interim.
Adapt our systems to • Health Information Technology. To assist us in making disability determinations, we collect and store more than 250 million medical documents and make over 15 million requests for medical evidence on behalf of disability applicants each year. In partnership with the Department of Health and Human Services, the Department of Veterans Affairs, other federal and state agencies, health care providers, and insurers, we will collaborate to create uniform diagnostic codes and medical report formats to standardize electronic storage of medical records. Such standardization will allow us to not only identify disabling conditions quickly and automatically, but will allow us to search our vast database of medical records to track trends in disability cases and design more objective methods to identify disabling conditions.
We began working with Beth Israel Deaconess Medical Center in Boston last year to determine how we could use health information technology to make disability decision-making more efficient and timely. We are also collaborating with MedVirginia, the North Carolina Healthcare Information and Communications Alliance, and Kaiser Permanente to implement the Nationwide Health Information Network, the nation’s electronic network of health information. Through this Network, we will have instantaneous access to medical records that will significantly shorten the time it takes to make a disability decision. For example, when an individual receiving treatment at a hospital files a disability application, our system will automatically send out a medical record request. Almost immediately, the hospital will electronically transmit back to us the individual’s medical record. This initiative will revolutionize the way we process disability claims at all levels. In addition, the Network follows the privacy principles established in the Nationwide Privacy and Security Framework for Electronic Exchange of Individually Identifiable Health Information. To access this document, click on the link below: (http://healthit.hhs.gov/portal/server.pt?open=512&objID=1173&parentname=CommunityPage&parentid=34&mode=2&in_hi_userid=10732&cached=true).
Expedite record requests in disability cases. • Currently, we must obtain written authorization from individuals to send to their medical sources to acquire their medical records when they apply for disability benefits. This written authorization is the single remaining paper document currently required in our otherwise fully electronic disability case process. We will explore options and develop legislative proposals to streamline the process of obtaining consent to access medical records. This modification will enable us to reduce the burden on all parties involved and provide more timely decisions to disabled individuals while respecting the confidentiality of their personal information.

18
st
ra
te
gic
go
al
2:
Annual Performance Plan for FY 2010 and Revised Final Annual Performance Plan for FY 2009
Strategic Goal 2:
Develop and implement a Disability Determination Services common case processing system. • Each of the 54 state and territorial Disability Determination Services has its own unique case processing system, many of which are incompatible, outdated, and expensive to maintain. Under the Disability Case Processing System Initiative, we are working collaboratively with the Disability Determination Services Administrators to develop and implement a common system for use by all Disability Determination Services. This common system will incorporate decision support tools, contain better quality checks, and be compatible with industry standards for electronic medical records. Furthermore, the new system will provide the foundation for a seamless disability case processing system from the point of application to the final level of appeal.
Employ the • Electronic Claims Analysis Tool (eCAT). We are piloting a new web-based tool, eCAT, to assist examiners in the Disability Determination Services in making disability determinations. This tool guides disability examiners through the policy aspects of a disability claim to yield consistent, policy compliant outcomes. We expect eCat’s use will produce well-reasoned decisions with easy to understand explanations of how we reached our decision. First tested in the Virginia and Connecticut Disability Determination Services, we will expand testing of eCAT to three additional states in FY 2009.
Performance Measure — Strategic Objective 2.32.3a: Update the medical listing of Impairments
Fiscal Year 2009 2010
TargetDevelop and submit at least 3 regulatory actions or Social Security Rulings
Develop and submit at least 3 regulatory actions or Social Security Rulings
Data definition: Regulatory actions include Advance Notice of Proposed Rulemaking, Notice of Proposed Rule Making, Final Rules, or Ruling, or other Federal Register notice. We will develop regulatory actions or Social Security Rulings related to updating the medical Listings of Impairments for publication in the Federal Register.
Data source: Office of Retirement and Disability Policy Workplan
Frequency reported: Annually
Note: This is a new performance measure for FY 2009

Annual Performance Plan for FY 2010 and Revised Final Annual Performance Plan for FY 200919
st
ra
te
gic
go
al
3
Strategic Goal 3:
st r at e g i C goa l 3:Improve Our Retiree and Other Core Services
long-Term Outcomes
Achieve an online filing rate of 50 percent for retirement applications by 2012;
Improve the clarity of our correspondence;
Improve telephone service on our National 800 Number and in our field offices; and
Further automate our Social Security card application process.
•
•
•
•
Millions of baby boomers are attaining retirement age and filing for retirement benefits. Many of
these individuals expect and increasingly demand the availability and convenience of online services. In addition to processing retirement claims, we provide many other core services, such as processing claims for survivors, disability, and Supplemental Security Income benefits; issuing new and replacement Social Security cards; posting earnings to workers’ records; handling calls to our National 800 Number and field offices; issuing annual Social Security Statements; and serving the public in our community-based field offices. To address the increased growth in our workloads, we must transform the way we deliver service by developing a wide-range of online and automated services. Our ultimate goal is to provide individuals and their representatives with the ability to apply for all types of benefits and to update their records online.
What We Do
3.7 million retirement and survivors applications;•1 million Medicare Low Income Subsidy applications;•321,000 Supplemental Security Income Aged applications;•62,000 Food Stamp applications;•18 million Social Security cards;•1 billion requests for Social Security Number verifications;•270 million self-employment income and employer wage reports;•19 million requests for benefit verification;•149 million • Social Security Statements;60 million calls to our National 800 Number;•44 million visitors to our field offices;•8.2 million representative payee accountings and other changes;•3.1 million overpayment actions; and•34 million status changes (e.g. direct deposit, address changes).•
Numbers based on FY 2008 workloads

20
st
ra
te
gic
go
al
3
Annual Performance Plan for FY 2010 and Revised Final Annual Performance Plan for FY 2009
Strategic Goal 3:
Strategic Objective 3.1: Dramatically increase baby boomers’ use of our online
retirement services
Nearly 80 million baby boomers will file for retirement benefits over the next 20 years — an average of 10,000 per day — making it necessary to transform the way we deliver service by developing a wide range of online and automated services. To enhance our online services, we will:
Implement• Ready Retirement. Ready Retirement is a new initiative that will fully streamline the retirement application process and allow online filing using iClaim, a tool that enables individuals to file electronically for retirement benefits from the comfort and convenience of their home or office. On average, users are able to complete the application in as little as 15 minutes — far shorter than the 45 minutes it often took to complete the former online application. Much of this reduction stems from simplifying and streamlining our policies and procedures. For example, iClaim only asks questions pertinent to an individual’s personal situation. It also eliminates the need to ask questions for information we already have in our records, e.g. age, earnings, citizenship, and military service. We have also embarked on an extensive and creative marketing strategy to increase public awareness of both the availability and advantages of iClaim, including public service announcements on radio and television and ads in newspapers and magazines. We will enhance iClaim in FY 2009 to enable individuals to file Medicare-only claims online. Future releases of iClaim will include authentication protocols to provide two-way online communications with individual filers while safeguarding personally identifiable information, as well as streamlined policies to support online filing.
Expand the use of electronic data exchanges. • We will increase electronic data exchange with the states and other government agencies to eliminate the need for online filers to bring or mail us evidentiary documents, such as birth and death certificates, proof of citizenship, and Forms W-2. Electronic data exchange transforms the process from paper to fully electronic, making it more efficient and convenient.
Provide online tools to plan for retirement. • We have greatly improved the information available to an individual who is trying to decide the optimum date for retirement with our Retirement Estimator. This quick and secure online financial planning tool eliminates the need to manually key in years of earnings information and provides comparisons of various retirement scenarios. We will continue to refine and enhance our Retirement Estimator based on feedback from users.

Annual Performance Plan for FY 2010 and Revised Final Annual Performance Plan for FY 200921
st
ra
te
gic
go
al
3
Strategic Goal 3:
Performance Measures — Strategic Objective 3.13.1a: Percent of Retirement and Survivors claims receipts processed up to the bugeted level
Fiscal Year 2009 2010
Target100%
(4,543,000)100%
(4,565,000)
FY 2007 – FY 2008 Historical Performance
Fiscal Year 2007 2008
Performance100.7%
(3,863,813)101.2%
(4,236,455)
Data definition: The number of retirement, survivors, and health insurance claims processed in the current fiscal year up to the budgeted number.
Data source: Social Security Unified Measurement System Operational Data Store
Frequency reported: Monthly
Note: This is also a Program Assessment Rating Tool measure.
3.1b: Achieve the target percentage of retirement claims filed online
Fiscal Year 2009 2010
Target 26% 38%
Data definition: The percentage of retirement claims filed online. The percentage is derived by dividing the number of retirement claims filed online by the total number of retirement claims that could be filed online in the fiscal year.
Data source: Executive and Management Information System
Frequency reported: Monthly
Note: This is a new performance measure for FY 2009.

22
st
ra
te
gic
go
al
3
Annual Performance Plan for FY 2010 and Revised Final Annual Performance Plan for FY 2009
Strategic Goal 3:
Strategic Objective 3.2: Provide individuals with accurate, clear, up-to-date information
We issue 350 million notices annually that communicate decisions, payment, and other important information, as well as inform individuals of their rights and responsibilities under our programs, including appeal rights. It is critical that our notices be clear, concise, and easily understood. This will reduce confusion
and uncertainty among individuals who might otherwise call our National 800 Number or come into a field office for clarification — an unnecessary drain on their time and our resources.
We will assess and improve agency notices. Our notice improvement efforts will include targeting high-volume, problematic notices and obtaining input from those who receive our notices on how we can improve them. Once we identify and assess problem notices, we will develop notice standards, clear writing guidelines, and a national notice clearance process to ensure that the standards and guidelines are applied. Initial efforts will focus on improving letters that notify individuals of the date of their hearing, as well as Supplemental Security Income award and denial notices.
Strategic Objective 3.3: Improve our telephone service
Our telephone service remains a primary option for providing effective and efficient service to the public. Last year, we handled 60 million calls to our National 800 Number and a comparable number to our field offices, and we expect the volume to grow to 61 million by 2010. To address these increases in
call volumes, we must enhance our automated telephone services so more people can successfully conduct their business with us by phone. We continue to provide optimal call services with new technologies that help us forecast call volumes, anticipate staffing needs, and better distribute incoming calls across the network. This allows us to answer calls and connect callers wishing to speak to an agent as quickly as possible. For example, we now offer speech recognition that allows callers to speak their request into an interactive voice-prompt system, thereby reducing the time callers spend navigating through menu-prompts and error-prone, touch-tone commands. Our automated telephone services provide callers an array of choices, including changes of address, benefit verification requests, and Medicare replacement cards, without the assistance of an agent.
In addition, we have begun implementing the Telephone Service Replacement Project, a multi-year replacement of our aged telephone system. The new telephone system will include Voice over Internet Protocol (VoIP). VoIP is a single system that carries voice and data over one line, saves administrative costs, and supports future technological improvements. VoIP provides a new capability to re-route calls during disasters and other emergencies. A VoIP network will enable us to test future technologies, such as “click to talk” to connect individuals to our telephone agents who can help them while they are conducting business online.

Annual Performance Plan for FY 2010 and Revised Final Annual Performance Plan for FY 200923
st
ra
te
gic
go
al
3
Strategic Goal 3:
Performance Measures — Strategic Objective 3.33.3a: Achieve the target speed in answering National 800 Number calls
Fiscal Year 2009 2010
Target 330 seconds 300 seconds
FY 2005 – FY 2008 Historical Performance
Fiscal Year 2005 2006 2007 2008
Performance 296 seconds 278 seconds 250 seconds 326 seconds
Data definition: Speed of answer is calculated by dividing the wait time of all calls by the number of all calls answered in the fiscal year. Wait time begins from the time the caller is transferred to an agent (in queue) until an agent answers the call.
Data source: Report generated by Cisco router software
Frequency reported: Monthly
3.3b: Achieve the target busy rate for National 800 Number calls
Fiscal Year 2009 2010
Target 10% 9%
FY 2005 – FY 2008 Historical Performance
Fiscal Year 2005 2006 2007 2008
Performance 10% 12% 8% 10%
Data definition: The busy rate is calculated as the number of busy messages divided by number of calls offered to agents in the fiscal year. The caller receives a busy message when an agent is not available to answer the call because the queue has reached its maximum capacity of waiting calls. When this happens, we instruct the individual to call back later.
Data source: Report generated by Cisco router software
Frequency reported: Monthly
24
st
ra
te
gic
go
al
3
Annual Performance Plan for FY 2010 and Revised Final Annual Performance Plan for FY 2009
Strategic Goal 3:
Strategic Objective 3.4: Improve service for individuals who visit our field offices
Our field offices are our front door for the American public. To better serve the public, we have a new initiative — Space Modernization and Reception Transformation (SMART) — that will upgrade our field office reception areas and use new technologies to offer improved services to accommodate the increasing
number of individuals who visit us each day. Under this initiative, we are identifying and incorporating new reception area features and designs to make visiting our offices a better experience. For individuals who live in remote areas and find it difficult to visit a field office, we are expanding our ability to serve them by using video technology. The ultimate goal of this initiative is to lay the groundwork for the “SSA Office of the Future.” To support this initiative, we will:
Improve field office reception and interview areas. • We are redesigning our reception and interview areas to improve privacy and confidentiality for visitors to conduct their business. We are installing easy-to-read digital signs to inform visitors where to go, as well as providing a more welcoming and accommodating look.
Pilot self-help personal computers. • This initiative offers visitors access to a personal computer in our reception area to use our online services as an alternative to waiting for an interview with field office personnel. Self-help personal computers will provide an option for individuals who may not have access to a personal computer at home. For visitors using these computers, we will provide a wide-range of support services as they complete their transactions online, such as instructional videos and employees offering technical assistance.
Provide • Social Security TV. We will continue to pilot Social Security TV in field offices. The televisions will run informational broadcasts in reception areas to provide office visitors with information about our programs and services, such as what documents they need to apply for benefits or a Social Security Number. We can modify the broadcasts to adapt to specific locations, types of service, and language needs.
Expand video service delivery. • We will continue to expand the use of video conferencing for individuals living in rural areas where transportation to visit our offices is limited and costly. Video conferencing offers a convenient and low-cost option to obtain a full-range of our services. We are testing its use in a number of locations across the country and examining the feasibility of expanding video service delivery for individuals living abroad.

Annual Performance Plan for FY 2010 and Revised Final Annual Performance Plan for FY 200925
st
ra
te
gic
go
al
3
Strategic Goal 3:
Performance Measure — Strategic Objective 3.43.4a: Percent of individuals who do business with SSA rating the overall services as “excellent,” “very good,” or “good”
Fiscal Year 2009 2010
Target 83% 83%
FY 2005 – FY 2008 Historical Performance
Fiscal Year 2005 2006 2007 2008
Performance 85% 82% 81% 81%
Data definition: The percent is derived by dividing the number of respondents who rate overall service as “good,” “very good,” or “excellent” on a six-point scale ranging from “excellent” to “very poor” in the fiscal year by the total number of respondents.
Data source: Service Satisfaction Surveys
Frequency reported: Annually
Note: This is also a Program Assessment Rating Tool Measure.
Strategic Objective 3.5: Process our Social Security Number workload more
effectively and efficiently
Each year we process 6 million original and 12 million replacement Social Security card applications. We also verify Social Security Numbers more than one billion times a year through a variety of electronic exchanges with public and private organizations. The process of assigning and issuing Social Security Numbers is
referred to as enumeration. This workload is highly sensitive and often complex. As Congress continues to debate immigration reform, we expect additional work and complexity in this area. We must develop efficient ways to handle this workload electronically to meet the increases in our enumeration workloads. To accomplish this, we will implement features of a plan we have developed, referred to as Quick, Simple, and Safe SSNs. This plan will drastically reduce the burden on the public as we improve the efficiency of our process through automation:
Strengthen the • Social Security Number Application Process (SSNAP). Our employees currently use two systems to process Social Security card requests. The SSNAP initiative will combine the functionality from the two systems into a single web-based application that ensures the integrity of the enumeration process.
Assess the feasibility of an online application for replacement Social Security cards. • We will conduct a study to determine if we should build an online application for individuals to request a replacement Social Security card. We will ensure this online application provides the highest level of security, privacy, and identity assurance.

26
st
ra
te
gic
go
al
3
Annual Performance Plan for FY 2010 and Revised Final Annual Performance Plan for FY 2009
Strategic Goal 3:
Provide central locations to process Social Security Number applications. • We are providing central locations, Social Security Card Centers, to process Social Security Number applications in high-volume geographical areas. We direct all Social Security Number-related business in the surrounding area to the Card Center where staff specializes in this workload. Social Security Card Centers reduce the wait time and help us process Social Security cards more accurately. In turn, this allows field offices in the surrounding area to reduce the wait time for visitors and concentrate on other important workloads. We recently opened our seventh Card Center in Sacramento, California. We have estimated opening dates during FY 2009 for four more Card Centers located in Pasadena, Texas; Northwest Houston, Texas; South Bronx, New York; and Twin cities (Minneapolis), Minnesota. In FY 2010, we have an estimated opening date for a Card Center in Philadelphia, Pennsylvania and one in Manhattan, New York during FY 2011.
Expand use of • Social Security Number verification services. The Social Security Number Verification Service (SSNVS) allows employers to determine, almost instantaneously, if the reported name and Social Security Number of an employee matches our records. We will work with the business community to encourage additional employers and private-sector companies to use this service. SSNVS will help minimize fraud, prevent the use of Social Security Numbers for identity theft, and ensure the accuracy of individuals’ earnings records.
Support • E-Verify. Because SSNVS does not verify employment eligibility, we will continue to support E-Verify, a voluntary Department of Homeland Security program that allows employers to electronically verify the employment eligibility status of newly hired employees. The E-Verify system checks the information employers submit about an employee against our records and then notifies employers if the data matches our records. For non-citizens, E-Verify also checks Department of Homeland Security immigration databases to verify work authorization status.
Expand • Enumeration-at-Entry. Currently, this program allows aliens age 18 or older to apply for a Social Security Number with the Department of State or the Department of Homeland Security when they arrive in the U.S. We will work with these agencies to expand this process to children under age 18 who apply for immigrant visas and to individuals applying for admission to the U.S. who are under certain non-immigrant visa classifications. These planned improvements will curtail opportunities for fraud and reduce the number of enumeration-at-entry problem cases handled by our field offices employees.
Implement use of • Auto Cards. We will work with the Department of Homeland Security and support their transmission of data directly to our enumeration system to allow us to automatically and securely assign a Social Security Number and issue a Social Security card without field office action for certain changes in alien and citizenship status. The new process will be available for three categories of individuals: 1) non-immigrants whose status changes to permanent resident status; 2) non-citizens applying for a work permit for the first time; and 3) people who become naturalized citizens and may have changed their name.

Annual Performance Plan for FY 2010 and Revised Final Annual Performance Plan for FY 200927
st
ra
te
gic
go
al
3
Strategic Goal 3:
Performance Measure — Strategic Objective 3.53.5a: Achieve the target percentage for assigning original Social Security Numbers correctly
Fiscal Year 2009 2010
Target 95% 95%
FY 2008 Historical Performance
Fiscal Year 2008
Performance Available May 2009
Data definition: The percentage is derived using a statistically valid sample of original Social Security Numbers assigned in the fiscal year. The number of correctly issued Social Security Numbers is divided by the total number sampled. We consider the Social Security Number assigned correctly when: 1) the individual did not receive a Social Security Num-ber that belongs to someone else; 2) the individual does not receive more than one Social Security Number; and 3) the individual is eligible to receive a Social Security Number based on supporting documentation.
Data source: Enumeration Process Quality Review
Frequency reported: Annually

28
st
ra
te
gic
go
al
4
Annual Performance Plan for FY 2010 and Revised Final Annual Performance Plan for FY 2009
Strategic Goal 4:
st r at e g i C goa l 4:Preserve The Public’s Trust In Our Programs
long-Term Outcomes
Minimize improper payments;
Improve protection of personally identifiable information;
Increase the electronic filing of wage reports;
Strengthen our efforts to protect program dollars from waste, fraud, and abuse; and
Increase the use of “green” solutions in our daily operations.
•
•
•
•
•
last year we paid 60 million individuals approximately $700 billion in Social Security and Supplemental Security Income payments. We must have policies and core processes in place to ensure we pay benefits accurately and timely and administer our programs efficiently and effectively. Since we take our stewardship
of these programs seriously, we will continue to demonstrate an unyielding commitment to sound management practices. To accomplish this objective, we employ technology and work collaboratively with our Federal, state, and local partners to identify improper payments. We also conduct ongoing, extensive reviews to not only confirm individuals receive the benefits they are due, but also to maintain public confidence that we protect and properly manage our resources and program dollars.
Strategic Objective 4.1: Curb improper payments
As good stewards of the programs entrusted to us, we must ensure that we pay individuals the correct amount — neither overpaying nor underpaying them. To accomplish this, we have undertaken projects with the most potential to improve program integrity across three fronts: detect improper payments, prevent
improper payments, and collect debt.
Detect improper payments
Conduct Supplemental Security Income redeterminations. • Supplemental Security Income is a means-tested program that provides cash assistance to aged, blind, and disabled individuals with limited income and resources. Once individuals are eligible for these benefits, changes in their living arrangements or in the amount of their income or resources can affect their ongoing eligibility for or the amount of their benefit. In order to assure that we are making accurate Supplemental Security Income payments only to eligible individuals, we conduct periodic reviews, or redeterminations. Redeterminations are also a proven investment, by ensuring that Supplemental Security Income recipients are receiving the correct benefit amount based on non-medical factors of eligibility. An estimate based on the FY 2010 request is that redeterminations processed above the base level have a return on investment of $7 in program savings over 10 years for each $1 of additional funding spent, including savings

Annual Performance Plan for FY 2010 and Revised Final Annual Performance Plan for FY 200929
st
ra
te
gic
go
al
4
Strategic Goal 4:
accruing to Medicaid. The number of redeterminations conducted has fallen in order to devote our resources to our other important services, such as taking and processing applications for benefits and Social Security Number workloads. Our payment accuracy has suffered as a result. We directly attribute our decline in overpayment accuracy to the reduction in the number of redeterminations conducted.
Perform Continuing Disability Reviews (CDR). • To ensure we pay disability benefits only to those who continue to meet our medical requirements, we periodically conduct CDRs. We have found that CDRs are highly productive, and like redeterminations, every $1 spent produces a $10 return. To make this process even more efficient, we have developed the CDR mailer/statistical scoring model to screen cases and identify those in which a full medical review would not be cost-effective. We then conduct full medical CDRs for the remaining cases. We expect to process more CDRs in FY 2009 in large part because of the additional dedicated funding provided by Congress for FY 2009.
Prevent improper payments
Expand the Access to Financial Information project. • In the Supplemental Security Income program, resources in undisclosed financial accounts are a primary factor contributing to many overpayments. We will continue to use an electronic process, known as Access to Financial Information, to check account balances directly with financial institutions. This process will help us identify individuals who have accounts exceeding the Supplemental Security Income resource limits. To date, we have implemented Access to Financial Information in three states — California, New Jersey, and New York and, as funding allows, we will move forward with national implementation.
Promote use of Supplemental Security Income monthly wage verification. • Wages continue to be a major source of payment error in the Supplemental Security Income program because we do not always receive accurate or timely monthly wage information. We have made it easier for individuals and representative payees — individuals or organizations who receive Social Security or Supplemental Security Insurance benefits on behalf of others who cannot manage their own benefits — to report monthly wages through an automated telephone system. This project also eliminates the need for individuals to mail or bring copies of their pay slips into their local field offices. As we move forward with additional enhancements to the system, we will be able to process even more wage reports electronically. We will also continue to refine our Supplemental Security Income monthly wage-reporting website, which contains helpful hints for making wage reporting faster and easier.
Collect debt
Maintain overpayment collection efforts. • We recover Social Security and Supplemental Security Income debt from the overpaid individual. We also recover debt from a representative payee who is liable for the overpayment. To recover debt, we withhold current benefit payments from the individual. Debt is more difficult to recoup once benefits end; therefore, we make every effort to identify and collect debt as soon as possible. If the overpaid individual no longer receives benefits, we withhold debt from a variety of sources including tax refunds, Federal annuities, and wages.
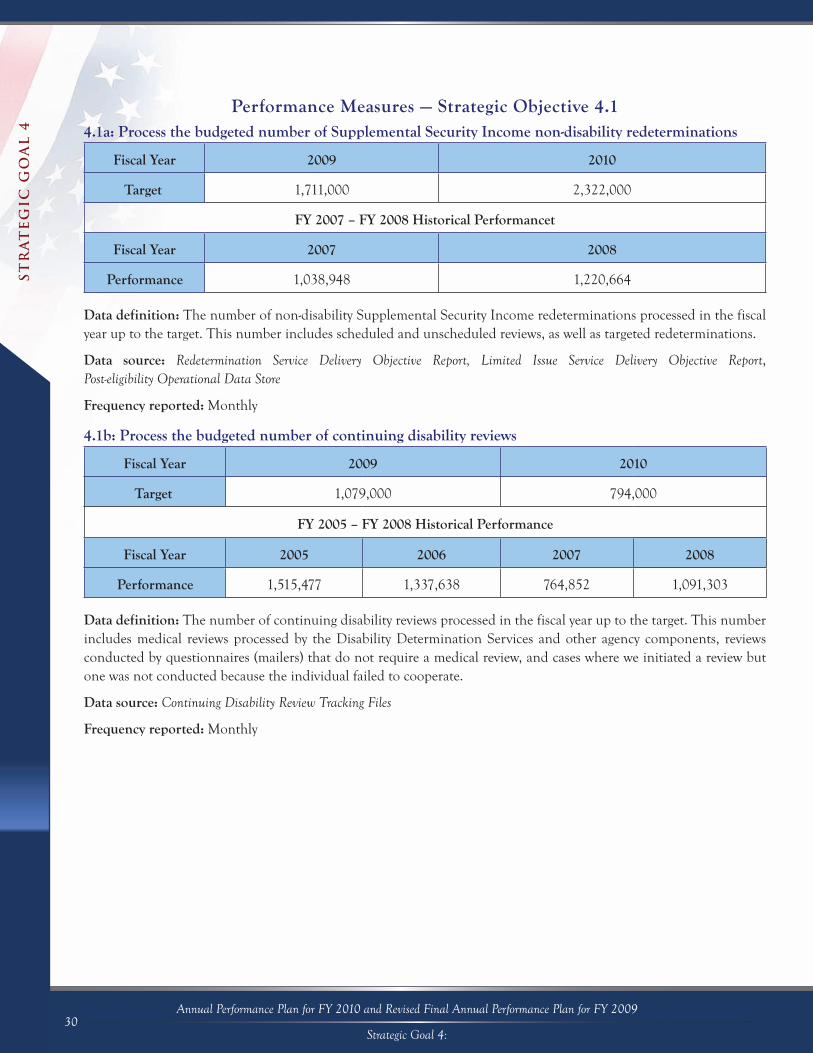
30
st
ra
te
gic
go
al
4
Annual Performance Plan for FY 2010 and Revised Final Annual Performance Plan for FY 2009
Strategic Goal 4:
Performance Measures — Strategic Objective 4.14.1a: Process the budgeted number of Supplemental Security Income non-disability redeterminations
Fiscal Year 2009 2010
Target 1,711,000 2,322,000
FY 2007 – FY 2008 Historical Performancet
Fiscal Year 2007 2008
Performance 1,038,948 1,220,664
Data definition: The number of non-disability Supplemental Security Income redeterminations processed in the fiscal year up to the target. This number includes scheduled and unscheduled reviews, as well as targeted redeterminations.
Data source: Redetermination Service Delivery Objective Report, Limited Issue Service Delivery Objective Report, Post-eligibility Operational Data Store
Frequency reported: Monthly
4.1b: Process the budgeted number of continuing disability reviews
Fiscal Year 2009 2010
Target 1,079,000 794,000
FY 2005 – FY 2008 Historical Performance
Fiscal Year 2005 2006 2007 2008
Performance 1,515,477 1,337,638 764,852 1,091,303
Data definition: The number of continuing disability reviews processed in the fiscal year up to the target. This number includes medical reviews processed by the Disability Determination Services and other agency components, reviews conducted by questionnaires (mailers) that do not require a medical review, and cases where we initiated a review but one was not conducted because the individual failed to cooperate.
Data source: Continuing Disability Review Tracking Files
Frequency reported: Monthly

Annual Performance Plan for FY 2010 and Revised Final Annual Performance Plan for FY 200931
st
ra
te
gic
go
al
4
Strategic Goal 4:
4.1c: Percent of Supplemental Security Income payments free of overpayment (O/P) and underpayment (U/P) errors
Overpayment Accuracy Rate
Fiscal Year 2009 2010
Target 96% 96%
FY 2005 – FY 2008 Historical Performance
Fiscal Year 2005 2006 2007 2008
Performance 93.6% 92.1% 90.9% Available June 2009
Underpayment Accuracy Rate
Fiscal Year 2009 2010
Target 99.8% 99.8%
FY 2005 – FY 2008 Historical Performance
Fiscal Year 2005 2006 2007 2008
Performance 99.8% 99.9% 99.9% 99.9%
Data definition: The Supplemental Security Income payment accuracy rate free of overpayment and under-payment error is determined by an annual review of a statistically valid sample of the beneficiary rolls. The payment accuracy is based on a non-medical review of sampled individuals receiving Supplemental Security Income payments during the fis-cal year. The overpayment accuracy rate is determined by dividing the total overpayment error dollars by the total dollars paid for the fiscal year and subtracting this percentage from 100%. The underpayment accuracy rate is determined by dividing the total underpayment error dollars by the total dollars paid for the fiscal year and subtracting this percentage from 100%.
Data source: Supplemental Security Income Stewardship Report
Frequency reported: Annually
Note: This is also a Program Assessment Rating Tool measure

32
st
ra
te
gic
go
al
4
Annual Performance Plan for FY 2010 and Revised Final Annual Performance Plan for FY 2009
Strategic Goal 4:
4.1d: Percentage of Old-Age, Survivors, and Disability Insurance payments free of overpayment (O/P) and underpayment (U/P) error
Overpayment Accuracy Rate
Fiscal Year 2009 2010
Target 99.8% 99.8%
FY 2005 – FY 2008 Historical Performance
Fiscal Year 2005 2006 2007 2008
Performance 99.6% 99.7% 99.8% 99.7%
Underpayment Accuracy Rate
Fiscal Year 2009 2010
Target 99.8% 99.8%
FY 2005 – FY 2008 Historical Performance
Fiscal Year 2005 2006 2007 2008
Performance 99.8% 99.9% 99.9% 99.9%
Data definition: The Old-Age, Survivors, and Disability Insurance (OASDI) payment accuracy rate free of overpayment and underpayment error is determined by an annual review of a statistically valid sample of the beneficiary rolls. The payment accuracy is based on a non-medical review of sampled individuals receiving OASDI payments during the fiscal year. The overpayment accuracy rate is determined by dividing the total overpayment error dollars by the total dollars paid for the fiscal year and subtracting this percentage from 100%. The underpayment accuracy rate is determined by dividing the total underpayment error dollars by the total dollars paid for the fiscal year and subtracting this percentage from 100%.
Data source: Old-Age, Survivors, and Disability Insurance Stewardship Report
Frequency reported: Annually
Note: This is also a Program Assessment Rating Tool measure

Annual Performance Plan for FY 2010 and Revised Final Annual Performance Plan for FY 200933
st
ra
te
gic
go
al
4
Strategic Goal 4:
Strategic Objective 4.2: Ensure privacy and security of personal information
Since the enactment of the Social Security Act in 1935, one of our priorities continues to be protecting the privacy of personally identifiable information in our records. We consider privacy protection so important it was the subject of our first regulation in 1936. The regulation details our privacy policy and the permissible
disclosures of personally identifiable information. It also reflects our commitment to maintaining the confidentiality and integrity of such information.
To continue safeguarding such information, we will improve our encryption practices for data moving outside our facilities and networks, train employees and contractors and hold them accountable for safeguarding personally identifiable information with which they work, and strictly control access to systems containing such information. We will also conduct rigorous annual security reviews of our systems and programs, and ensure our data-exchange activities adhere to the National Institute of Standards and Technology requirements. To further ensure privacy and security of personal information, we will:
Develop authentication solutions. • The public expects and deserves a secure environment when they conduct business with us online and on the telephone. To provide a secure environment, we must authenticate, with certainty, that we are conducting business with the person he or she claims to be. The public is already familiar with authentication because it is currently used in conducting day-to-day business online and on the telephone, e.g., paying bills, banking online, purchasing goods and services, etc. We are strengthening our current authentication methods to ensure they continue to meet Federal standards to protect personal information. To accomplish this, we will hold public focus groups, analyze authentication protocols used by private-sector businesses and other Government agencies, and improve the way we identify individuals online and over the telephone.
Comply with the Federal Information Security Management Act of 2002. • We report annually to the Office of Management and Budget and to Congress about our ability to safeguard information security programs and practices including personally identifiable information. We strive to maintain compliance with requirements as determined by the Federal Information Security Management Act. See Appendix B for more information about the Federal Information Security Management Act.
Inform the public. • Through notices in the Federal Register, we will continue to inform the public and invite their comments about our authority for collecting and using personal information, rules governing the maintenance of personal information, what possible disclosures might be made of the information, and how to access, amend, or correct information we have in our records.
Conduct Privacy Impact Assessments.• Before we develop or purchase information technology that collects, maintains, or shares personal information from or about members of the public, we will ensure the technology protects an individual’s personal information. We will publish assessments on www.socialsecurity.gov.

34
st
ra
te
gic
go
al
4
Annual Performance Plan for FY 2010 and Revised Final Annual Performance Plan for FY 2009
Strategic Goal 4:
Strategic Objective 4.3: Maintain accurate earnings records
Each year, we process and post 270 million reports of earnings to individuals’ records. We base Social Security benefit amounts on a worker’s lifetime earnings, so it is critical that we maintain accurate earnings records and credit the correct amount of earnings to the right individual. Posting earnings is highly resource-
intensive and complex, but vital to the administration of our programs. We make every effort to ensure employers and workers have the tools to report wages accurately and to correct any mistakes. Despite these efforts, since 1937, unreported name changes, employer errors, and misuse of Social Security Numbers have resulted in 275 million wage items (representing over $650 billion in earnings) that cannot be properly posted to individuals’ earnings records. We place these unposted wage items in the Earnings Suspense File. We are refining and using computer-matching processes to enable us to post greater numbers of Earnings Suspense File items to the correct individuals’ earnings records, thereby removing millions of wage items from the file. Other efforts we will take to ensure the accuracy of earnings records include:
Issue Annual• Social Security Statements. We will continue to issue the annual Social Security Statement, as required by law, so individuals can review their earnings record for accuracy and completeness. We mail the Statement to all workers age 25 and older who are not yet receiving Social Security benefits. The Social Security Statement arrives 2 to 3 months before an individual’s birthday. It provides estimates of the retirement, disability, and survivor benefits based on their Social Security tax contributions and helps individuals and their families plan for their financial future. More information is available at http://www.socialsecurity.gov/mystatement/. In February 2009, we began including an insert for workers aged 25-35 — What Young Workers Should Know about Social Security and Saving — that provides information about retirement planning and includes a chart that illustrates the benefits of saving. In FY 2009, we will issue approximately 151 million Social Security Statements. To maximize the usefulness of the Statement, we will conduct formal surveys and meet with the public to solicit their feedback on its design and content. We will then use the feedback to make necessary revisions and enhancements.
Increase electronic wage report filing. • We will continue to work toward eliminating paper wage reports while migrating to an electronic earnings record process. Annually, we receive over 44 million paper wage reports from approximately 5 million employers. Since paper wage reports are more error-prone, labor intensive, and expensive to process, we will continue to encourage employers to use Business Services Online to file Forms W-2 for their employees electronically. We will inform employers about electronic wage reporting through online information and resources, promotional materials, payroll conferences, articles in trade publications, and direct contact. Additionally, we will continue to work and collaborate with the Internal Revenue Service to improve all aspects of wage reporting.
Implement Earnings: • The Next Generation initiative. Our earnings system, last modernized in 1994, involves manual processes that make it error-prone and poorly suited for today’s Internet environment. We will redesign our system to transform our earnings processes from paper to electronic. Some benefits of this redesign include timely wage postings, more accurately posted earnings, and better Social Security Number verification, all of which will result in more accurate earnings records.

Annual Performance Plan for FY 2010 and Revised Final Annual Performance Plan for FY 200935
st
ra
te
gic
go
al
4
Strategic Goal 4:
Performance Measure — Strategic Objective 4.34.3a: Achieve the target percentage of paper Forms W-2 received
Fiscal Year 2009 2010
Target 17% 17%
Data definition: The percentage of paper Forms W-2 received. The percentage is derived by dividing the number of paper Forms W-2 received by the total number of Forms W-2 received.
Data source: Earnings Modernization Operational Data Store Management Information Reports
Frequency reported: Annually
Note: This is a new performance measure for FY 2009
Strategic Objective 4.4: Simplify and streamline how we do our work
To meet the challenges of our growing workloads and provide the best service possible, we will simplify and streamline our policies and procedures, as well as transform our business processes to an electronic environment. Our processes, policies, and regulatory and statutory requirements are often complicated and
difficult to administer and explain to the public. Moreover, years of legislation and litigation have increased our responsibilities and made our requirements even more complex. We will partner with Congress and stakeholders to identify ways to simplify our statutory and regulatory requirements. Initiatives to support these efforts include:
Develop legislative proposals through the • legis Team. This effort will ensure we identify every opportunity for policy improvement and provide Congress with substantive and viable proposals to consider. To support this effort, we have developed an agency-wide collaborative process to seek and shape legislative proposals that affect our programs. Our focus is two-fold: 1) enhancing the equity and adequacy of our programs; and 2) simplifying and streamlining policy. The Legis Team will develop these proposals with input from the Commissioner and all agency components.
Expand the use of the • Integrated Disability Process. The Integrated Disability Process is a multi-component initiative, chaired by agency executives, which will address and resolve important disability policy and procedural issues. This initiative will also help us address differences and difficulties in the application of disability policy and procedures at all decision-making levels. Through innovative collaboration, the Integrated Disability Process team is working to simplify, clarify, and streamline some of the most complex policy issues in our disability programs.

36
st
ra
te
gic
go
al
4
Annual Performance Plan for FY 2010 and Revised Final Annual Performance Plan for FY 2009
Strategic Goal 4:
Strategic Objective 4.5: Protect our programs from waste, fraud, and abuse
Our programs are a tempting target for fraud and abuse. We maintain a strong detection and prevention program to deter those contemplating fraudulent activities. We also collaborate with other federal agencies to investigate and prosecute fraud, expand forensic computer crime detection capabilities, and
strengthen fraud prevention by adding new checks and balances in our processes. We will continue our vigilance both externally and internally through the following activities:
Ensure the integrity of our Annual Financial Statement. • Each year, as mandated by the Chief Financial Officers Act of 1990, an external auditor examines our financial statements. We strive to obtain an unqualified audit opinion. An unqualified audit opinion attests to the fair presentation of our financial statements, and demonstrates the discipline and accountability essential to our responsibilities as stewards of Social Security funds. This opinion assures the public and Congress that: 1) our financial statements conform to generally accepted accounting principles; 2) we have appropriate processes in place to ensure reliable financial reporting; and 3) we are in compliance with laws and regulations, e.g., laws governing use of budgetary authority.
Expand our Cooperative Disability Investigation program. • We will continue to work collaboratively with our Office of the Inspector General, state Disability Determination Services, and state and local law enforcement to resolve allegations of fraud in our disability programs. Our Cooperative Disability Investigation program is one of our most successful anti-fraud initiatives and has contributed to more than $1 billion in program savings over the last 10 years. Expanding this program by increasing the number of Cooperative Disability Investigation units will further help us prevent payments to individuals who are not disabled, terminate payments to those who have not reported medical improvement or work activity, and stop payments to those who should have never received disability benefits.
Conduct • Onsite Security Control and Audit Reviews. We will continue to conduct ongoing Onsite Security Control and Audit Reviews to ensure our field offices, teleservice centers, processing centers, Disability Determination Services, and hearing offices follow established policies and procedures and that management controls are in place to deter and detect fraud, waste, and abuse. The reviews identify any major problems before they lead to material weaknesses. Office managers are required to submit a corrective action plan, which details how they will correct each deficiency cited during the review. We also follow-up with offices to ensure they have addressed each deficiency.

Annual Performance Plan for FY 2010 and Revised Final Annual Performance Plan for FY 200937
st
ra
te
gic
go
al
4
Strategic Goal 4:
Performance Measure — Strategic Objective 4.54.5a: Receive an unqualified audit opinion on SSA’s financial statements
Fiscal Year 2009 2010
Target Receive an unqualified opinion Receive an unqualified opinion
FYs 2005 – 2008 Historical Performance
Fiscal Year 2005 2006 2007 2008
Performance Received an unqualified opinion
Data definition: The receipt of an unqualified audit opinion from an independent auditor. An independent auditor gives an unqualified opinion when agency financial statements are determined to be fair, accurate, and conform to gen-erally accepted accounting principles.
Data source: The independent auditor report
Frequency reported: Annually
Strategic Objective 4.6: Use “green” solutions to improve our environment
We have a responsibility to the public to conduct business in an environmentally-friendly manner through energy and waste conservation. Even before Executive Order 13423 directed federal agencies to strengthen their environmental, energy, and transportation management, we have been recycling and
purchasing energy efficient lighting, electronics, and appliances. We will continue “going green.” Some examples include powering our vehicles with alternative fuels, purchasing computers with Energy Star ratings, and building and renovating our facilities using environmentally sustainable strategies. We will also implement an agency-wide Environment Management System in 2012 to ensure accountability for environmental management; establish performance measures; establish reporting mechanisms to collect, analyze, and report on annual progress; and achieve compliance with the Executive Order.

38
st
ra
te
gic
go
al
4
Annual Performance Plan for FY 2010 and Revised Final Annual Performance Plan for FY 2009
Strategic Goal 4:
Performance Measures — Strategic Objective 4.64.6a: Replace gasoline-powered vehicles with alternative-fuel vehicles
Fiscal Year 2009 2010
Target 20 50
Data definition: The number of gasoline-powered vehicles in our inventory replaced with alternative-fuel vehicles in the fiscal year.
Data source: Agency Fleet Vehicle Inventory
Frequency reported: Annually
Note: This is a new performance measure for FY 2009.
4.6b: Develop and implement an agency Environmental Management System
Fiscal Year 2009 2010
Target Develop a high-level project plan Provide training needed for implementation
Data definition: A high-level project plan is developed and implemented. Developing the plan includes establishing timeframes, establishing and assigning specific responsibilities, and training suitable staff to implement an organiza-tional Environmental Management System by 2012.
Data source: Office of Management and Budget Environmental Scorecard Workgroup
Frequency reported: Annually
Note: This is a new performance measure for FY 2009.

Annual Performance Plan for FY 2010 and Revised Final Annual Performance Plan for FY 200939
ap
pe
nd
ix a
Appendix A: Fiscal Year 2009 Major Evaluation
aP P e n d i x a: fi s Ca l ye a r 2009 ma j o r eVa luat i o n
We routinely evaluate our programs and performance by conducting a variety of studies and surveys. Some we complete on an ongoing basis, whereas others we conduct as needed. We report findings on these studies and surveys in our annual Performance and Accountability Report prepared at the end of the
fiscal year. Below we list our fiscal year (FY) 2009 evaluations according to the strategic goal they support in our FY 2008 – FY 2013 Agency Strategic Plan.
Strategic Goal 1 — Eliminate Our Hearings Backlog and Prevent Its Recurrence
Evaluation Description
Disability Appeals — Senior Attorney Advisor Quality Assessment
Assesses the accuracy of favorable hearing decisions made by non-Ad-ministrative Law Judge decision-makers (e.g., Senior Attorney Advisors)
Hearing Process Report Card Survey Surveys individuals’ perceptions of the entire hearing processes.
Strategic Goal 2 — Improve the Speed and Quality of Our Disability Process
Evaluation of Ticket to Work Program and Adequacy of Incentives
Evaluates the progress of the Ticket to Work Program as required under the Ticket to Work and Work Incentives Improvement Act of 1999.
Disability Initial Claims Report CardSurveys disability claimants’ perceptions of the initial disability applica-tion processes.
The Office of Quality Performance Denial Review
Assesses the accuracy of initial and reconsideration-level medical denials.
Strategic Goal 3 — Improve our Retiree and Other Core Services
Enumeration Quality ReviewAssesses the accuracy of original Social Security Numbers assigned dur-ing the fiscal year.
800 Number Service EvaluationEvaluates the SSA’s accuracy in the handling of individuals’ calls to the National 800 Number.
Field Office Telephone Service EvaluationEvaluates the SSA’s accuracy in the handling of individuals’ calls to field offices.
Overall Service Satisfaction Surveys
Telephone service satisfaction surveys evaluate callers’ satisfaction •with our National 800 Number and field office telephone services.
Office visitor surveys evaluate visitors’ satisfaction with our Social •Security field and hearing offices.
Internet Services Satisfaction SurveysSurveys individuals’ satisfaction with SSA’s online services, e.g., satisfac-tion with online applications for retirement or disability benefits using the recently redesigned online application process, iClaim.

40
ap
pe
nd
ix a
Annual Performance Plan for FY 2010 and Revised Final Annual Performance Plan for FY 2009
Appendix A: Fiscal Year 2009 Major Evaluation
Strategic Goal 4 — Preserve the Public’s Trust in Our Programs
Retirement, Survivors, and Disability Insur-ance Stewardship Review
Measures the accuracy of payments to individuals receiving Social Security retirement, survivors, or disability benefits.
Supplemental Security Income Stewardship Review
Measures the accuracy of payments to individuals receiving Supplemen-tal Security Income payments.
Pre-effectuation Review of Disability Deter-minations
Assesses the accuracy of disability initial and reconsideration allowances made by state Disability Determination Services as required in the Social Security Act.
Safeguard Procedures ReportsDetails the security measures SSA is taking to ensure the confidentiality of the Federal tax information provided to SSA by the Internal Revenue Service.
The Federal Information Security Manage-ment Act of 2002 Report to Congress
Reports to Congress whether SSA’s overall information technology security programs and practices comply with the Federal Information Security Management Act of 2002.
Annual Report of the Board of Trustees of the Federal Old-Age and Survivors Insur-ance and Federal Disability Insurance Trust Funds
Reports on the financial and actuarial status of the two Social Security trust funds — the Old-Age and Survivors Trust Fund and the Disability Trust Fund.
Annual Report of the Supplemental Security Income Program
Reports annually to the President and the Congress on the status of the Supplemental Security Income program and provides projections of program participation and costs through at least 25 years.

Annual Performance Plan for FY 2010 and Revised Final Annual Performance Plan for FY 200941
ap
pe
nd
ix b
Appendix B: Federal Information Security Management Act
aP P e n d i x b: fe d e r a l in f o r m at i o n se C u r i t y ma n ag e m e n t aC t
The goals of the eGovernment Act of 2002, Title III — Federal Information Security Management Act (FISMA) include development of a comprehensive framework to protect the Government’s information, operations, and assets. Providing adequate security for the Federal Government’s investment in information technology
is a significant undertaking. FISMA requires the heads of each agency to implement policies and procedures to reduce information technology security risks to an acceptable level.
Our Federal Information Security Management Act Statement
The implementation of FISMA at the Social Security Administration includes annual and ongoing security activities consisting of:
Security training and awareness;•
Assessing security controls;•
Ensuring compliance with Federal security policy and standards;•
Reporting security incidents;•
Correcting security weaknesses;•
Implementing Federal and agency security initiatives; and•
Continuous monitoring of security threats.•
These activities involve all agency components and are reported to the Office of Management and Budget. Meeting FISMA requirements provide a level of assurance that the Social Security Administration’s major information technology systems and the data contained therein, including personally identifiable information, are protected. A Congressional report card rates our computer security efforts as among the best in the Federal Government; our fiscal year 2008 grade was “A.”

42
ap
pe
nd
ix c
Annual Performance Plan for FY 2010 and Revised Final Annual Performance Plan for FY 2009
Appendix C: Performance Measure Changes From Fiscal Year 2008
aP P e n d i x C: Pe r f o r m a n C e me a s u r e Ch a n g e s fro m fi s Ca l ye a r 2008
New FY 2009 Government Performance and Results Act (GPRA) Performance Measures
Number Performance Measure
1.2d Achieve the target to eliminate the oldest Appeals Council cases pending
2.1aAchieve the target percentage of initial disability claims identified as a Quick Disability Determination or a Compassionate Allowance
2.2a Achieve the target percentage of initial disability claims filed online
2.3a Update the medical Listing of Impairments
3.1b Achieve the target percentage of retirement claims filed online
4.3a Achieve the target percentage of paper Forms W-2 received
4.6a Replace gasoline-powered vehicles with alternative-fuel vehicles
4.6b Develop and implement an agency Environmental Management System
FY 2009 Carryover GPRA Performance Measures with Title Changes
Number FY 2009 New Title FY 2008 Old Title
1.1a Process the budgeted number of hearingsAchieve the budgeted goal for SSA hearings processed (at or above the FY 2008 goal)
1.2aAchieve the target for number of hearings pending
Maintain the number of SSA hearings pending (at or below the FY 2008 goal)
1.2bAchieve the target to eliminate the oldest hearings pending
Achieve target percentage of hearing level cases pending 900 days or more
1.2eAchieve the target for average processing time of Appeals Council decisions
Achieve the budgeted goal for average processing time for requests for review (appeals of hearing decisions)
2.1bProcess the budgeted number of initial disability claims
Percent of initial disability claims receipts processed by the Disability Determination Services up to the budgeted level
3.3aAchieve the target speed in answering National 800-Number calls
Improve service to the public by optimizing the speed in answering 800-number calls

Annual Performance Plan for FY 2010 and Revised Final Annual Performance Plan for FY 200943
ap
pe
nd
ix c
Appendix C: Performance Measure Changes From Fiscal Year 2008
FY 2009 Carryover GPRA Performance Measures with Title Changes
Number FY 2009 New Title FY 2008 Old Title
3.3bAchieve the target busy rate for National 800-Number calls
Improve service to the public by optimizing the 800-number busy rate for calls offered to Agents
3.5aAchieve the target percentage for assigning origi-nal Social Security Numbers correctly
Percent of original Social Security Numbers issued that are free of critical error
4.1aProcess the budgeted number of Supplemental Security Income non-disability redeterminations
Process Supplemental Security Income (SSI) non-disability redeterminations to reduce improper payments
4.1bProcess the budgeted number of continuing dis-ability reviews
Number of periodic continuing disability reviews processed to determine continuing entitlement based on disability to help ensure payment accuracy
4.5aReceive an unqualified audit opinion on SSA’s financial statements
Receive an unqualified opinion on SSA’s financial statements from the auditors
FY 2009 Carryover GPRA/PART Performance Measures from FY 2008
Number Performance Measure
1.2c Achieve the budgeted goal for average processing time in days for hearings
2.1c Minimize average processing time in days for initial disability claims to provide timely decisions
3.1a Percent of Retirement and Survivors Insurance claims receipts processed up to the budgeted level
3.4aPercent of individuals who do business with SSA rating the overall service as “excellent,” “very good,” or “good”
4.1c Percent of Supplemental Security Income payments free of overpayment and underpayment error
4.1dPercentage of Old-Age, Survivors, and Disability Insurance payments free of overpayment and underpayment error

44
ap
pe
nd
ix c
Annual Performance Plan for FY 2010 and Revised Final Annual Performance Plan for FY 2009
Appendix C: Performance Measure Changes From Fiscal Year 2008
Deleted FY 2008 GPRA Performance Measures
Decrease the number of pending requests for review (appeals of hearing decisions) over 365 days
Number of quarters of work earned by Disability Insurance and Supplemental Security Income disabled beneficiaries during the calendar year
Percent of Social Security Number receipts processed up to the budgeted level
Enhance SSA’s recruitment program to support future workforce needs
Provide support to the Administration and Congress in developing legislative proposals and implementing reforms to achieve sustainable solvency for Social Security
PART-Only Performance Measures
Achieve target percentage of hearing level cases pending over 365 days
Achieve the budgeted goal for SSA hearings case production per workyear
Disability Determination Services net accuracy rate for combined initial disability allowances and denials
Disability Determination Services cases processed per workyear
Number of Disability Insurance and Supplemental Security Income beneficiaries, with tickets in use, who work
Percent of Supplemental Security Income aged claims processed by the time the first payment is due or within 14 days of the effective filing date
Issue an annual SSA-initiated Social Security Statement to eligible individuals age 25 and older
Average Agency productivity
Cumulative productivity improvement for Retirement and Survivors Insurance claims (compared to FY 2005)
Through changes in the law, achieve and maintain sustainable solvency such that today’s and tomorrow’s workers can expect to receive the benefits scheduled in law as reformed rather as determined by Trust Fund solvency, while continuing to protect those who depend on Social Security the most

Annual Performance Plan for FY 2010 and Revised Final Annual Performance Plan for FY 200945
ap
pe
nd
ix d
Appendix D: Summary of Program Assessment Rating Tool (PART) — Only Measures
aP P e n d i x d: su m m a ry o f Pro g r a m as s e s s m e n t rat i n g to o l (Part) — on ly me a s u r e s
The Office of Management and Budget (OMB) uses its Program Assessment Rating Tool (PART) as a diagnostic tool to assess the effectiveness of federal programs by identifying strengths and weaknesses to assist executives make informed budget and management decisions. OMB has selected three of our programs
for review under the PART process — Old--Age and Survivors Insurance, Disability Insurance, and Supplemental Security Income. PART assesses Government Performance and Results Act (GPRA) measures identified as GPRA/PART, as well as the PART-only measures described below. A complete list of all PART measures is on page 5.
Achieve target percentage of hearing level cases pending over 365 days
Fiscal Year 2009 2010
Target 50% 40%
FY 2006 – 2008 Historical Performance
Fiscal Year 2006 2007 2008
Performance 39% 37% 37%
Data definition: Measured from the date of request for hearing, this represents the number of cases that have been pending for more than 365 days as a percentage of the total number of cases pending at the hearing level. Included in the pending caseload would be remands as well as postentitlement actions. Remands are measured from the remand order date. A remand is an order by either the Appeals Council or a Federal Court returning a claim to a previous level decision maker for further action. Cases may be remanded for various reasons including: new evidence submitted with an appeal; a change in regulations, an error of law by the previous decision-maker; or an abuse of discretion.
Data source: the Case Processing and Management System and Disability Reporting Tools
Frequency reported: Monthly
Achieve the budgeted goal for SSA hearings case production per workyear
Fiscal Year 2009 2010
Target 107 109
FY 2006 – 2008 Historical Performance*
Fiscal Year 2006 2007 2008
Performance 100 101 103
*Performance numbers are rounded
Data definition: This indicator represents the average number of SSA hearings case production per workyear expended. A direct workyear represents actual time spent processing cases. It does not include time spent on training, Administra-tive Law Judge (ALJ) travel, leave, holidays, etc.

46
ap
pe
nd
ix d
Annual Performance Plan for FY 2010 and Revised Final Annual Performance Plan for FY 2009
Appendix D: Summary of Program Assessment Rating Tool (PART) — Only Measures
Data source: Office of Disability Adjudication and Review Monthly Activity Report, the Case Processing and Management System, Payroll Analysis Recap Report, Travel Formula (based on the assumption that ALJs spend an average of ten percent of their time in travel status), and Training Reports (Regional reports on new staff training, ongoing training, and special train-ing).
Frequency reported: Monthly
Disability Determination Services net accuracy rate for combined initial disability allowances and denials
Fiscal Year 2009 2010
Target 97% 97%
FY 2005 – 2008 Historical Performance
Fiscal Year 2005 2006 2007 2008
Performance 96% 96% 97% 96.6%
Data definition: Net accuracy is the percentage of correct initial state disability determinations and based on the net error rate (i.e., the number of corrected deficient cases with changed disability decisions), plus the number of deficient cases not corrected within 90 days from the end of the period covered by the report, divided by the number of cases reviewed.
Data source: Disability Quality Assurance Databases
Frequency reported: Monthly
Disability Determination Services case production per workyear
Fiscal Year 2009 2010
Target 265 268
FY 2005 – 2008 Historical Performance*
Fiscal Year 2005 2006 2007 2008
Performance 260 241 249 266
*Performance numbers for FYs 2005 – 2007 are rounded
Data definition: This indicator represents the average number of Disability Determination Services (DDS) case produc-tion per workyear expended for all work. A workyear represents both direct and indirect time, including overhead (time spent on training, travel, leave, holidays, etc.). It is inclusive of everyone on the DDS payroll, including doctors under contract to the DDS.
Data source: National Disability Determination Services System and Disability Operational Data Store
Frequency reported: Monthly
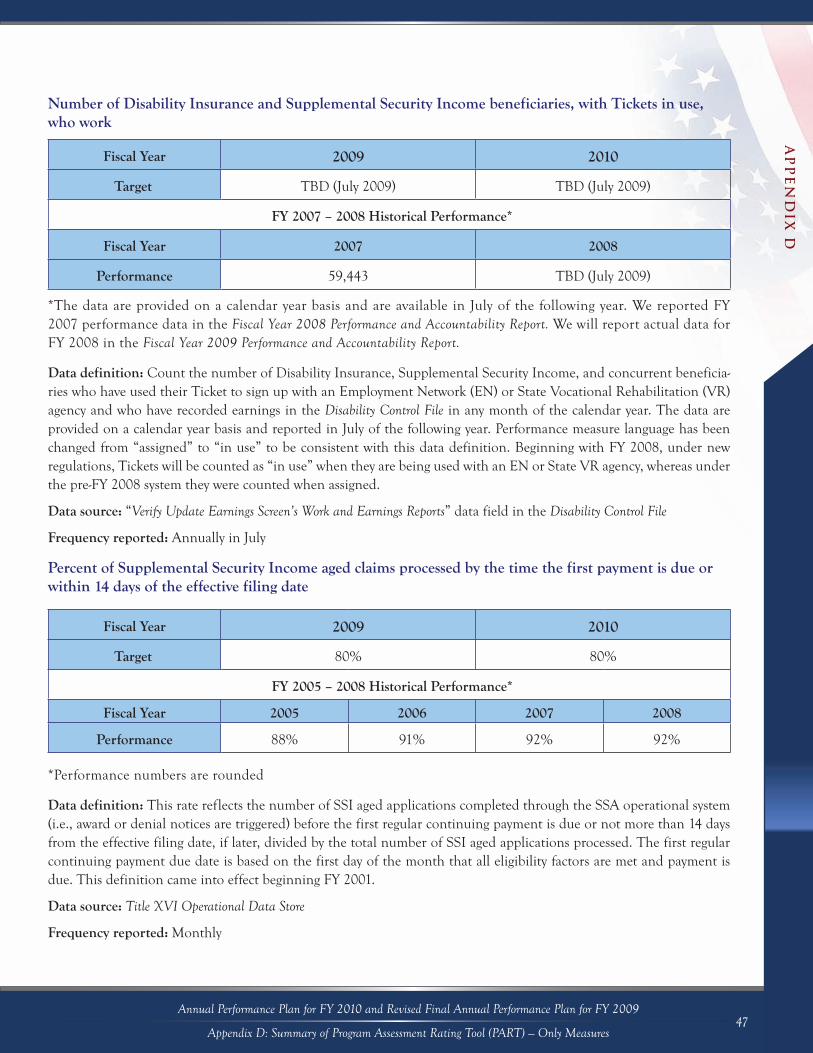
Annual Performance Plan for FY 2010 and Revised Final Annual Performance Plan for FY 200947
ap
pe
nd
ix d
Appendix D: Summary of Program Assessment Rating Tool (PART) — Only Measures
Number of Disability Insurance and Supplemental Security Income beneficiaries, with Tickets in use, who work
Fiscal Year 2009 2010
Target TBD (July 2009) TBD (July 2009)
FY 2007 – 2008 Historical Performance*
Fiscal Year 2007 2008
Performance 59,443 TBD (July 2009)
*The data are provided on a calendar year basis and are available in July of the following year. We reported FY 2007 performance data in the Fiscal Year 2008 Performance and Accountability Report. We will report actual data for FY 2008 in the Fiscal Year 2009 Performance and Accountability Report.
Data definition: Count the number of Disability Insurance, Supplemental Security Income, and concurrent beneficia-ries who have used their Ticket to sign up with an Employment Network (EN) or State Vocational Rehabilitation (VR) agency and who have recorded earnings in the Disability Control File in any month of the calendar year. The data are provided on a calendar year basis and reported in July of the following year. Performance measure language has been changed from “assigned” to “in use” to be consistent with this data definition. Beginning with FY 2008, under new regulations, Tickets will be counted as “in use” when they are being used with an EN or State VR agency, whereas under the pre-FY 2008 system they were counted when assigned.
Data source: “Verify Update Earnings Screen’s Work and Earnings Reports” data field in the Disability Control File
Frequency reported: Annually in July
Percent of Supplemental Security Income aged claims processed by the time the first payment is due or within 14 days of the effective filing date
Fiscal Year 2009 2010
Target 80% 80%
FY 2005 – 2008 Historical Performance*
Fiscal Year 2005 2006 2007 2008
Performance 88% 91% 92% 92%
*Performance numbers are rounded
Data definition: This rate reflects the number of SSI aged applications completed through the SSA operational system (i.e., award or denial notices are triggered) before the first regular continuing payment is due or not more than 14 days from the effective filing date, if later, divided by the total number of SSI aged applications processed. The first regular continuing payment due date is based on the first day of the month that all eligibility factors are met and payment is due. This definition came into effect beginning FY 2001.
Data source: Title XVI Operational Data Store
Frequency reported: Monthly

48
ap
pe
nd
ix d
Annual Performance Plan for FY 2010 and Revised Final Annual Performance Plan for FY 2009
Appendix D: Summary of Program Assessment Rating Tool (PART) — Only Measures
Issue an annual SSA-initiated Social Security Statement to eligible individuals age 25 and older
Fiscal Year 2009 2010
Target 100% 100%
FY 2005 – 2008 Historical Performance*
Fiscal Year 2005 2006 2007 2008
Performance 100% 100% 100% 100%
*Performance numbers for FYs 2005 – 2007 are rounded
Data definition: As required by law, SSA issues annual Social Security Statements to all eligible individuals (Social Security Number holders age 25 and older who are not yet in benefit status and for whom a mailing address can be determined). The Statement contains information about Social Security benefit programs, financing facts, and provides personal benefit estimates. The Statement provides individuals the opportunity to review their earnings history and verify their earnings record for accuracy and completeness.
Data source: Executive and Management Information System
Frequency reported: Monthly
Average Agency productivity
Fiscal Year 2009 2010
Target N/A* N/A*
FY 2006 – 2008 Historical Performance
Fiscal Year 2006 2007 2008
Performance 2.49% 1.89% 2.72%
*The agency has not established productivity targets for FYs 2009 – 2010
Data definition: The percent change in productivity is measured by comparing the total number of our and Disability Determination Services (DDS) workyears that would have been expended to process current year SSA level workloads at the prior year’s rates of production to the actual SSA and DDS workyear totals expended. The average annual productiv-ity is calculated using a five-year rolling average.
Data source: Agency Cost Accounting System
Frequency reported: Annually

Annual Performance Plan for FY 2010 and Revised Final Annual Performance Plan for FY 200949
ap
pe
nd
ix d
Appendix D: Summary of Program Assessment Rating Tool (PART) — Only Measures
Cumulative productivity improvement for Retirement and Survivors Insurance claims (compared to FY 2005)
Fiscal Year 2009 2010
Target 7% 7%
FY 2006 – 2008 Historical Performance
Fiscal Year 2006 2007 2008
Performance 1% 1.4% 11.2%
Data definition: Retirement and Survivors Insurance (RSI) claims are calculated at the agency level and the percent increase will be calculated using FY 2005 (571 claims processed per workyear) as the base. A 16 percent increase from this base means that the goal in FY 2013 is for us to process 662 claims per workyear. The RSI claims productivity per workyear number includes all retirement benefit claims, survivors benefit claims, and initial claims for Medicare.
Data source: SSA Workload Trend Report
Frequency reported: Quarterly
Through changes in the law, achieve and maintain sustainable solvency such that today’s and tomorrow’s workers can expect to receive the benefits scheduled in law as reformed rather than as determined by Trust Fund solvency, while continuing to protect those who depend on Social Security the most
Fiscal Year 2009 2010
Target Conduct analysis Conduct analysis
FY 2005 – 2008 Historical Performance
Fiscal Year 2005 2006 2007 2008
Performance Completed Completed Completed Completed
Data definition: Completed reports and analysis of present law provisions, as well as proposed and pending legislation and other proposals relating to solvency of the system.
Data source: Office of Policy records (consists primarily of various micro simulation models e.g., Modeling Income in the Near Term, Financial Eligibility Model, Social Security and Accounts Simulator, and surveys, e.g., Survey of Income and Program Participation, Health and Retirement Study).
Frequency reported: Monthly
Note: Meeting the targets is dependent on research funding, requests, and legislative proposals and changes.

50
this page is intentionally blanK


SOCIAL SECURITY ADMINISTRATIONSSA PUB. NO. 04-001MAY 2009