performance of a possible grid messaging...
TRANSCRIPT

Performance of a possible Grid Messaging Infrastructure Shrideep Pallickara1, Geoffrey Fox1, Xi Rao1, Ahmet Uyar1 and David Walker2
(spallick, gcf, xirao, auyar)@indiana.edu, Community Grids Laboratory, Indiana University1
[email protected], Department of Computer Science, Cardiff University, UK. 2
1 Introduction The Grid [1-4] has made dramatic progress recently with impressive technology and several large important applications initiated in high-energy physics [5,6], earth science [7,8] and other areas [9,10]. At the same time, there have been equally impressive advances in broadly deployed Internet technology. We can cite the dramatic growth in the use of XML, the “disruptive” impact of peer-to-peer (P2P) approaches [11] that have resulted in a slew of powerful applications, and the more orderly, but still widespread adoption, of a universal Web Service approach to Web based applications [12,13]. Grids are exemplified by the infrastructure used to allow seamless access to supercomputers or large scale integration of datasets. P2P technology facilitates sophisticated resource sharing environments between peers over the “edges” of the Internet, enabling ad hoc communities of low-end clients to advertise and access resources on communal computers. The deployments and utilization of Web services are driven by a slew of XML based specifications that pertain to exposing services, discovering them and accessing these securely once the requestor is authenticated and authorized. Grids, P2P Networks and Web Services consist of a sea of message based services. Services inject and extract messages whose transport and manipulation are supported by a logically distinct “MessageGrid” supplying the Grid Message layer. We can abstract such environments as a distributed system of “clients” or “end-points” which consist either of “users” or “resources” or proxies thereto. These clients must be linked together in a flexible fault tolerant efficient high performance fashion. The messaging infrastructure linking clients (both users and resources of course) would provide the messaging backbone. The smallest unit of this messaging infrastructure should be able to intelligently process and route messages while working with multiple underlying communication protocols. We refer to this unit as a broker, where we avoid the use of the term servers to distinguish it clearly from the application and system servers that would be among the sources/sinks to messages generated within the integrated system. For our purposes (registering, transporting and discovering information), we use the term events/messages interchangeably where events are just messages − typically with time stamps. We may enumerate the following requirements for the messaging infrastructure for Grid messaging − 1. Scaling: This is of paramount importance considering the number of devices, clients and services that would be
aggregated in the P2P grid. The distributed broker network should scale to support the increase in these aggregated entities. However the addition of brokers to aid the scaling should not degrade performance by increasing communication pathlengths or ineffective bandwidth utilizations between broker nodes within the system..
2. Efficient disseminations: The disseminations pertain to routing content, queries, invocations etc. to the relevant destinations in an efficient manner. The routing engine at each broker needs to ensure that the paths traversed within the broker network to reach destinations are along efficient paths that eschew failed broker nodes.
3. Robust delivery mechanisms: This is to ensure robust delivery of messages in, and despite, the presence of failures and prolonged disconnects.
4. Location independence: To eliminate bandwidth degradations and bottlenecks stemming from entities accessing a certain known broker over and over again to gain access to services, it must be ensured that any broker within the broker network is just as good as the other. Services and functionality would then be accessible from any point within the broker network.
5. Support for P2P interactions: P2P systems tend to be autonomic, obviating the need for dedicated management. P2P systems incorporate sophisticated search and subsequent discovery mechanisms. Support for P2P interactions facilitates access to information resources and services hosted by peers at the “edge” of the network.
6. Interoperate with other messaging clients: Enterprises have several systems that are built around messaging. These clients could be based on enterprise vendors such as IBM’s MQSeries or Microsoft’s MSMQ. Sometimes

these would be clients conforming to mature messaging specifications such as the Java Message Service (JMS) [14]. JMS clients, existing in disparate enterprise realms, can utilize the distributed broker network as a JMS provider to communicate with each other.
7. Communication through proxies and firewalls: It is inevitable that the realms we try to federate would be protected by firewalls stopping our elegant application channels dead in their tracks. The messaging infrastructure should thus be able to communicate across firewall, DHCP and NAT boundaries. Sometimes communications would also be through authenticating proxies.
8. Extensible transport framework: Here we consider the communication subsystem, which provides the messaging between the resources and services. Examining the growing power of optical networks we see the increasing universal bandwidth that in fact motivates the thin client and server based application model. However the real world also shows slow networks and links (such as dial-ups), leading to a high fraction of dropped packets. Thus the messaging infrastructure should manage the communication between external resources, services and clients to achieve the highest possible system performance and reliability. We suggest this problem is sufficiently hard that we only need solve this problem “once” i.e. that all communication – whether TCP/IP, UDP, RTP (A Transport Protocol for Real-Time Applications) [15], RMI, XML/SOAP or you-name-it be handled by a single messaging or event subsystem.
9. Security Infrastructure: Since it is entirely conceivable that messages (including queries, invocations and responses) would have to traverse over hops where the underlying communication mechanisms are not necessarily secure, a security infrastructure that relies on message level security needs to be in place. Furthermore, the infrastructure should incorporate an authentication and authorization scheme to ensure restricted access to certain services. The infrastructure must also ensure a secure and efficient distribution of keys to ensure access by authorized clients to content encapsulated in encrypted messages. The infrastructure will also handle Denial Of Service attacks (message flooding, replay) and compromised endpoints and brokers.
In this paper we discuss the NaradaBrokering messaging infrastructure which addresses several of the issues discussed above. The remainder of this paper is organized as follows. In section 2 we present an overview of NaradaBrokering. In section 3 we present results for NaradaBrokering’s transport interfaces. In section 4 and 5 we provide results for NaradaBrokering’s support for JMS and JXTA clients. In section 6 we present results from our experiments with routing audio/video conferencing applications. In section 7 we present results from the assortment of matching engines within NaradaBrokering that are used for computing destinations based on the content encapsulated by the event. We are currently in the process of gathering performance numbers over transatlantic links in collaboration with the University of Cardiff. The final version of this paper will include comprehensive results from these benchmarks. Furthermore, in the final version of the paper the JXTA results will be updated and the security overheads in NaradaBrokering will be qualified. 2 NaradaBrokering NaradaBrokering [16-26] is an event brokering system designed to run on a large network of cooperating broker nodes. Communication within NaradaBrokering is asynchronous and the system can be used to support different interactions by encapsulating them in specialized events. NaradaBrokering efficiently routes any given event between the originators and registered consumers of the event in question. Events could be used to encapsulate information pertaining to transactions, data interchange, system conditions and finally the search, discovery and subsequent sharing of resources. Events encapsulate expressive power at multiple levels. Where, when and how these events reveal their expressive power is what constitutes information flow. NaradaBrokering manages this information flow. NaradaBrokering places no constraints either on the number, size or rate of these interactions. Scaling, availability and fault tolerance requirements entail that the messaging infrastructure managing this information flow be based on a distributed network of cooperating nodes. Every event has an implicit or explicit destination list, comprising clients, associated with it. The brokering system as a whole is responsible for computing broker destinations (targets) and ensuring efficient delivery to these targeted brokers en route to the intended client(s). Events as they pass through the broker network are be updated to snapshot its dissemination within the network. The event dissemination traces eliminate continuous echoing and in tandem with the BNM – used for computing shortest paths – at each broker, is used to deploy a near optimal routing

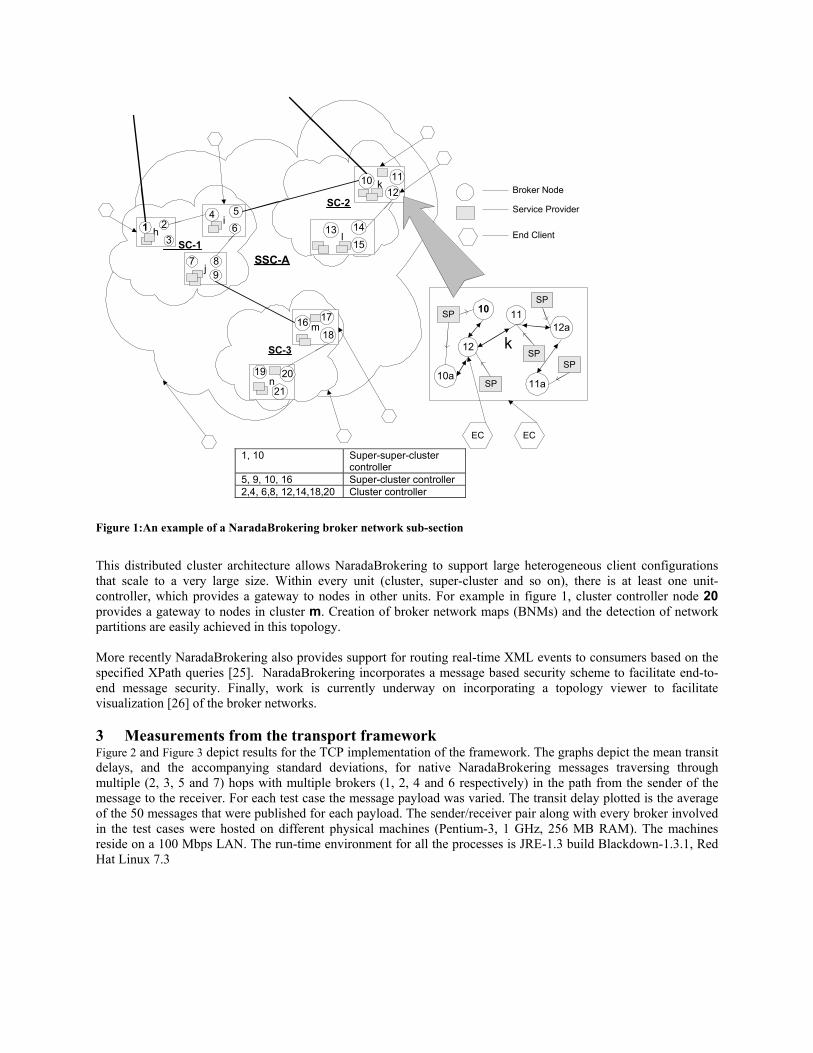
solution. The routing is near optimal since for every event the associated targeted set of brokers are usually the only ones involved in disseminations. Furthermore, every broker, either targeted or en route to one, computes the shortest path to reach target destinations while employing only those links and brokers that have not failed In NaradaBrokering, stable storages existing in parts of the system are responsible for introducing state into the events. The arrival of events at clients advances the state associated with the corresponding clients. Brokers do not keep track of this state and are responsible for ensuring the most efficient routing. Since the brokers are stateless, they can fail and remain failed forever. The guaranteed delivery scheme within NaradaBrokering does not require every broker to have access to a stable store or DBMS. The replication scheme is flexible and easily extensible. Stable storages can be added/removed and the replication scheme can be updated. Stable stores can fail but they do need to recover within a finite amount of time. During these failures the clients that are affected are those that were being serviced by the failed storage. Currently in NaradaBrokering we have both SQL and file based implementations of the storage services needed by the robust delivery algorithms. NaradaBrokering incorporates an extensible transport framework [19] and virtualizes the channels over which entities interact with each other. Entities are thus free to communicate across firewalls, proxies and NAT boundaries which can prevent interactions from taking place. Furthermore, NaradaBrokering provides support for multiple transport protocols such as TCP (blocking and non-blocking), UDP, SSL, HTTP and RTP. NaradaBrokering incorporates a monitoring service [20] at individual broker nodes which monitor the state of the links originating from a node. The performance metric measured include loss rates, communication delays and jitters among others. NaradaBrokering is JMS compliant [21] and also provides support for routing JXTA interactions [22]. Work is currently underway to provide support for routing Gnutella interactions. NaradaBrokering has also been used to support audio-video conferencing [23] applications. To address the issues [24] of scaling, load balancing and failure resiliency, NaradaBrokering is implemented on a network of cooperating brokers. In NaradaBrokering we impose a hierarchical structure on the broker network, where a broker is part of a cluster that is part of a super-cluster, which in turn is part of a super-super-cluster and so on. Figure 1 depicts a sub-system comprising of a super-super-cluster SSC-A with 3 super-clusters SC-1, SC-2 and SC-3 each of which have clusters that in turn are comprised of broker nodes. Clusters comprise strongly connected brokers with multiple links to brokers in other clusters, ensuring alternate communication routes during failures. This organization scheme results in “small world networks” where the average communication pathlengths between brokers increase logarithmically with geometric increases in network size, as opposed to exponential increases in uncontrolled settings.
SSC-A SC-1
SC-2
SC-3
l13 14
15
n20
21
i4 56
j7 8
9
m16 17
18
k10 1112
h1 23
19
k
10 11
12
SP
SPSP
SPSP
11a10a
12a
EC EC
1, 10 Super-super-cluster controller
5, 9, 10, 16 Super-cluster controller 2,4, 6,8, 12,14,18,20 Cluster controller
Broker Node
Service Provider
End Client
Figure 1:An example of a NaradaBrokering broker network sub-section
This distributed cluster architecture allows NaradaBrokering to support large heterogeneous client configurations that scale to a very large size. Within every unit (cluster, super-cluster and so on), there is at least one unit-controller, which provides a gateway to nodes in other units. For example in figure 1, cluster controller node 20 provides a gateway to nodes in cluster m. Creation of broker network maps (BNMs) and the detection of network partitions are easily achieved in this topology. More recently NaradaBrokering also provides support for routing real-time XML events to consumers based on the specified XPath queries [25]. NaradaBrokering incorporates a message based security scheme to facilitate end-to-end message security. Finally, work is currently underway on incorporating a topology viewer to facilitate visualization [26] of the broker networks. 3 Measurements from the transport framework Figure 2 and Figure 3 depict results for the TCP implementation of the framework. The graphs depict the mean transit delays, and the accompanying standard deviations, for native NaradaBrokering messages traversing through multiple (2, 3, 5 and 7) hops with multiple brokers (1, 2, 4 and 6 respectively) in the path from the sender of the message to the receiver. For each test case the message payload was varied. The transit delay plotted is the average of the 50 messages that were published for each payload. The sender/receiver pair along with every broker involved in the test cases were hosted on different physical machines (Pentium-3, 1 GHz, 256 MB RAM). The machines reside on a 100 Mbps LAN. The run-time environment for all the processes is JRE-1.3 build Blackdown-1.3.1, Red Hat Linux 7.3

Figure 2: Transit Delay for message samples Figure 3: Standard Deviation for message samples
The average delay per inter-node (broker-broker, broker-client) hop was around 500-700 microseconds. The standard deviation varies from 0 microseconds for 50 byte messages traversing a hop to 800 microseconds over 7 hops. In one of our preliminary experiments involving machines at the University of Cardiff (UC) and Indiana University (IU), we had a broker process running at IU and 2 client processes running at IU. The run-time environment for all the processes is JRE-1.4.1. The transit delay plotted is the average of the 50 messages that were published for each payload. Figure 4 and Figure 5 depict the transit delay and standard deviation for the message samples respectively.
Figure 4: Transit delay for message samples
Figure 5: Standard Deviation for message samples
4 JMS Performance Data To gather performance data, we run an instance of the SonicMQ (version 3.0) [42] broker and NaradaBrokering broker on the same dual CPU (Pentium-3, 1 GHz, 256MB) machine. We then setup 100 subscribers over 10 different JMS TopicConnections on another dual CPU (Pentium-3, 866MHz, 256MB) machine. There is also a measuring subscriber and a publisher that are set up on a third dual CPU (Pentium 3, 866MHz, 256MB RAM) machine. The three machines (residing on a 100 Mbps network) have Linux (version 2.2.16) as their operating system. The runtime environment for all the processes is Java 2 JRE ( Blackdown-FCS).
0.60.8
11.21.41.61.8
22.22.42.6
100 200 300 400 500 600 700 800 900 1000
Stan
dard
Dev
iatio
n (M
illise
cond
s)
Content Payload Size in Bytes
Standard deviation for Content Payloads.Broker at Cardiff, Clients at Indiana
Standard Deviation
111.5
112
112.5
113
113.5
114
114.5
100 200 300 400 500 600 700 800 900 1000
Mea
n tra
nsit
dela
y (M
illise
cond
s)
Content Payload Size in Bytes
Transit delays for Content Payloads.Broker at Cardiff, Clients at Indiana
Delay
0123456789
100 1000
Tran
sit D
elay
(M
illis
econ
ds)
Message Payload Size (Bytes)
Mean transit delay for message samples in NaradaBrokering: Different communication hops
hop-2 hop-3 hop-5 hop-7
00.10.20.30.40.50.60.70.8
100 1000Sta
ndar
d D
evia
tion
(Mill
isec
onds
)
Message Payload Size (Bytes)
Standard deviation for message samples in NaradaBrokering: Different communication hops
hop-2 hop-3 hop-5 hop-7

Transit Delays for Message Samples in NaradaBrokering & SonicMQ NaradaBr
SonicMQ
0 50 100150200250300350400450Publish Rate (Messages/sec) 50100150200250300350400450500550
Payload Size (Bytes)
05
1015202530
Mean Transit Delay (MilliSeconds)
Figure 6: Transit Delays for messages
Standard Deviation in the Message Samples NaradaBrokering and SonicMQ NaradaBr
SonicMQ
0 50 100150200250300350400450Publish Rate (Messages/sec) 50100150200250300350400450500550
Payload Size (Bytes)
02468
101214
Standard Deviation
(MilliSeconds)
Figure 7: Standard Deviation for messages
The topic, which the subscribers subscribe to and the publisher publishes to, is the same. We vary the rates at which the publisher publishes messages while varying the payload sizes associated with these messages. We compute the transit delays associated with individual messages and also the standard deviation in the delays (used to compute the mean transit delay) associated with messages in a given test case. Figure 6 depicts the mean transit delays for the measuring subscriber under NaradaBrokering and SonicMQ for high publish rates and smaller payload sizes. Figure 7 depicts the standard deviation associated with message samples under the same conditions. As can be seen NaradaBrokering compares very well with SonicMQ. Also, the standard deviation associated with message samples in NaradaBrokering were for the most part lower than in SonicMQ. 5 JXTA Performance numbers For comparing JXTA performance in NaradaBrokering we setup the topologies depicted in Figure 8. For each
topology we then compare the performance of the pure JXTA environment, the integrated Narada-JXTA system and the pure NaradaBrokering system. To compute communication delays while obviating the need for clock synchronizations and the need to account for clock drifts, the receiver/sender pair is setup on the same machine (Pentium-3, 1 GHz, 256 MB RAM). In all the test cases, a message published by the sender is received at the receiver and the delay is computed. For a given message payload this is done for a sample of messages and we compute the mean delay and the standard deviation associated with the samples. We also measure the Jitter J, which is defined as the mean deviation (smoothed absolute value) of the difference D in packet spacing at the receiver compared to the sender for a pair of packets. The Jitter J is computed based on the formula explained in RTP RFC [15] − J = J + (|D(i-1, i)| - J)/16, where D(i-1, i) corresponds to the difference between the delay for ith packet and the delay for the
(i-1)th packet. The formula ensures that values from the past and present play a role in the jitter calculation. Of course if the Jitter or D is very high they would predominate in the calculation of the accumulated jitter. The gain parameter, 1/16, gives a good noise reduction ratio while maintaining a reasonable rate of convergence. This is repeated for different payload sizes. For every topology every node (broker or rendezvous peer) involved in the experimental setup is hosted on a different machine (Pentium-3, 1 GHz, 256MB RAM). The run-time environment for all the processes is (JDK-1.3 build Blackdown-1.3.1, Red Hat Linux 7.3). The machines involved in the experimental setup reside on a 100 Mbps LAN.
R R
R
R
R R
R
R
(a)
R R
R
R
R R
R
R
N
(b)
N N
N
N
N N
N
N
(c)
R
N NaradaBrokering broker
JXTA Rendezvous
JXTA Peer
NaradaBrokering client
Figure 8: JXTA Test Topology

Figures 9 through 12 depict the mean transit delay for the message samples. We also performed this experiment involving machines at Indiana University (IU), University of Texas (UT) and Florida State University (FSU). The sender/receiver pair was hosted on a machine (Pentium-3, 550MHz, 512MB RAM) at FSU. For each topology half the nodes resided on machines (Pentium-3, 1 GHz, 256MB RAM) at UT and the other half resided on machines (Pentium-3, 1 GHz, 256MB RAM) at IU. Figure 12 depicts the mean transit delay for the topology involving machines at IU,UT and FSU. Results depicted in figures 9 through 12 indicate the superior performance of the native NaradaBrokering system over the pure JXTA system. These results also demonstrate that the integrated Narada-JXTA system provides substantial performance improvements over the pure JXTA system.
0
50
100
150
200
250
50 100 150 200 250 300 350 400 450 500
Tran
sit D
elay
(M
illise
cond
s)
Message Payload Size (Bytes)
NaradaBrPure JXTA
Narada-JXTA
Figure 9: Mean transit delay for message samples in Topology (smaller payloads)
0
50
100
150
200
250
500 1000 1500 2000 2500 3000 3500 4000 4500 500
Tran
sit D
elay
(M
illise
cond
s)
Message Payload Size (Bytes)
NaradaBrPure JXTA
Narada-JXTA
Figure 10: Mean transit delay for message samples in Topology (bigger payloads)
0
10
20
30
40
50
60
70
0 100 200 300 400 500 600 700 800 900
Jitte
r (M
illis
econ
ds)
Packet Number
NaradaBrPure JXTA
Narada-JXTA
Figure 11: Jitter values for message samples in Topology-II
50
100
150
200
250
300
350
400
450
50 100 150 200 250 300 350 400 450 500
Tran
sit D
elay
(M
illis
econ
ds)
Message Payload Size (Bytes)
NaradaBrPure JXTA
Narada-JXTA
Figure 12: Mean transit delay for message samples in Topology-II (external machines)
6 Performance measurements for A/V conferencing
Since NaradaBrokering is a Java-based messaging system, we contrast the performance of the NaradaBrokering broker with a conferencing server written in Java using JMF [27] libraries. This server creates an audio or video session and delivers the audio or video streams it receives to all participants except the sender itself.
In our measurements we create 1 audio or 1 video conference at a time. In each case, we test the results for different number of participants. One participant sends an audio or video stream to the server, and the server delivers

it to all the other participants. In each test we have send 2000 audio or video packages. To compute transit delays for each delivered package, we assign a package-id to every package and track the send/receive times for each package. For NaradaBrokering we used the RTP sequence number as package id, but for JMF we could not use this since JMF conferencing server modifies the sequence number and timestamp. We instead compute a unique package-id from the audio/video data that is sent out.
Although we have hundreds of audio/video receiver clients in a conference, we gathered results only from 12 video and 30 audio clients. These clients and the sender client ran in the same machine and rest of the receiver clients ran in another machine. This way we avoid the clock synchronization/drift issues that arise when we incorporate results from receivers running on different machines. On the other hand, having all receivers running on the same machine as the sender, would introduce application overhead that would cloud the metrics we wish to measure. Having only 12 video or 30 audio receivers ensures that the overhead alluded to earlier are minimum. In addition, to make sure that the results which we gather reflect the true performance of the server, we gather video results from first 4, middle 4 and the last 4 clients that were added to the conference. In the audio case results are retrieved from the first 10, middle 10 and last 10 clients. Finally, when we performed one of our benchmarks on 4 machines by hosting one-half of the non-measuring receivers on the fourth machine, the results were similar to the ones we report in this paper. 6.1 Video test We have created a video conference on the server machine – 1.2GHz Intel Pentium III dual CPU, 1GB MEM, RedHat Linux 7.3. One of the participants sends a H.263 video stream to the server, which delivers it to all the other participants in the session. The sender client and the 12 receiver clients, from whom we gather results, were running on a 2.4GHz Intel Pentium 4 CPU, 512GB MEM, RedHat Linux 7.3. The video stream had an average bandwidth of more than 600 kbps. We calculated the transit delay and jitter values for each video package. The sender application sends 2000 packages in each test. We used the same video stream for each test. The 3 machines involved in this test reside on a gigabit subnet. For every package we calculated the transit delay, (receivedTime – sentTime), for all 12 clients. We then get the average of these 12 delay values for that package in milliseconds. We also calculate jitter for each package. We then get the average jitter for the 12 clients.
Table 1 summarizes the video tests which were conducted. It shows the average transit delays and average jitter values for the NaradaBrokering broker and JMF conferencing server. It also shows the total bandwidth used to transfer the test video stream to participants involved in the tests. The tests clearly demonstrate that the NaradaBrokering broker out performs the JMF conferencing server in every aspect, and is capable of delivering a video stream to 100-400 participants with acceptable jitter.
Number of
clients NaradaBrokering Avg Delay (ms)
JMF Avg Delay (ms)
NaradaBrokering Avg Jitter
JMF Avg Jitter
Total bandwidth (Mbps)
50 2.23 3.08 0.95 1.10 30
100 7.20 10.72 2.57 3.34 60
200 20.38 27.69 6.18 7.56 120
300 42.61 60.86 9.93 11.84 180
400 80.76 229.2 13.38 15.55 240
Table 1. Video streaming performance results
It should be noted that the bandwidth requirement of our test video stream is quite high and several real-time videoconferencing result in streams, whose bandwidth utilizations, fall in the 100-200kbps range. A single NaradaBrokering broker can thus deliver up to 1200 such real-time video clients. It should be noted that the natural setting for NaradaBrokering is a distributed broker network, thus one can use NaradaBrokering to build A/V controllers with essentially unlimited number of clients interacting in real time.
Figure 13 and Figure 14 depict the average transit delays and jitter values, of the 12 measuring clients for 1950 packages, respectively. We ignore the first 50 packages, where delays correspond to application start ups. From the

graphs it is clear that NaradaBrokering delivers significantly better performance and is stable over time. The transit delay values are all in the acceptable range for video.
0
50
100
150
200
250
300
350
400
450
0 200 400 600 800 1000 1200 1400 1600 1800 2000
Del
ay (M
illis
econ
ds)
Packet Number
Average delays/packet for 12 (of the 400 total) video-clients. NaradaBrokering Avg=80.76 ms, JMF Avg=229.23 ms
NaradaBrokering-RTP JMF-RTP
Figure 13. Delays for 400 video clients
0
5
10
15
20
25
0 200 400 600 800 1000 1200 1400 1600 1800 2000
Jitte
r (M
illis
econ
ds)
Packet Number
Average jitter/packet for 12 (of the 400 total) video clients. NaradaBrokering Avg=13.38 ms, JMF Avg=15.55 ms
NaradaBrokering-RTP JMF-RTP
Figure 14. Jitter for 400 video clients
In the JMF conference server the first client that joins the session consistently gets the best performance with decreasing performance until the last client gets the worst performance. In the NaradaBrokering broker, we provide equal performance to all clients by rotating the delivery privilege among receivers for alternate packages. As a result, over time, all NaradaBrokering clients get equal performance. 6.2 Audio Test We have created an audio conference on the server machine, 1.2GHz Intel Pentium III dual CPU, 1GB MEM, RedHat linux 7.3. One participant sent a ULAW audio stream to the server, which delivers it to all participants in the session. The sender client and 30 receiver clients, from whom we gather results, were running on 2.2GHz Intel Xeon dual CPU, 1GB MEM, RedHat Linux 7.3. The audio stream has the bandwidth of 64kbps. Every 60ms, a 480 bytes audio package is sent. We calculate the latency and jitter values for each audio package. The sender client sends 2000 packages in each test. The three machines used in this test reside on a 100Mbps subnet.
Number of clients NaradaBrokering
Avg Delay (ms)
JMF Avg Delay (ms)
NaradaBrokering Avg Jitter
JMF Avg Jitter
Total bandwidth (Mbps)
100 2.89 2.77 0.56 0.61 6.4
500 12.02 11.80 0.59 0.56 32
1000 23.44 23.01 0.79 0.47 64
Table 2: Audio streaming performance results Table 2 shows that the NaradaBrokering broker is capable of sending an audio stream to 1000 clients by providing a very good quality. The 23 ms delay introduced by the broker is well with the real-time constraints imposed on audio communications. Since we run this test in a 100 Mbps network, when we increase the number of clients we hit the network bottleneck. We are therefore providing results only for up to 1000 clients. 7 Profiling the Matching Engines The matching engine is responsible for computing destinations associated with an event based on the profiles available at a node. Depending on the type of applications, standards, events and subscriptions that need to be supported there would be multiple matching engines residing within every processing broker node. We now provide some results pertaining to the matching engines residing in brokers within NaradaBrokering. These results (Figures

7 through 12) are for stand-alone processes, where we computed the matching times as a function of the number of subscriptions maintained. The results reported provide the matching time per event. There are optimization in place which would allow us to reduce the number of matching operations needed to compute destinations throughout the broker network. This optimization exploits the broker and profile organization schemes. In each case, an event is matched to retrieve every matching subscription. For every matching engine, the number of subscriptions is varied from 10,000 to 100,000. The results were measured on a machine (1GHz,256MB RAM) running the process in a Java-1.4 Sun VM with a high-resolution timer for computing delays.

Figure 15: Plots for Integer matching
Figure 16: Plots for String based matching
Figure 17: Plots for <tag,value> based matching
Figure 18: Plots for SQL and XPath based matching
Figure 19: Matching XPath profiles
<?xml version="1.0" encoding="ISO-8859-1"?><menu> <softdrinks> <brand>Minute Maid</brand> <fruit>Apple</fruit> <source>Brazil</source> <company>Coca Cola</company> <price>2.90</price> <year>2003</year> </softdrinks></menu>
XPath Query type: /menu/softdrinks[price>1.80]
Figure 20: The XML event and XPath query type
The richer the constraints, the greater the CPU-cost associated with the matching process. As can be seen the average delays for matching increases progressively (Integer to String to Tag-Value to SQL to XPath in that order) as the complexity of the matching increases. For String based matching, as depicted in Figure 16, the average delay for matching subscriptions generally increases as the size of the topic String increases. The increase in delays for matching as the topic String size doubled from 16 to 32 was in the range of 1 microsecond. Figure 17 depicts the costs associated with <tag,value> based matching. As can be seen the costs associated with this style of matching is higher than the String based style. We also noted that the costs did not vary as the number of <tag,value> pairs
100
1000
10000
1 2 3 4 5 6 7 8 9 10
Del
ay (
Mill
isec
onds
)
Number of stored profiles (in thousands) being matche
Timing results for matching an XML-event to stored Profiles with & without optimizations
Without Optimizations With Optimizations
0
10
20
30
40
50
60
70
20 30 40 50 60 70 80 90 100
Del
ay (
Sec
onds
)
Number of subscriptions (in thousands) being matched
Average delay to match event to Xpath and SQL-based subscriptions
SQL Delay XPath Delay
0
5
10
15
20
25
20 30 40 50 60 70 80 90 100
Del
ay (
Mic
rose
cond
s)
Number of subscriptions (in thousands) being matched
Average delay to match event with <tag,value> Matching for subscriptions with multiple <tag,value> pairs
Pairs=5 Pairs=10 Pairs=25
0
2
4
6
8
10
20 30 40 50 60 70 80 90 100
Del
ay (
Mic
rose
cond
s)
Number of subscriptions (in thousands) being matched
Average delay to match event with String-based Matchingfor subscriptions with different sizes
String size=16String size=24String size=32
0
2
4
6
8
10
20 30 40 50 60 70 80 90 100
Del
ay (
Mic
rose
cond
s)
Number of subscriptions (in thousands) being matched
Average delay to match event to subscriptions with Integer-based Matching
Delay

associated with individual subscriptions increased from 5 to 25. The results in Figures x-y demonstrate that it is feasible to have real time interactions that are based on the corresponding constraints. Figure 18 contrasts the costs involved in matching JMS events to stored SQL-92 based selectors on the properties contained within the JMS message and XML events to stored XPath conforming constraints. Of course these costs can vary significantly depending on the type of the query. For our experiments we used XPath and SQL queries, which we felt were comparable. The cost of a single matching operation involving an XML event and an accompanying XPath query is around 3 milliseconds. Next, we proceeded to study the effects of the destination optimization strategies, which we discussed in section 7,in the context of XPath profiles. We first perform the matching (un-optimized) on a set of XPath profiles. The XPath profiles in this case are then evenly distributed over 32 different destinations. Figure 19 contrasts the matching times in the profile matching with/without optimizations for varying number of profiles. With optimizations the matching times varied between 120-170 milliseconds. The results demonstrate that in the scenario outlined earlier, the optimizations improve the performance of matching profiles substantially. In general, in most practical situations it is our conjecture that the performance would be similarly enhanced. Figure 20 outlines the XML type for the stored events, and the type of XPath query used in our experiments. Though the results depicted here are for XPath profiles we expect optimizations to have a similar effect on SQL based profiles too. 7.1 Implications of query based matching engines The Query-based engines are suitable for discovery based services. While providing support for profiles with SQL-like query based refinements and XPath query based profiles, the system can be viewed as a lightweight, distributed relational and XML database respectively. This is the case, since as far as the end-user is concerned, the matched event might as well have been stored in a database (relational or XML, as the case might be) and the results returned (matching events) would not have been different. Clients in the system can advertise their services in an XML schema or a schema that can be queried by an SQL query. These advertisements would be stored in the same way that the profiles are stored within the system. Events propagated by interested clients would essentially be either XPath or SQL-like queries. These events would then be matched against the stored advertisements with the matching ones being routed back to the initiating client. The query events can specify the realms within which the query’s propagation might take place, thus allowing individual entities to control how localized their services can be. Figure 21 depicts the matching times for a query against a set of stored XML events/advertisements. For matching XML advertisements, the performance would vary if it is constrained by the number of matched advertisements or stored XML events that need to be included in the query response. The stored XML events and the issued XPath query are of the type depicted in Figure 20. For most discovery related operations, similar to those initiated in P2P systems, these numbers indicate adequate performance. We have some optimizations in place which can reduce the matching time needed for SQL and XPath based profiles. These can be found in Ref [25]. 8 Conclusions and Future Work In this paper we reported results from our experiments with some of the capabilities in NaradaBrokering. The final version of this paper will also include results from our security and robust delivery implementations and also results from our ongoing experiments being performed between the Indiana University and Cardiff University.
0
2000
4000
6000
8000
10000
12000
1 2 3 4 5 6 7 8 9 10
Del
ay (
Mill
isec
onds
)
Number of stored XML-events (in thousands)being matched
Timing results for matching an XPath query to stored XML events
Matching Time
Figure 21: Matching an XPath query to stored XML events

9 References [1] The Grid Forum http://www.gridforum.org [2] GridForum Grid Computing Environment working group(http://www.computingportals.org) and survey of
existing grid portal projects. http://www.computingportals.org/ [3] “The Grid: Blueprint for a New Computing Infrastructure”, Ian Foster and Carl Kesselman (Eds.), Morgan-
Kaufman, 1998. See especially D. Gannon, and A. Grimshaw, “Object-Based Approaches”, pp. 205-236, of this book.
[4] Globus Grid Project http://www.globus.org [5] GriPhyN Particle Physics Grid Project Site, http://www.griphyn.org/ [6] International Virtual Data Grid Laboratory at http://www.ivdgl.org/ [7] NEES Earthquake Engineering Grid, http://www.neesgrid.org/ [8] SCEC Earthquake Science Grid, http://www.scec.org [9] W. Johnston, D. Gannon, B. Nitzberg, A. Woo, B. Thigpen, L. Tanner, “Computing and Data Grids for Science
and Engineering,” Proceedings of Super Computing 2000. [10] DoE Fusion Grid at http://www.fusiongrid.org [11] Oram, A. (eds) 2001. Peer-To-Peer: Harnessing the Power of Disruptive Technologies. O’Reilly, CA 95472. [12] Web Services Description Language (WSDL) 1.1 http://www.w3c.org/TR/wsdl [13] Definition of Web Services and Components
http://www.stencilgroup.com/ideas_scope_200106wsdefined.html#whatare [14] Mark Happner, Rich Burridge and Rahul Sharma. Sun Microsystems. Java Message Service Specification.
2000. http://java.sun.com/products/jms [15] RTP: A Transport Protocol for Real-Time Applications (IETF RFC 1889) http://www.ietf.org/rfc/rfc1889.txt. [16] The NaradaBrokering Project at the Community Grids Lab: http://www.naradabrokering.org [17] Shrideep Pallickara and Geoffrey Fox. NaradaBrokering: A Middleware Framework and Architecture for
Enabling Durable Peer-to-Peer Grids. Proceedings of ACM/IFIP/USENIX International Middleware Conference Middleware-2003.
[18] Geoffrey Fox and Shrideep Pallickara. An Event Service to Support Grid Computational Environments Journal of Concurrency and Computation: Practice & Experience. Special Issue on Grid Computing Environments. Volume 14(13-15) pp 1097-1129.
[19] Shrideep Pallickara, Geoffrey Fox, John Yin, Gurhan Gunduz, Hongbin Liu, Ahmet Uyar, Mustafa Varank. A Transport Framework for Distributed Brokering Systems. Proceedings of the International Conference on Parallel and Distributed Processing Techniques and Applications. (PDPTA'03).
[20] Gurhan Gunduz, Shrideep Pallickara and Geoffrey Fox. A Framework for Aggregating Network Performance in Distributed Brokering Systems. Proceedings of the 9th International Conference on Computer, Communication and Control Technologies.
[21] Geoffrey Fox and Shrideep Pallickara. JMS Compliance in the Narada Event Brokering System. Proceedings of the 2002 International Conference on Internet Computing (IC-02). Volume 2 pp 391-397.
[22] Geoffrey Fox, Shrideep Pallickara and Xi Rao. A Scaleable Event Infrastructure for Peer to Peer Grids. Proceedings of the ACM Java Grande ISCOPE Conference 2002. pp 66-75. Seattle, WA.
[23] Ahmet Uyar, Shrideep Pallickara and Geoffrey Fox. Towards an Architecture for Audio Video Conferencing in Distributed Brokering Systems. Proceedings of the 2003 International Conference on Communications in Computing.
[24] Geoffrey Fox and Shrideep Pallickara. An Approach to High Performance Distributed Web Brokering ACM Ubiquity Volume2 Issue 38. November 2001.
[25] Shrideep Pallickara, Geoffrey Fox, and Marlon Pierce. Incorporating an XML Matching Engine into Distributed Brokering Systems. . Proceedings of the International Conference on Parallel and Distributed Processing Techniques and Applications. (PDPTA'03).
[26] A simulation of the NaradaBrokering Topology Viewer http://www.naradabrokering.org/tv/simulation/ [27] Sun Microsystems, Java Media Framework 2.1, http://java.sun.com/products/java-media/jmf/2.1.1/index.html,
2001