performance of a mr hydraulic power actuation...
TRANSCRIPT

Performance of a MR Hydraulic Power Actuation System*
JIN-HYEONG YOO AND NORMAN M. WERELEY
Alfred Gessow Rotorcraft Center, Department of Aerospace Engineering University of Maryland, College Park, Maryland 20742 USA E-mail: [email protected]
Phone: (301) 405-1927, FAX: (301) 314-9001
2 April 2003 Revised
ABSTRACT
The performance of a magnetorheological hydraulic power system is analytically and
experimentally assessed. Four MR valves are implemented as a Wheatstone bridge
hydraulic power circuit to drive a hydraulic actuator using a gear pump. The compact
hydraulic power actuation system is a Wheatstone bridge network driving a conventional
hydraulic actuator. A key advantage of using MR valves in Hydraulic actuations systems
is that the valves have no moving parts. This reduces the complexity and enhances the
durability compared to conventional mechanical valves. In such a system, MR fluid is
used as the hydraulic fluid. A constant volume pump is used to pressurize the MR fluid
which eliminates the effect of fluid compliance to a large degree. If a change in direction
is required, the flow through each of the valves in the Wheatstone bridge can be
controlled smoothly via changing the applied magnetic field. A magnetic field analysis is
conducted to design a high-efficiency compact MR valve. The behavior and performance
of the MR valve is expressed in terms of non-dimensional parameters. The performance
of the hydraulic actuator system with Wheatstone bridge network of MR valves is
derived using three different constitutive models of the MR fluid: an idealized model
* Presented at the 2002 SPIE Conference on Smart Structures and Integrated Systems, San Diego, CA, 17-21 March 2002
REVISED

2
(infinite yield stress), a Bingham-plastic model, and a biviscous model. The analytical
system efficiency in each case is compared to experiment, and departures from ideal
behavior, that is, a valve with infinite blocking pressure, are recognized.
Introduction
Magnetorheological (MR) fluid can be implemented in a variety of smart semi-active
actuation systems (Stanway et al, 1996), including optical polishing (Kordonski and
Golini, 2000), fluid clutches (Lee et al, 2000), and aerospace, automotive (Lindler and
Wereley, 2000; Gordaninejad and Kelso, 2000), and civil damping applications (Dyke et
al, 1998). Alternatively, MR fluid can be used in a fully active actuator with the help of a
conventional pump. Many industrial applications require high reliability, precisely
controllable and high energy density actuators. Choi et al (1997) presented a position
control system that used a single-rod cylinder activated by an electrorheological (ER)
valve. Lou et al (1991) analyzed ER valves and bridges to evaluate in its ability to control
the flow and pressure conditions. In this paper, magnetorheological (MR) valves and
bridges will be analyzed and designed to develop a compact hydraulic power actuation
system for application to unmanned air vehicles and helicopters. The higher yield stress
of MR fluid enables the actuator to be more compact than a similarly capable system that
uses ER fluid. The MR valve is a key component of the actuation system. Driving force,
stroke, bandwidth and efficiency are the key evaluation parameters in a general hydraulic
actuator (Watton, 1989). Durability and miniaturization are stumbling blocks to expand
the scope of applications for conventional mechanical valves. These problems can
potentially be overcome by replacing the mechanical valves with MR valves.

3
There are many advantages to using MR valves in hydraulic actuation systems. In
particular, MR valves have no moving parts, thereby eliminating the complexity and
durability issues associated with conventional mechanical valves. In such a system MR
fluid is used as the hydraulic fluid. Especially, in this study, a commercially available
MR fluid, namely MRF-132AD (Lord Corporation) was used for the simulation and test.
A constant volume pump is used to pressurize the MR fluid. If a change in direction is
required, the flow through each of the valves in the Wheatstone bridge can be controlled
smoothly via changing the applied magnetic field. Above all, the most important
advantage of the MR valves will be the miniaturization and weight savings compared to a
mechanical valve. This miniaturization can expand the application area to the aerospace
industry, making it a feasible means of actuating trailing-edge flaps in helicopter blades
(Milgram et al, 1995) as an example. Two potential disadvantages may be the block force
and the cut-off frequency of this actuator. The block force depends on the yield stress of
the MR fluid and MR valve geometry, and the cut-off frequency is a function of the
response time of the MR fluid.
In a preliminary study (Yoo et al, 2001; Yoo and Wereley, 2001), the
performance of a hydraulic actuator with MR valves was evaluated based on
experimental test data and a performance assessment of MR valves. A magnetic field
analysis was conducted to design a high-efficiency compact MR valve (Yoo and
Wereley, 2001). The magnetic circuit consisted of a bobbin, with a coil wound about its
shaft. Surrounding the bobbin was a tubular magnetic flux return. Key geometric
properties were the bobbin shaft diameter, bobbin flange thickness, and gap between
bobbin flange outer diameter and the flux return. A lower limit to miniaturizing the MR
valves was that the bobbin shaft saturates magnetically at lower field strengths as the

4
shaft diameter decreases. Through numerical simulation, a target magnetic flux density at
the gap was achieved in an optimized valve design, and its performance was validated via
experiment.
In this study, a MR fluid based power actuation system is analyzed and
experimentally validated by testing a prototype. A set of four MR valves is implemented
within a Wheatstone bridge hydraulic power circuit to drive a hydraulic actuator using a
gear pump. A non-dimensional analysis will be developed for describing the performance
of the valve and the actuation system. The system efficiency defined as the power
transferred to the load divided by the MR valve supply power will be derived. The
Bingham-plastic and the biviscous constitutive model were adopted for the fluid flow
analysis, and the simulation results based on these models agreed well with test results.
The performance of the hydraulic actuator with MR valves is shown to be very dependent
on the output mechanical load and driving current to the MR valves. On increasing the
source pressure the performance of the actuator system was increased. But there are
certain limitations on performance due to the finite yield stress of the MR fluid.
ACTUATOR ANALYSIS
Figure 1 shows the schematic diagram of the hydraulic actuator system where the
load attached to the cylinder generates a force F. A motor drives a pump and the pump
forces fluid through the accumulator and MR valves configured as a Wheatstone bridge.
Applying current to valves � and �, activates these valves and the fluid flows
predominantly from PS to PH through valve �. The flow into the lower chamber of the
hydraulic actuator causes the piston to move up and the fluid in the upper chamber flows

5
to PL to the reservoir through valve �. Under ideal conditions or infinite blocking
pressure, valves � and�� permit no flow. However, in a real system, valves � and��
permit a relatively low volume flux as compared to valves � and �. Assuming well
balanced symmetric conditions in the Wheatstone bridge configuration, the flow rates in
valves � and ��are defined as Qa and the flow rates in valves�� and�� have Qb, where
Qa >> Qb.�
The performance of the hydraulic actuator with MR valves will be evaluated using three
models: 1) an idealized valve in which infinite blocking pressure is assumed, 2) a
Bingham-plastic model with finite blocking pressure, and 3) a biviscous model, also with
finite blocking pressure. With these assumptions, system efficiency can be derived based
on knowledge of the field dependent yield stress of the MR fluid.
Figure 2 shows test results of shear stresses of a commercially available MR fluid,
namely MRF-132AD (Lord Corporation). The tests are conducted with rotational
viscometer (MCR300 with MR cell, MRD180, Paar Physica) for a range of fairly low
shear rates. Measured apparent viscosity of the MR fluid is shown in Figure 3. For the
simulation, the MR fluid is assumed to have a nominal plastic viscosity of 6 Pa·s, which
is suitable for the predicted shear rates (< 10 s-1) in the activated valves.
MR Valves
The MR valves used in this study consist of a core, flux return, and an annulus through
which the MR fluid flows, as shown in Figure 4. The core is wound with insulated wire.
A current applied through the wire coil around the bobbin creates a magnetic field in the
gap between the flange and the flux return. The magnetic field increases the yield stress

6
of the MR fluid in this gap. This increase in yield stress alters the velocity profile of the
fluid in the gap and raises the pressure difference required for a given flow rate. For
Bingham-plastic flow, the typical velocity profile is illustrated in Figure 4 (b) with the
dimensional definitions. The primary parts of the MR valve design are pictured in Figure
5.
A 1-D axisymmetric analysis is given by Kamath, Hurt and Wereley (1996), and
an approximate rectangular duct analysis was provided by Wereley and Pang (1998).
Gavin (2001) provided an analysis for annular valves with more appropriate radial field
dependence. But in our analysis, we assume a uniform field across the valve gap.
Following this latter study, we consider the approximate rectangular duct analysis of a
flow mode valve system containing MR fluid. For Newtonian flow, the volume flux Q
through the annulus is a function only of the area moment of inertia I (=bd3/12) of the
valve cross-section, the fluid viscosity µ, and the pressure drop over the valve length,
∆P/La. The dimensional volume flux through the valve can be determined (Wereley and
Pang, 1998; Wereley and Lindler, 1999)
−++−∆=
+−∆=
∆=
δδµδδµ
δδµ
µ
31
23)2/1()1(
12
)2/1()1(12
12
22
3
23
3
apoBV
apoBP
apoN
LPbdQ
LPbdQ
LPbdQ
(1)
where QN is for Newtonian flow, QBP is for Bingham-plastic flow and QBV is for
biviscous Poiseuille flow. Here, the non-dimensional plug thickness, d/δδ = and non-
dimensional viscosity ratio, µ , which is defined as the ratio of the post-yield differential
viscosity ( poµ ) to the pre-yield differential viscosity ( prµ ), have been introduced.

7
Normalizing each volume flux by the Newtonian value of volume flux yields the non-
dimensional volume fluxes for each of the flow models
NBVBV
NBPBP
N
QQQ
QQQQ
/)3
1(23)2/1()1(
/)2/1()1(
1
22
2
=
−++−=
=+−=
=
δδµδδ
δδ (2)
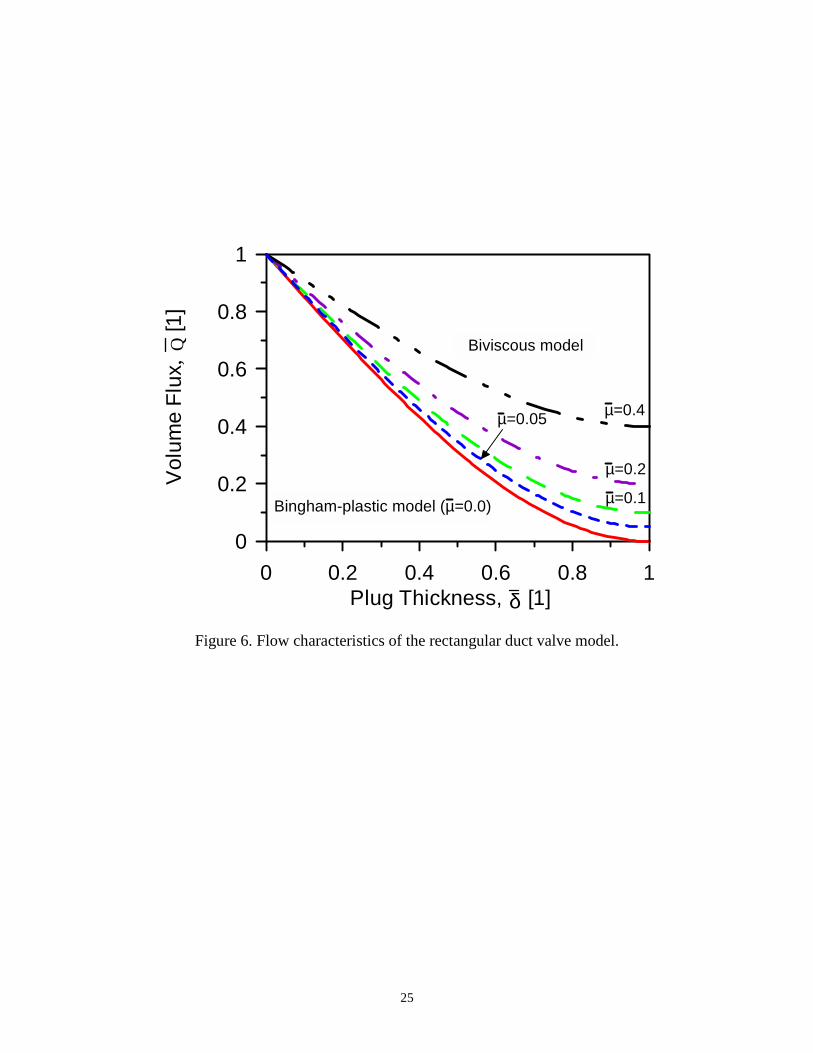
Figure 6 shows the trends of the non-dimensional volume flux as a function of the plug
thickness δ , for Bingham-plastic and biviscous models, for the case of rectangular duct.
In this figure, 1=Q implies Newtonian flow and 0=Q implies that the valve has
blocked the flow.
Note that the MR valve behavior, based on a biviscous MR fluid constitutive
model, is not capable of blocking the flow completely since 0>BVQ for all 10 ≤≤ δ .
This implies that the two activated valves in the hydraulic circuit will experience leakage,
which is a key source of efficiency loss in the actuator system. This efficiency loss will
occur even though the fluid will tend to flow through the inactive valves.
Actuator Performance
The volume flux through each valve in Figure 1 can be defined as
)(12
)(12
3
3
LSba
b
HSaa
a
PPQL
bdQ
PPQL
bdQ
−=
−=
µ
µ (4)
The total flow rate, QS from the motor and the flow rate for moving the actuator, QW are
defined as
uAQQQQQQ
pbaW
baS
=−=+=
(5)

8
The force equilibrium equation at the hydraulic actuator is
FAPP pLH =− )( (6)
The force F includes friction force and output force of the cylinder. It follows that the
steady-state force equilibrium of equation (6) and the velocity of the actuator will be:
+−−=Sp
babapa
S
PAFQQQQ
ALPbdu )()(
24
3
µ (7)
The maximum velocity of the actuator shaft and maximum force of the actuator can be
expressed as:
Spa
ba PALQQbdu
µ24)(3
max
−= (8)
Spba
ba PAQQQQF
+−=
max (9)
The maximum velocity and force are functions of the pressure source, PS. In the case of
an ideal valve, the velocity and force will increase as the source pressure increases.
However, in the case of an MR valve, the non-dimensional volume flux, Q , is also a
function of the supply pressure, so that the maximum velocity and force is dependent on
the non-dimensional volume flux.
From equation (7), the non-dimensional actuator performance equation can be stated
{ }FQQQQPbd
LQQ babaS
aWW )()(
2112
3 +−−== µ (10)
where, SpPAFF /= . The maximum value of F is 1 and WQ is 0.5. If a current is
applied to the shaded valves � and � in Figure 1, we can define for the rectangular
duct:
flowNewtonian for ,1=aQ

9
−++−
+−=
flow biviscousfor )3
1(23)2/1()1(
flow plastic-Binghamfor )2/1()1(2
2
2
δδµδδ
δδbQ (11)
Corresponding to the MR fluid model used, the trends of bQ will follow the
simulation results of Figure 6. Figure 7 shows the actuator performance predicted by the
Bingham-plastic model as a function of the non-dimensional plug thickness, δ . On
increasing the current to the valve, the magnetic flux density at the gap will be increased.
This causes an increase in the plug thickness of the MR fluid flowing through the gap.
The performance of the actuator will approach the ideal case, as the plug thickness
increases. In the case of biviscous model, the performance as a function of the viscosity
ratio is shown in Figure 8. As can be seen in Figure 8, the biviscous model cannot reach
the maximum performance of the actuator. The maximum performance with 1=δ is
dictated by the value of the viscosity ratio, µ . On decreasing the current to the valve, the
performance of the actuator also decreases, following the trends of Bingham-plastic
model, in Figure 7.
System Efficiency
The system efficiency, defined as the power transferred to the load divided by the MR
valve supply power, is given by:
ba
ba
bbaa
bbaa
QQQQ
QPQPQPQP
+−=
+−==
system supply toPower load todeliveredPower η (10)
In this definition of efficiency, only the hydraulic efficiency is considered. From the
above, system efficiency of the actuator model can be derived as follows:
b
b
+−=
121),( µδη (11)

10
Figure 9 shows the efficiency for the actuator when the working MR fluid behaves as a
biviscous fluid. In this case, the maximum efficiency at 1=δ can be derived as:
µµµδη
δ +−=
= 121),(
1 (12)
Thus the system efficiency is a function of both δ of the valve and µ of the fluid.
ACTUATOR IMPLEMENTATION
To validate the nonlinear valve performance based on Bingham plastic model, a set of
four MR valves was implemented within a Wheatstone bridge hydraulic power circuit to
drive a hydraulic actuator using a gear pump. The experimental setup is shown in Figure
10. The actuator consists of three main parts: a hydraulic cylinder, a set of four MR
valves with Wheatstone bridge configuration and a gear pump as a hydraulic source, as
pictured in Figure 11.
MR Valves
Yield stress characteristics of a MR fluid change as a function of the applied magnetic
field. Therefore, the magnetic field applied to the MR fluid is very important to the
performance of the valve and actuator.
A high efficiency design was explored for meso-scale MR valves (<25 mm OD).
The magnetic circuit consisted of a bobbin, which a coil wound about its shaft.
Surrounding the bobbin was a tubular magnetic flux return. Key geometric properties
were the bobbin shaft diameter, bobbin flange thickness, and gap between bobbin flange
outer diameter and the flux return. A lower limit to miniaturizing the MR valves was that
the bobbin shaft saturates magnetically at lower field strengths as the shaft diameter

11
decreases. Through numerical simulation, a target magnetic flux density at the gap was
achieved in an optimized valve design, and its performance was validated via experiment.
A thin film (FH-301-060, F.W.BELL) Hall sensor was used to measure the magnetic flux
density at the gap and a hand-held Gauss meter (F.W.BELL, model 5080) was used to
calibrate the Hall sensor. Figure 12 compares the experimental data with the analytical
prediction from ANSYS/Emag 2-D for the valve with an air gap. Taking the error of the
Hall sensor into consideration, the results in Figure 12 are in good agreement with each
other. With these results, it was concluded that simulation using ANSYS/Emag 2-D was
sufficiently accurate to predict the steady state performance of the magnetic field at the
gap when filled with MR fluid. Thus, at 1.6 Ampere of applied current, a magnetic flux
density of 0.8 Tesla will have been induced, which is sufficient for fluid energisation.
Table 1 summarizes the valve parameters. The current to the MR valve was supplied
from a DC power supply.
Hydraulic Pressure Source
A ¼-HP electric motor drove the pump through a flexible coupling at the bottom of the
test rig as shown in Figure 10. The fixed displacement gear pump (D05 series, Parker)
has a flow rate of 1.87 cc/rev. The motor speed was controlled by the motor controller
and the speed was set to nominally 252 RPM, so that the flow rate of the system was
nominally 471.24 cc/min (7.854X10⁻⁶ m3/sec). To regulate the pressure from the gear
pump, an accumulator was connected just after the gear pump as shown in Figure 11.
Hydraulic Cylinder
The hydraulic cylinder in this system had ½ inch bore diameter with ¼ inch shaft
diameter. The maximum stroke of the actuator is 32 mm. To measure the displacement

12
response, a potentiometer was attached with a rigid bar, as shown in Figure 10. Table 2
shows specification of the apparatus and operational conditions.
EXPERIMENTAL SETUP
Experiments were performed to measure the output power of the actuator as a function of
driving current to the MR valve. Figure 11 shows the configuration of the actuator in
more detail with schematic diagram. The actuator had four MR valves in a Wheatstone
bridge circuit. Three pressure transducers and two pressure gauges monitored the
pressure inside the circuit. The pressure transducer, PS measured the source pressure and
PH and PL measured the high and low side pressure, respectively. The accumulator
regulated the source pressure from the gear pump and the reservoirs controlled the
amount of fluid inside the actuation system according to the operational condition. The
signal conditioner collected the output signal from three pressure transducers (PX600,
Omegadyne Inc.) and an LVDT (TR50, Novotechnik) connected to the hydraulic
actuator. Finally, all the data was transferred to a digital oscilloscope (TDS420A,
Tektronix) for monitoring of the signal and data acquisition.
Deadweights were hung off the end of the output hydraulic actuator and the
position of the output hydraulic cylinder was measured using the LVDT. The bias
pressure was set to about 70PSI because the pressure limit of the reservoir was 80 PSI.
Applying a current to valves � and �, in Figure 11 activated the valves and the
fluid flowed predominantly from PS to PH through valve �. The flow into the lower
chamber of the hydraulic actuator caused the piston to move up and the fluid in the upper
chamber flowed to PL to the reservoir through valve �. The activated valves � and��
have fairly low shear rates compared to valves � and �.

13
For optimal performance, it is desired to have a zero shear rate condition in the
actuator valve, but this may not be achievable in practical as described above.
EXPERIMENTAL RESULTS
In Figure 13, the experimental pressure and displacement response of the actuator shaft
are plotted. As the current is applied to MR valves ( sec0=t ) the high and low side
pressures, PH and PL, increases and decreases, respectively. Before the shaft started to
move, the low side pressure gradually decreased and high side increased. After the shaft
of the actuator started to move, the pressure of each side remained constant until the shaft
stopped. The velocity is plotted in Figure 14 as a function of the applied current. On
increasing the deadweight, the velocity of the actuator shaft tended to decrease. On
increasing the applied current, the velocity of the shaft increased but after 1.0 A, the
velocity saturated. This implies that the maximum performance of the valve was reached.
In Figure 15, the non-dimensional actuator performance of the test is compared
with the simulation results from the Bingham-plastic model. The simulation results
(lines) are shown from 0.4 to 1.6 A and the test results (symbols) are for the range of 0.6
to 1.6 A. Generally the predicted performance from the simulation was higher than the
test results, but the trends of these results as a function of the current are fairly similar to
each other.
Introducing the biviscous model, as in Figure 16, the predictions can be made
more consistent with test results. The rectangular symbols show the case of 0.6 A test and
the coarse dashed line corresponds to its corresponding prediction. Above 1.0 A current
input, the performance of the actuator almost reaches to the maximum performance line.

14
Figure 17 shows the efficiency of the system. The efficiency tended to increase on
increasing the input current and deadweights. The maximum performance of the actuator
system as a function of the pressure source is shown in Figure 18. As mentioned in
equation (8) and (9), on increasing the pressure supplied by the pump, the maximum
performance of the actuator will also increase, but is limited to an upper performance
bound by the finite yield stress of the MR fluid.
CONCLUSION
A MR fluid based actuation system was analyzed and experimentally validated by testing
a prototype. The hydraulic actuation system was constructed with four MR valves which
have a Wheatstone bridge configuration and gear pump. The gear pump forces the fluid
through the MR valves and the MR valves control the direction of flow through to the
actuator. The controlled fluid flow makes the piston move. A non-dimensional volume
flux was defined for describing the performance of the valve and the performance of the
actuation system was evaluated with the non-dimensional equation. The system
efficiency defined as the power transferred to the load divided by the MR valve supply
power was derived and it was found that the efficiency is a function of non-dimensional
plug thickness, δ and viscosity ratio µ .
The low pressure capacity of the reservoir limited the output power of the system,
but the test results agree fairly well with predictions. The biviscous model showed better
agreement with the test data than a Bingham-plastic model, and on increasing the
deadweight, the tested efficiency was increased. The performance of the hydraulic
actuator with MR valves is very dependent on the output mechanical load and driving
current to the MR valves. The performance of the actuator system was increased on

15
increasing the source pressure. However, performance of the system is limited by the
finite blocking pressure of the MR valve, because of yield stress of the MR fluids also
finite.
Even though the actuator investigated in the present study is an experimental
prototype, scaling techniques using non-dimensional performance metrics derived in this
paper, make it possible to expand use of this actuator system to applications requiring
substantially different force, stroke or speed requirements.
REFERENCES
Choi, S.-B., Cheong, C.-C., Jung, J.-M. and Choi, Y.-T., 1997. “Position Control of an
ER Valve-Cylinder System via Neural Network Controller,” Mechatronics, 7(1):37-52.
Dyke, S. J., Spencer, B. F., Sain, M. K. and Carlson, J. D., 1998. “Experimental Study of
MR Dampers for Seismic Protection,” Smart Materials and Structures, 7(5):693-703.
Gordaninejad, F. and Kelso, S. P., 2000. “Fail-safe Magneto-Rheological Fluid Dampers
for Off-Highway, High-Payload Vehicles,” Journal of Intelligent Material Systems and
Structures, 11(5):395-406.
Kamath, G. M., Hurt, M. K. and Wereley, N. M., 1996. “Analysis and Testing of
Bingham Plastic Behavior in Semi-Active Electrorheological Fluid Dampers,” Smart
Materials and Structures, 5(5):576-590.

16
Kordonski, W. I. and Golini, D., 2000. “Fundamentals of Magnetorheological Fluid
Utilization in High Precision Finishing,” Journal of Intelligent Material Systems and
Structures, 10(9):83-689.
Lee, U., Kim, D., Hur, N. and Jeon, D., 2000. “Design Analysis and Experimental
Evaluation of an MR Fluid Clutch,” Journal of Intelligent Material System and
Structures, 10(9):701-707.
Lindler, J. and Wereley, N. M., 2000. “Analysis and Testing of Electrorheological
Bypass Dampers,” Journal of Intelligent Material Systems and Structures, 10(5):363-376.
Milgram, J., Chopra, I., and Straub, F. 1998. “Rotors with Trailing-Edge Flaps: Analysis
and Comparison with Experimental Data,” Journal of the American Helicopter Society,
43(4):319-332.
Stanway, R., Sproston, J. L. and El-Wahed, A. K., 1996. “Applications of Electro-
Rheological Fluids in Vibration Control: A Survey,” Smart Materials and Structures,
5(4):464-482.
Watton, J., 1989, Fluid Power Systems, Prentice Hall.

17
Wereley, N. M. and Lindler, J., 1999. “Biviscous Damping Behavior in
Electrorheological Dampers,” ASME Symposium on Adaptive Structures and Materials
Systems, AD-Vol. 59/MD-Vol.87, Nashville, TN, pp. 67-75.
Wereley, N. M. and Pang, Li, 1998. “Nondimensional Analysis of Semi-Active
Electrorheological and Magnetorheological Dampers using Approximate Parallel Plate
Models,” Smart Materials and Structures, 7(5):732-743.
Yoo, J.-H., Sirohi, J., and Wereley, N. M., 2001. “Design of an MR Hydraulic Power
Actuation System,” SPIE Symposium on Smart Structures and Materials, Smart
Structures and Integrated Systems Conference, 5-8 March, 2001, Newport Beach, CA,
4327(22):148-158.
Zheng Lou, Robert D. Ervin and Frank E. Filisko, 1991. “Behaviors of Electrorheological
Valves and Bridges,” ER Fluids: Mechanisms, Properties, Structure, Technology, and
Applications, 15-16 October 1991, Edited by R. Tao, pp. 398-423.
NOMENCLATURE
Ap Piston area
b Circumference width of the MR valve
d Gap of the MR valve
F Output force of the cylinder
FB Block force
La Active length of the MR valve

18
PH High side pressure in the cylinder
PL Low side pressure in the cylinder
Ps Source pressure from the pump
Q Mass flow rate
u Velocity of the cylinder
Q Non-dimensional volume flux
∆P Pressure difference between the MR valves
δ Plug thickness
δ Non-dimensional plug thickness
η System efficiency
µ Viscosity
µ Nondimensional viscosity (µpo/µpr)
µpo Viscosity in the post-yield region
µpr Viscosity in the pre-yield region
Subscript
N Newtonian flow
BP Bingham plastic flow
BV Biviscous flow

19
Table 1. Valve Dimensions.
Outer Diameter 25.4 mm
Bobbin Diameter 14 mm
Flange Length/each 3 mm
Air gap 0.5 mm
No. of windings 160 turns
Max. Tesla at the gap 0.80 Tesla
Table 2. Specification and operational conditions of the apparatus.
Apparatus Specification Operational Condition
Electric Motor ¼ HP 252 RPM
Gear Pump 1.87 cc/rev 471.24 cc/min, about
100PSI
Hydraulic Actuator ½” bore, ¼” shaft Max. 32 mm stroke
DC power supply 20V, 10A. Max. 0.6 A. to 1.6 A.
Load 1 lbs weight, 600g Rig 0, 0.6, 1, 1.5 Kg

20
Figure 1. Schematic of hydraulic actuator system with MR valves.
Similarly shaded valves are on or off simultaneously.

21
0 20 40 60 80 100Shear Rate (1/s)
0
4
8
12
She
ar S
tress
(kP
a)
0.14 T
0.28 T
0.42 T
Figure 2. Shear stress versus shear rate diagram for the MR fluid, MRF-132AD (Lord
Corporation, Measured on a Paar Physica Rheometer Model MCR300 with MR cell).

22
0 20 40 60 80 100Shear Rate (1/s)
0.1
1
10
100
1000
Vis
cosi
ty (P
a.s)
Figure 3. Apparent viscosity as a function of shear rate.

23
42
φ25.
4
Details in (b)3 15
R8.
0R
8.5
CW CCW
42
φ25.
4
Details in (b)3 15
R8.
0R
8.5
CW CCW
(a) Valve cross section. All units in mm
(b) Velocity Profile
Figure 4. Schematic of the valve (a) and typical velocity profile for a Bingham plastic flow over the active valve length (b).

24
Figure 5. Photograph of the MR valve parts.
25
0 0.2 0.4 0.6 0.8 1Plug Thickness, δ [1]
0
0.2
0.4
0.6
0.8
1
Vol
ume
Flux
, Q
[1]
Bingham-plastic model (µ=0.0)
Biviscous model
µ=0.4
µ=0.2
µ=0.1
µ=0.05
Figure 6. Flow characteristics of the rectangular duct valve model.

26
0 0.1 0.2 0.3 0.4 0.5Working Flowrate, QW
0
0.2
0.4
0.6
0.8
1
Forc
e, F
δ =1, ideal
δ = 0.8
δ = 0.6
δ = 0.4 δ = 0.2
Figure 7. The performance of the actuator for an MR modeled as a Bingham plastic.

27
0 0.1 0.2 0.3 0.4 0.5Working Flow Rate, QW ( δ =1)
0
0.2
0.4
0.6
0.8
1
Forc
e, F
µ = 0.2
µ = 0.4
µ=0.05
ideal valve µ = 0.1
Figure 8. The performance of the actuator for an MR fluid modeled as a biviscous model.

28
0 0.2 0.4 0.6 0.8 1Non-dimensional plug thickness, δ
0
0.2
0.4
0.6
0.8
1
Effic
ienc
y, η
µ =0, B
ingham-plastic
µ = 0.05
µ = 0.1
µ = 0.2
µ = 0.4
Figure 9. Efficiency of the actuator.

29
Figure 10. Experimental setup for the evaluation of the actuator.

30
PL
PH
��
�� ��
��
PS
F
MR valves
Accumulator
Reservoir
12
34
P
M
PL
PH
��
�� ��
��
PS
F
MR valves
Accumulator
Reservoir
12
34
P
M
Figure 11. Configuration of the hydraulic actuator with schematic diagram.

31
0 2 4 6Applied current (A)
0
0.2
0.4
0.6
0.8
1
Mag
netic
flux
den
sity
(Te)
Test result, airSimulation, airSimulation, MR
Figure 12. Performance of the magnetic flux density at the gap with MR fluid
permeability (simulation) and with air permeability (test and simulation, Permalloy).

32
-2 0 2 4 6 8 10Time (sec)
0
200
400
600
800
Pres
sure
(kPa
)
0
10
20
30
40
Dis
p. (m
m)
PH
PL
Figure 13. A case of experimental pressures and displacement of actuator shaft.

33
0.4 0.6 0.8 1 1.2 1.4 1.6Applied Current, A
5
10
15
20
Velo
city
, mm
/s
F =0.76
F =0.70
F =0.65
F =0.55
Figure 14. The experimental actuator velocity as a function of applied current.

34
0 0.1 0.2 0.3 0.4 0.5Working Flow Rate, QW
( µ=0.0)
0
0.2
0.4
0.6
0.8
1
Forc
e, F
1.6 A1.0 A0.6 A0.4 A
Figure 15. The experimental non-dimensional actuator performance with Bingham-
plastic model simulation (Symbols: Test, Lines: Simulation).

35
0 0.1 0.2 0.3 0.4 0.5Working Flow Rate,
QW ( µ=0.05)
0
0.2
0.4
0.6
0.8
1
Forc
e, F
1.6 A1.0 A0.6 A0.4 A
Figure 16. The experimental non-dimensional actuator performance with biviscous model
simulation (Symbols: Test, Lines: Simulation).

36
0.4 0.8 1.2 1.6 2Applied Current, A.
0.5
0.6
0.7
0.8
0.9
1
Effic
ienc
y, η
F =0.76 F =0.70 F =0.65 F =0.55
Figure 17. The experimental results for the system efficiency.

37
0 0.04 0.08 0.12Cylinder velocity, u [m/sec] ( µ =0.05)
0
20
40
60
80
100
Bloc
k Fo
rce,
FB
[N]
PS = 500 PSI
400 PSI300 PSI200 PSI
100 PSI
Figure 18. The predicted performance of the actuator system as a function of pressure
supplied by pump.