performance measures of models to predict loss given default: a critical review · 2017-04-07 ·...
TRANSCRIPT

Performance measures of models to predict Loss Given Default: a critical review
Katarzyna Bijak
34th International Symposium on Forecasting
30th June 2014, Rotterdam

Outline
• Introduction
• Loss Given Default (LGD)
• Models to predict LGD
• Performance measures
– Error measures
– Other measures
• Conclusions

Loss Given Default (LGD)
• The lender’s loss on a loan due to the customer’s default, i.e. failure to meet the credit commitment
• “The ratio of the loss on an exposure due to the default of a counterparty to the amount outstanding at default” (Article 4(27) of the Council Directive 2006/48/EC)
• Basel II and III
– Under the Advanced Internal Ratings-Based (AIRB) approach, lenders are allowed to use their own predictions of risk parameters, including LGD

LGD distribution example
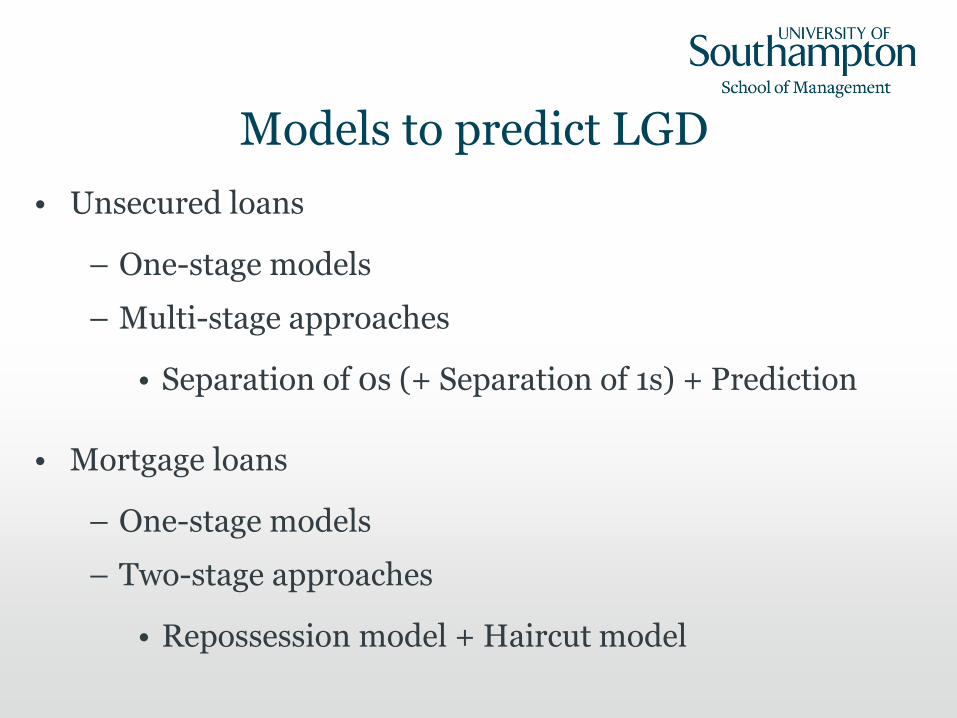
Models to predict LGD
• Unsecured loans
– One-stage models
– Multi-stage approaches
• Separation of 0s (+ Separation of 1s) + Prediction
• Mortgage loans
– One-stage models
– Two-stage approaches
• Repossession model + Haircut model

Models to predict LGD
• Separation stage(s)
– Logistic regression
– Decision trees
• Prediction stage/One-stage models
– Regression models
– Tobit models
– Survival analysis
– Classification and Regression Trees (CART)
– Other nonlinear models

Performance measures
• Credit scoring
– Gini coefficient
– Kolmogorov-Smirnov (KS) statistic
• LGD
– ???

Error measures: MSE
• Mean Square Error (MSE):
𝑀𝑆𝐸 =1
𝑛
𝑖=1
𝑛
𝑦𝑖 − 𝑦𝑖2
• Sensitive to extreme values of the residuals
• E.g. Bellotti and Crook (2008)

Error measures: RMSE
• Root Mean Square Error (RMSE):
𝑅𝑀𝑆𝐸 = 𝑀𝑆𝐸
• Expressed in the same units as LGD
• Bastos (2010)

Error measures: MAE
• Mean Absolute Error (MAE) a.k.a. Mean Absolute Deviation (MAD):
𝑀𝐴𝐸 =1
𝑛
𝑖=1
𝑛
𝑦𝑖 − 𝑦𝑖
• Expressed in the same units as LGD
• Compare with RMSE
• E.g. Bellotti and Crook (2008)

Error measures: RAE
• Relative Absolute Error (RAE):
𝑅𝐴𝐸 = 𝑖=1
𝑛 𝑦𝑖 − 𝑦𝑖
𝑖=1𝑛 𝑦𝑖 − 𝑦𝑖
• Ratio of MAE of the model and MAE of a simple predictor
• E.g. Bastos (2010)

Error measures: AOC
• Regression Error Characteristic (REC) curve estimates the CDF of the squared or absolute residual
• Area Over the REC Curve (AOC) estimates the expected regression error (Bi and Bennett, 2003)
• If the REC curve is derived using the squared (absolute) residuals, then AOC MSE (MAE) as the sample size

Error measures: AOC
• Loterman et al. (2012) calculated both RMSE and AOC (based on the squared residuals)
– LGD models: 24 various techniques and six datasets
– Differences between AOC and the squared RMSE:
• < 0.001 for five larger datasets
• < 0.01 for the smallest dataset (test: ca. 1100 loans)
• We recommend applying either AOC or MSE/MAE in order to avoid information redundancy

Other measures: R-squared
• Coefficient of determination (R-squared):
𝑅2 = 1 − 𝑖=1
𝑛 𝑦𝑖 − 𝑦𝑖2
𝑖=1𝑛 𝑦𝑖 − 𝑦𝑖
2
• E.g. Loterman et al. (2012)
• In an OLS regression model with a constant term, R-squared can be interpreted as the proportion of variation in LGD that is explained by variation in the regressors
• We only recommend using R-squared in OLS models

Other measures: Adjusted R-squared
• Adjusted coefficient of determination (adjusted R-squared):
𝑅2 = 1 − 1 − 𝑅2𝑛 − 1
𝑛 − 𝑘 − 1
• Corrected for the number of regressors (𝑘)
• Useful when comparing a number of linear LGD models
• E.g. Caselli et al. (2008)
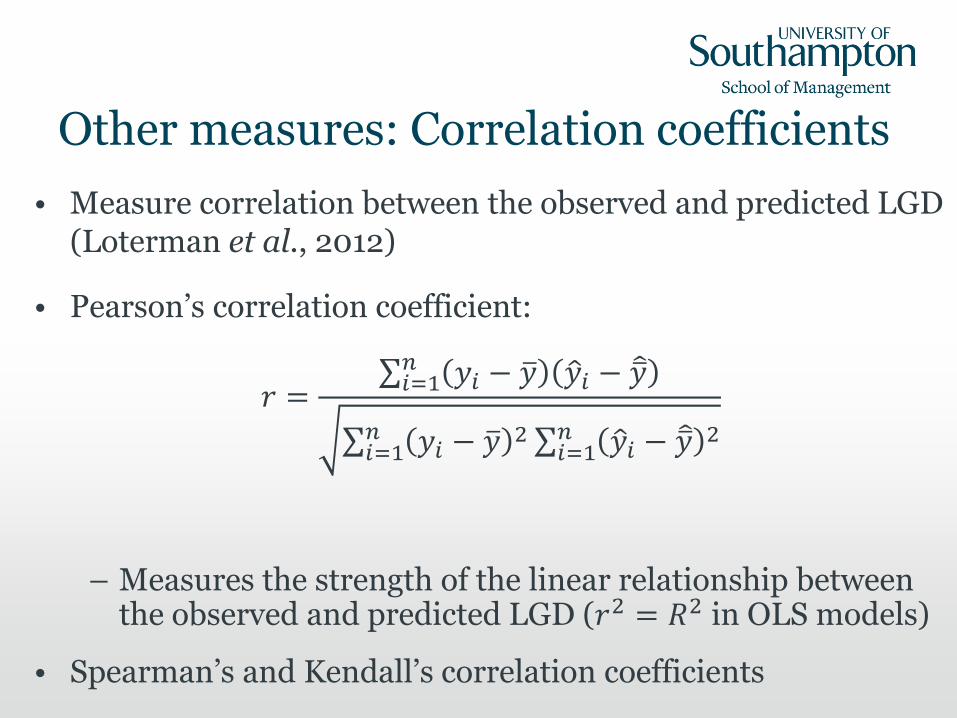
Other measures: Correlation coefficients
• Measure correlation between the observed and predicted LGD (Loterman et al., 2012)
• Pearson’s correlation coefficient:
𝑟 = 𝑖=1
𝑛 𝑦𝑖 − 𝑦 𝑦𝑖 − 𝑦
𝑖=1𝑛 𝑦𝑖 − 𝑦 2 𝑖=1
𝑛 𝑦𝑖 − 𝑦 2
– Measures the strength of the linear relationship between the observed and predicted LGD (𝑟2 = 𝑅2 in OLS models)
• Spearman’s and Kendall’s correlation coefficients
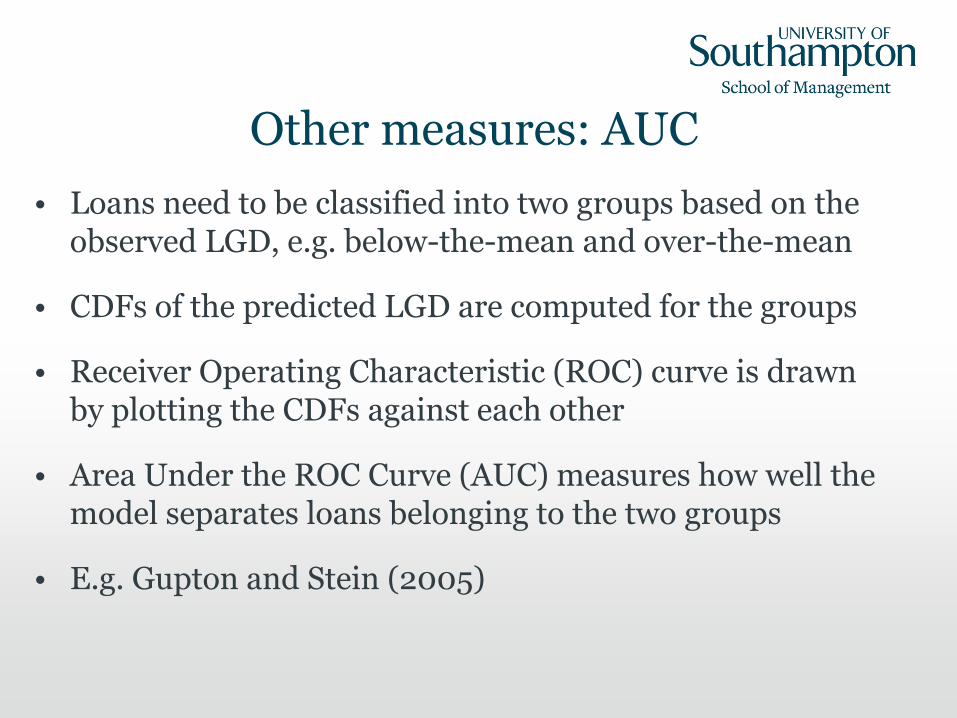
Other measures: AUC
• Loans need to be classified into two groups based on the observed LGD, e.g. below-the-mean and over-the-mean
• CDFs of the predicted LGD are computed for the groups
• Receiver Operating Characteristic (ROC) curve is drawn by plotting the CDFs against each other
• Area Under the ROC Curve (AUC) measures how well the model separates loans belonging to the two groups
• E.g. Gupton and Stein (2005)
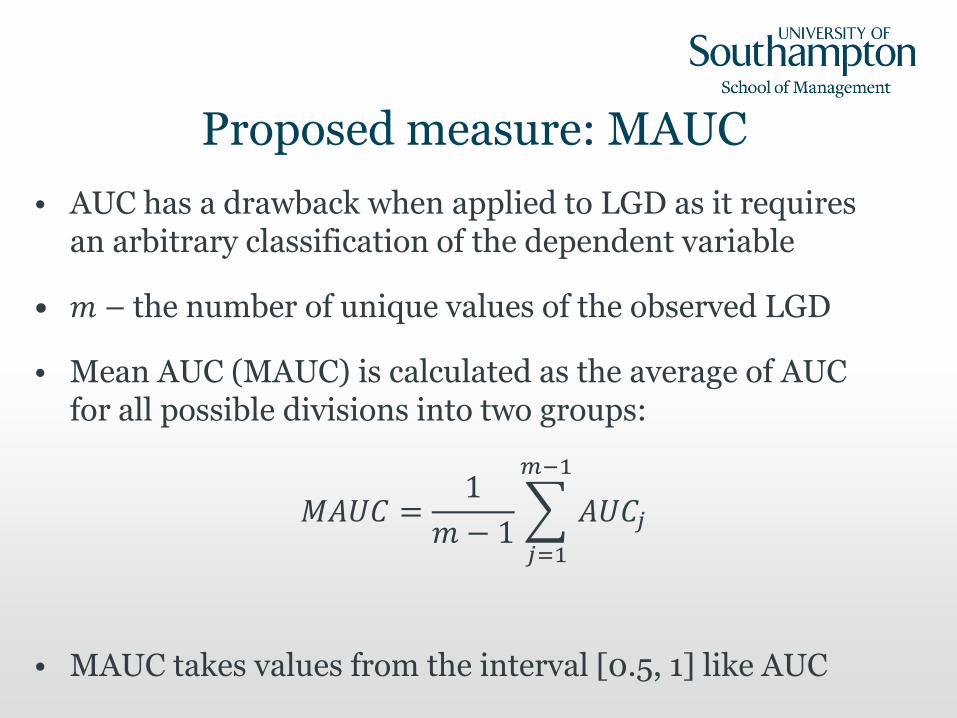
Proposed measure: MAUC
• AUC has a drawback when applied to LGD as it requires an arbitrary classification of the dependent variable
• 𝑚 – the number of unique values of the observed LGD
• Mean AUC (MAUC) is calculated as the average of AUC for all possible divisions into two groups:
𝑀𝐴𝑈𝐶 =1
𝑚 − 1
𝑗=1
𝑚−1
𝐴𝑈𝐶𝑗
• MAUC takes values from the interval [0.5, 1] like AUC
Example
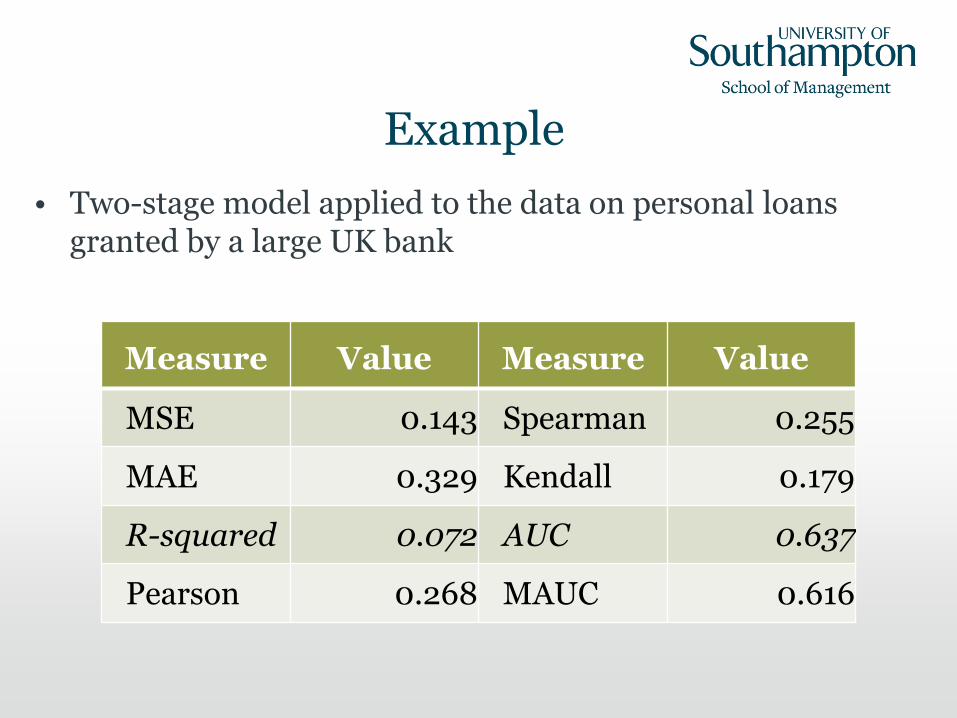
• Two-stage model applied to the data on personal loans granted by a large UK bank
Measure Value Measure Value
MSE 0.143 Spearman 0.255
MAE 0.329 Kendall 0.179
R-squared 0.072 AUC 0.637
Pearson 0.268 MAUC 0.616

Example

Conclusions
• Recommendations for LGD model developers/users
– Apply either AOC or MSE/MAE
– Only use R-squared in OLS models
– Look for an alternative to AUC
• Further research
– MAUC computed as the weighted average of AUC
– Impact of segmentation on performance of LGD models

References
• Bastos, J.A. (2010) Forecasting bank loans loss-given-default, Journal of Banking and Finance, 34(10), pp. 2510-2517.
• Bellotti, T. and Crook, J. (2008) Modelling and estimating Loss Given Default for credit cards, University of Edinburgh Business School, Credit Research Centre Working Paper 08-1.
• Bi, J. and Bennett, K.P. (2003) Regression Error Characteristic Curves, In: Fawcett, T. and Mishra, N. (eds.) Proceedings of the Twentieth International Conference on Machine Learning, Menlo Park, CA: AAAI Press, pp. 43-50.
• Caselli, S., Gatti, S. and Querci, F. (2008) The Sensitivity of the Loss Given Default Rate to Systematic Risk: New Empirical Evidence on Bank Loans, Journal of Financial Services Research, 34(1), pp. 1-34.
• Gupton, G.M. and Stein, R.M. (2005) LossCalc v2: Dynamic prediction of LGD, Moody’s KMV Research Paper.
• Loterman, G., Brown, I., Martens, D., Mues, C. and Baesens, B. (2012) Benchmarking regression algorithms for loss given default modeling, International Journal of Forecasting, 28(1), pp. 161-170.

Thank you!