performance improvement report second state fiscal …
TRANSCRIPT
PERF ORMANCE I MPROV E MENT RE PORT
SECOND STAT E F ISCAL QUARTER 2 012 October, November, December 2011
Mary Louise McEwen, SUPERINTENDENT
January 18, 2011

Table of Contents GLOSSARY OF TERMS, ACRONYMS, AND ABBREVIATIONS
INTRODUCTION
ADMISSIONS ........................................................................................................................ 1
COMMUNITY FORENSIC ACT TEAM .................................................................................. 3
CAPITOL COMMUNITY CLINIC........................................................................................... 6
CLIENT SATISFACTION ..................................................................................................... 10
COMPARATIVE STATISTICS ............................................................................................. 13
DIETARY ............................................................................................................................. 37
HARBOR TREATMENT MALL ............................................................................................. 39
HEALTH INFORMATION MANAGEMENT.......................................................................... 40
HOUSEKEEPING ................................................................................................................ 42
HUMAN RESOURCES ........................................................................................................ 44
INFECTION CONTROL ....................................................................................................... 48
LIFE SAFETY ...................................................................................................................... 49
NURSING ............................................................................................................................ 51
PEER SUPPORT................................................................................................................. 56
PROGRAM SERVICES ....................................................................................................... 58
REHABILITATION SERVICES ............................................................................................ 60
SECURITY & SAFETY ......................................................................................................... 61
SOCIAL WORK.................................................................................................................... 62
STAFF DEVELOPMENT ..................................................................................................... 65
CONSENT DECREE COMPLIANCE STANDARDS SUMMARY ........................................ 66
Glossary of Terms, Acronyms & Abbreviations
ACT Assertive Community Treatment
ADC Automated Dispensing Cabinets (for medications)
ADON Assistant Director of Nursing
AOC Administrator on Call
CCM Continuation of Care Management (Social Work Services)
CCP Continuation of Care Plan
CPI Continuous Process (or Performance) Improvement
CPR Cardio-Pulmonary Resuscitation
CSP Comprehensive Service Plan
GAP Goal, Assessment, Plan Documentation
HOC Hand off communications.
IMD Institute for Mental Disease
ICDCC Involuntary Civil District Court Commitment
ICDCC-M Involuntary Civil District Court Commitment, Court Ordered Medications
ICDCC-PTP Involuntary Civil District Court Commitment, Progressive Treatment Plan
IC-PTP+M Involuntary Commitment, Progressive Treatment Plan, Court Ordered Medications
ICRDCC Involuntary Criminal District Court Commitment
INVOL CRIM Involuntary Criminal Commitment
INVOL-CIV Involuntary Civil Commitment
ISP Individualized Service Plan
IST Incompetent to Stand Trial
LCSW Licensed Clinical Social Worker
LPN License Practical Nurse
TJC The Joint Commission (formerly JCAHO, Joint Commission on Accreditation of Healthcare Organizations)
MAR Medication Administration Record
MRDO Medication Resistant Disease Organism (MRSA, VRE, C-Dif)
NAPPI Non Abusive Psychological and Physical Intervention
NASMHPD National Association of State Mental Health Program Directors
NCR Not Criminally Responsible
NOD Nurse on Duty
NP Nurse practitioner
NPSG National Patient Safety Goals (established by the Joint Commission)
NRI NASMHPD Research Institute, Inc.
OT Occupational Therapist
PA or PA-C Physician’s Assistant (Certified)
PCHDCC Pending Court Hearing
PCHDCC+M Pending Court Hearing for Court Ordered Medications
PPR Periodic Performance Review – a self-assessment based upon TJC standards that are conducted annually by each department head.
PSD Program Services Director
PTP Progressive Treatment Plan

Glossary of Terms, Acronyms & Abbreviations
R.A.C.E. Rescue/Alarm/Confine/Extinguish
RN Registered Nurse
RT Recreation Therapist
SA Substance Abuse
SBAR Acronym for a model of concise communications first developed by the US Navy Submarine Command. S = Situation, B = Background, A = Assessment, R = Recommendation
SD Standard Deviation – a measure of data variability.
Seclusion, Locked Client is placed in a secured room with the door locked.
Seclusion, Open Client is placed in a room and instructed not to leave the room.
SRC Single Room Care (seclusion)
URI Upper respiratory infection
UTI Urinary tract infection
VOL Voluntary – Self
VOL-OTHER Voluntary – Others (Guardian)
MHW Mental Health Worker

INTRODUCTION The incidence of seclusion and restraint as a safety mechanism for clients and staff in the clinical setting continues to be a focus of risk and process improvement activities. Both the number and duration of client incidents managed with restraint and seclusion techniques is variable and often dependent upon client acuity and concerns for maintaining client safety. The duration of both seclusion and restraint remain the national mean as determined by the National Association of State Mental Health Program Directors Research Institute (NRI). For the same period, with intermittent variations due to the period admission of highly acute clients, the average number of restraint and seclusion incidents over the past several quarters has been within one standard deviation of the national mean as determined by NRI. Efforts continue to further reduce the incidence of both restraint and seclusion while maintaining the safety of the client, the milieu and our staffs.
Medication variance, fall risk assessment, and suicide risk assessment have become areas of national concern in all healthcare settings. Riverview is capitalizing on the resources and collaborative opportunities that currently exist to evaluate and modify our practices in these areas in a manner that reflects national standards of care. The Safety and Risk Committee has established a sub-committee tasked with the revision of our current process for evaluating fall risk and the review of all fall incidents utilizing a process engineering method called root cause analysis. Normally this method is used for in-depth analysis of sentinel or serious reportable events but a abbreviated use of this method can be used to ascertain causes for system failures that do not focus on human errors but rather on the systems that allow humans to make errors. This approach is also planned for implementation in the analysis of medication variances.
Work on the internal assessment of the fulfillment of the Consent Decree Standards of Compliance is ongoing and overall success in maintaining these standards has been demonstrated consistently.

(Glossary of Terms, Acronyms & Abbreviations) (Back to Table of Contents)
ADMISSIONS
Figure CD-06 2011 2012
Client Admission Diagnoses Qtr2 Qtr3 Qtr4 Qtr1 Qtr2 Total ADJUSTMENT DIS W MIXED DISTURBANCE OF EMOTIONS & CONDUCT 1 1 1 2 5
ADJUSTMENT DISORDER WITH DEPRESSED MOOD 1 2 2 3 8 ADJUSTMENT DISORDER WITH MIXED ANXIETY AND DEPRESSED MOOD 1 1 2
ADJUSTMENT REACTION NOS 1 2 3
ALCOH DEP NEC/NOS-REMISS 2 2
ANXIETY STATE NOS 1 1
ATTN DEFICIT W HYPERACT 1 1 BIPOL I DIS, MOST RECENT EPIS (OR CURRENT) MANIC, UNSPEC 1 1 BIPOL I, MOST RECENT EPISODE (OR CURRENT) MIXED, UNSPECIFIED 1 1 BIPOL I, REC EPIS OR CURRENT MANIC, SEVERE, SPEC W PSYCH BEH 1 1 2 4
BIPOLAR DISORDER, UNSPECIFIED 11 10 11 17 17 66
CANNABIS ABUSE-IN REMISS 1 1
CONDUCT DISTURBANCE NOS 1 1
DELUSIONAL DISORDER 2 2 2 4 10
DEPRESS DISORDER-UNSPEC 1 1 2
DEPRESSIVE DISORDER NEC 5 5 7 4 6 27
DRUG ABUSE NEC-IN REMISS 2 2
DRUG ABUSE NEC-UNSPEC 1 1
DYSTHYMIC DISORDER 1 2 1 4
HALLUCINOG ABUSE-REMISS 1 1
HEBEPHRENIA-CHRONIC 1 1 2
IMPULSE CONTROL DIS NOS 1 1
INTERMITT EXPLOSIVE DIS 1 3 3 7
NONPSYCHOT BRAIN SYN NOS 1 1
OPPOSITIONAL DEFIANT DISORDER 1 1
PARANOID SCHIZO-CHRONIC 6 4 5 10 6 31
PARANOID SCHIZO-UNSPEC 4 5 2 1 12
PARANOID STATE NOS 1 1
POSTTRAUMATIC STRESS DISORDER 4 2 3 4 4 17
PSYCHOSIS NOS 7 13 14 6 13 53
REC DEPR DISOR-PSYCHOTIC 2 1 3
RECUR DEPR DISOR-SEVERE 1 1
RECURR DEPR DISORD-UNSP 1 1 2
SCHIZOAFFECTIVE DISORDER, UNSPECIFIED 20 14 13 11 13 71
SCHIZOPHRENIA NOS-CHR 6 4 2 3 1 16
SCHIZOPHRENIA NOS-UNSPEC 1 1 1 1 4
SCHIZOPHRENIFORM DISORDER, UNSPECIFIED 1 1 2
UNSPECIFIED EPISODIC MOOD DISORDER 3 3 5 12 4 25
Total Admissions 74 76 76 84 85 395 % Admitted with primary diagnosis of mental retardation, traumatic brain injury, dementia, substance abuse or dependence. 0% 2.7% 2.7% 3.6% 0.0% 1.8%
Page
1
(Glossary of Terms, Acronyms & Abbreviations) (Back to Table of Contents)
ADMISSIONS
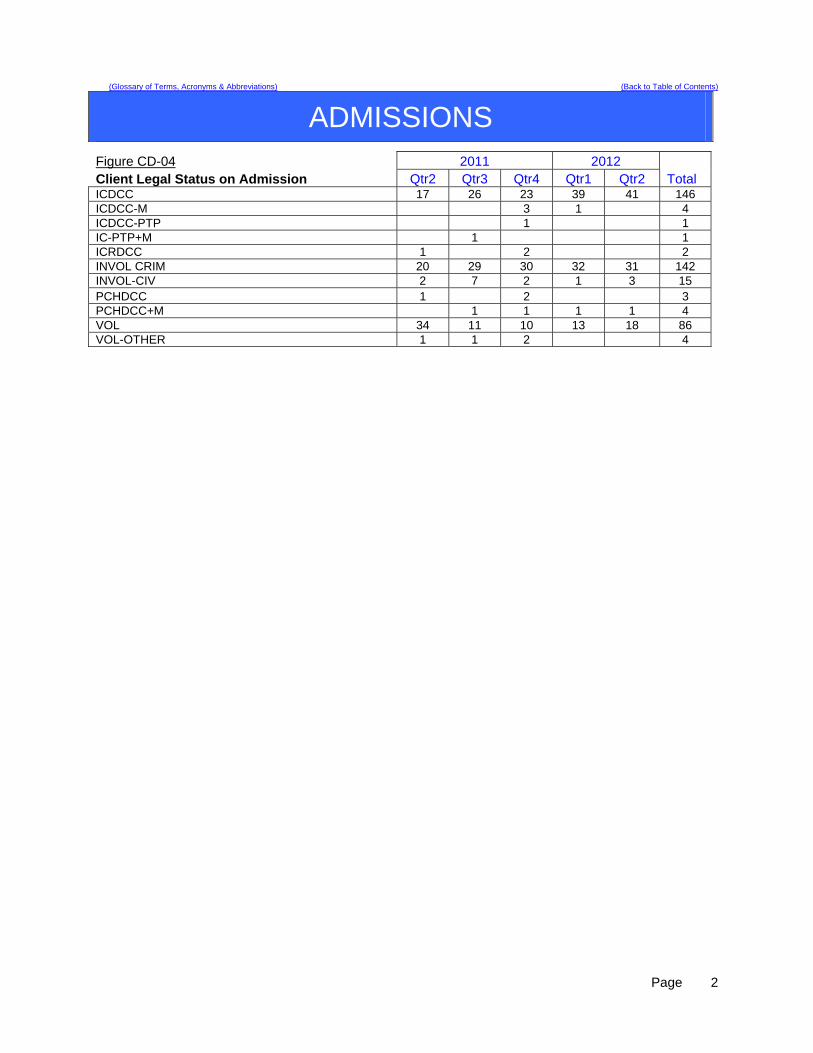
Figure CD-04 2011 2012 Client Legal Status on Admission Qtr2 Qtr3 Qtr4 Qtr1 Qtr2 Total ICDCC 17 26 23 39 41 146 ICDCC-M 3 1 4 ICDCC-PTP 1 1 IC-PTP+M 1 1 ICRDCC 1 2 2 INVOL CRIM 20 29 30 32 31 142 INVOL-CIV 2 7 2 1 3 15 PCHDCC 1 2 3 PCHDCC+M 1 1 1 1 4 VOL 34 11 10 13 18 86 VOL-OTHER 1 1 2 4
Page
2

(Glossary of Terms, Acronyms & Abbreviations) (Back to Table of Contents)
COMMUNITY FORENSIC ACT TEAM
ASPECT: REDUCTION OF RE-HOSPITALIZATION FOR ACT TEAM CLIENTS
Indicators Findings Compliance Threshold Percentile
1. The ACT Team Director will review all client cases of re-hospitalization from the community for patterns and trends of the contributing factors leading to re-hospitalization each quarter. The following elements are considered during the review:
a. Length of stay in community b. Type of residence (i.e.: group home,
apartment, etc) c. Geographic location of residence d. Community support network e. Client demographics (age, gender, financial) f. Behavior pattern/mental status g. Medication adherence h. Level of communication with ACT Team
4 clients were re-admitted to RPC; one
civil client who had not yet stabilized in the community, 3
forensic clients who were readmitted as
jail transfer for elopement and 2 for increased psychiatric
sx, respectively
100% 100%
2. ACT Team will work closely with inpatient treatment team to create and apply discharge plan incorporating additional supports determined by review noted in #1.
100% 100% 100%
Summary 1. The PTP client who was re-hospitalized had been living in the community in a supervised apartment
program for 4 months and was re-admitted on 10/17/11 when he stopped eating and had refused to come out of the bathroom in his residence. He was successfully treated and released on 12/27/11 when he had stabilized enough to move to a group home in Waterville. He has remained on PTP but it was agreed upon by the inpatient and outpatient psychiatrists that he would no longer be prescribed psychotropic medication if he could continue to manage in the community. The first NCR client who was readmitted had only been in the community a month and was re-admitted with the focus on medication stabilization taking into account the impact of smoking patterns. The second NCR client who was re-admitted was determined by DDPC, his psychiatric providers, to be in need of medication stabilization after a reported 2 missed doses. The client re-compensated quickly, and was released after 3 days. The inpatient psychiatrist and outpatient psychiatrist worked together to create a discharge plan that would reduce the likelihood of future missed medications. The NCR client who eloped on 11/4/11 and was apprehended in Georgia 11/18/11, was then transferred to Kennebec Co Jail 12/5, and re-hospitalized at RPC 1/5/12 while he awaits trial. The review of this elopement did not indicate that there were increased psychiatric symptoms causing the violation of court order, and further, that there had been a period of at least two months that the client was not paying rent and engaging in more work-related activities than he let the treatment team know about.
2. The ACT Team continues to place strong emphasis on collaborative in treatment team meeting
participation while clients are in the hospital, particularly regarding recommendations for goals of re-hospitalization and transition back to the community.
Page
3

(Glossary of Terms, Acronyms & Abbreviations) (Back to Table of Contents)
COMMUNITY FORENSIC ACT TEAM
ASPECT: INSTITUTIONAL AND ANNUAL REPORTS
Indicators Findings Compliance ThresholdPercentile
3. Institutional Reports will be completed, reviewed internally, and delivered to the court within 10 business days of notification of submitted petition.
6 of 7 on time
80% 95%
4. The assigned case manager will review the new court order with the client and document the meeting in a progress note or treatment team note.
4 new court
orders, all reviewed.
100% 100%
5. Annual Reports (due Nov) to the commissioner for all out-patient Riverview ACT NCR clients are submitted annually
48 of 50 96% 100%
Summary 1. Seven clients petitioned to have their cases heard in Superior Court. Six of seven had Institutional
reports completed on time. The process has been improved to include essential reviewers and continued emphasis on deadlines triggered with the receipt of petitions, which we believe has resulted in improved on-time Institutional Reports.
2. ACT Team Leader delivers all new Court Orders to Case Managers upon receipt, who then reviews
with both client and supported housing staff involved in compliance with order. This is documented in progress notes and/or reviewed in ISP treatment team.
3. Two Annual Reports were submitted late to the Superintendent by the Outlier Case Manager/ACT
PSD because of incomplete data on those two clients not resolved until December 1. ASPECT: SUBSTANCE ABUSE AND ADDICTIVE BEHAVIOR HISTORY
Indicators Findings Compliance ThresholdPercentile
1. age of onset documented in Comprehensive Assessment 40/42 95% 95%
2. duration of behavior documented in C.A. and progress notes 40/42 95% 95%
3. pattern of behavior documented in C.A. and progress notes 40/42 95% 95%
Summary
The Co-Occurring Specialist has reviewed all urinalyses for illicit drug/alcohol us, as well as appropriateness of substances screened for. This has streamlined the process of responding to the client with the information and will identify one point-person for the Maine General Lab for drug screens (Co-Occurring Specialist) and one for all other lab work (Nurse).Our randomization of urinalyses for drug/alcohol detection implemented by the Co-Occurring Specialist has been adapted to meet the MaineCare standards in order for lab work to be funded (no more than one time in 7 days).
Page
4
(Glossary of Terms, Acronyms & Abbreviations) (Back to Table of Contents)
COMMUNITY FORENSIC ACT TEAM
ASPECT: INDIVIDUAL SERVICE PLANS AND PROGRESS NOTES
Indicators Findings Compliance ThresholdPercentile
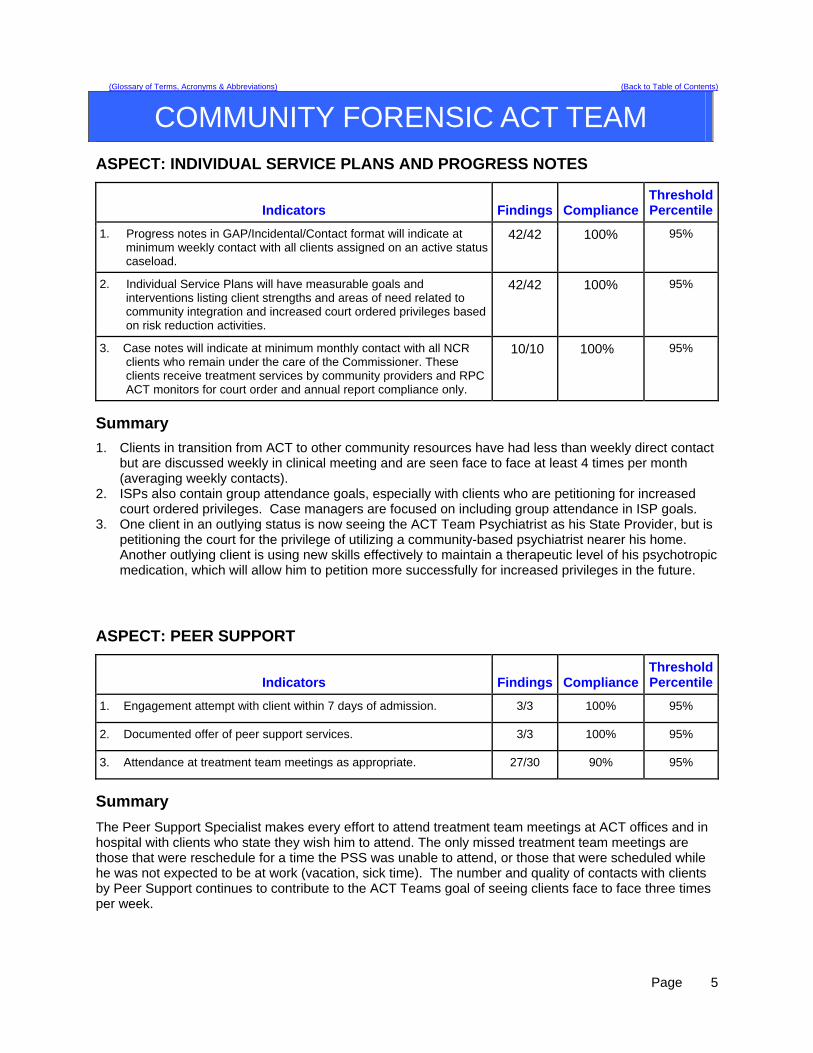
1. Progress notes in GAP/Incidental/Contact format will indicate at minimum weekly contact with all clients assigned on an active status caseload.
42/42 100% 95%
2. Individual Service Plans will have measurable goals and interventions listing client strengths and areas of need related to community integration and increased court ordered privileges based on risk reduction activities.
42/42 100% 95%
3. Case notes will indicate at minimum monthly contact with all NCR clients who remain under the care of the Commissioner. These clients receive treatment services by community providers and RPC ACT monitors for court order and annual report compliance only.
10/10 100% 95%
Summary
1. Clients in transition from ACT to other community resources have had less than weekly direct contact but are discussed weekly in clinical meeting and are seen face to face at least 4 times per month (averaging weekly contacts).
2. ISPs also contain group attendance goals, especially with clients who are petitioning for increased court ordered privileges. Case managers are focused on including group attendance in ISP goals.
3. One client in an outlying status is now seeing the ACT Team Psychiatrist as his State Provider, but is petitioning the court for the privilege of utilizing a community-based psychiatrist nearer his home. Another outlying client is using new skills effectively to maintain a therapeutic level of his psychotropic medication, which will allow him to petition more successfully for increased privileges in the future.
ASPECT: PEER SUPPORT
Indicators Findings Compliance ThresholdPercentile
1. Engagement attempt with client within 7 days of admission. 3/3 100% 95%
2. Documented offer of peer support services. 3/3 100% 95%
3. Attendance at treatment team meetings as appropriate. 27/30 90% 95%
Summary
The Peer Support Specialist makes every effort to attend treatment team meetings at ACT offices and in hospital with clients who state they wish him to attend. The only missed treatment team meetings are those that were reschedule for a time the PSS was unable to attend, or those that were scheduled while he was not expected to be at work (vacation, sick time). The number and quality of contacts with clients by Peer Support continues to contribute to the ACT Teams goal of seeing clients face to face three times per week.
Page
5

(Glossary of Terms, Acronyms & Abbreviations) (Back to Table of Contents)
CAPITOL COMMUNITY CLINIC CO
ASPECT: DENTAL CLINIC SURVEY
Indicators Findings Compliance Threshold Percentile
October Fifteen surveys were completed by dental in-house clients as well as outpatient. Of the fifteen surveys, all surveys were positive.
100%
90%
November Twenty seven client surveys were received. All twenty seven surveys were positive.
100%
90%
Clients from RPC as well as clients in the community will receive a survey to fill out at the time of appt. The survey has several questions and in those questions we are asking the client how we can better serve there needs.
December There was twenty-three client surveys completed. Of the twenty-three surveys returned, all were positive.
100 %
90%
Summary
Fifty-five surveys were returned and all showed positive results for the 2nd quarter 2012. Actions Will continue the client surveys to monitor and evaluate weekly as well as monthly with staff.
Page
6

(Glossary of Terms, Acronyms & Abbreviations) (Back to Table of Contents)
CAPITOL COMMUNITY CLINIC
ASPECT: DENTAL CLINIC 24 HOUR POST EXTRACTION FOLLOW-UP
Indicators Findings Compliance Threshold Percentile
October Ten extractions were performed. Post extraction instructions verbalized to each client. Client repeated back to Dental Assistant that they understood the instructions without difficulty.
100%
100%
November Five extractions were performed. Post extraction instructions verbalized to each client. Client repeated back to Dental Assistant that they understood the instructions without difficulty.
100%
100%
a. All clients with tooth extractions, will be assessed and have teaching post procedure, on the following topics, as provided by the Dentist or Dental Assistant Bleeding Swelling Pain Muscle soreness Mouth care Diet Signs/symptoms of infection
b. The client, post procedure tooth extraction, will verbalize understanding of the above by repeating instructions given by Dental Assistant/Hygienist.
December Three extractions were performed. Post extraction instructions verbalized to each client. Client repeated back to Dental Assistant that they understood the instructions without difficulty.
100% 100%
Summary There were eighteen extractions in the 2nd quarter 2012. All clients had been educated on each topic listed above with post extraction, after care instructions were given both orally and in writing. Clients had no issues repeating and understanding the oral instructions. A follow up post procedure phone call is done to check on the client’s progress. Of the eighteen calls made, there were no issues or complications post procedure. Reports were reviewed at monthly staff meetings and forwarded quarterly to RPC. Action
Results will be reviewed monthly by staff and will continue to report monthly to RPC.
Page
7
(Glossary of Terms, Acronyms & Abbreviations) (Back to Table of Contents)
CAPITOL COMMUNITY CLINIC ASPECT: DENTAL CLINIC TIMEOUT/IDENTIFICATION OF CLIENT
Indicators Findings Compliance Threshold Percentile
October There were ten extractions for the month, The client was given a time out to identify extraction site, and asked to state their name and dob.
100 %
100%
November There were five extractions done for the month. The each client was given a time out to identify extraction site, and asked to state their name and dob.
100%
100%
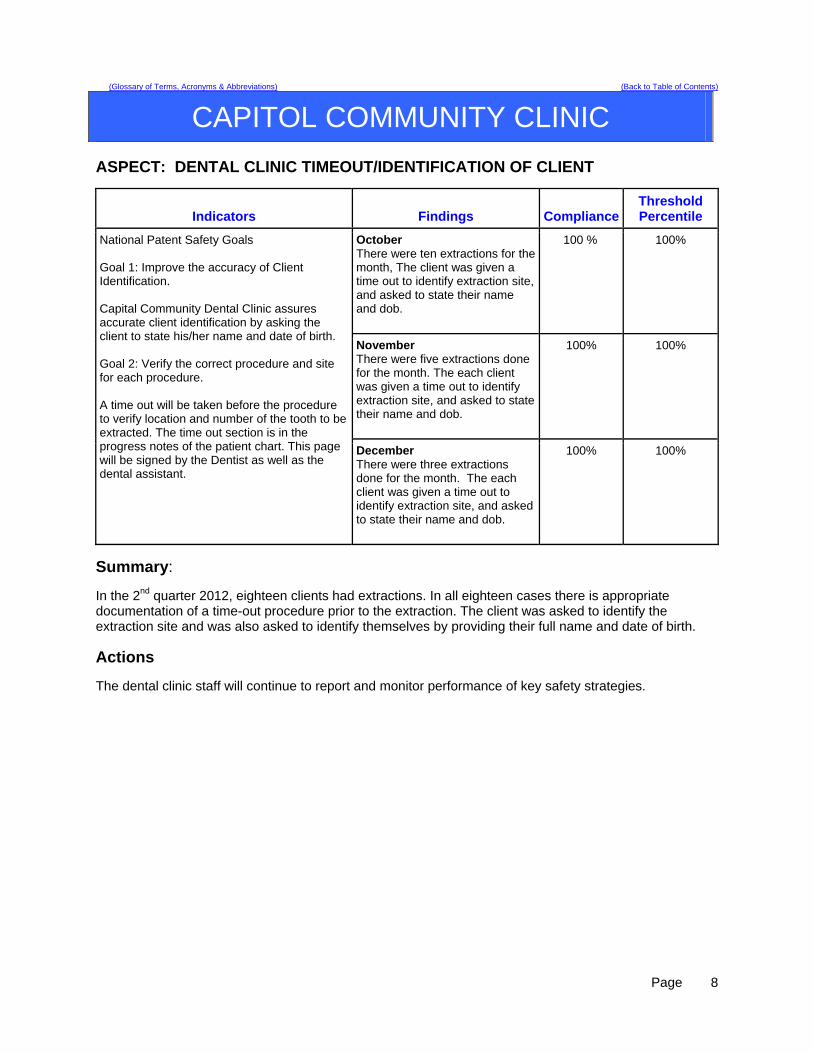
National Patent Safety Goals Goal 1: Improve the accuracy of Client Identification. Capital Community Dental Clinic assures accurate client identification by asking the client to state his/her name and date of birth. Goal 2: Verify the correct procedure and site for each procedure. A time out will be taken before the procedure to verify location and number of the tooth to be extracted. The time out section is in the progress notes of the patient chart. This page will be signed by the Dentist as well as the dental assistant.
December There were three extractions done for the month. The each client was given a time out to identify extraction site, and asked to state their name and dob.
100%
100%
Summary: In the 2nd quarter 2012, eighteen clients had extractions. In all eighteen cases there is appropriate documentation of a time-out procedure prior to the extraction. The client was asked to identify the extraction site and was also asked to identify themselves by providing their full name and date of birth.
Actions The dental clinic staff will continue to report and monitor performance of key safety strategies.
Page
8

(Glossary of Terms, Acronyms & Abbreviations) (Back to Table of Contents)
CAPITOL COMMUNITY CLINIC
ASPECT: MED MANAGEMENT CLINIC APPOINTMENT ASSESSMENT
Indicators Findings Compliance Threshold Percentile
October Thirty-one clients that had scheduled appointments had their vitals signs taken before their clinic appointment.
100%
100%
November There were thirty-one clients scheduled for appointments during the month of February. All clients had vital signs taken before their appointment.
100%
100%
All Outpatient clients will have Vital Signs and Weight recorded upon arrival for appointment.
December There were twenty clients scheduled for appointments. All clients had their vital signs taken before their clinic appointment.
100% 100%
Summary
For the 2nd quarter 2012 there were 82 clients. All clients had their vitals taken before their scheduled appointment. This information was reviewed at monthly staff meetings and reports forwarded quarterly to RPC Quality Council.
Actions Staff will continue to strive for 100% of the goal. Staff will monitor and report monthly, as well as quarterly to RPC.
Page
9
(Glossary of Terms, Acronyms & Abbreviations) (Back to Table of Contents)
CLIENT SATISFACTION ASPECT: CLIENT SATISFACTION WITH CARE
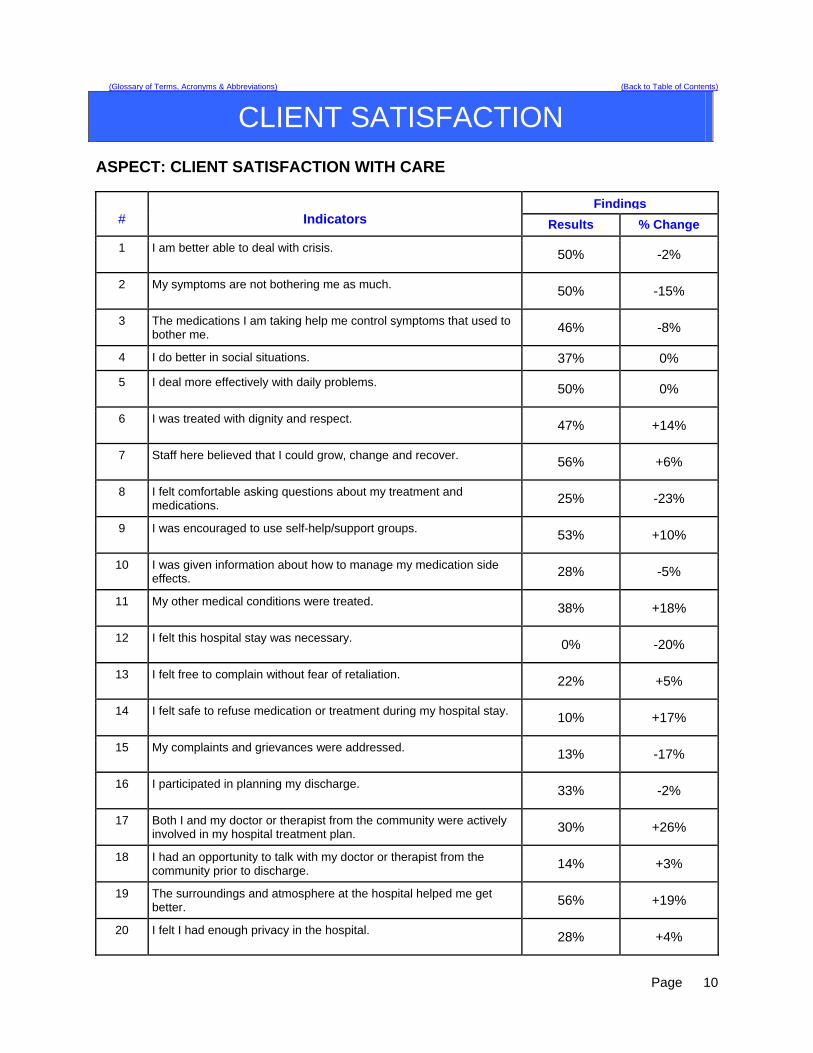
Findings # Indicators Results % Change
1 I am better able to deal with crisis. 50% -2%
2 My symptoms are not bothering me as much. 50% -15%
3 The medications I am taking help me control symptoms that used to bother me. 46% -8%
4 I do better in social situations. 37% 0%
5 I deal more effectively with daily problems. 50% 0%
6 I was treated with dignity and respect. 47% +14%
7 Staff here believed that I could grow, change and recover. 56% +6%
8 I felt comfortable asking questions about my treatment and medications. 25% -23%
9 I was encouraged to use self-help/support groups. 53% +10%
10 I was given information about how to manage my medication side effects. 28% -5%
11 My other medical conditions were treated. 38% +18%
12 I felt this hospital stay was necessary. 0% -20%
13 I felt free to complain without fear of retaliation. 22% +5%
14 I felt safe to refuse medication or treatment during my hospital stay. 10% +17%
15 My complaints and grievances were addressed. 13% -17%
16 I participated in planning my discharge. 33% -2%
17 Both I and my doctor or therapist from the community were actively involved in my hospital treatment plan. 30% +26%
18 I had an opportunity to talk with my doctor or therapist from the community prior to discharge. 14% +3%
19 The surroundings and atmosphere at the hospital helped me get better. 56% +19%
20 I felt I had enough privacy in the hospital. 28% +4%
Page
10

(Glossary of Terms, Acronyms & Abbreviations) (Back to Table of Contents)
CLIENT SATISFACTION
Findings# Indicators Results % Change
21 I felt safe while I was in the hospital. 38% -5%
22 The hospital environment was clean and comfortable. 47% -5%
23 Staff were sensitive to my cultural background. 17% +4%
24 My family and/or friends were able to visit me. 41% -22%
25 I had a choice of treatment options. 13% -4%
26 My contact with my doctor was helpful. 34% +1%
27 My contact with nurses and therapists was helpful. 47% -7%
28 If I had a choice of hospitals, I would still choose this one. 38% +8%
29 Did anyone tell you about your rights? 10% -23%
30 Are you told ahead of time of changes in your privileges, appointments, or daily routine? 9% -2%
31 Do you know someone who can help you get what you want or stand up for your rights? 19% -22%
32 My pain was managed. 25% +10%
ND = no data Summary
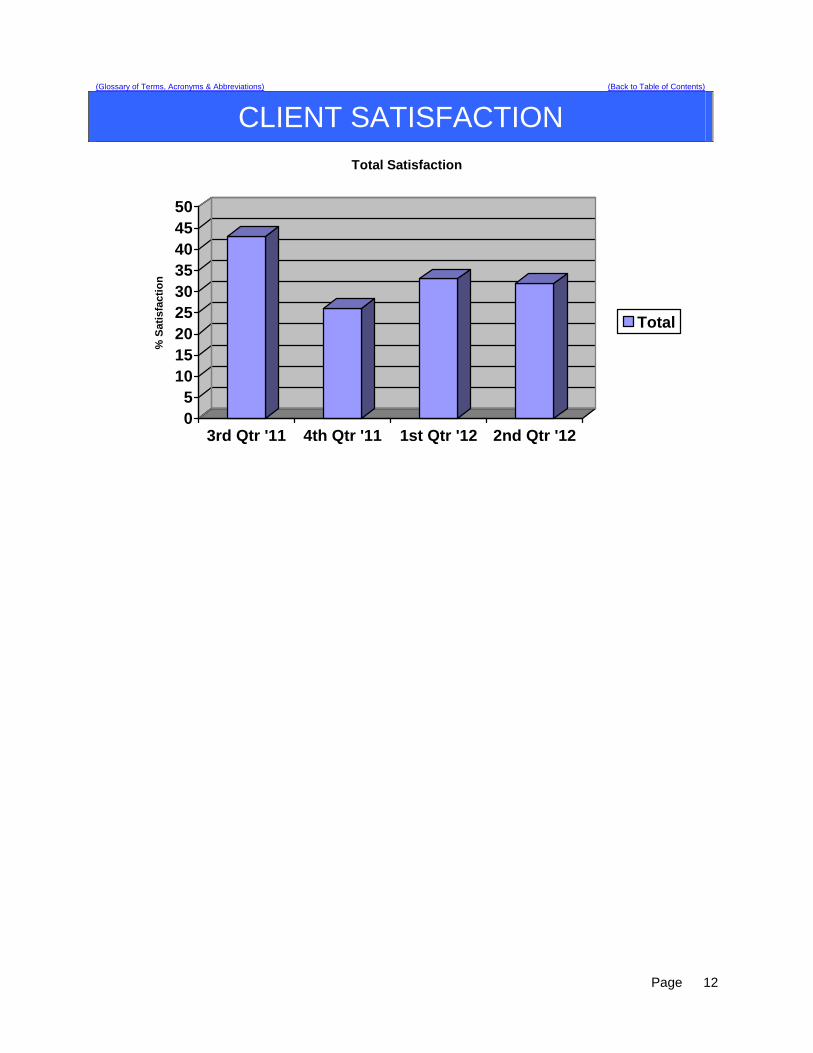
Positive scores indicate satisfaction, while negative scores indicate dissatisfaction. Percentages are calculated using actual weighted scores and highest possible score for each indicator. The total number of respondents was 16. The first column indicates the score for 2nd quarter and the second column shows increases/decreases from 1st quarter. Overall satisfaction for 2nd quarter decreased 1%. Of the 32 indicators, 14 increased and 18 decreased. The most significant increases were community involvement in treatment, other medical conditions being treated, and hospital atmosphere being helpful. The most significant decreases were around feeling safe to ask questions about treatment and medications, friends and family being able to visit, that the stay was necessary, and education and support with their rights. There are nine indicators that continue to rise (6, 7, 11, 13, 14, 19, 26, 28, and 32) and three that are continuing to drop (16, 25, and 30) over the last 2 quarters.
Page
11
(Glossary of Terms, Acronyms & Abbreviations) (Back to Table of Contents)
CLIENT SATISFACTION
05
101520253035404550
% S
atis
fact
ion
3rd Qtr '11 4th Qtr '11 1st Qtr '12 2nd Qtr '12
Total Satisfaction
Total
Page
12
(Glossary of Terms, Acronyms & Abbreviations) (Back to Table of Contents)
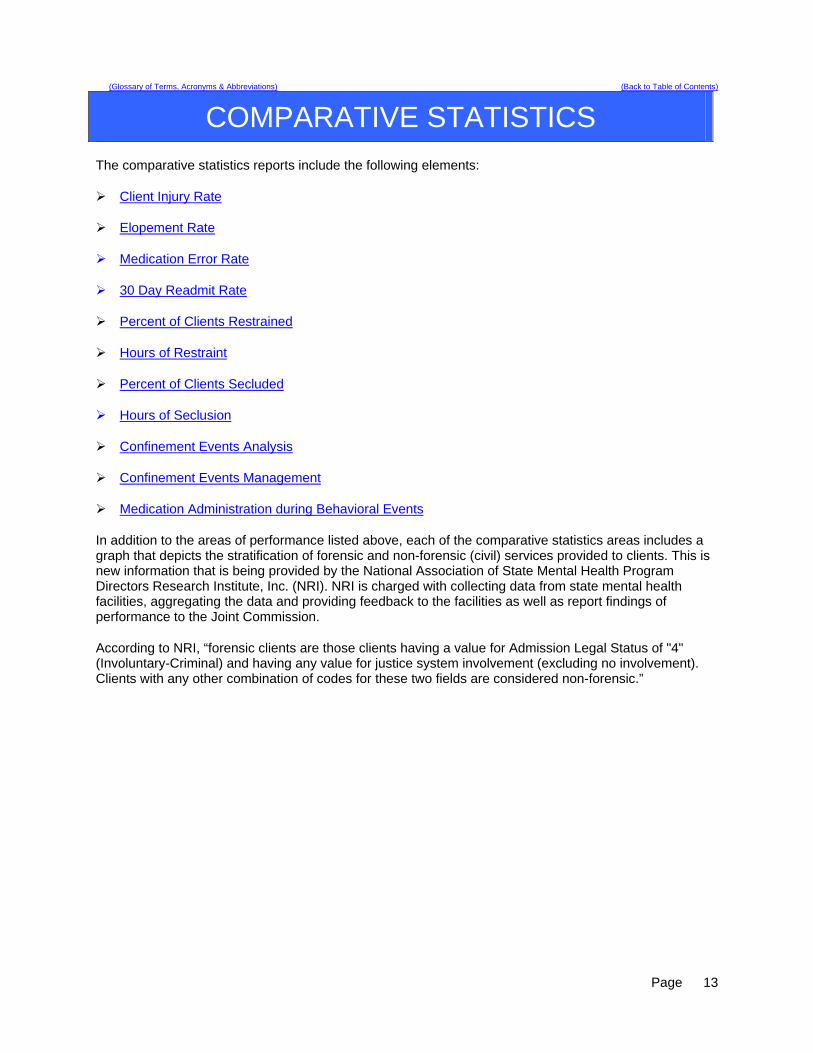
COMPARATIVE STATISTICS The comparative statistics reports include the following elements:
Client Injury Rate
Elopement Rate
Medication Error Rate
30 Day Readmit Rate
Percent of Clients Restrained
Hours of Restraint
Percent of Clients Secluded
Hours of Seclusion
Confinement Events Analysis
Confinement Events Management
Medication Administration during Behavioral Events
In addition to the areas of performance listed above, each of the comparative statistics areas includes a graph that depicts the stratification of forensic and non-forensic (civil) services provided to clients. This is new information that is being provided by the National Association of State Mental Health Program Directors Research Institute, Inc. (NRI). NRI is charged with collecting data from state mental health facilities, aggregating the data and providing feedback to the facilities as well as report findings of performance to the Joint Commission.
According to NRI, “forensic clients are those clients having a value for Admission Legal Status of "4" (Involuntary-Criminal) and having any value for justice system involvement (excluding no involvement). Clients with any other combination of codes for these two fields are considered non-forensic.”
Page
13
(Back to Comparative Statistics) (Back to Table of Contents)
COMPARATIVE STATISTICS
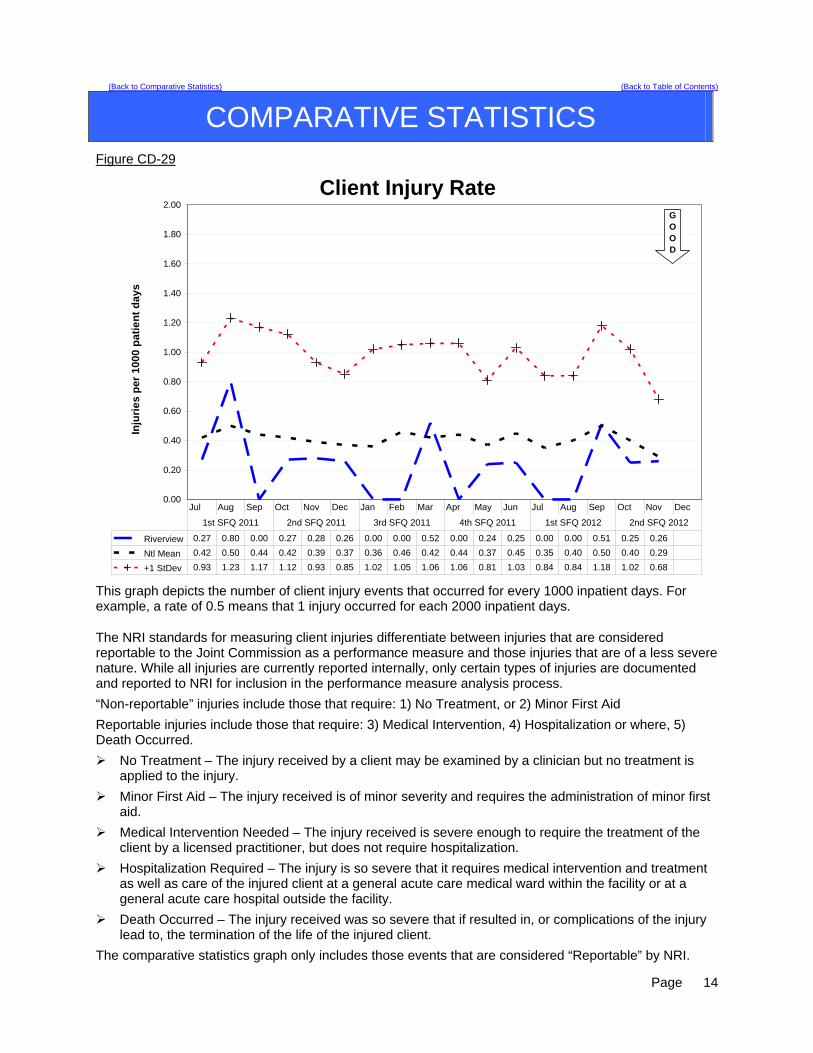
Figure CD-29
Client Injury Rate
0.00
0.20
0.40
0.60
0.80
1.00
1.20
1.40
1.60
1.80
2.00
Inju
rie
s p
er 1
000
pat
ien
t d
ays
Riverview 0.27 0.80 0.00 0.27 0.28 0.26 0.00 0.00 0.52 0.00 0.24 0.25 0.00 0.00 0.51 0.25 0.26
Ntl Mean 0.42 0.50 0.44 0.42 0.39 0.37 0.36 0.46 0.42 0.44 0.37 0.45 0.35 0.40 0.50 0.40 0.29
+1 StDev 0.93 1.23 1.17 1.12 0.93 0.85 1.02 1.05 1.06 1.06 0.81 1.03 0.84 0.84 1.18 1.02 0.68
Jul Aug Sep Oct Nov Dec Jan Feb Mar Apr May Jun Jul Aug Sep Oct Nov Dec
1st SFQ 2011 2nd SFQ 2011 3rd SFQ 2011 4th SFQ 2011 1st SFQ 2012 2nd SFQ 2012
GOOD
This graph depicts the number of client injury events that occurred for every 1000 inpatient days. For example, a rate of 0.5 means that 1 injury occurred for each 2000 inpatient days.
The NRI standards for measuring client injuries differentiate between injuries that are considered reportable to the Joint Commission as a performance measure and those injuries that are of a less severe nature. While all injuries are currently reported internally, only certain types of injuries are documented and reported to NRI for inclusion in the performance measure analysis process.
“Non-reportable” injuries include those that require: 1) No Treatment, or 2) Minor First Aid
Reportable injuries include those that require: 3) Medical Intervention, 4) Hospitalization or where, 5) Death Occurred.
No Treatment – The injury received by a client may be examined by a clinician but no treatment is applied to the injury.
Minor First Aid – The injury received is of minor severity and requires the administration of minor first aid.
Medical Intervention Needed – The injury received is severe enough to require the treatment of the client by a licensed practitioner, but does not require hospitalization.
Hospitalization Required – The injury is so severe that it requires medical intervention and treatment as well as care of the injured client at a general acute care medical ward within the facility or at a general acute care hospital outside the facility.
Death Occurred – The injury received was so severe that if resulted in, or complications of the injury lead to, the termination of the life of the injured client.
The comparative statistics graph only includes those events that are considered “Reportable” by NRI.
Page
14
(Back to Comparative Statistics) (Back to Table of Contents)
COMPARATIVE STATISTICS
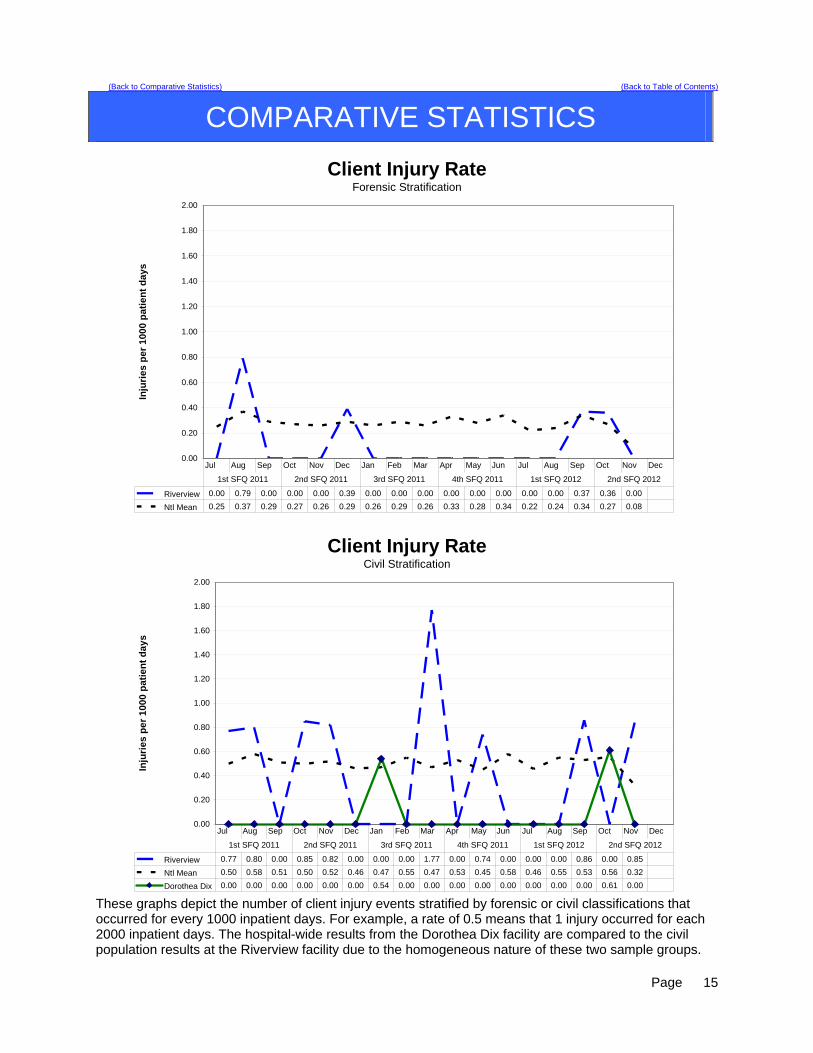
Client Injury RateForensic Stratification
0.00
0.20
0.40
0.60
0.80
1.00
1.20
1.40
1.60
1.80
2.00
Inju
rie
s p
er
10
00
pa
tien
t d
ay
s
Riverview 0.00 0.79 0.00 0.00 0.00 0.39 0.00 0.00 0.00 0.00 0.00 0.00 0.00 0.00 0.37 0.36 0.00
Ntl Mean 0.25 0.37 0.29 0.27 0.26 0.29 0.26 0.29 0.26 0.33 0.28 0.34 0.22 0.24 0.34 0.27 0.08
Jul Aug Sep Oct Nov Dec Jan Feb Mar Apr May Jun Jul Aug Sep Oct Nov Dec
1st SFQ 2011 2nd SFQ 2011 3rd SFQ 2011 4th SFQ 2011 1st SFQ 2012 2nd SFQ 2012
Client Injury RateCivil Stratification
0.00
0.20
0.40
0.60
0.80
1.00
1.20
1.40
1.60
1.80
2.00
Inju
rie
s p
er
10
00
pat
ien
t d
ay
s
Riverview 0.77 0.80 0.00 0.85 0.82 0.00 0.00 0.00 1.77 0.00 0.74 0.00 0.00 0.00 0.86 0.00 0.85
Ntl Mean 0.50 0.58 0.51 0.50 0.52 0.46 0.47 0.55 0.47 0.53 0.45 0.58 0.46 0.55 0.53 0.56 0.32
Dorothea Dix 0.00 0.00 0.00 0.00 0.00 0.00 0.54 0.00 0.00 0.00 0.00 0.00 0.00 0.00 0.00 0.61 0.00
Jul Aug Sep Oct Nov Dec Jan Feb Mar Apr May Jun Jul Aug Sep Oct Nov Dec
1st SFQ 2011 2nd SFQ 2011 3rd SFQ 2011 4th SFQ 2011 1st SFQ 2012 2nd SFQ 2012
These graphs depict the number of client injury events stratified by forensic or civil classifications that occurred for every 1000 inpatient days. For example, a rate of 0.5 means that 1 injury occurred for each 2000 inpatient days. The hospital-wide results from the Dorothea Dix facility are compared to the civil population results at the Riverview facility due to the homogeneous nature of these two sample groups.
Page
15

(Back to Comparative Statistics) (Back to Table of Contents)
COMPARATIVE STATISTICS
ASPECT: SEVERITY OF INJURY BY MONTH
Severity Oct Nov Dec 2nd FQ 2012 No Treatment 1 1 Minor First Aid 3 3 Medical Intervention Required 1 2 3 Hospitalization Required 0 Death Occurred 1 1 Total 1 5 2 ASPECT: TYPE AND CAUSE OF INJURY BY MONTH
Type - Cause Oct Nov Dec 2nd FQ 2012 Accident – Fall Unwitnessed 1 1 1 3 Accident – Fall Witnessed 1 1 Accident – Other 1 1 Self-Injurious Behavior 3 3 The incident that occurred which resulted in death began on the Lower Saco unit. The client was placed on medical leave prior to the pronouncement of death; therefore the NRI graph for the forensic stratification does not reflect the location of the event as part of the forensic events.
Page
16
(Back to Comparative Statistics) (Back to Table of Contents)
COMPARATIVE STATISTICS
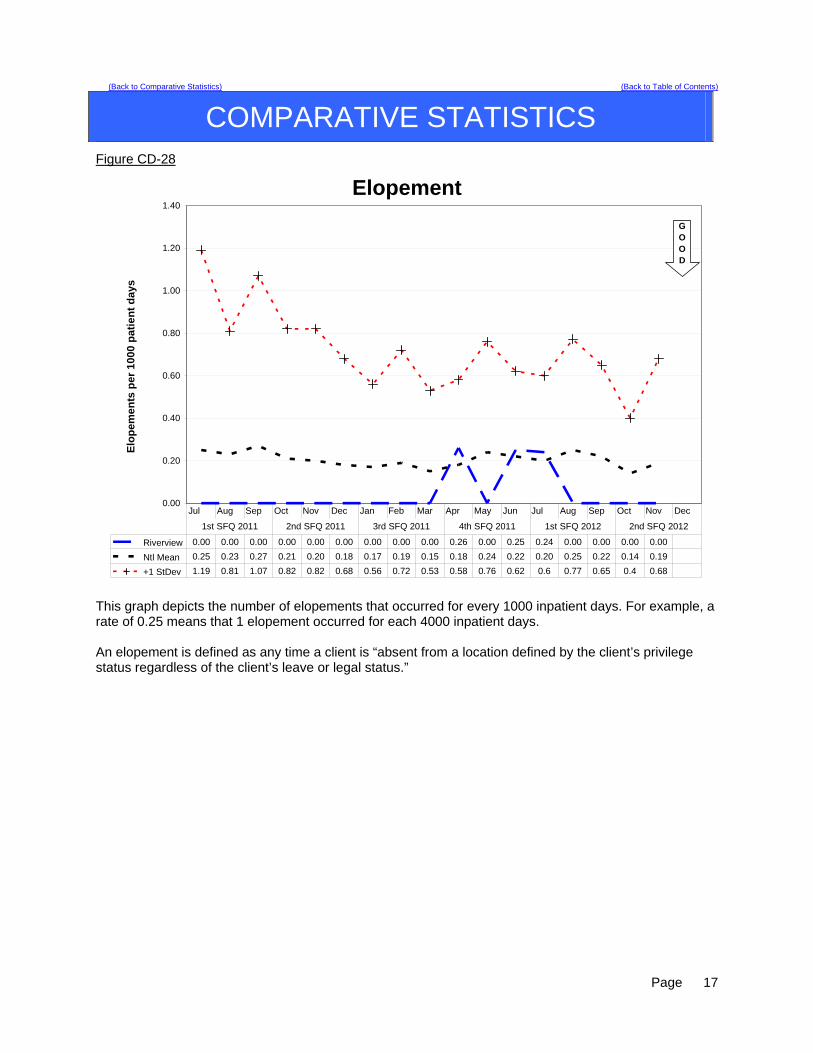
Figure CD-28
Elopement
0.00
0.20
0.40
0.60
0.80
1.00
1.20
1.40
Elo
pe
me
nts
pe
r 1
00
0 p
ati
en
t d
ay
s
Riverview 0.00 0.00 0.00 0.00 0.00 0.00 0.00 0.00 0.00 0.26 0.00 0.25 0.24 0.00 0.00 0.00 0.00
Ntl Mean 0.25 0.23 0.27 0.21 0.20 0.18 0.17 0.19 0.15 0.18 0.24 0.22 0.20 0.25 0.22 0.14 0.19
+1 StDev 1.19 0.81 1.07 0.82 0.82 0.68 0.56 0.72 0.53 0.58 0.76 0.62 0.6 0.77 0.65 0.4 0.68
Jul Aug Sep Oct Nov Dec Jan Feb Mar Apr May Jun Jul Aug Sep Oct Nov Dec
1st SFQ 2011 2nd SFQ 2011 3rd SFQ 2011 4th SFQ 2011 1st SFQ 2012 2nd SFQ 2012
GOOD
This graph depicts the number of elopements that occurred for every 1000 inpatient days. For example, a rate of 0.25 means that 1 elopement occurred for each 4000 inpatient days. An elopement is defined as any time a client is “absent from a location defined by the client’s privilege status regardless of the client’s leave or legal status.”
Page
17
(Back to Comparative Statistics) (Back to Table of Contents)
COMPARATIVE STATISTICS
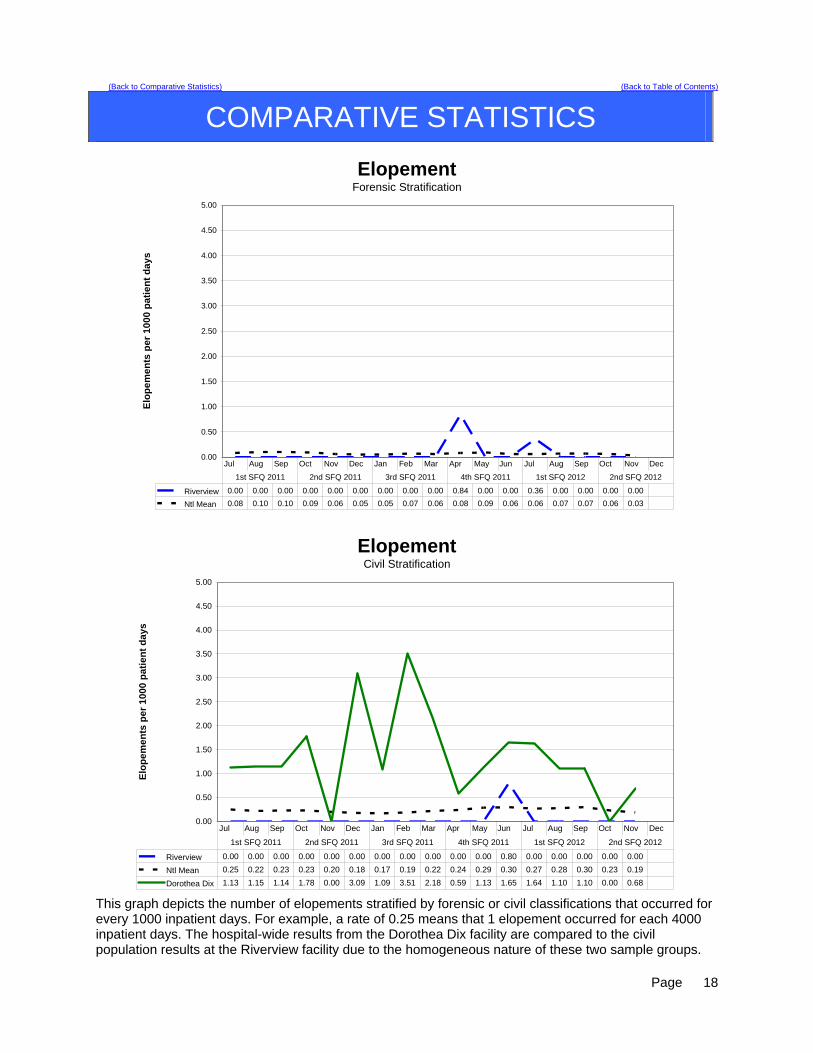
ElopementForensic Stratification
0.00
0.50
1.00
1.50
2.00
2.50
3.00
3.50
4.00
4.50
5.00
Elo
pe
me
nts
pe
r 1
00
0 p
ati
en
t d
ay
s
Riverview 0.00 0.00 0.00 0.00 0.00 0.00 0.00 0.00 0.00 0.84 0.00 0.00 0.36 0.00 0.00 0.00 0.00
Ntl Mean 0.08 0.10 0.10 0.09 0.06 0.05 0.05 0.07 0.06 0.08 0.09 0.06 0.06 0.07 0.07 0.06 0.03
Jul Aug Sep Oct Nov Dec Jan Feb Mar Apr May Jun Jul Aug Sep Oct Nov Dec
1st SFQ 2011 2nd SFQ 2011 3rd SFQ 2011 4th SFQ 2011 1st SFQ 2012 2nd SFQ 2012
ElopementCivil Stratification
0.00
0.50
1.00
1.50
2.00
2.50
3.00
3.50
4.00
4.50
5.00
Elo
pe
me
nts
pe
r 1
00
0 p
ati
en
t d
ay
s
Riverview 0.00 0.00 0.00 0.00 0.00 0.00 0.00 0.00 0.00 0.00 0.00 0.80 0.00 0.00 0.00 0.00 0.00
Ntl Mean 0.25 0.22 0.23 0.23 0.20 0.18 0.17 0.19 0.22 0.24 0.29 0.30 0.27 0.28 0.30 0.23 0.19
Dorothea Dix 1.13 1.15 1.14 1.78 0.00 3.09 1.09 3.51 2.18 0.59 1.13 1.65 1.64 1.10 1.10 0.00 0.68
Jul Aug Sep Oct Nov Dec Jan Feb Mar Apr May Jun Jul Aug Sep Oct Nov Dec
1st SFQ 2011 2nd SFQ 2011 3rd SFQ 2011 4th SFQ 2011 1st SFQ 2012 2nd SFQ 2012
This graph depicts the number of elopements stratified by forensic or civil classifications that occurred for every 1000 inpatient days. For example, a rate of 0.25 means that 1 elopement occurred for each 4000 inpatient days. The hospital-wide results from the Dorothea Dix facility are compared to the civil population results at the Riverview facility due to the homogeneous nature of these two sample groups.
Page
18
(Back to Comparative Statistics) (Back to Table of Contents)
COMPARATIVE STATISTICS
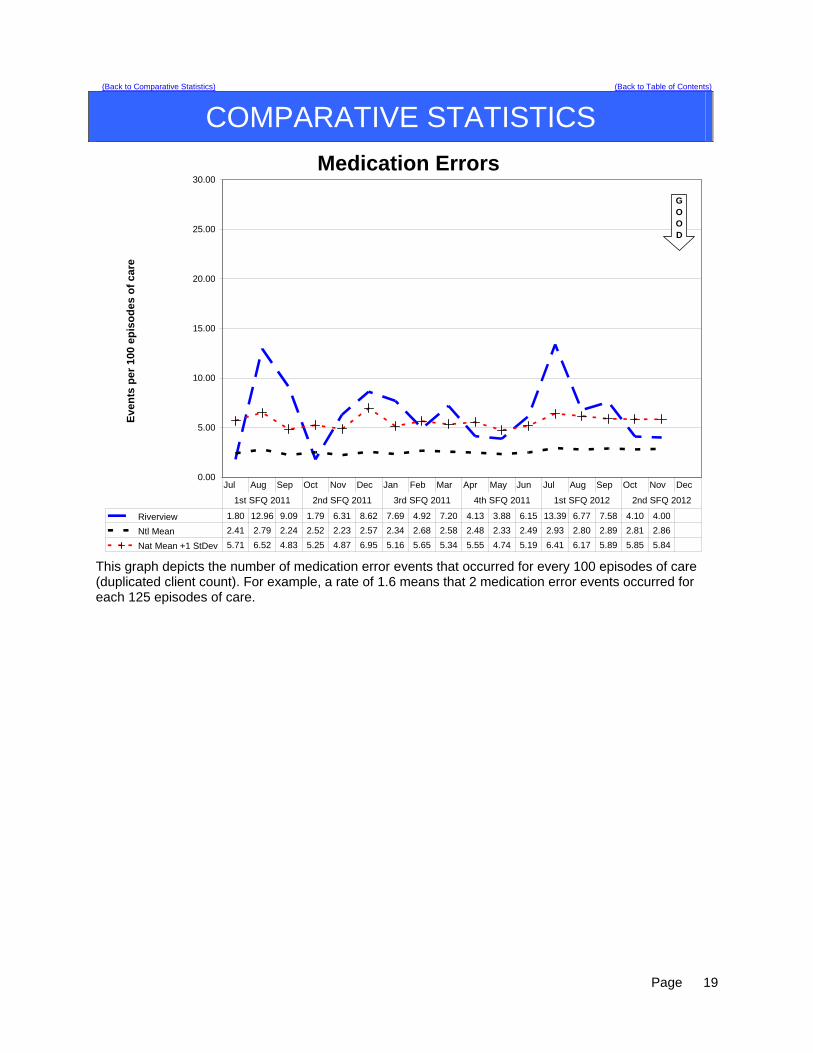
Medication Errors
0.00
5.00
10.00
15.00
20.00
25.00
30.00
Ev
en
ts p
er
10
0 e
pis
od
es
of
ca
re
Riverview 1.80 12.96 9.09 1.79 6.31 8.62 7.69 4.92 7.20 4.13 3.88 6.15 13.39 6.77 7.58 4.10 4.00
Ntl Mean 2.41 2.79 2.24 2.52 2.23 2.57 2.34 2.68 2.58 2.48 2.33 2.49 2.93 2.80 2.89 2.81 2.86
Nat Mean +1 StDev 5.71 6.52 4.83 5.25 4.87 6.95 5.16 5.65 5.34 5.55 4.74 5.19 6.41 6.17 5.89 5.85 5.84
Jul Aug Sep Oct Nov Dec Jan Feb Mar Apr May Jun Jul Aug Sep Oct Nov Dec
1st SFQ 2011 2nd SFQ 2011 3rd SFQ 2011 4th SFQ 2011 1st SFQ 2012 2nd SFQ 2012
GOOD
This graph depicts the number of medication error events that occurred for every 100 episodes of care (duplicated client count). For example, a rate of 1.6 means that 2 medication error events occurred for each 125 episodes of care.
Page
19

(Back to Comparative Statistics) (Back to Table of Contents)
COMPARATIVE STATISTICS
Medication ErrorsForensic Stratification
0.00
5.00
10.00
15.00
20.00
25.00
30.00
Eve
nts
per
100
Ep
iso
des
of
Car
e
Riverview 3.57 1.79 5.26 3.51 5.56 3.39 6.15 4.55 5.80 5.88 1.37 5.48 16.67 1.37 5.41 1.54 1.45
Ntl Mean 2.40 2.16 2.22 2.05 2.44 3.66 2.12 2.51 2.37 2.29 2.04 1.93 1.87 2.02 2.12 2.13 1.18
Jul Aug Sep Oct Nov Dec Jan Feb Mar Apr May Jun Jul Aug Sep Oct Nov Dec
1st SFQ 2011 2nd SFQ 2011 3rd SFQ 2011 4th SFQ 2011 1st SFQ 2012 2nd SFQ 2012
Medication ErrorsCivil Stratification
0.00
5.00
10.00
15.00
20.00
25.00
30.00
Eve
nts
per
100
Ep
iso
de
s o
f C
are
Riverview 0.00 19.23 7.55 0.00 3.51 8.77 1.92 5.36 7.14 1.89 7.14 7.02 3.64 8.33 8.62 5.26 3.57
Ntl Mean 2.46 2.56 2.24 2.26 2.03 2.01 2.39 2.37 2.28 2.24 2.34 2.42 2.57 2.41 2.86 2.52 2.33
Dorothea Dix 24.36 5.26 6.41 13.58 3.49 10.98 12.36 12.82 8.89 9.21 0.00 14.12 9.52 15.12 14.12 2.90 4.48
Jul Aug Sep Oct Nov Dec Jan Feb Mar Apr May Jun Jul Aug Sep Oct Nov Dec
1st SFQ 2011 2nd SFQ 2011 3rd SFQ 2011 4th SFQ 2011 1st SFQ 2012 2nd SFQ 2012
This graph depicts the number of medication error events stratified by forensic or civil classifications that occurred for every 100 episodes of care (duplicated client count). For example, a rate of 1.6 means that 2 medication error events occurred for each 125 episodes of care. The hospital-wide results from the Dorothea Dix facility are compared to the civil population results at the Riverview facility due to the homogeneous nature of these two sample groups.
Page
20
(Back to Comparative Statistics) (Back to Table of Contents)
COMPARATIVE STATISTICS
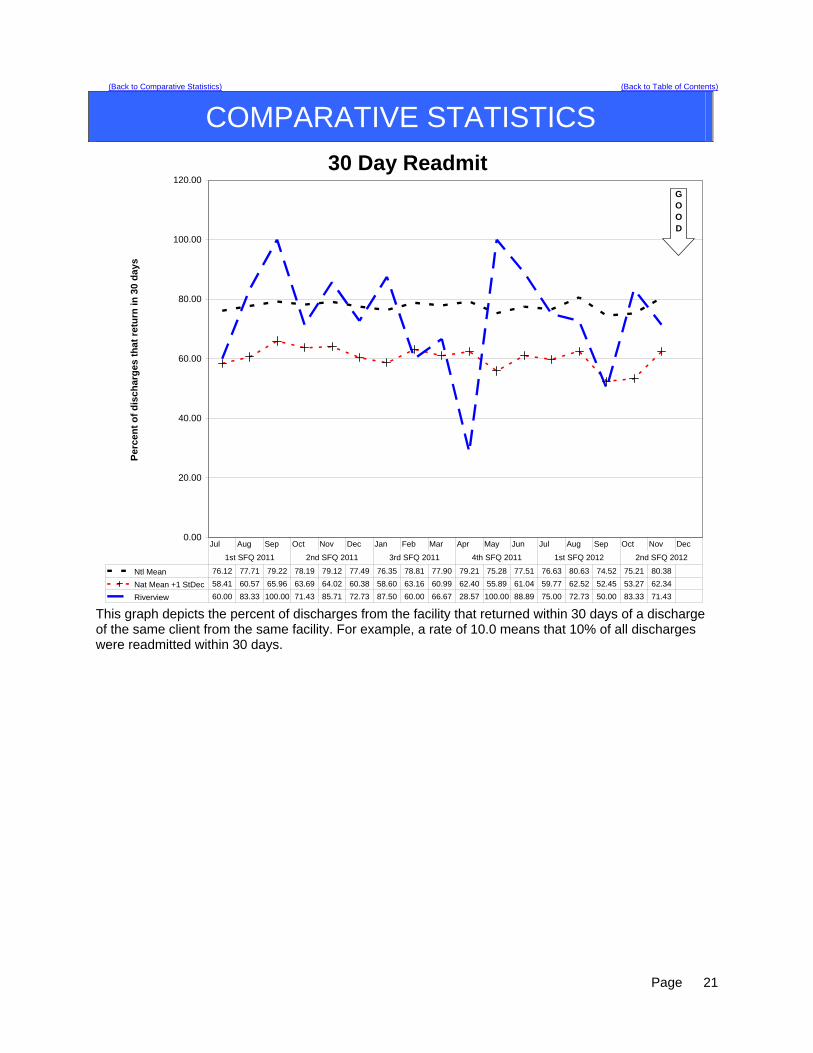
30 Day Readmit
0.00
20.00
40.00
60.00
80.00
100.00
120.00
Pe
rce
nt
of
dis
ch
arg
es
th
at
retu
rn i
n 3
0 d
ay
s
Ntl Mean 76.12 77.71 79.22 78.19 79.12 77.49 76.35 78.81 77.90 79.21 75.28 77.51 76.63 80.63 74.52 75.21 80.38
Nat Mean +1 StDec 58.41 60.57 65.96 63.69 64.02 60.38 58.60 63.16 60.99 62.40 55.89 61.04 59.77 62.52 52.45 53.27 62.34
Riverview 60.00 83.33 100.00 71.43 85.71 72.73 87.50 60.00 66.67 28.57 100.00 88.89 75.00 72.73 50.00 83.33 71.43
Jul Aug Sep Oct Nov Dec Jan Feb Mar Apr May Jun Jul Aug Sep Oct Nov Dec
1st SFQ 2011 2nd SFQ 2011 3rd SFQ 2011 4th SFQ 2011 1st SFQ 2012 2nd SFQ 2012
GOOD
This graph depicts the percent of discharges from the facility that returned within 30 days of a discharge of the same client from the same facility. For example, a rate of 10.0 means that 10% of all discharges were readmitted within 30 days.
Page
21
(Back to Comparative Statistics) (Back to Table of Contents)
COMPARATIVE STATISTICS
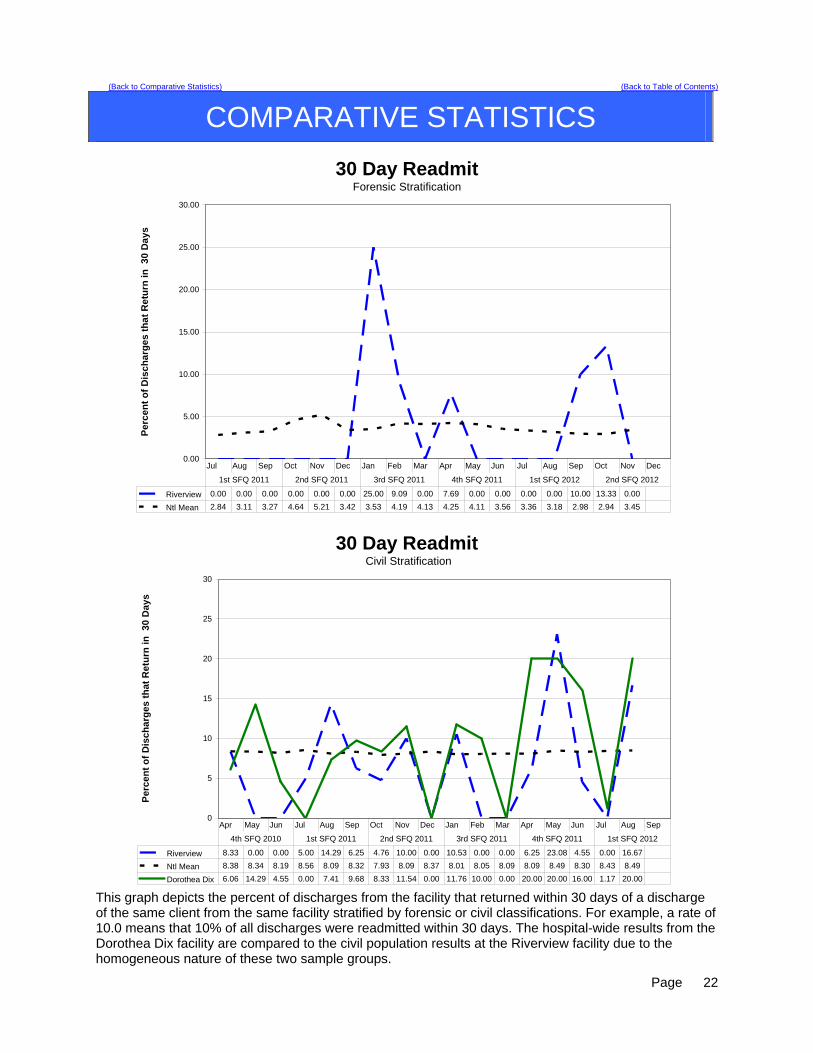
30 Day ReadmitForensic Stratification
0.00
5.00
10.00
15.00
20.00
25.00
30.00
Per
cen
t o
f D
isc
ha
rge
s th
at
Re
turn
in
30
Da
ys
Riverview 0.00 0.00 0.00 0.00 0.00 0.00 25.00 9.09 0.00 7.69 0.00 0.00 0.00 0.00 10.00 13.33 0.00
Ntl Mean 2.84 3.11 3.27 4.64 5.21 3.42 3.53 4.19 4.13 4.25 4.11 3.56 3.36 3.18 2.98 2.94 3.45
Jul Aug Sep Oct Nov Dec Jan Feb Mar Apr May Jun Jul Aug Sep Oct Nov Dec
1st SFQ 2011 2nd SFQ 2011 3rd SFQ 2011 4th SFQ 2011 1st SFQ 2012 2nd SFQ 2012
30 Day Readmit Civil Stratification
0
5
10
15
20
25
30
Per
cen
t o
f D
isch
arg
es t
hat
Ret
urn
in
30
Day
s
Riverview 8.33 0.00 0.00 5.00 14.29 6.25 4.76 10.00 0.00 10.53 0.00 0.00 6.25 23.08 4.55 0.00 16.67
Ntl Mean 8.38 8.34 8.19 8.56 8.09 8.32 7.93 8.09 8.37 8.01 8.05 8.09 8.09 8.49 8.30 8.43 8.49
Dorothea Dix 6.06 14.29 4.55 0.00 7.41 9.68 8.33 11.54 0.00 11.76 10.00 0.00 20.00 20.00 16.00 1.17 20.00
Apr May Jun Jul Aug Sep Oct Nov Dec Jan Feb Mar Apr May Jun Jul Aug Sep
4th SFQ 2010 1st SFQ 2011 2nd SFQ 2011 3rd SFQ 2011 4th SFQ 2011 1st SFQ 2012
This graph depicts the percent of discharges from the facility that returned within 30 days of a discharge of the same client from the same facility stratified by forensic or civil classifications. For example, a rate of 10.0 means that 10% of all discharges were readmitted within 30 days. The hospital-wide results from the Dorothea Dix facility are compared to the civil population results at the Riverview facility due to the homogeneous nature of these two sample groups.
Page
22
(Back to Comparative Statistics) (Back to Table of Contents)
COMPARATIVE STATISTICS
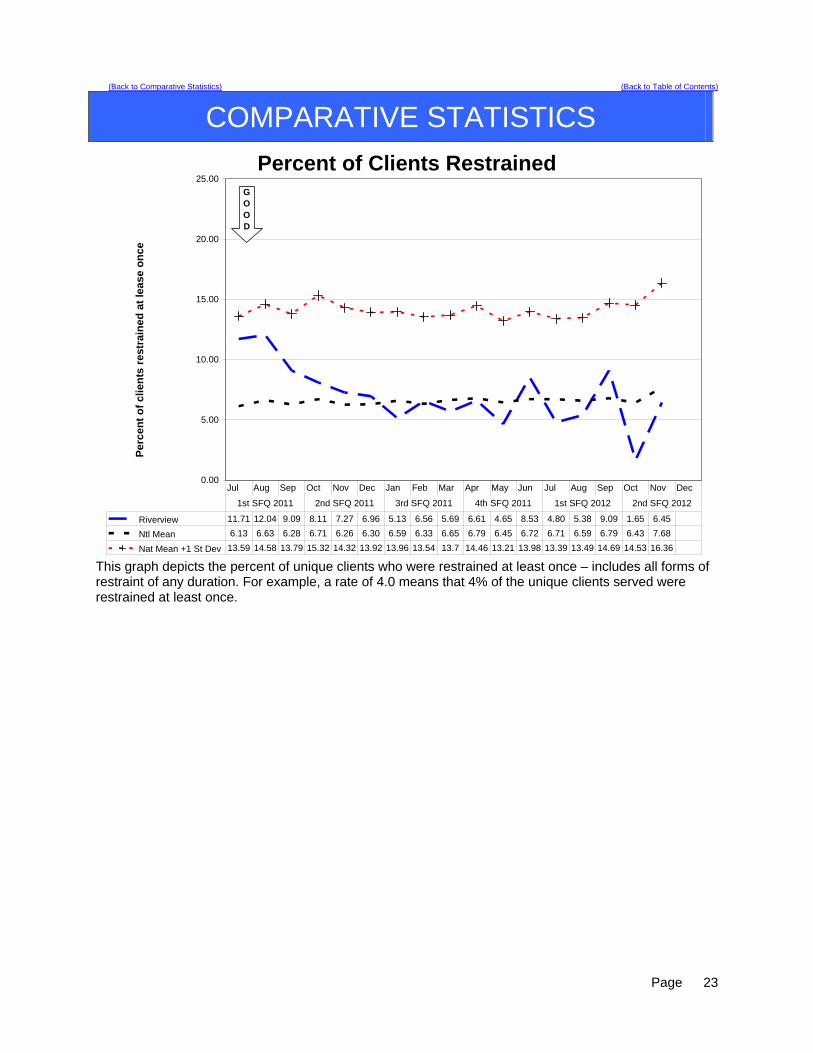
Percent of Clients Restrained
0.00
5.00
10.00
15.00
20.00
25.00
Pe
rce
nt
of
clie
nts
re
str
ain
ed
at
lea
se
on
ce
Riverview 11.71 12.04 9.09 8.11 7.27 6.96 5.13 6.56 5.69 6.61 4.65 8.53 4.80 5.38 9.09 1.65 6.45
Ntl Mean 6.13 6.63 6.28 6.71 6.26 6.30 6.59 6.33 6.65 6.79 6.45 6.72 6.71 6.59 6.79 6.43 7.68
Nat Mean +1 St Dev 13.59 14.58 13.79 15.32 14.32 13.92 13.96 13.54 13.7 14.46 13.21 13.98 13.39 13.49 14.69 14.53 16.36
Jul Aug Sep Oct Nov Dec Jan Feb Mar Apr May Jun Jul Aug Sep Oct Nov Dec
1st SFQ 2011 2nd SFQ 2011 3rd SFQ 2011 4th SFQ 2011 1st SFQ 2012 2nd SFQ 2012
GOOD
This graph depicts the percent of unique clients who were restrained at least once – includes all forms of restraint of any duration. For example, a rate of 4.0 means that 4% of the unique clients served were restrained at least once.
Page
23
(Back to Comparative Statistics) (Back to Table of Contents)
COMPARATIVE STATISTICS
Percent of Clients RestrainedForensic Stratification
0
5
10
15
20
25
Per
cen
t o
f C
lien
ts R
estr
ain
ed
At
Lea
st O
nce
Riverview 1.79 5.36 3.51 5.26 7.41 3.45 0 4.55 2.9 2.94 1.37 5.48 5.56 5.56 5.41 0 2.9
Ntl Mean 3.92 3.89 3.45 3.41 3.64 3.74 3.88 3.45 4.11 4.15 3.97 4.04 4.38 4.12 3.87 3.19 4.31
Jul Aug Sep Oct Nov Dec Jan Feb Mar Apr May Jun Jul Aug Sep Oct Nov Dec
1st SFQ 2011 2nd SFQ 2011 3rd SFQ 2011 4th SFQ 2011 1st SFQ 2012 2nd SFQ 2012
Percent of Clients Restrained Civil Stratification
0
5
10
15
20
25
Per
ce
nt
of
Cli
en
ts R
est
rain
ed
At
Lea
st
On
ce
Riverview 21.82 19.23 15.09 11.11 7.14 10.53 11.54 8.93 9.26 11.32 8.93 12.5 3.77 5.17 13.79 3.57 10.91
Ntl Mean 5.48 5.65 5.68 5.93 5.77 5.79 6.09 5.72 5.96 6.14 5.94 6.37 6.31 6.25 6.33 3.02 7.63
Dorothea Dix 7.79 7.89 5.06 4.94 6.02 6.17 8.14 5.13 5.75 8.00 5.26 10.84 7.41 8.43 6.02 4.41 9.09
Jul Aug Sep Oct Nov Dec Jan Feb Mar Apr May Jun Jul Aug Sep Oct Nov Dec
1st SFQ 2011 2nd SFQ 2011 3rd SFQ 2011 4th SFQ 2011 1st SFQ 2012 2nd SFQ 2012
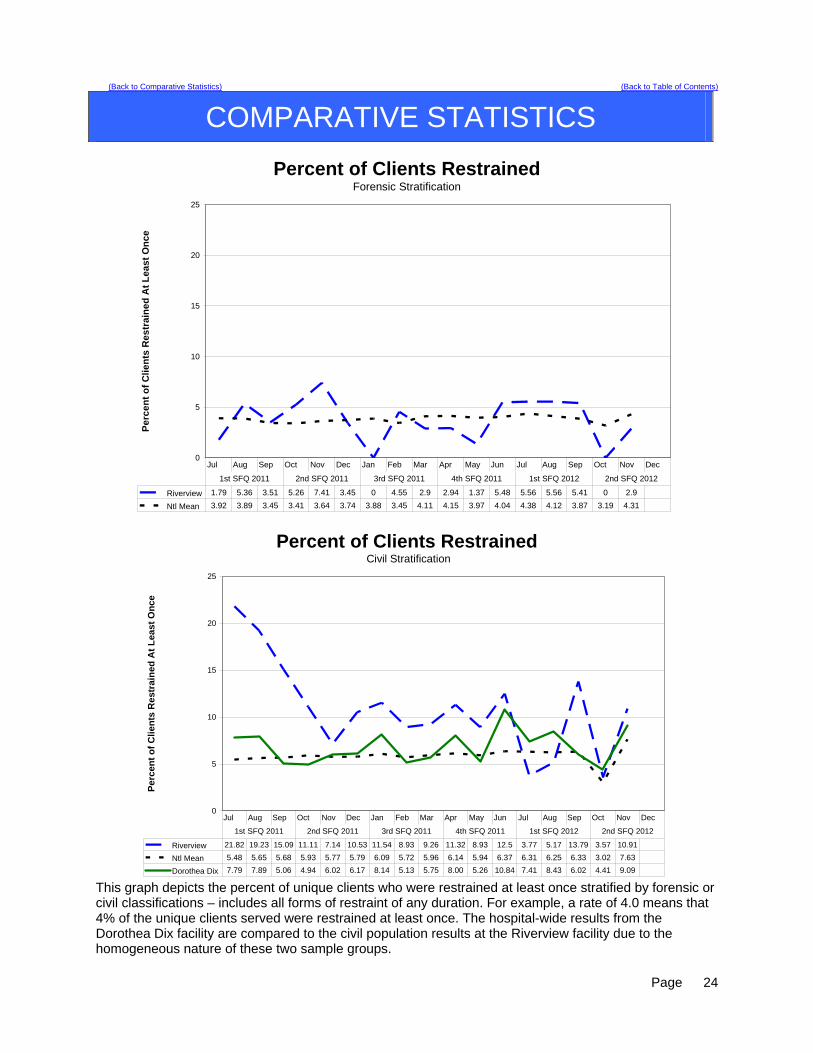
This graph depicts the percent of unique clients who were restrained at least once stratified by forensic or civil classifications – includes all forms of restraint of any duration. For example, a rate of 4.0 means that 4% of the unique clients served were restrained at least once. The hospital-wide results from the Dorothea Dix facility are compared to the civil population results at the Riverview facility due to the homogeneous nature of these two sample groups.
Page
24
(Back to Comparative Statistics) (Back to Table of Contents)
COMPARATIVE STATISTICS
Figure CD-24
Restraint Hours
0.00
0.20
0.40
0.60
0.80
1.00
1.20
1.40
1.60
Re
str
ain
t h
ou
rs p
er
10
00
in
pa
tie
nt
ho
urs
Riverview 0.13 0.12 0.07 0.05 0.11 0.06 0.01 0.06 0.03 0.10 0.02 0.03 0.01 0.03 0.04 0.00 0.04
Ntl Mean 0.33 0.36 0.34 0.33 0.34 0.30 0.37 0.38 0.37 0.41 0.35 0.34 0.39 0.36 0.44 0.37 0.32
Nat Mean +1 StDev 1.1 1.14 1.09 1.03 1.12 1.02 1.38 1.34 1.15 1.4 1.07 1.02 1.23 1.06 1.45 1.07 0.98
Jul Aug Sep Oct Nov Dec Jan Feb Mar Apr May Jun Jul Aug Sep Oct Nov Dec
1st SFQ 2011 2nd SFQ 2011 3rd SFQ 2011 4th SFQ 2011 1st SFQ 2012 2nd SFQ 2012
GOOD
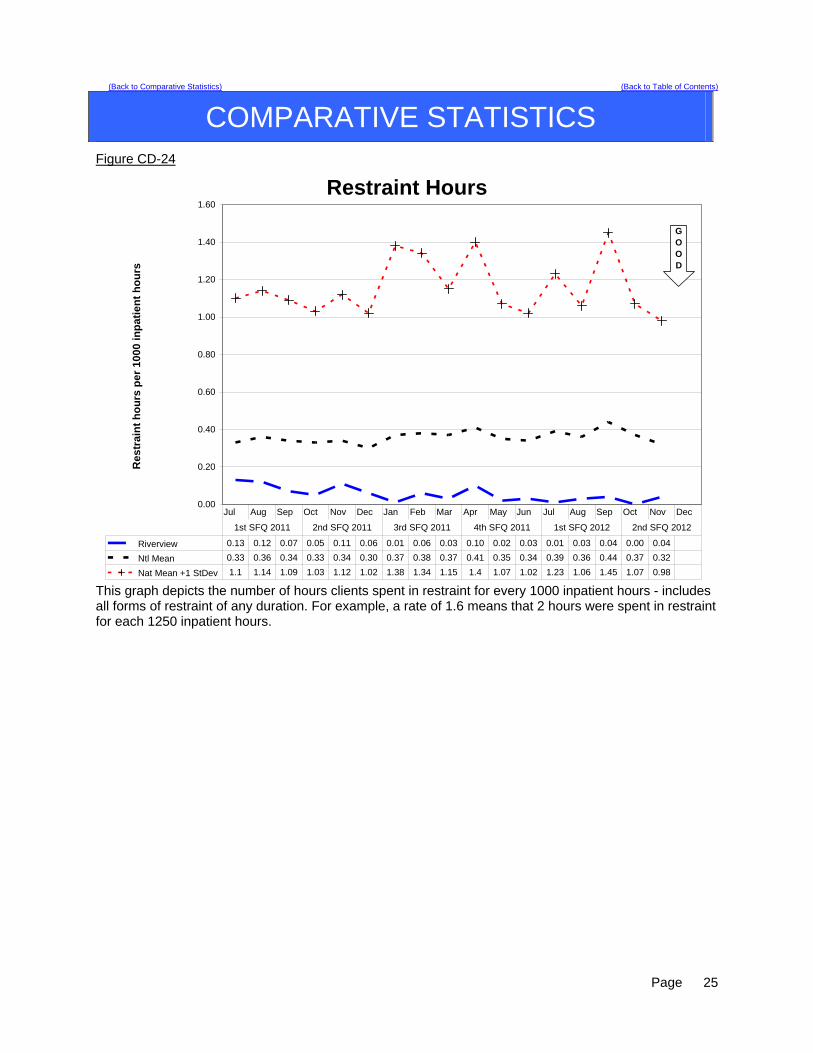
This graph depicts the number of hours clients spent in restraint for every 1000 inpatient hours - includes all forms of restraint of any duration. For example, a rate of 1.6 means that 2 hours were spent in restraint for each 1250 inpatient hours.
Page
25
(Back to Comparative Statistics) (Back to Table of Contents)
COMPARATIVE STATISTICS
Restraint HoursForensic Stratification
0.00
0.50
1.00
1.50
2.00
2.50
Res
trai
nt
Ho
urs
per
10
00 I
np
ati
ent
Ho
urs
Riverview 0.03 0.11 0.01 0.02 0.17 0.01 0.00 0.03 0.00 0.10 0.00 0.03 0.02 0.05 0.02 0.00 0.03
Ntl Mean 0.57 0.54 0.48 0.41 0.34 0.38 0.51 0.48 0.53 0.55 0.50 0.41 0.37 0.47 0.55 0.59 0.20
Jul Aug Sep Oct Nov Dec Jan Feb Mar Apr May Jun Jul Aug Sep Oct Nov Dec
1st SFQ 2011 2nd SFQ 2011 3rd SFQ 2011 4th SFQ 2011 1st SFQ 2012 2nd SFQ 2012
Restraint Hours Civil Stratification
0.00
0.50
1.00
1.50
2.00
2.50
Re
str
ain
t H
ou
rs p
er
100
0 In
pa
tien
t H
ou
rs
Riverview 0.26 0.13 0.15 0.08 0.04 0.13 0.03 0.10 0.08 0.09 0.04 0.03 0.00 0.00 0.07 0.00 0.05
Ntl Mean 0.34 0.31 0.30 0.35 0.40 0.32 0.37 0.41 0.42 0.37 0.32 0.40 0.48 0.37 0.53 0.33 0.35
Dorothea Dix 0.01 0.05 0.01 0.00 0.00 0.01 0.02 0.01 0.01 0.01 0.00 0.02 0.01 0.01 0.00 0.00 0.02
Jul Aug Sep Oct Nov Dec Jan Feb Mar Apr May Jun Jul Aug Sep Oct Nov Dec
1st SFQ 2011 2nd SFQ 2011 3rd SFQ 2011 4th SFQ 2011 1st SFQ 2012 2nd SFQ 2012
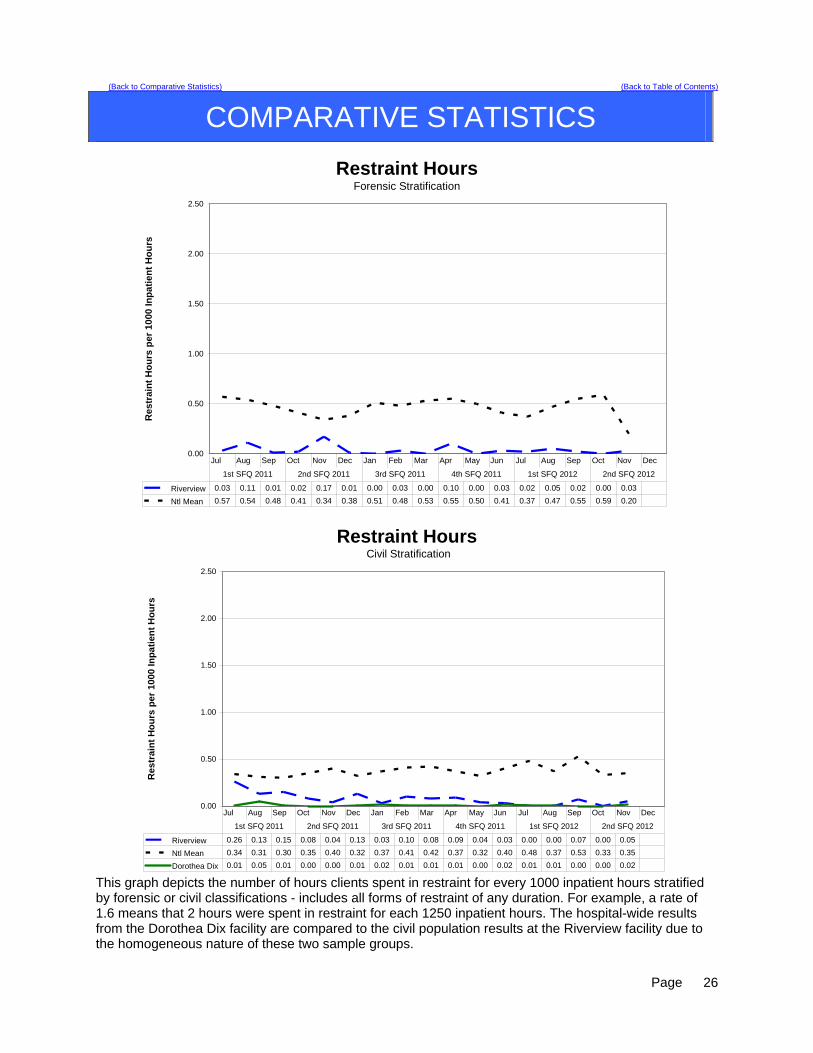
This graph depicts the number of hours clients spent in restraint for every 1000 inpatient hours stratified by forensic or civil classifications - includes all forms of restraint of any duration. For example, a rate of 1.6 means that 2 hours were spent in restraint for each 1250 inpatient hours. The hospital-wide results from the Dorothea Dix facility are compared to the civil population results at the Riverview facility due to the homogeneous nature of these two sample groups.
Page
26

(Back to Comparative Statistics) (Back to Table of Contents)
COMPARATIVE STATISTICS
Duration of Manual Hold (Restraint) EventsOctober - December 2011
9
8
0
1
15
2
0
2
4
6
8
10
12
14
16
1 Min 2 Min 3 Min 4 Min 5 Min > 5 Min
Nu
mb
er o
f E
ven
ts
The overall number of manual hold events as well as the number of clients restrained for greater than 5 minutes remained constant during the 1st quarter 2012. The overall decrease in the number of manual holds was 28% during the period (from 45 to 32). Manual holds greater than 5 minutes most often result from a clinical assessment of the clients acuity and the potential for injury should the patient be left alone and without the control afforded by the manual hold. Those clients with the greatest number of manual holds over five minutes are usually suicidal, exhibit self injurious behaviors, or are highly psychotic and require one on one control that other methods of containment (e.g. seclusion) do not offer. The decision on how each incident is managed is made on an individualized basis depending on the presentation and needs of the client. Each event is reviewed during the debriefing process and changes in methods of managing the events related to each client are evaluated to determine opportunities for improvement.
Page
27
(Back to Comparative Statistics) (Back to Table of Contents)
COMPARATIVE STATISTICS
Duration of Manual Hold (Restraint) EventsForensic and Civil Stratification
October - December 2011
8 8
2
0
14
1
0
1 1
0
2
4
6
8
10
12
14
16
1 Min 2 Min 3 Min 4 Min 5 Min > 5 Min
Nu
mb
er o
f E
ven
ts
Civil Forensic
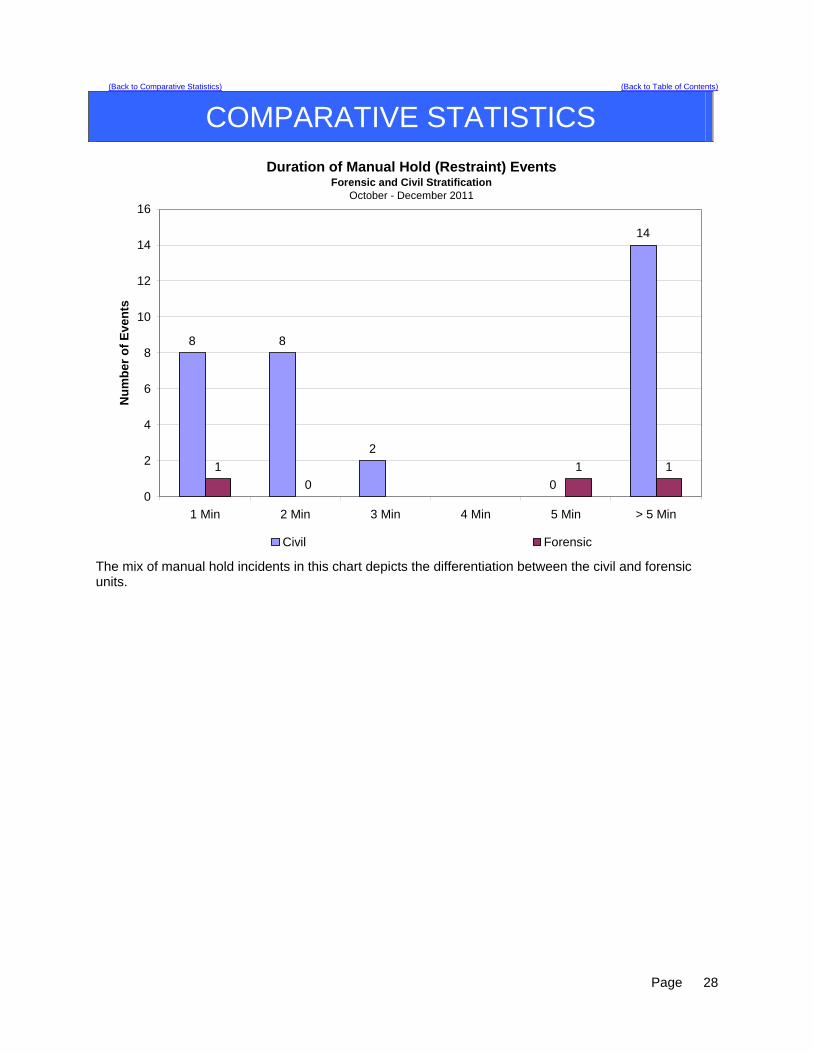
The mix of manual hold incidents in this chart depicts the differentiation between the civil and forensic units.
Page
28

(Back to Comparative Statistics) (Back to Table of Contents)
COMPARATIVE STATISTICS
Percent of Clients Secluded
0.00
1.00
2.00
3.00
4.00
5.00
6.00
7.00
8.00
9.00
10.00
Pe
rce
nt
of
clie
nts
se
clu
de
d a
t le
as
e o
nc
e
Riverview 5.41 5.56 5.45 5.41 3.64 3.48 4.27 4.92 3.25 6.61 3.88 3.88 6.40 4.62 5.30 1.65 4.84
Ntl Mean 2.71 2.94 3.02 2.92 2.63 2.56 2.62 2.69 2.83 2.91 2.75 2.52 2.57 2.50 2.30 2.50 2.30
Nat Mean +1 St Dev 7.14 8.16 8.61 7.89 6.83 6.95 7.3 7.59 7.88 8.01 7.41 6.23 6.27 6.4 5.33 6.03 5.29
Jul Aug Sep Oct Nov Dec Jan Feb Mar Apr May Jun Jul Aug Sep Oct Nov Dec
1st SFQ 2011 2nd SFQ 2011 3rd SFQ 2011 4th SFQ 2011 1st SFQ 2012 2nd SFQ 2012
GOOD
This graph depicts the percent of unique clients who were secluded at least once. For example, a rate of 3.0 means that 3% of the unique clients served were secluded at least once.
Page
29

(Back to Comparative Statistics) (Back to Table of Contents)
COMPARATIVE STATISTICS
Percent of Clients SecludedForensic Stratification
0.00
1.00
2.00
3.00
4.00
5.00
6.00
7.00
8.00
9.00
10.00
Pe
rcen
t o
f C
lien
ts S
ec
lud
ed
At
Le
ast
On
ce
Riverview 1.79 3.57 3.51 5.26 3.70 1.72 1.54 1.52 0.00 4.41 2.74 2.74 5.56 5.56 4.05 1.54 4.35
Ntl Mean 2.56 2.63 2.51 2.15 1.93 2.06 2.07 1.91 2.17 2.19 2.31 2.17 2.16 1.76 4.86 1.64 0.89
Jul Aug Sep Oct Nov Dec Jan Feb Mar Apr May Jun Jul Aug Sep Oct Nov Dec
1st SFQ 2011 2nd SFQ 2011 3rd SFQ 2011 4th SFQ 2011 1st SFQ 2012 2nd SFQ 2012
Percent of Clients Secluded Civil Stratification
0.00
1.00
2.00
3.00
4.00
5.00
6.00
7.00
8.00
9.00
10.00
Pe
rce
nt
of
Clie
nts
Se
clu
ded
At
Lea
st
On
ce
Riverview 9.09 7.69 7.55 5.56 3.57 5.26 7.69 8.93 7.41 9.43 5.36 5.36 7.55 3.45 6.9 1.79 5.45
Ntl Mean 2.50 2.46 2.52 2.51 2.45 2.46 2.56 2.32 2.53 2.63 2.45 2.41 2.51 2.43 2.4 2.82 3.29
Dorothea Dix 2.60 3.95 6.33 4.94 3.61 1.23 5.81 3.85 3.45 8.00 2.63 3.61 3.70 3.61 2.41 1.47 4.55
Jul Aug Sep Oct Nov Dec Jan Feb Mar Apr May Jun Jul Aug Sep Oct Nov Dec
1st SFQ 2011 2nd SFQ 2011 3rd SFQ 2011 4th SFQ 2011 1st SFQ 2012 2nd SFQ 2012
This graph depicts the percent of unique clients who were secluded at least once stratified by forensic or civil classifications. For example, a rate of 3.0 means that 3% of the unique clients served were secluded at least once. The hospital-wide results from the Dorothea Dix facility are compared to the civil population results at the Riverview facility due to the homogeneous nature of these two sample groups.
Page
30
(Back to Comparative Statistics) (Back to Table of Contents)
COMPARATIVE STATISTICS
Figure CD-23
Seclusion Hours
0.00
0.50
1.00
1.50
2.00
2.50
3.00
Se
clu
sio
n h
ou
rs p
er 1
000
inp
atie
nt
ho
urs
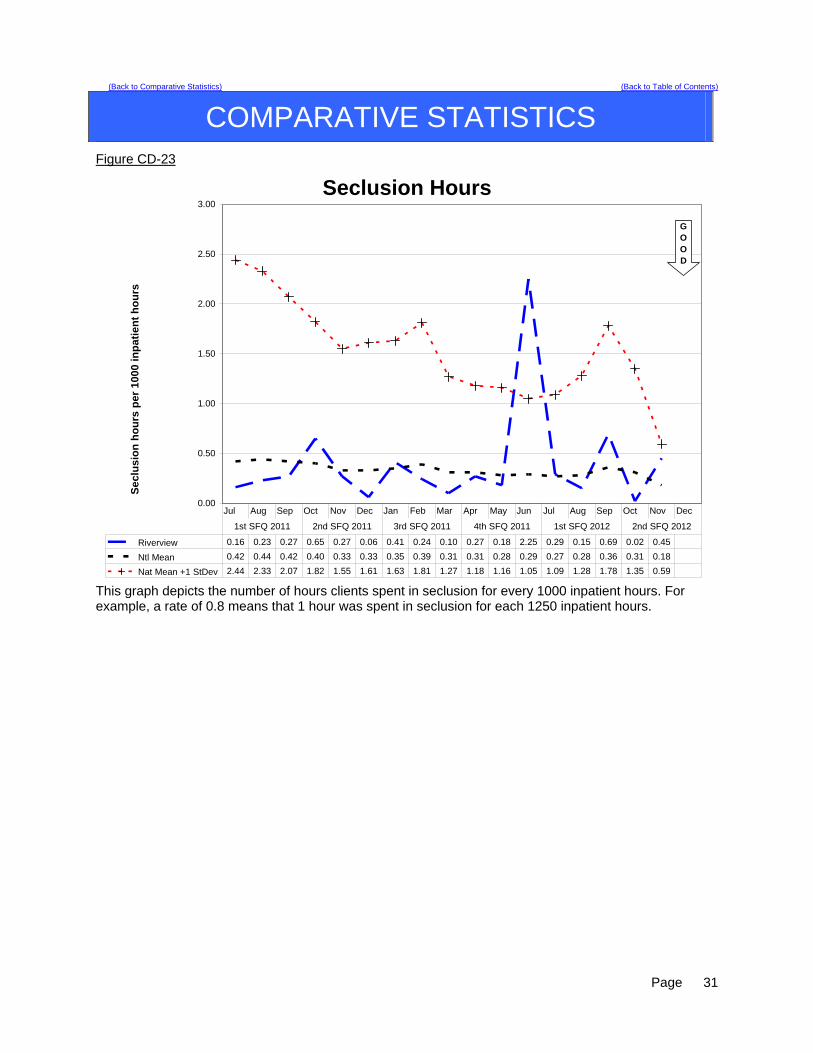
Riverview 0.16 0.23 0.27 0.65 0.27 0.06 0.41 0.24 0.10 0.27 0.18 2.25 0.29 0.15 0.69 0.02 0.45
Ntl Mean 0.42 0.44 0.42 0.40 0.33 0.33 0.35 0.39 0.31 0.31 0.28 0.29 0.27 0.28 0.36 0.31 0.18
Nat Mean +1 StDev 2.44 2.33 2.07 1.82 1.55 1.61 1.63 1.81 1.27 1.18 1.16 1.05 1.09 1.28 1.78 1.35 0.59
Jul Aug Sep Oct Nov Dec Jan Feb Mar Apr May Jun Jul Aug Sep Oct Nov Dec
1st SFQ 2011 2nd SFQ 2011 3rd SFQ 2011 4th SFQ 2011 1st SFQ 2012 2nd SFQ 2012
GOOD
This graph depicts the number of hours clients spent in seclusion for every 1000 inpatient hours. For example, a rate of 0.8 means that 1 hour was spent in seclusion for each 1250 inpatient hours.
Page
31

(Back to Comparative Statistics) (Back to Table of Contents)
COMPARATIVE STATISTICS
Seclusion HoursForensic Stratification
0
0.5
1
1.5
2
2.5
Se
clu
sio
n H
ou
rs p
er 1
000
Inp
atie
nt
Ho
urs
Riverview 0.1 0.26 0.18 0.43 0.43 0.01 0.57 0.08 0 0.04 0.26 2.72 0.33 0.18 0.09 0.02 0.34
Ntl Mean 0.67 0.68 0.54 0.38 0.35 0.39 0.4 0.41 0.46 0.49 0.5 0.49 0.41 0.39 0.6 0.31 0.04
Jul Aug Sep Oct Nov Dec Jan Feb Mar Apr May Jun Jul Aug Sep Oct Nov Dec
1st SFQ 2011 2nd SFQ 2011 3rd SFQ 2011 4th SFQ 2011 1st SFQ 2012 2nd SFQ 2012
Seclusion Hours Civil Stratification
0
0.5
1
1.5
2
2.5
Sec
lusi
on
Ho
urs
per
10
00 In
pat
ien
t H
ou
rs
Riverview 0.23 0.2 0.39 0.94 0.07 0.12 0.19 0.48 0.27 0.59 0.06 1.54 0.23 0.09 1.61 0.02 0.62
Ntl Mean 0.7 0.65 0.6 0.53 0.46 0.49 0.47 0.54 0.41 0.36 0.28 0.29 0.25 0.28 0.38 0.34 0.23
Dorothea Dix 0.23 0.16 0.27 0.10 0.09 0.23 1.93 0.13 0.05 0.33 0.07 0.53 0.44 0.25 0.02 0.02 0.33
Jul Aug Sep Oct Nov Dec Jan Feb Mar Apr May Jun Jul Aug Sep Oct Nov Dec
1st SFQ 2011 2nd SFQ 2011 3rd SFQ 2011 4th SFQ 2011 1st SFQ 2012 2nd SFQ 2012
This graph depicts the number of hours clients spent in seclusion for every 1000 inpatient hours stratified by forensic or civil classifications. For example, a rate of 0.8 means that 1 hour was spent in seclusion for each 1250 inpatient hours. The hospital-wide results from the Dorothea Dix facility are compared to the civil population results at the Riverview facility due to the homogeneous nature of these two sample groups.
Page
32
(Back to Comparative Statistics) (Back to Table of Contents)
COMPARATIVE STATISTICS
Confinement Event Breakdown
Manual
Hold Mechanical Restraint
Locked Seclusion
Open Seclusion
Grand Total
% of Total
Cumulative %
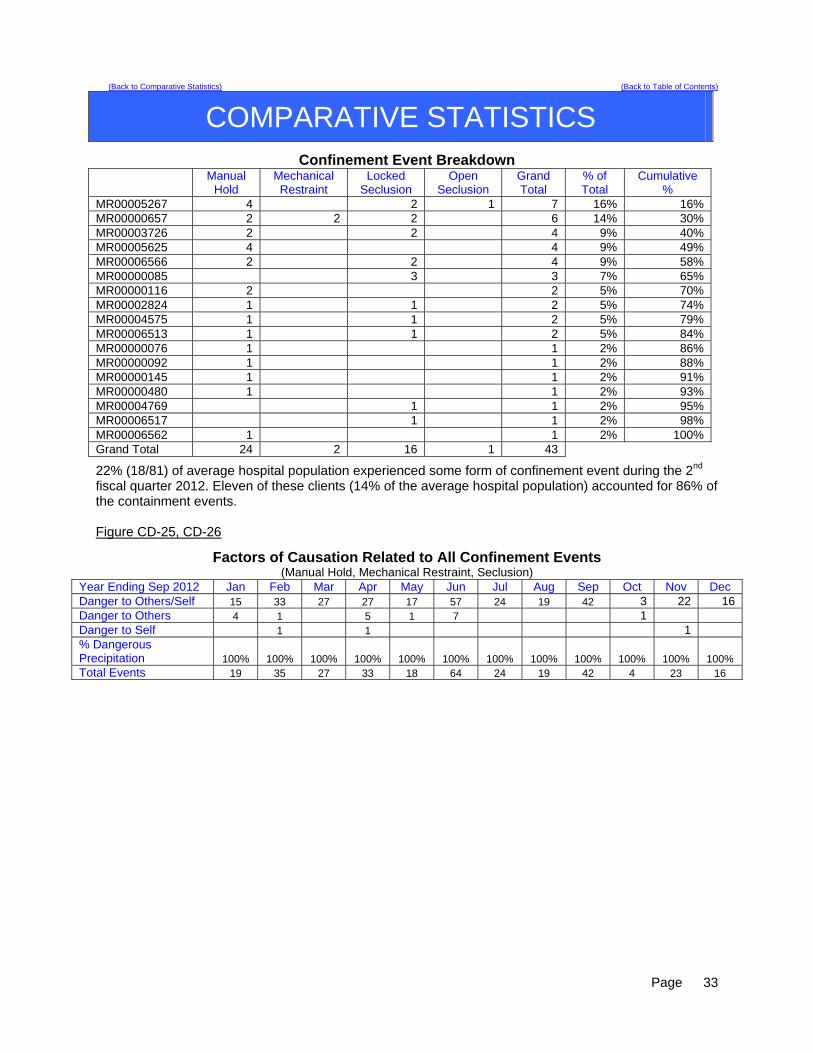
MR00005267 4 2 1 7 16% 16% MR00000657 2 2 2 6 14% 30% MR00003726 2 2 4 9% 40% MR00005625 4 4 9% 49% MR00006566 2 2 4 9% 58% MR00000085 3 3 7% 65% MR00000116 2 2 5% 70% MR00002824 1 1 2 5% 74% MR00004575 1 1 2 5% 79% MR00006513 1 1 2 5% 84% MR00000076 1 1 2% 86% MR00000092 1 1 2% 88% MR00000145 1 1 2% 91% MR00000480 1 1 2% 93% MR00004769 1 1 2% 95% MR00006517 1 1 2% 98% MR00006562 1 1 2% 100% Grand Total 24 2 16 1 43
22% (18/81) of average hospital population experienced some form of confinement event during the 2nd fiscal quarter 2012. Eleven of these clients (14% of the average hospital population) accounted for 86% of the containment events. Figure CD-25, CD-26
Factors of Causation Related to All Confinement Events (Manual Hold, Mechanical Restraint, Seclusion)
Year Ending Sep 2012 Jan Feb Mar Apr May Jun Jul Aug Sep Oct Nov Dec Danger to Others/Self 15 33 27 27 17 57 24 19 42 3 22 16 Danger to Others 4 1 5 1 7 1 Danger to Self 1 1 1 % Dangerous Precipitation 100% 100% 100% 100% 100% 100% 100% 100% 100% 100% 100% 100% Total Events 19 35 27 33 18 64 24 19 42 4 23 16
Page
33
(Back to Comparative Statistics) (Back to Table of Contents)
COMPARATIVE STATISTICS
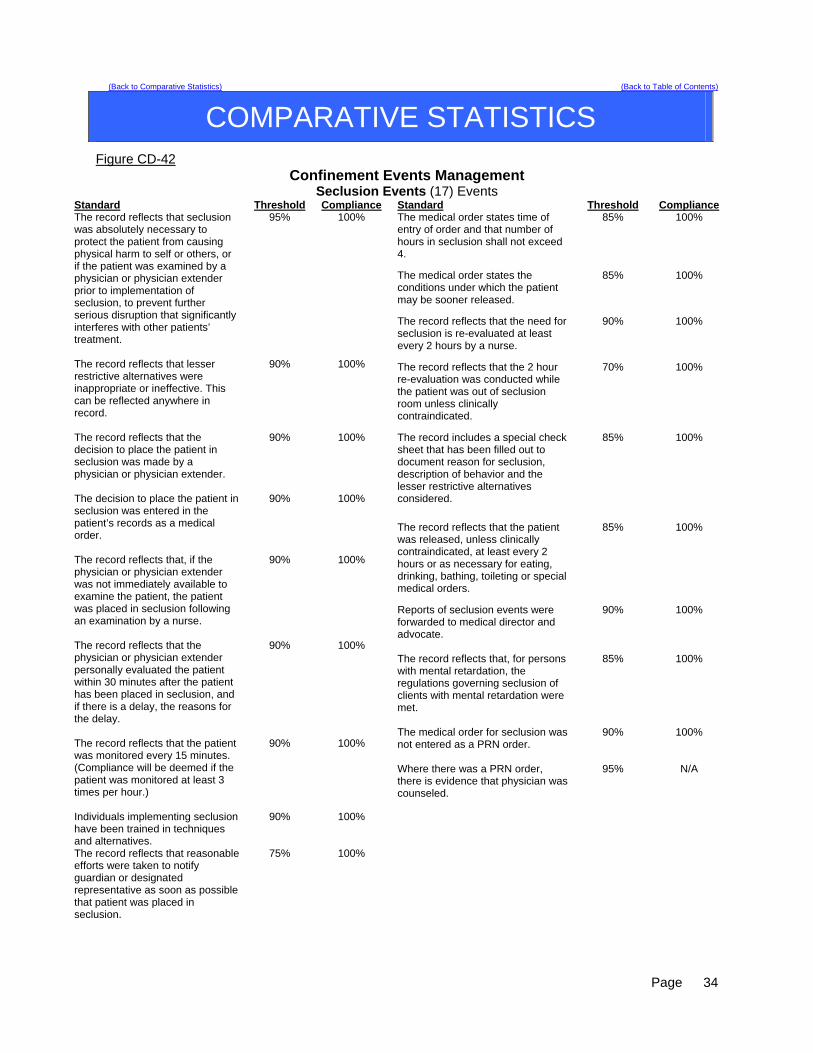
Figure CD-42 Confinement Events Management
Seclusion Events (17) Events Standard Threshold Compliance The record reflects that seclusion was absolutely necessary to protect the patient from causing physical harm to self or others, or if the patient was examined by a physician or physician extender prior to implementation of seclusion, to prevent further serious disruption that significantly interferes with other patients’ treatment.
95% 100%
The record reflects that lesser restrictive alternatives were inappropriate or ineffective. This can be reflected anywhere in record.
90% 100%
The record reflects that the decision to place the patient in seclusion was made by a physician or physician extender.
90% 100%
The decision to place the patient in seclusion was entered in the patient’s records as a medical order.
90% 100%
The record reflects that, if the physician or physician extender was not immediately available to examine the patient, the patient was placed in seclusion following an examination by a nurse.
90% 100%
The record reflects that the physician or physician extender personally evaluated the patient within 30 minutes after the patient has been placed in seclusion, and if there is a delay, the reasons for the delay.
90% 100%
The record reflects that the patient was monitored every 15 minutes. (Compliance will be deemed if the patient was monitored at least 3 times per hour.)
90% 100%
Individuals implementing seclusion have been trained in techniques and alternatives.
90% 100%
The record reflects that reasonable efforts were taken to notify guardian or designated representative as soon as possible that patient was placed in seclusion.
75% 100%
Standard Threshold Compliance The medical order states time of entry of order and that number of hours in seclusion shall not exceed 4.
85% 100%
The medical order states the conditions under which the patient may be sooner released.
85% 100%
The record reflects that the need for seclusion is re-evaluated at least every 2 hours by a nurse.
90% 100%
The record reflects that the 2 hour re-evaluation was conducted while the patient was out of seclusion room unless clinically contraindicated.
70% 100%
The record includes a special check sheet that has been filled out to document reason for seclusion, description of behavior and the lesser restrictive alternatives considered.
85% 100%
The record reflects that the patient was released, unless clinically contraindicated, at least every 2 hours or as necessary for eating, drinking, bathing, toileting or special medical orders.
85% 100%
Reports of seclusion events were forwarded to medical director and advocate.
90% 100%
The record reflects that, for persons with mental retardation, the regulations governing seclusion of clients with mental retardation were met.
85% 100%
The medical order for seclusion was not entered as a PRN order.
90% 100%
Where there was a PRN order, there is evidence that physician was counseled.
95% N/A
Page
34

(Back to Comparative Statistics) (Back to Table of Contents)
COMPARATIVE STATISTICS
Figure CD-43 Confinement Events Management
Mechanical Restraint Events (2) Events Standard Threshold Compliance The record reflects that restraint was absolutely necessary to protect the patient from causing serious physical injury to self or others.
95% 100%
The record reflects that lesser restrictive alternatives were inappropriate or ineffective.
90% 100%
The record reflects that the decision to place the patient in restraint was made by a physician or physician extender
90% 100%
The decision to place the patient in restraint was entered in the patient’s records as a medical order.
90% 100%
The record reflects that, if a physician or physician extended was not immediately available to examine the patient, the patient was placed in restraint following an examination by a nurse.
90% 100%
The record reflects that the physician or physician extender personally evaluated the patient within 30 minutes after the patient has been placed in restraint, or, if there was a delay, the reasons for the delay.
90% 100%
The record reflects that the patient was kept under constant observation during restraint.
95% 100%
Individuals implementing restraint have been trained in techniques and alternatives.
90% 100%
The record reflects that reasonable efforts taken to notify guardian or designated representative as soon as possible that patient was placed in restraint.
75% 100%
The medical order states time of entry of order and that number of hours shall not exceed four.
90% 100%
The medical order shall state the conditions under which the patient may be sooner released.
85% 100%
Standard Threshold Compliance The record reflects that the need for restraint was re-evaluated every 2 hours by a nurse.
90% 100%
The record reflects that re-evaluation was conducted while the patient was free of restraints unless clinically contraindicated.
70% 100%
The record includes a special check sheet that has been filled out to document the reason for the restraint, description of behavior and the lesser restrictive alternatives considered.
85% 100%
The record reflects that the patient was released as necessary for eating, drinking, bathing, toileting or special medical orders.
90% 100%
The record reflects that the patient’s extremities were released sequentially, with one released at least every fifteen minutes.
90% 100%
Copies of events were forwarded to medical director and advocate.
90% 100%
For persons with mental retardation, the applicable regulations were met.
85% 100%
The record reflects that the order was not entered as a PRN order.
90% 100%
Where there was a PRN order, there is evidence that physician was counseled.
95% N/A
A restraint event that exceeds 24 hours will be reviewed against the following requirement: If total consecutive hours in restraint, with renewals, exceeded 24 hours, the record reflects that the patient was medically assessed and treated for any injuries; that the order extending restraint beyond 24 hours was entered by Medical Director (or if the Medical Director is out of the hospital, by the individual acting in the Medical Director’s stead) following examination of the patient; and that the patient’s guardian or representative has been notified.
90% 100%
Page
35
(Back to Comparative Statistics) (Back to Table of Contents)
COMPARATIVE STATISTICS
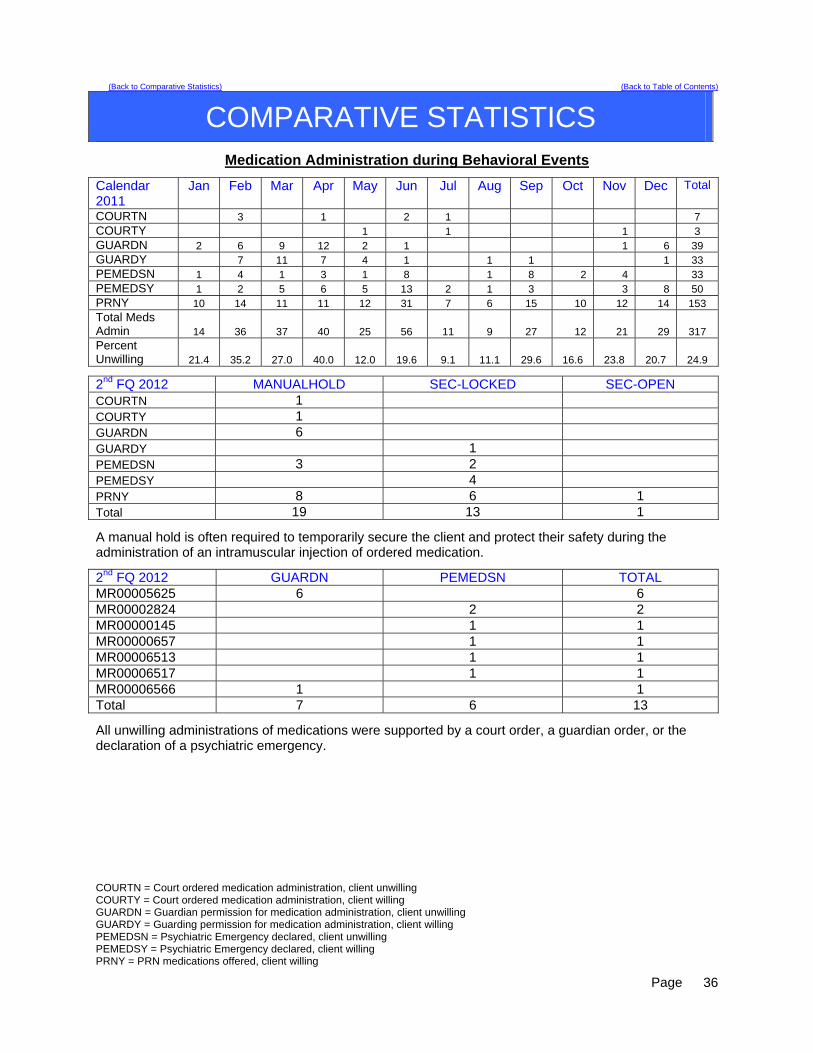
Medication Administration during Behavioral Events
Calendar 2011
Jan Feb Mar Apr May Jun Jul Aug Sep Oct Nov Dec Total
COURTN 3 1 2 1 7 COURTY 1 1 1 3 GUARDN 2 6 9 12 2 1 1 6 39 GUARDY 7 11 7 4 1 1 1 1 33 PEMEDSN 1 4 1 3 1 8 1 8 2 4 33 PEMEDSY 1 2 5 6 5 13 2 1 3 3 8 50 PRNY 10 14 11 11 12 31 7 6 15 10 12 14 153 Total Meds Admin 14 36 37 40 25 56 11 9 27 12 21 29 317 Percent Unwilling 21.4 35.2 27.0 40.0 12.0 19.6 9.1 11.1 29.6 16.6 23.8 20.7 24.9
2nd FQ 2012 MANUALHOLD SEC-LOCKED SEC-OPEN COURTN 1 COURTY 1 GUARDN 6 GUARDY 1 PEMEDSN 3 2 PEMEDSY 4 PRNY 8 6 1 Total 19 13 1
A manual hold is often required to temporarily secure the client and protect their safety during the administration of an intramuscular injection of ordered medication.
2nd FQ 2012 GUARDN PEMEDSN TOTAL MR00005625 6 6 MR00002824 2 2 MR00000145 1 1 MR00000657 1 1 MR00006513 1 1 MR00006517 1 1 MR00006566 1 1 Total 7 6 13
All unwilling administrations of medications were supported by a court order, a guardian order, or the declaration of a psychiatric emergency.
COURTN = Court ordered medication administration, client unwilling COURTY = Court ordered medication administration, client willing GUARDN = Guardian permission for medication administration, client unwilling GUARDY = Guarding permission for medication administration, client willing PEMEDSN = Psychiatric Emergency declared, client unwilling PEMEDSY = Psychiatric Emergency declared, client willing PRNY = PRN medications offered, client willing
Page
36
(Glossary of Terms, Acronyms & Abbreviations) (Back to Table of Contents)
DIETARY
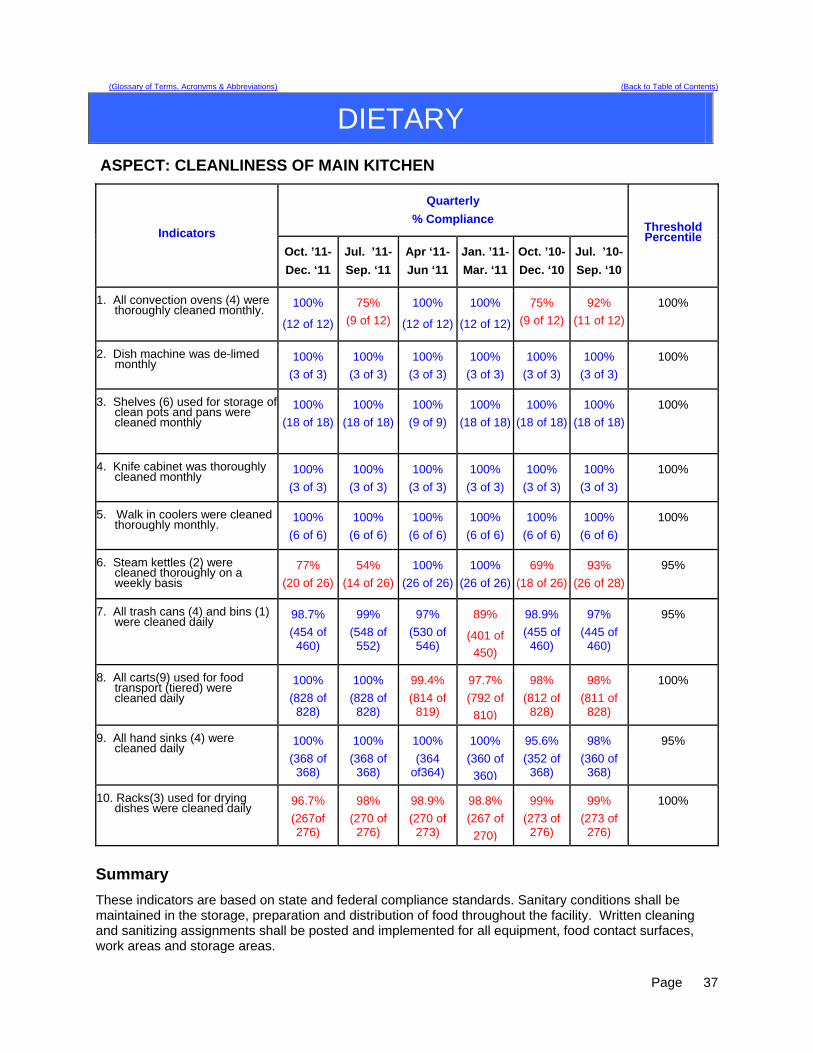
ASPECT: CLEANLINESS OF MAIN KITCHEN
Quarterly
% Compliance Indicators
Oct. ’11-
Dec. ‘11
Jul. ’11-
Sep. ‘11
Apr ‘11-
Jun ‘11
Jan. ’11-
Mar. ‘11
Oct. ’10-
Dec. ‘10
Jul. ’10-
Sep. ‘10
Threshold Percentile
1. All convection ovens (4) were thoroughly cleaned monthly.
100%
(12 of 12)
75%
(9 of 12)
100%
(12 of 12)
100%
(12 of 12)
75%
(9 of 12)
92%
(11 of 12)
100%
2. Dish machine was de-limed monthly
100%
(3 of 3)
100%
(3 of 3)
100%
(3 of 3)
100%
(3 of 3)
100%
(3 of 3)
100%
(3 of 3)
100%
3. Shelves (6) used for storage of clean pots and pans were cleaned monthly
100%
(18 of 18)
100%
(18 of 18)
100%
(9 of 9)
100%
(18 of 18)
100%
(18 of 18)
100%
(18 of 18)
100%
4. Knife cabinet was thoroughly cleaned monthly
100%
(3 of 3)
100%
(3 of 3)
100%
(3 of 3)
100%
(3 of 3)
100%
(3 of 3)
100%
(3 of 3)
100%
5. Walk in coolers were cleaned thoroughly monthly.
100%
(6 of 6)
100%
(6 of 6)
100%
(6 of 6)
100%
(6 of 6)
100%
(6 of 6)
100%
(6 of 6)
100%
6. Steam kettles (2) were cleaned thoroughly on a weekly basis
77%
(20 of 26)
54%
(14 of 26)
100%
(26 of 26)
100%
(26 of 26)
69%
(18 of 26)
93%
(26 of 28)
95%
7. All trash cans (4) and bins (1) were cleaned daily
98.7%
(454 of 460)
99%
(548 of 552)
97%
(530 of 546)
89%
(401 of
450)
98.9%
(455 of 460)
97%
(445 of 460)
95%
8. All carts(9) used for food transport (tiered) were cleaned daily
100%
(828 of 828)
100%
(828 of 828)
99.4%
(814 of 819)
97.7%
(792 of
810)
98%
(812 of 828)
98%
(811 of 828)
100%
9. All hand sinks (4) were cleaned daily
100%
(368 of 368)
100%
(368 of 368)
100%
(364 of364)
100%
(360 of
360)
95.6%
(352 of 368)
98%
(360 of 368)
95%
10. Racks(3) used for drying dishes were cleaned daily
96.7%
(267of 276)
98%
(270 of 276)
98.9%
(270 of 273)
98.8%
(267 of
270)
99%
(273 of 276)
99%
(273 of 276)
100%
Summary
These indicators are based on state and federal compliance standards. Sanitary conditions shall be maintained in the storage, preparation and distribution of food throughout the facility. Written cleaning and sanitizing assignments shall be posted and implemented for all equipment, food contact surfaces, work areas and storage areas.
Page
37
(Glossary of Terms, Acronyms & Abbreviations) (Back to Table of Contents)
DIETARY
The improvement seen with cleaning of the convection ovens is due to the task being completed by
the Food Service Manager and the Clinical Dietitian. This was completed by these job classifications due to a staff shortage in the department.
The improvement seen with cleaning of the steam kettles was due to a team effort of the Dietary staff. There was a slight decrease seen within one area of the cleaning tasks; the racks used for drying
dishes.
Overall Compliance: 98.9%
Actions: The steam kettles will be cleaned by the FSW classification and the four ovens will be cleaned by
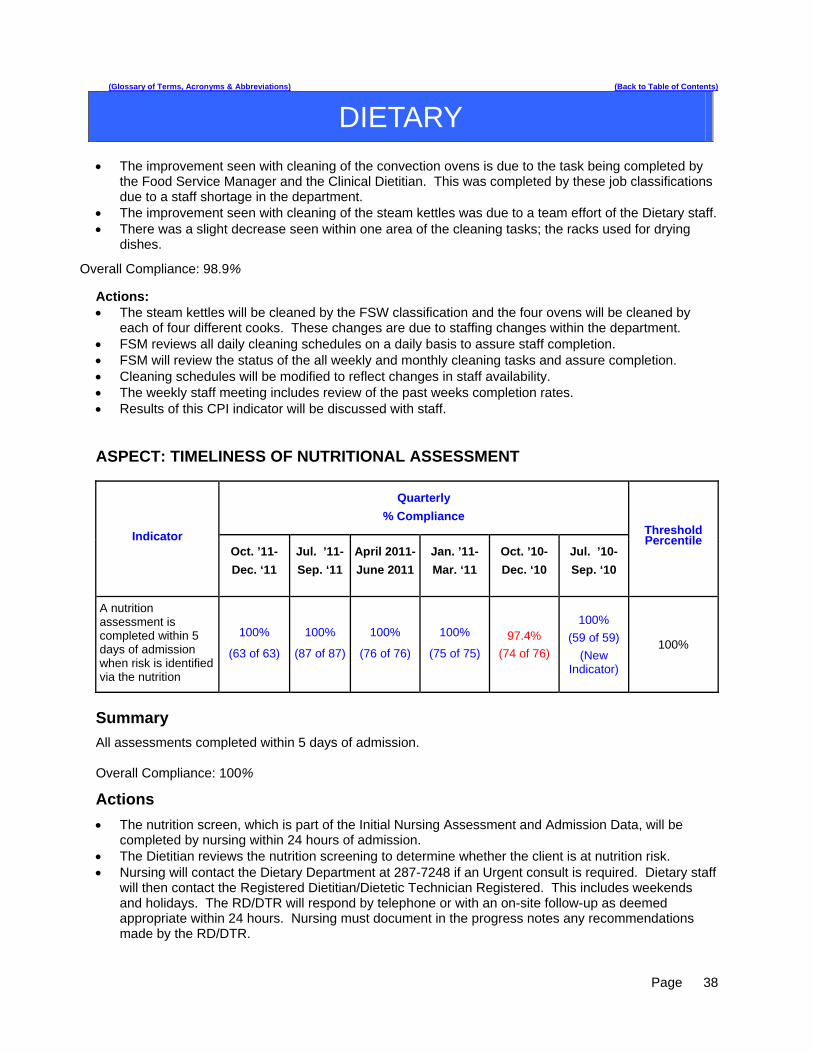
each of four different cooks. These changes are due to staffing changes within the department. FSM reviews all daily cleaning schedules on a daily basis to assure staff completion. FSM will review the status of the all weekly and monthly cleaning tasks and assure completion. Cleaning schedules will be modified to reflect changes in staff availability. The weekly staff meeting includes review of the past weeks completion rates. Results of this CPI indicator will be discussed with staff. ASPECT: TIMELINESS OF NUTRITIONAL ASSESSMENT
Quarterly
% Compliance
Indicator Oct. ’11-
Dec. ‘11
Jul. ’11-
Sep. ‘11
April 2011-
June 2011
Jan. ’11-
Mar. ‘11
Oct. ’10-
Dec. ‘10
Jul. ’10-
Sep. ‘10
Threshold Percentile
A nutrition assessment is completed within 5 days of admission when risk is identified via the nutrition
100%
(63 of 63)
100%
(87 of 87)
100%
(76 of 76)
100%
(75 of 75)
97.4%
(74 of 76)
100%
(59 of 59)
(New Indicator)
100%
Summary
All assessments completed within 5 days of admission. Overall Compliance: 100%
Actions
The nutrition screen, which is part of the Initial Nursing Assessment and Admission Data, will be completed by nursing within 24 hours of admission.
The Dietitian reviews the nutrition screening to determine whether the client is at nutrition risk. Nursing will contact the Dietary Department at 287-7248 if an Urgent consult is required. Dietary staff
will then contact the Registered Dietitian/Dietetic Technician Registered. This includes weekends and holidays. The RD/DTR will respond by telephone or with an on-site follow-up as deemed appropriate within 24 hours. Nursing must document in the progress notes any recommendations made by the RD/DTR.
Page
38

(Glossary of Terms, Acronyms & Abbreviations) (Back to Table of Contents)
HARBOR TREATMENT MALL
Aspect: Harbor Mall Hand-off Communication
Indicators Findings Compliance Threshold Percentile
1. Hand-off communication sheet was received at the Harbor Mall within the designated time frame.
23 of 42 55% 100%
2. RN signature/Harbor Mall staff signatures present. 42 of 42 100% 100%
3. SBAR information completed from the units to the Harbor Mall. 17 of 42 40%
100%
4. SBAR information completed from the Harbor Mall to the receiving unit.
40 of 42 95%
100%
Summary This is the second quarterly report for this year. All units were made aware of the criteria that would be monitored in order to ensure that the hand-off communication process for the Harbor Mall is being done properly. Indicator number one was 62% for the first quarter and dropped to 55% for this quarter. Indicator number two was 98% for the first quarter and increased to 100% for this quarter. Indicator number three was 43% in the first quarter and has dropped to 40% for this quarter. Indicator number four was 76% in the first quarter and has increased to 95% for this quarter. Indicator #1-Nineteen of the hand-off communication sheets did not arrive to the Harbor Mall within the allotted time frame and twenty three did. This sheet is to be brought to the mall no later than 5 minutes before the start of groups and this did not happen on nineteen of the sheets that were reviewed for this quarter. The PSD for the mall will remind each of the units what the protocol is for the hand-off sheet to ensure that the information reaches the mall in time to be relayed to group leaders. Indicator #2- One of the hand-off communication sheets was not brought to the mall during the first quarter so one RN signature was missing. Indicator#2 was 100% for this quarter. Indicator #3- Twenty-five of the 42 sheets reviewed did not have any client concerns or comments from the unit(s) written for the Harbor Mall and/or did not state no issues to report on the HOC. Seventeen of the sheets reflected concerns or comments from the unit. The PSD for the Harbor Mall will review the need for accuracy in completing the HOC sheet with each of the units. Indicator #4 – Two of the 42 sheets reviewed did not have any client concerns or comments from the Harbor Mall back to the units and/or did not state know issues to report on the HOC sheet. Forty of the sheets did reflect concern or comments from the Harbor Mall. The PSD will remind Harbor Mall staff to complete issues/concerns section. Actions PSD will continue to randomly audit all the hand-off communication sheets received from the units. Any patterns from one particular unit will be reported to that unit’s PSD in order to ensure accurate and timely communication between the two areas.
Page
39

(Glossary of Terms, Acronyms & Abbreviations) (Back to Table of Contents)
HEALTH INFORMATION MANAGEMENT
ASPECT: DOCUMENTATION & TIMELINESS
Indicators Findings 2nd Qtr 2012
1st Qtr 2012
4th Qtr 2011
3rd Qtr 2011
Threshold Percentile
Records will be completed within Joint Commission standards, state requirements and Medical Staff bylaws timeframes.
There were 67 discharges in
quarter 2 2012. Of those, 65
were completed by 30 days.
97 % 97 % 79 % 49 % 80%
Discharge summaries will be completed within 15 days of discharge.
67 out of 67 discharge
summaries were completed within
15 days of discharge during quarter 2 2012.
100 % 99 % 100 % 100 % 100%
All forms/revisions to be placed in the medical record will be approved by the Medical Records Committee.
2 forms were approved/ revised in
quarter 2 2012 (see minutes).
100% 100% 100% 100% 100%
Medical transcription will be timely and accurate.
Out of 1208 dictated reports,
1078 were completed within
24 hours.
89% 93% 86% 84% 90%
Summary The indicators are based on the review of all discharged records. There was 97% compliance with record completion. There was 100% compliance with discharge summary completion. Weekly “charts needing attention” lists are distributed to medical staff, including the Medical Director, along with the Superintendent, Risk Manager and the Quality Improvement Manager. There was 89% compliance with timely & accurate medical transcription services. Actions Continue to monitor the compliance rate of each measure and work closely with the Medical Director to identify barriers to on-time completion of medical records according to the prescribed timeline.
Page
40

(Glossary of Terms, Acronyms & Abbreviations) (Back to Table of Contents)
HEALTH INFORMATION MANAGEMENT
ASPECT: CONFIDENTIALITY
Indicators Findings Compliance Threshold Percentile
All client information released from the Health Information department will meet all Joint Commission, State, Federal & HIPAA standards.
2724 requests for information (204
requests for client information and 2520 police checks) were
released for quarter 2 2012
100% 100%
All new employees/contract staff will attend confidentiality/HIPAA training.
28 new employees/contract
staff in quarter 2 2012.
100% 100%
Confidentiality/Privacy issues tracked through incident reports.
2 privacy-related incident reports during
quarter 2 2012.
100% 100%
Summary The indicators are based on the review of all requests for information, orientation for all new employees/contract staff and confidentiality/privacy-related incident reports. No problems were found in quarter 2 related to release of information from the Health Information department and training of new employees/contract staff, however compliance with current law and HIPAA regulations need to be strictly adhered to requiring training, education and policy development at all levels. Due to challenges with staffing levels and the need to ensure that requests for information that impact the ongoing psychiatric or medical care of clients or contribute to the legal process for those with legal commitments, several police checks from this quarter are outstanding. Police checks are one step in the process of applying for or renewing applications for concealed weapons permits but are a secondary priority when compared to other clinical or legal needs. Delays in acquiring this information can delay the completion of an application by a Maine resident. Actions The above indicators will continue to be monitored.
Page
41
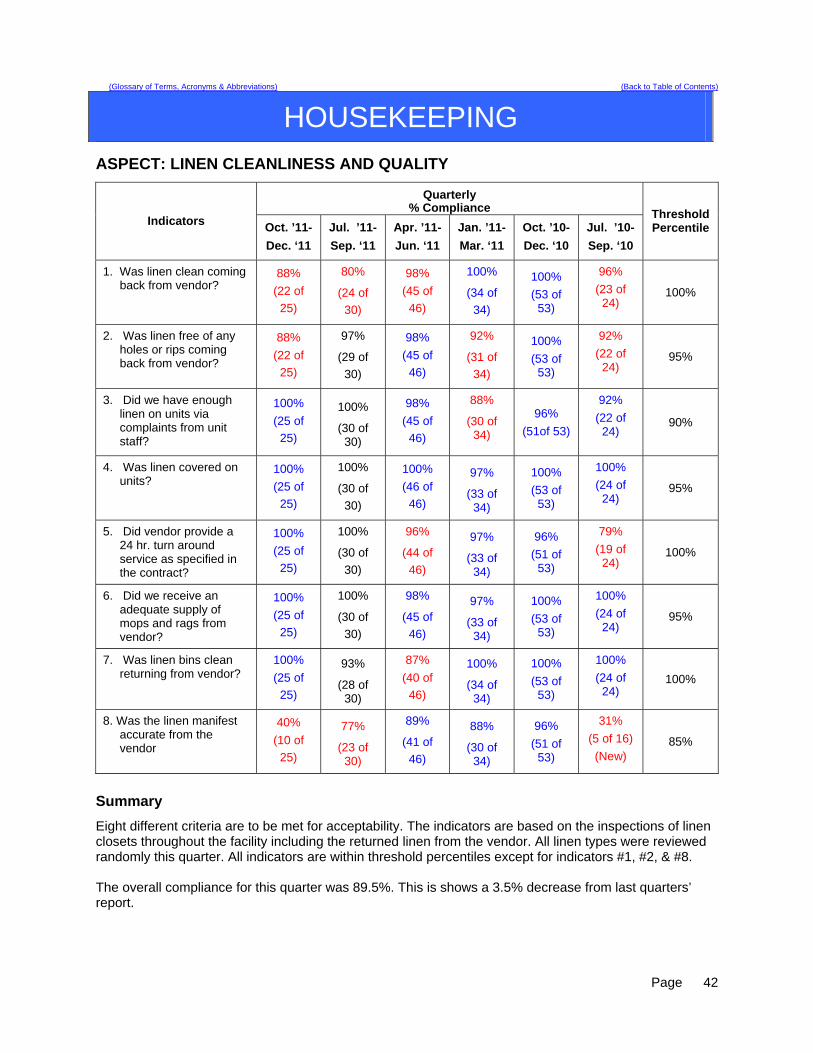
(Glossary of Terms, Acronyms & Abbreviations) (Back to Table of Contents)
HOUSEKEEPING
ASPECT: LINEN CLEANLINESS AND QUALITY
Quarterly % Compliance
Indicators Oct. ’11-
Dec. ‘11
Jul. ’11-
Sep. ‘11
Apr. ’11-
Jun. ‘11
Jan. ’11-
Mar. ‘11
Oct. ’10-
Dec. ‘10
Jul. ’10-
Sep. ‘10
Threshold Percentile
1. Was linen clean coming back from vendor?
88%
(22 of
25)
80%
(24 of
30)
98%
(45 of
46)
100%
(34 of
34)
100%
(53 of 53)
96%
(23 of 24)
100%
2. Was linen free of any holes or rips coming back from vendor?
88%
(22 of
25)
97%
(29 of
30)
98%
(45 of
46)
92%
(31 of
34)
100%
(53 of 53)
92%
(22 of 24)
95%
3. Did we have enough linen on units via complaints from unit staff?
100%
(25 of
25)
100%
(30 of 30)
98%
(45 of
46)
88%
(30 of 34)
96%
(51of 53)
92%
(22 of 24)
90%
4. Was linen covered on units?
100%
(25 of
25)
100%
(30 of
30)
100%
(46 of
46)
97%
(33 of 34)
100%
(53 of 53)
100%
(24 of 24)
95%
5. Did vendor provide a 24 hr. turn around service as specified in the contract?
100%
(25 of
25)
100%
(30 of
30)
96%
(44 of
46)
97%
(33 of 34)
96%
(51 of 53)
79%
(19 of 24)
100%
6. Did we receive an adequate supply of mops and rags from vendor?
100%
(25 of
25)
100%
(30 of
30)
98%
(45 of
46)
97%
(33 of 34)
100%
(53 of 53)
100%
(24 of 24)
95%
7. Was linen bins clean returning from vendor?
100%
(25 of
25)
93%
(28 of 30)
87%
(40 of
46)
100%
(34 of 34)
100%
(53 of 53)
100%
(24 of 24)
100%
8. Was the linen manifest accurate from the vendor
40%
(10 of
25)
77%
(23 of 30)
89%
(41 of
46)
88%
(30 of 34)
96%
(51 of 53)
31%
(5 of 16)
(New) 85%
Summary
Eight different criteria are to be met for acceptability. The indicators are based on the inspections of linen closets throughout the facility including the returned linen from the vendor. All linen types were reviewed randomly this quarter. All indicators are within threshold percentiles except for indicators #1, #2, & #8. The overall compliance for this quarter was 89.5%. This is shows a 3.5% decrease from last quarters’ report.
Page
42
(Glossary of Terms, Acronyms & Abbreviations) (Back to Table of Contents)
HOUSEKEEPING
1. (Indicator #8) inadequate supply of linen (blankets, towels, and wash cloths) were not coming back from vendor
2. Linen coming back from the vendor was pick colored instead of white (3 occurrences) (indicator #1 ). 3. Linen returned from vendor had holes & rips (Indicator # 2)
Actions
The Housekeeping Department has done the following actions to remedy the above problem indicators: 1. Housekeeping Supervisor will monitor how many blankets are being sent out to be cleaned and how
many return from vendor. 2. Housekeeping Supervisor contacted the linen vendor and advised them of the problems with
inaccuracies of linen returning from their facility. 3. Communicate to all Housekeeping staff to be aware of the status of this indicator. 4. Housekeeping staff member will continue to document all information regarding to inventory and
manifest statistics from the vendor. 5. Housekeeping Supervisor and Director of Support Services did schedule a visit to the linen cleaning
facility (Alpine) to see how the linen processing was done. Riverview representatives both gave recommendations to manager to meet infection control standards and the Joint Commission standards.
6. Contract with current linen company was extended for the rest of the year only and Riverview will request for proposals from other companies to begin January of 2012.
Page
43
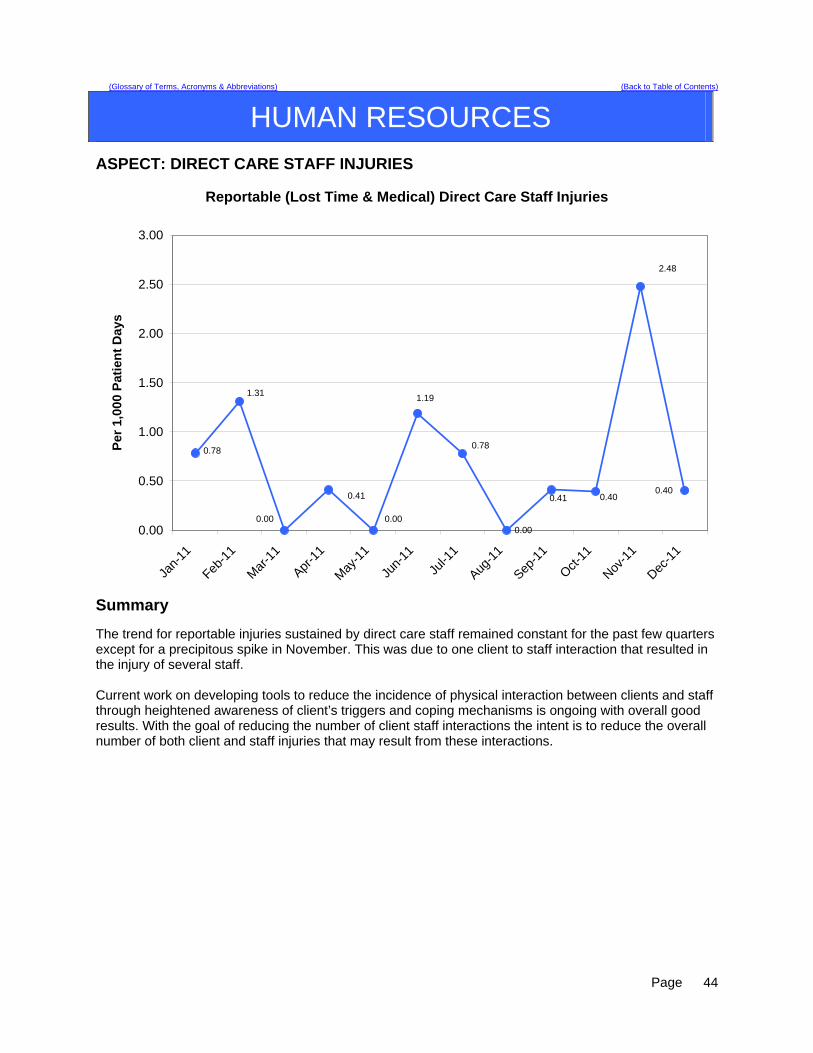
(Glossary of Terms, Acronyms & Abbreviations) (Back to Table of Contents)
HUMAN RESOURCES
ASPECT: DIRECT CARE STAFF INJURIES
Reportable (Lost Time & Medical) Direct Care Staff Injuries
0.00
0.78
1.31
0.40
0.00
2.48
0.410.40
0.41
1.19
0.00
0.78
0.00
0.50
1.00
1.50
2.00
2.50
3.00
Jan-
11
Feb-1
1
Mar
-11
Apr-1
1
May
-11
Jun-
11
Jul-1
1
Aug-1
1
Sep-1
1
Oct-11
Nov-1
1
Dec-1
1
Per
1,0
00 P
atie
nt
Day
s
Summary The trend for reportable injuries sustained by direct care staff remained constant for the past few quarters except for a precipitous spike in November. This was due to one client to staff interaction that resulted in the injury of several staff. Current work on developing tools to reduce the incidence of physical interaction between clients and staff through heightened awareness of client’s triggers and coping mechanisms is ongoing with overall good results. With the goal of reducing the number of client staff interactions the intent is to reduce the overall number of both client and staff injuries that may result from these interactions.
Page
44
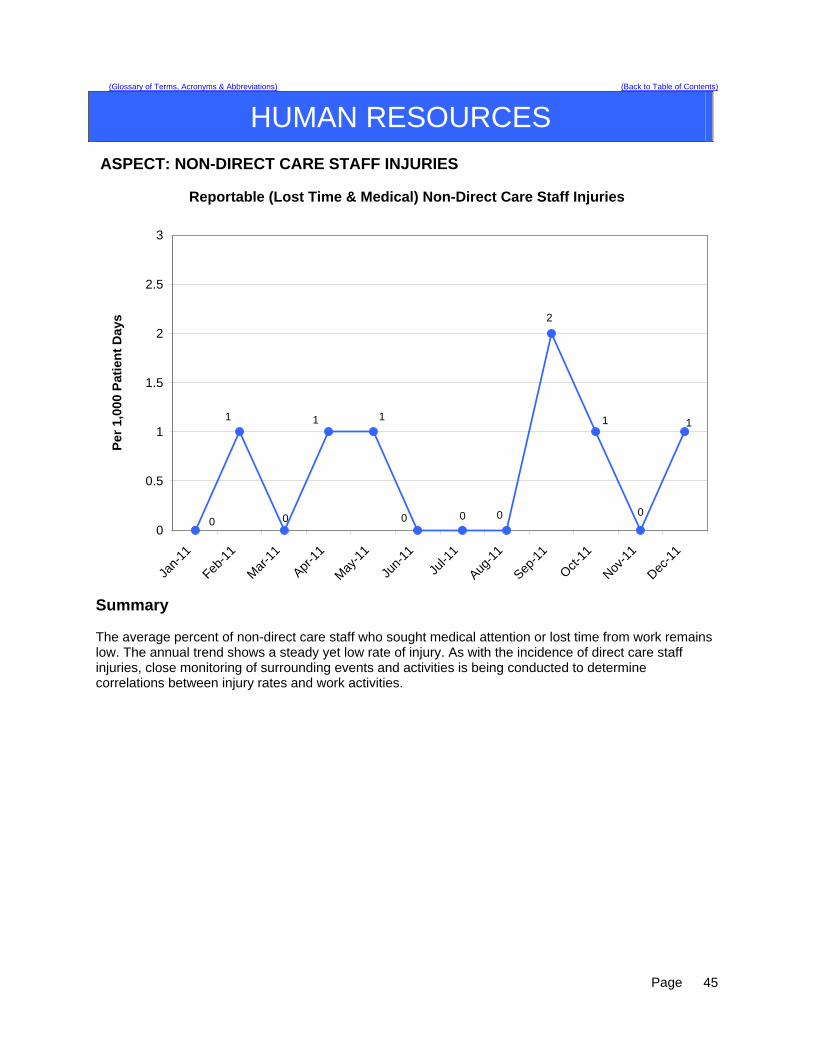
(Glossary of Terms, Acronyms & Abbreviations) (Back to Table of Contents)
HUMAN RESOURCES
ASPECT: NON-DIRECT CARE STAFF INJURIES
Reportable (Lost Time & Medical) Non-Direct Care Staff Injuries
0
1 1
0
1
0 0
1
2
0
1
00
0.5
1
1.5
2
2.5
3
Jan-
11
Feb-1
1
Mar
-11
Apr-1
1
May
-11
Jun-
11
Jul-1
1
Aug-1
1
Sep-1
1
Oct-11
Nov-1
1
Dec-1
1
Per
1,0
00 P
atie
nt
Day
s
Summary The average percent of non-direct care staff who sought medical attention or lost time from work remains low. The annual trend shows a steady yet low rate of injury. As with the incidence of direct care staff injuries, close monitoring of surrounding events and activities is being conducted to determine correlations between injury rates and work activities.
Page
45

(Glossary of Terms, Acronyms & Abbreviations) (Back to Table of Contents)
HUMAN RESOURCES
ASPECT: PERFORMANCE EVALUATIONS COMPLETION Completion of performance evaluations within 30 days of the due date.
Performance Evaluation Compliance
84.62%
67.74%
77.78%
90.91%
88.46%
74.42%
68.18%
80.00% 80.00%
72.73%
85.71%
81.58%
87.01%
77.00%73.33%
0.00%
10.00%
20.00%
30.00%
40.00%
50.00%
60.00%
70.00%
80.00%
90.00%
100.00%
Jan-
11
Feb-1
1
Mar
-11
Apr-1
1
May
-11
Jun-
11
Jul-1
1
Aug-1
1
Sep-1
1
Oct-11
Nov-1
1
Dec-1
1
Per
cen
t O
n-T
ime
Co
mp
leti
on
Monthly % Compliance Quarterly % Compliance
Summary Cumulative results from this quarter (87.01%) are above the planned performance threshold of 85%. The monthly results for compliance have shown a stead increase from the low of 67% in May 2011. Ongoing measurement of performance is indicated. Efforts to insure on time completion of performance evaluations by unit managers will continue in order to achieve the highest possible rate of on-time performance and to maintain a sustainable level of performance above the 85% level.
Page
46
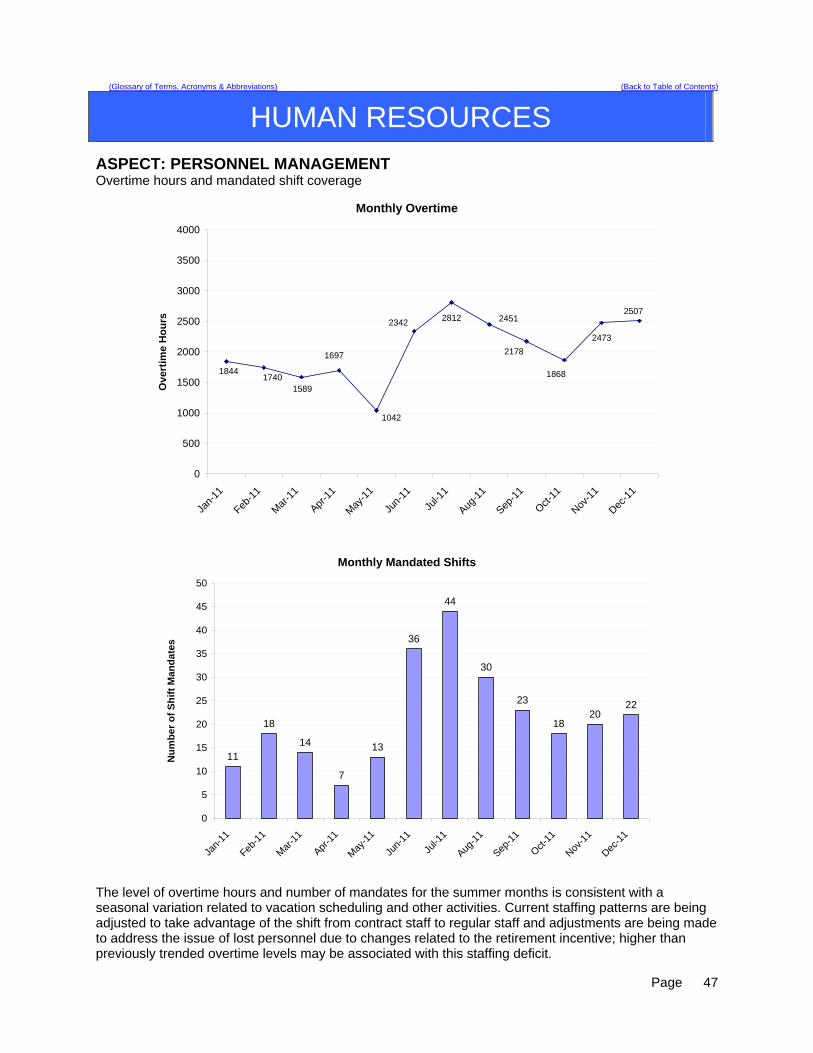
(Glossary of Terms, Acronyms & Abbreviations) (Back to Table of Contents)
HUMAN RESOURCES
ASPECT: PERSONNEL MANAGEMENT Overtime hours and mandated shift coverage
Monthly Overtime
1844
1042
2178
1868
2473
250724512342
17401589
1697
2812
0
500
1000
1500
2000
2500
3000
3500
4000
Jan-
11
Feb-1
1
Mar
-11
Apr-1
1
May
-11
Jun-
11
Jul-1
1
Aug-1
1
Sep-1
1
Oct-11
Nov-1
1
Dec-1
1
Ove
rtim
e H
ou
rs
Monthly Mandated Shifts
11
18
14
7
13
36
44
30
23
1820
22
0
5
10
15
20
25
30
35
40
45
50
Jan-
11
Feb-1
1
Mar
-11
Apr-1
1
May
-11
Jun-
11
Jul-1
1
Aug-1
1
Sep-1
1
Oct-11
Nov-1
1
Dec-1
1
Nu
mb
er o
f S
hif
t M
and
ate
s
The level of overtime hours and number of mandates for the summer months is consistent with a seasonal variation related to vacation scheduling and other activities. Current staffing patterns are being adjusted to take advantage of the shift from contract staff to regular staff and adjustments are being made to address the issue of lost personnel due to changes related to the retirement incentive; higher than previously trended overtime levels may be associated with this staffing deficit.
Page
47

(Glossary of Terms, Acronyms & Abbreviations) (Back to Table of Contents)
INFECTION CONTROL
ASPECT: HOSPITAL ACQUIRED INFECTION
Indicators Findings Compliance Threshold Percentile
Total number of infections for the first quarter of the fiscal year, per 1000 patient days
2.9 100 % within standard
1 SD within the mean
Hospital Acquired (healthcare associated) infection rate, infections per 1000 patient days
0.27 100% within standard
1 SD within the mean
Data Lower Respiratory Infections – 1 Reproductive Infections – 2 Dental Infections – 5 Skin Infections – 8 Urinary Tract Infections – 2 Wound Infections – One client with an abdominal wound secondary to self-injurious behavior. GI – One client was diagnosed with hepatitis B. Despite frequent employee reports of upper respiratory infections and gastrointestinal illness, there have not been any reports of client upper respiratory or GI illness in this quarter. The Infection Control Nurse met with clients and staff during unit community meetings to encourage good hand hygiene and respiratory hygiene throughout the winter months.
Summary Total infection rates and hospital associated infection rates remain low with 1/3 the number of skin infections and ½ the number of dental infections this quarter. Action Plan
1. Continue total house surveillance. 2. Continue to encourage staff and clients to maintain good hand and respiratory hygiene. 3. Last quarter part of the plan was to initiate a procedure to ensure client education on hand
hygiene, respiratory hygiene and Athletes Foot within 10 days of admission. This was presented to Nursing Leadership with the decision to add these client education components to the “Patient Orientation to Unit Checklist” under “Patient Education” section. The protocol is not yet in place. The Risk Manager (who also does Meditech) has been asked to add this to the form. Educational materials on hand hygiene, respiratory hygiene and Athletes’ Foot can be found on the common drive in the folder “Infection Control Family, Client and Staff Education Materials”.
Page
48
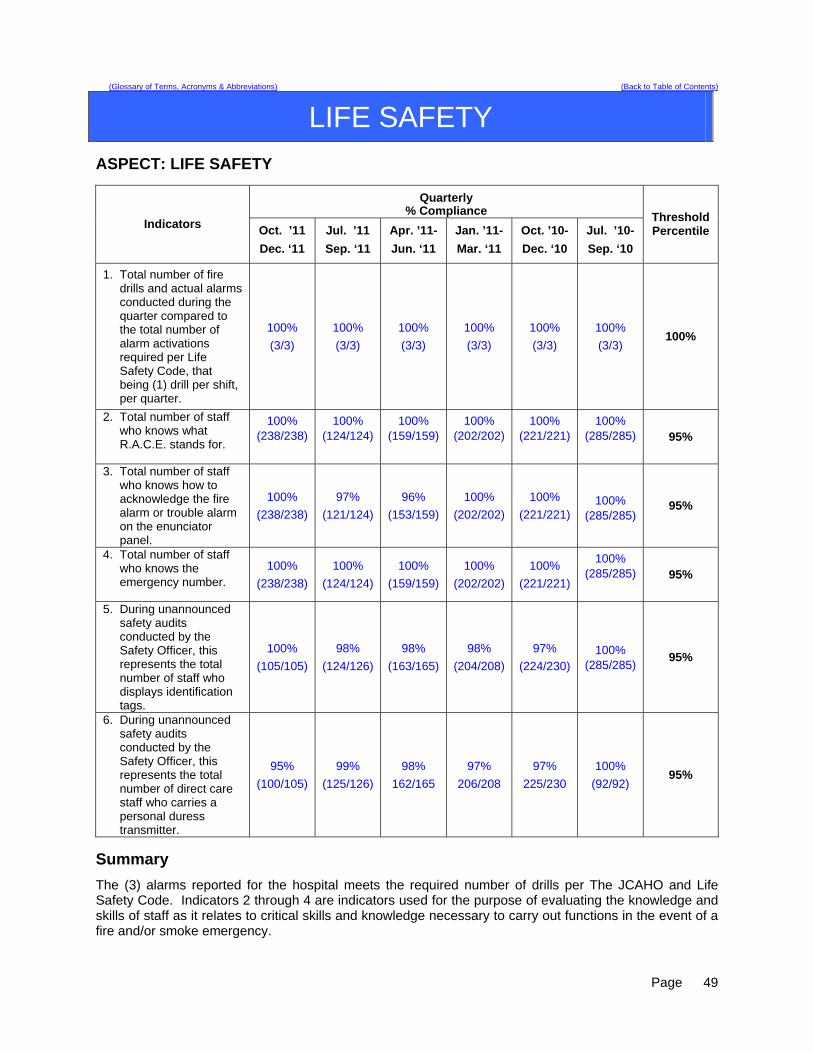
(Glossary of Terms, Acronyms & Abbreviations) (Back to Table of Contents)
LIFE SAFETY
ASPECT: LIFE SAFETY
Quarterly % Compliance
Indicators Oct. ’11
Dec. ‘11
Jul. ’11
Sep. ‘11
Apr. ’11-
Jun. ‘11
Jan. ’11-
Mar. ‘11
Oct. ’10-
Dec. ‘10
Jul. ’10-
Sep. ‘10
Threshold Percentile
1. Total number of fire drills and actual alarms conducted during the quarter compared to the total number of alarm activations required per Life Safety Code, that being (1) drill per shift, per quarter.
100%
(3/3)
100%
(3/3)
100%
(3/3)
100%
(3/3)
100%
(3/3)
100%
(3/3) 100%
2. Total number of staff who knows what R.A.C.E. stands for.
100% (238/238)
100% (124/124)
100% (159/159)
100% (202/202)
100% (221/221)
100% (285/285)
95%
3. Total number of staff who knows how to acknowledge the fire alarm or trouble alarm on the enunciator panel.
100%
(238/238)
97%
(121/124)
96%
(153/159)
100%
(202/202)
100%
(221/221) 100%
(285/285) 95%
4. Total number of staff who knows the emergency number.
100%
(238/238)
100%
(124/124)
100%
(159/159)
100%
(202/202)
100%
(221/221)
100% (285/285)
95%
5. During unannounced safety audits conducted by the Safety Officer, this represents the total number of staff who displays identification tags.
100%
(105/105)
98%
(124/126)
98%
(163/165)
98%
(204/208)
97%
(224/230)
100% (285/285)
95%
6. During unannounced safety audits conducted by the Safety Officer, this represents the total number of direct care staff who carries a personal duress transmitter.
95%
(100/105)
99%
(125/126)
98%
162/165
97%
206/208
97%
225/230
100%
(92/92) 95%
Summary
The (3) alarms reported for the hospital meets the required number of drills per The JCAHO and Life Safety Code. Indicators 2 through 4 are indicators used for the purpose of evaluating the knowledge and skills of staff as it relates to critical skills and knowledge necessary to carry out functions in the event of a fire and/or smoke emergency.
Page
49
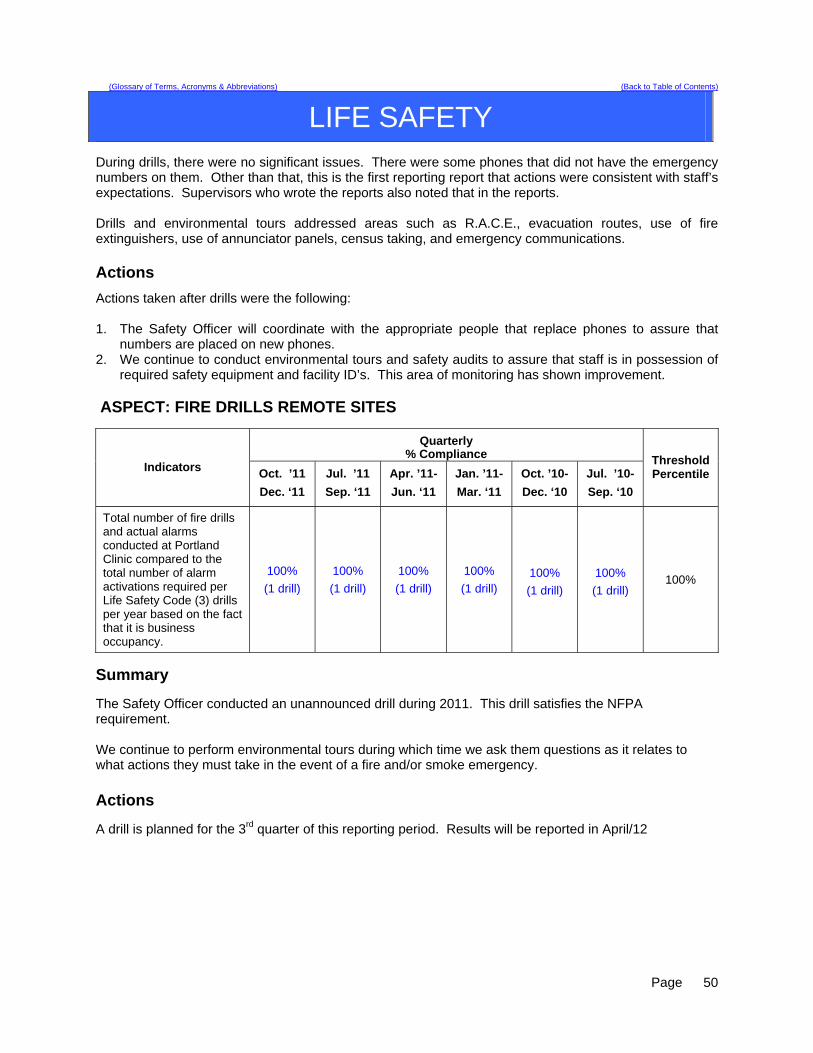
(Glossary of Terms, Acronyms & Abbreviations) (Back to Table of Contents)
LIFE SAFETY
During drills, there were no significant issues. There were some phones that did not have the emergency numbers on them. Other than that, this is the first reporting report that actions were consistent with staff’s expectations. Supervisors who wrote the reports also noted that in the reports. Drills and environmental tours addressed areas such as R.A.C.E., evacuation routes, use of fire extinguishers, use of annunciator panels, census taking, and emergency communications. Actions
Actions taken after drills were the following: 1. The Safety Officer will coordinate with the appropriate people that replace phones to assure that
numbers are placed on new phones. 2. We continue to conduct environmental tours and safety audits to assure that staff is in possession of
required safety equipment and facility ID’s. This area of monitoring has shown improvement. ASPECT: FIRE DRILLS REMOTE SITES
Quarterly % Compliance
Indicators Oct. ’11
Dec. ‘11
Jul. ’11
Sep. ‘11
Apr. ’11-
Jun. ‘11
Jan. ’11-
Mar. ‘11
Oct. ’10-
Dec. ‘10
Jul. ’10-
Sep. ‘10
Threshold Percentile
Total number of fire drills and actual alarms conducted at Portland Clinic compared to the total number of alarm activations required per Life Safety Code (3) drills per year based on the fact that it is business occupancy.
100%
(1 drill)
100%
(1 drill)
100%
(1 drill)
100%
(1 drill) 100%
(1 drill)
100%
(1 drill) 100%
Summary The Safety Officer conducted an unannounced drill during 2011. This drill satisfies the NFPA requirement. We continue to perform environmental tours during which time we ask them questions as it relates to what actions they must take in the event of a fire and/or smoke emergency. Actions A drill is planned for the 3rd quarter of this reporting period. Results will be reported in April/12
Page
50
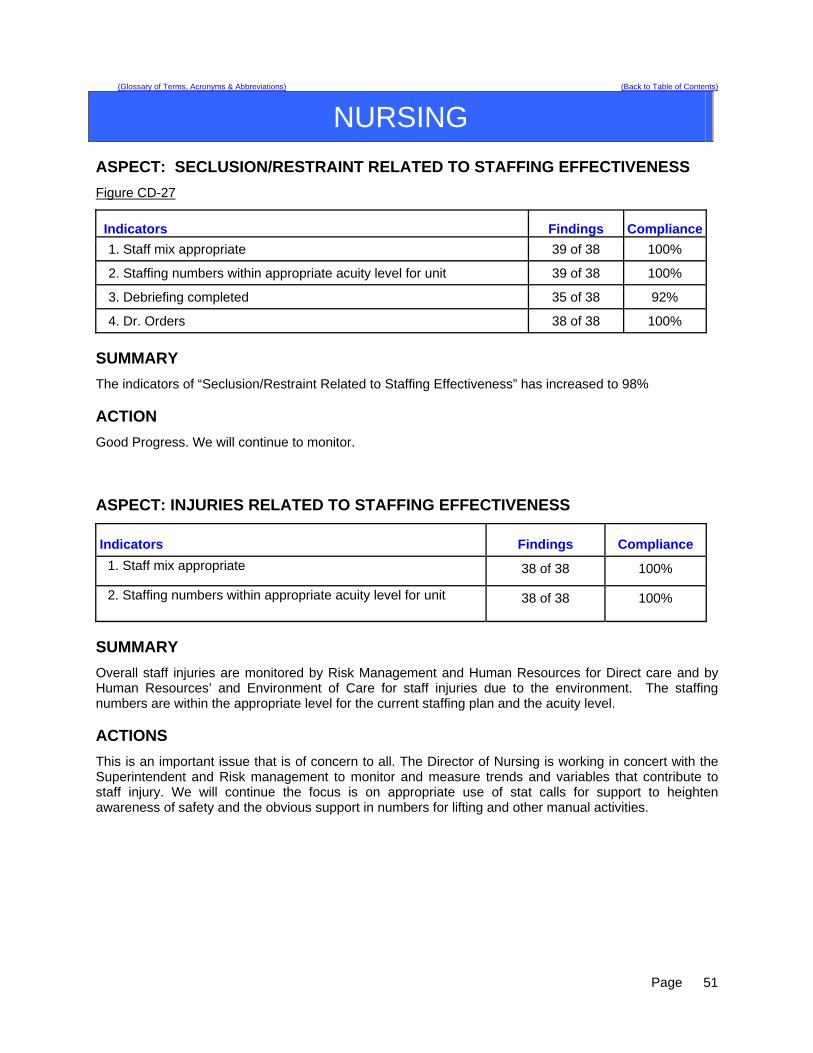
(Glossary of Terms, Acronyms & Abbreviations) (Back to Table of Contents)
NURSING ASPECT: SECLUSION/RESTRAINT RELATED TO STAFFING EFFECTIVENESS
Figure CD-27
Indicators Findings Compliance
1. Staff mix appropriate 39 of 38 100%
2. Staffing numbers within appropriate acuity level for unit 39 of 38 100%
3. Debriefing completed 35 of 38 92%
4. Dr. Orders 38 of 38 100%
SUMMARY
The indicators of “Seclusion/Restraint Related to Staffing Effectiveness” has increased to 98% ACTION
Good Progress. We will continue to monitor. ASPECT: INJURIES RELATED TO STAFFING EFFECTIVENESS
Indicators Findings Compliance
1. Staff mix appropriate 38 of 38 100%
2. Staffing numbers within appropriate acuity level for unit 38 of 38 100%
SUMMARY
Overall staff injuries are monitored by Risk Management and Human Resources for Direct care and by Human Resources’ and Environment of Care for staff injuries due to the environment. The staffing numbers are within the appropriate level for the current staffing plan and the acuity level. ACTIONS
This is an important issue that is of concern to all. The Director of Nursing is working in concert with the Superintendent and Risk management to monitor and measure trends and variables that contribute to staff injury. We will continue the focus is on appropriate use of stat calls for support to heighten awareness of safety and the obvious support in numbers for lifting and other manual activities.
Page
51

Page
52
(Glossary of Terms, Acronyms & Abbreviations) (Back to Table of Contents)
NURSING ASPECT: MEDICATION ERRORS RELATED TO STAFFING EFFECTIVENESS
NURSING: Staffing levels during medication errors – July - Sept 2011 NASMHPD reportable variances
Date Omit Co-mission Float New O/T Unit
Acuity Staff Mix 9/1/11 YY NNoo NNoo LLKK 22 RRNN,, 11 LLPPNN,, 77
MMHHWW 9/6/11 AAccuuddoossee wwaass iinnccoorrrreecctt ––
PPhhaarrmmaaccyy eerrrroorr LLSS PPhhaarrmmaaccyy eerrrroorr
9/8/11 MMeetthhaaddoonnee 1155 mmgg.. ((ddoossee wwaass 1100 mmgg..))
NNoo NNoo NNoo UUKK 22 RRNN,, 11 LLPPNN,, 44 MMHHWW
9/10/11 YY NNoo NNoo FFlleexx LLKK 33 RRNN,, 00 LLPPNN,, 77 MMHHWW
9/14/11 YY NNoo NNoo NNoo LLKK 22 RRNN,, 11 LLPPNN,, 77 MMHHWW
9/15/11 GGaavvee mmeedd ttoo wwrroonngg cclliieenntt,, wwiitthhoouutt uussiinngg iiddeennttiiffiieerrss pprrooppeerrllyy
YYeess,, iiss aa ffllooaatt
NNoo NNoo UUSS 22 RRNN,, 11 LLPPNN,, 44 MMHHWW ((33--1111 sshhiifftt))
9/15/11 YY NNoo NNoo NNoo UUKK 11 RRNN,, 11 LLPPNN,, 33 MMHHWW
9/15/11 YY NNoo NNoo NNoo LLKK 22 RRNN,, 11 LLPPNN,, 77 MMHHWW
9/20/11 WWrroonngg cclliieenntt rreecceeiivveedd mmeeddss YYeess NNoo NNoo LLKK 33 RRNN,, 11 LLPPNN,, 77 MMHHWW
9/21/11 GGaavvee mmeedd aatt wwrroonngg ttiimmee NNoo NNoo NNoo UUKK 33 RRNN,, 00 LLPPNN,, 33 MMHHWW
10/5/11 YY NNoo NNoo NNoo LLSS 22 RRNN,, 11 LLPPNN,, 66 MMHHWW
10/11/11 OOrrddeerr wwrriitttteenn ttoo ssttoopp mmeedd wwaass nnoott ddoonnee
NNoo NNoo NNoo LLSS 22 RRNN,, 11 LLPPNN,, 66 MMHHWW
10/18/11 GGaavvee 22 eexxttrraa ddoosseess ooff mmeedd nnoott oorrddeerreedd –– uuttiilliizzeedd oovveerrrriiddee –– nnoo lloonnggeerr eemmppllooyyeedd
YYeess NNoo NNoo LLKK 22 RRNN,, 11 LLPPNN,, 77 MMHHWW
10/20/11 PPaattcchh nnoott rreemmoovveedd NNoo NNoo NNoo LLSS 33 RRNN,, 11 LLPPNN,, 77 MMHHWW
10/24/11 SScchheedduulleedd ddoossee ooff BBeennaaddrryyll ggiivveenn eeaarrllyy
YYeess NNoo NNoo LLKK 33 RRNN,, 11 LLPPNN,, 77 MMHHWW
11/4/11 YY YYeess ((ccoonnttrraacctt))
NNoo NNoo LLSS 11 RRNN,, 00 LLPPNN,, 66 MMHHWW
11/17/11 YY NNoo NNoo NNoo LLKK 33 RRNN,, 11 LLPPNN,, 77 MMHHWW
11/28/11 YY NNoo NNoo NNoo LLKK 33 RRNN,, 11 LLPPNN,, 77 MMHHWW
12/2/11 OOrrddeerr ssttooppppeedd iinn MMAARRSS -- ccoommpplleettiinngg aa wwrriitttteenn oorrddeerr
NNoo NNoo NNoo LLSS 33 RRNN,, 11 LLPPNN,, 66 MMHHWW
12/3/11 IInnccoorrrreecctt ffoorrmm ooff mmeedd ((ccaappss nnoott lliiqquuiidd)) uuttiilliizzeedd oovveerrrriiddee iinnaapppprroopprriiaatteellyy
NNoo NNoo YYeess UUKK 22 RRNN,, 11 LLPPNN,, 55 MMHHWW
9/1/11 YY NNoo NNoo LLKK 22 RRNN,, 11 LLPPNN,, 77 MMHHWW
9/6/11 AAccuuddoossee wwaass iinnccoorrrreecctt –– PPhhaarrmmaaccyy eerrrroorr
LLSS PPhhaarrmmaaccyy eerrrroorr
9/8/11 MMeetthhaaddoonnee 1155 mmgg.. ((ddoossee wwaass 1100 mmgg..))
NNoo NNoo NNoo UUKK 22 RRNN,, 11 LLPPNN,, 44 MMHHWW
9/10/11 YY NNoo NNoo FFlleexx LLKK 33 RRNN,, 00 LLPPNN,, 77 MMHHWW
9/14/11 YY NNoo NNoo NNoo LLKK 22 RRNN,, 11 LLPPNN,, 77 MMHHWW
9/15/11 GGaavvee mmeedd ttoo wwrroonngg cclliieenntt,, wwiitthhoouutt uussiinngg iiddeennttiiffiieerrss pprrooppeerrllyy
YYeess,, iiss aa ffllooaatt
NNoo NNoo UUSS 22 RRNN,, 11 LLPPNN,, 44 MMHHWW ((33--1111 sshhiifftt))
9/15/11 YY NNoo NNoo NNoo UUKK 11 RRNN,, 11 LLPPNN,, 33 MMHHWW

(Glossary of Terms, Acronyms & Abbreviations) (Back to Table of Contents)
NURSING SUMMARY
There were a total of 20 reportable errors. This is 5 less reported than last quarter. One involved pharmacy, and did not involve staffing effectiveness. 9 were omissions. Two involved transcription error. Six occurrences involved failure to follow procedure, including failure to compare MAR to Acudose (3), unclear order not clarified (1), and utilizing the override capability of the Acudose machine inappropriately (2). Three other instances involved leaving a client’s medications in a med box (3), and one error was the result of a failure to properly identify the client, who had a similar name to another. This nurse was counseled and has since left employment at RPC.
Actions
Review of override procedure with pharmacy input. This procedure was reviewed at Nursing Leadership to be reviewed with all nurses. Client med boxes were removed from med rooms to avoid pre-pulling of meds. The medication administration time was extended to one hour pre and post administration time to facilitate medication administration. All nursing related med variances were noted to have appropriate staffing levels. One med error appeared to be the result of unit acuity. ASPECT: PAIN MANAGEMENT
Indicator Findings Compliance
Pre-administration Assessed using pain scale 764 OF 765 100%
Post-administration Assessed using pain scale 616 OF 765 81%
SUMMARY The “Pre-administration assessment” indicator met the maximum compliance of 100% this quarter and there is a decrease in post-assessment from 92% last quarter to 88% “post-administration” assessment using the pain scale.
ACTION We believe that the decrease in compliance for “Post-administration” assessment is a ongoing problem. Post assessment will be trended by unit and shift with an actual Root Cause Analysis being done. Nursing will continue to place a great deal of attention and effort on post administration assessment and management of the related documentation. Nursing will continue to track this indicator and strive for increase in post assessment in the next quarter. The two ADONs will continue to work with unit nursing staff and Nurse IV’s to assure that this is done consistently.
Page
53
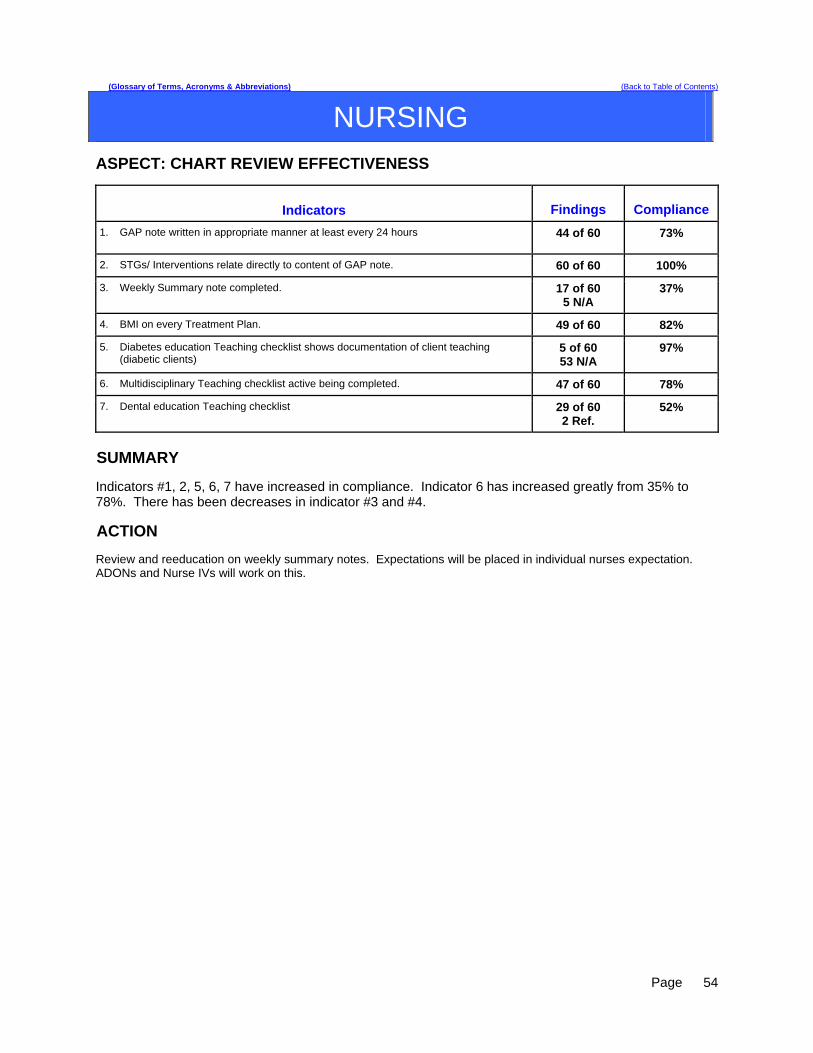
(Glossary of Terms, Acronyms & Abbreviations) (Back to Table of Contents)
NURSING
ASPECT: CHART REVIEW EFFECTIVENESS
Indicators Findings Compliance
1. GAP note written in appropriate manner at least every 24 hours 44 of 60 73%
2. STGs/ Interventions relate directly to content of GAP note. 60 of 60 100%
3. Weekly Summary note completed. 17 of 60 5 N/A
37%
4. BMI on every Treatment Plan. 49 of 60 82%
5. Diabetes education Teaching checklist shows documentation of client teaching (diabetic clients)
5 of 60 53 N/A
97%
6. Multidisciplinary Teaching checklist active being completed. 47 of 60 78%
7. Dental education Teaching checklist 29 of 60 2 Ref.
52%
SUMMARY Indicators #1, 2, 5, 6, 7 have increased in compliance. Indicator 6 has increased greatly from 35% to 78%. There has been decreases in indicator #3 and #4.
ACTION Review and reeducation on weekly summary notes. Expectations will be placed in individual nurses expectation. ADONs and Nurse IVs will work on this.
Page
54

(Glossary of Terms, Acronyms & Abbreviations) (Back to Table of Contents)
NURSING
ASPECT: INITIAL CHART COMPLIANCE
Indicator Findings Compliance 1. Universal Assessment completed by RN within 24 hours 61 of 61 100%
2. All sections completed or deferred within document 61 of 61 100%
3. Initial Safety Treatment Plan initiated 61 of 61 100%
4. All sheets required signature authenticated by assessing RN 61 of 61 100%
5. Medical Care Plan initiated if Medical problems identified 14 of 61 47 N/A
100%
6. Informed Consent sheet signed 59 of 61 1 Ref. 1 Unable
100%
7. Potential for violence assessment upon admission 59 of 61 97%
8. Suicide potential assessed upon admission 61 of 61 100%
9. Fall Risk assessment completed upon admission 60 of 61 98%
10. Score of 5 or above incorporated into problem need list 14 of 61 46 N/A
100%
11. Dangerous Risk Tool done upon admission 59 of 61 97%
12. Score of 11 or above incorporated into Safety Problem 43 of 61 18 N/A
100%
SUMMARY
All aspects are at 100% except Dangerous Risk tool at 97% and Fall Risk at 98%. ACTION
Assure complete and thorough education of new Nurses by reviewing as necessary. Allow more time for them to function in medication delivery under supervision. Continue to monitor.
Page
55
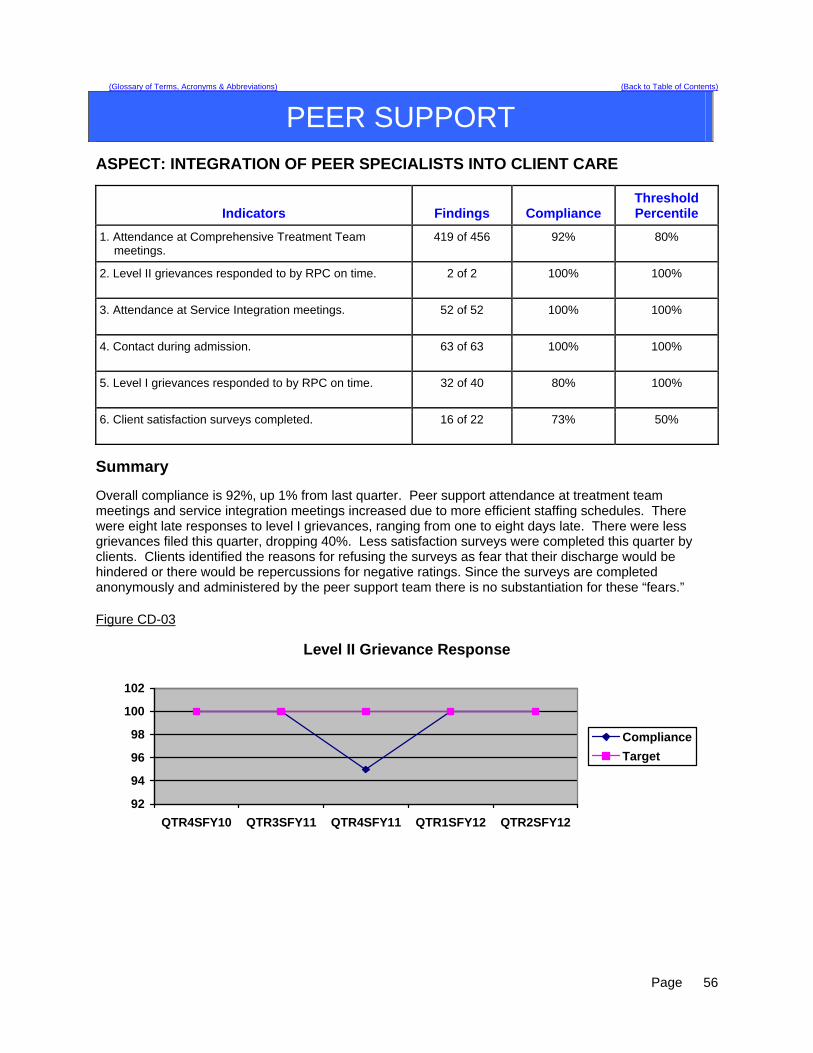
(Glossary of Terms, Acronyms & Abbreviations) (Back to Table of Contents)
PEER SUPPORT
ASPECT: INTEGRATION OF PEER SPECIALISTS INTO CLIENT CARE
Indicators Findings Compliance Threshold Percentile
1. Attendance at Comprehensive Treatment Team meetings.
419 of 456 92% 80%
2. Level II grievances responded to by RPC on time.
2 of 2 100% 100%
3. Attendance at Service Integration meetings. 52 of 52 100% 100%
4. Contact during admission. 63 of 63 100% 100%
5. Level I grievances responded to by RPC on time. 32 of 40 80% 100%
6. Client satisfaction surveys completed. 16 of 22 73% 50%
Summary Overall compliance is 92%, up 1% from last quarter. Peer support attendance at treatment team meetings and service integration meetings increased due to more efficient staffing schedules. There were eight late responses to level I grievances, ranging from one to eight days late. There were less grievances filed this quarter, dropping 40%. Less satisfaction surveys were completed this quarter by clients. Clients identified the reasons for refusing the surveys as fear that their discharge would be hindered or there would be repercussions for negative ratings. Since the surveys are completed anonymously and administered by the peer support team there is no substantiation for these “fears.” Figure CD-03
Level II Grievance Response
92
94
96
98
100
102
QTR4SFY10 QTR3SFY11 QTR4SFY11 QTR1SFY12 QTR2SFY12
Compliance
Target
Page
56
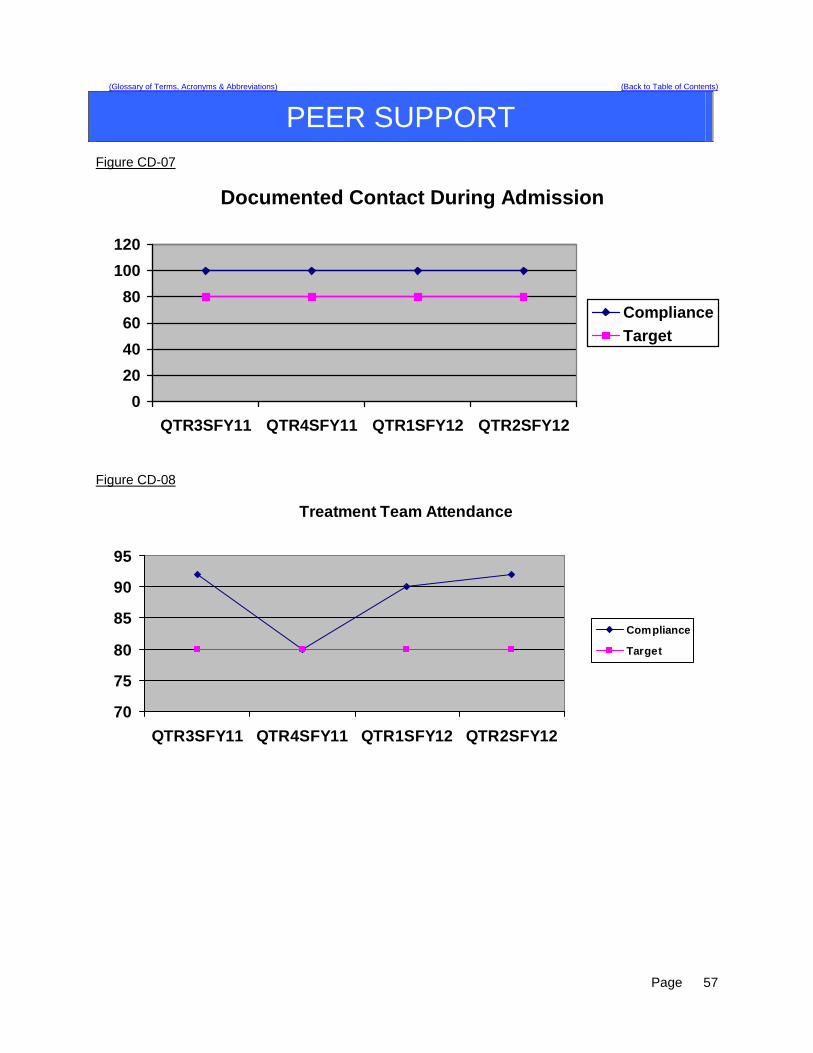
(Glossary of Terms, Acronyms & Abbreviations) (Back to Table of Contents)
PEER SUPPORT Figure CD-07
Documented Contact During Admission
0
20
40
60
80
100
120
QTR3SFY11 QTR4SFY11 QTR1SFY12 QTR2SFY12
Compliance
Target
Figure CD-08
Treatment Team Attendance
70
75
80
85
90
95
QTR3SFY11 QTR4SFY11 QTR1SFY12 QTR2SFY12
Compliance
Target
Page
57
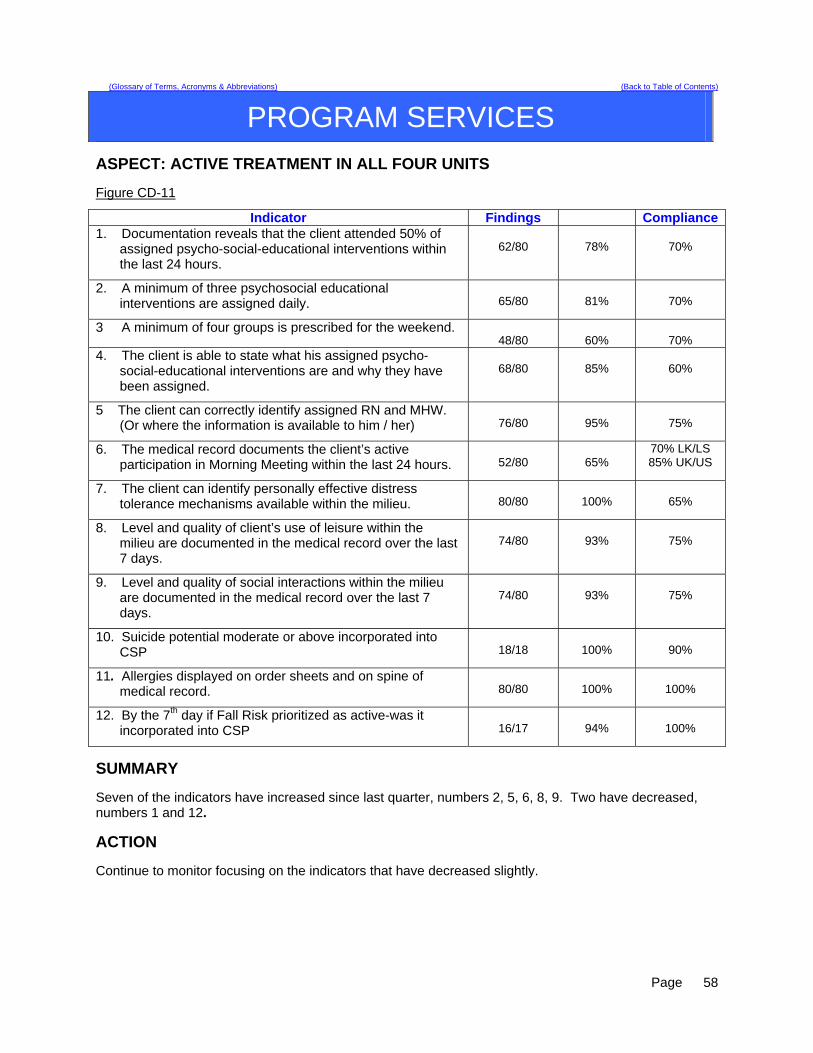
(Glossary of Terms, Acronyms & Abbreviations) (Back to Table of Contents)
PROGRAM SERVICES
ASPECT: ACTIVE TREATMENT IN ALL FOUR UNITS Figure CD-11
Indicator Findings Compliance1. Documentation reveals that the client attended 50% of
assigned psycho-social-educational interventions within the last 24 hours.
62/80
78%
70%
2. A minimum of three psychosocial educational interventions are assigned daily.
65/80
81%
70%
3 A minimum of four groups is prescribed for the weekend. 48/80
60%
70%
4. The client is able to state what his assigned psycho-social-educational interventions are and why they have been assigned.
68/80
85%
60%
5 The client can correctly identify assigned RN and MHW. (Or where the information is available to him / her)
76/80
95%
75%
6. The medical record documents the client’s active participation in Morning Meeting within the last 24 hours.
52/80
65%
70% LK/LS 85% UK/US
7. The client can identify personally effective distress tolerance mechanisms available within the milieu.
80/80
100%
65%
8. Level and quality of client’s use of leisure within the milieu are documented in the medical record over the last 7 days.
74/80
93%
75%
9. Level and quality of social interactions within the milieu are documented in the medical record over the last 7 days.
74/80
93%
75%
10. Suicide potential moderate or above incorporated into CSP
18/18
100%
90%
11. Allergies displayed on order sheets and on spine of medical record.
80/80
100%
100%
12. By the 7th day if Fall Risk prioritized as active-was it incorporated into CSP
16/17
94%
100%
SUMMARY Seven of the indicators have increased since last quarter, numbers 2, 5, 6, 8, 9. Two have decreased, numbers 1 and 12.
ACTION Continue to monitor focusing on the indicators that have decreased slightly.
Page
58
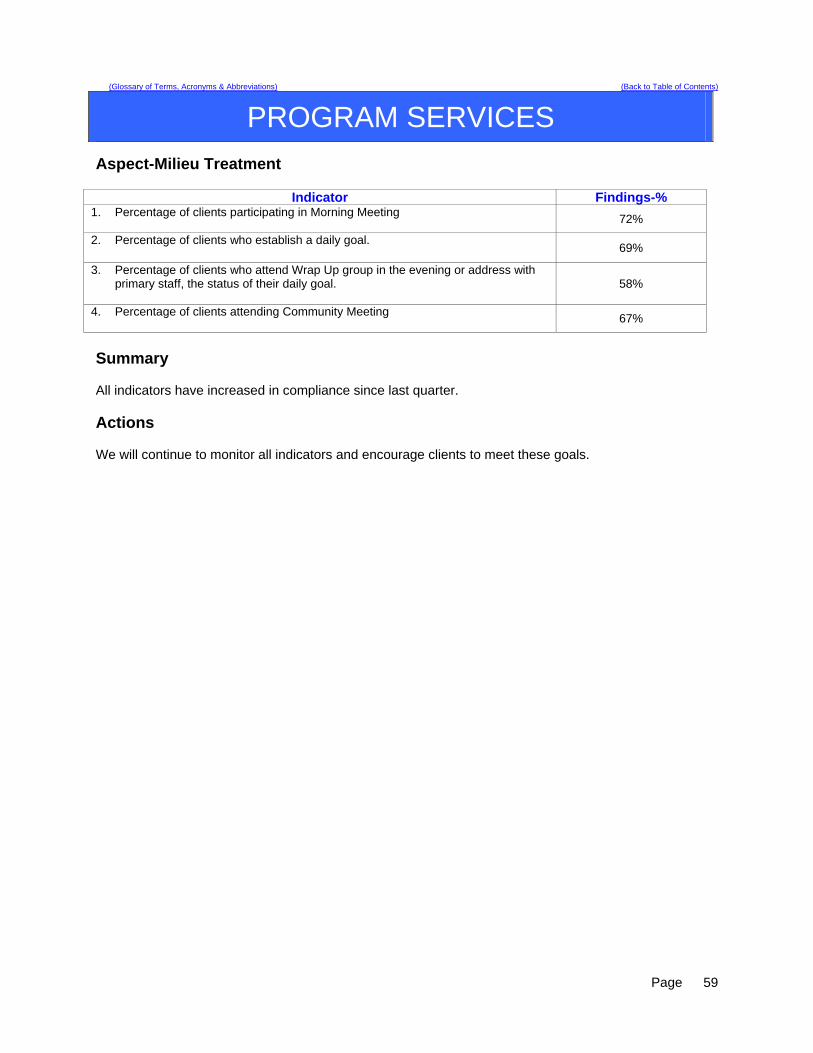
(Glossary of Terms, Acronyms & Abbreviations) (Back to Table of Contents)
PROGRAM SERVICES
Aspect-Milieu Treatment
Indicator Findings-% 1. Percentage of clients participating in Morning Meeting
72%
2. Percentage of clients who establish a daily goal. 69%
3. Percentage of clients who attend Wrap Up group in the evening or address with primary staff, the status of their daily goal.
58%
4. Percentage of clients attending Community Meeting
67%
Summary All indicators have increased in compliance since last quarter. Actions We will continue to monitor all indicators and encourage clients to meet these goals.
Page
59
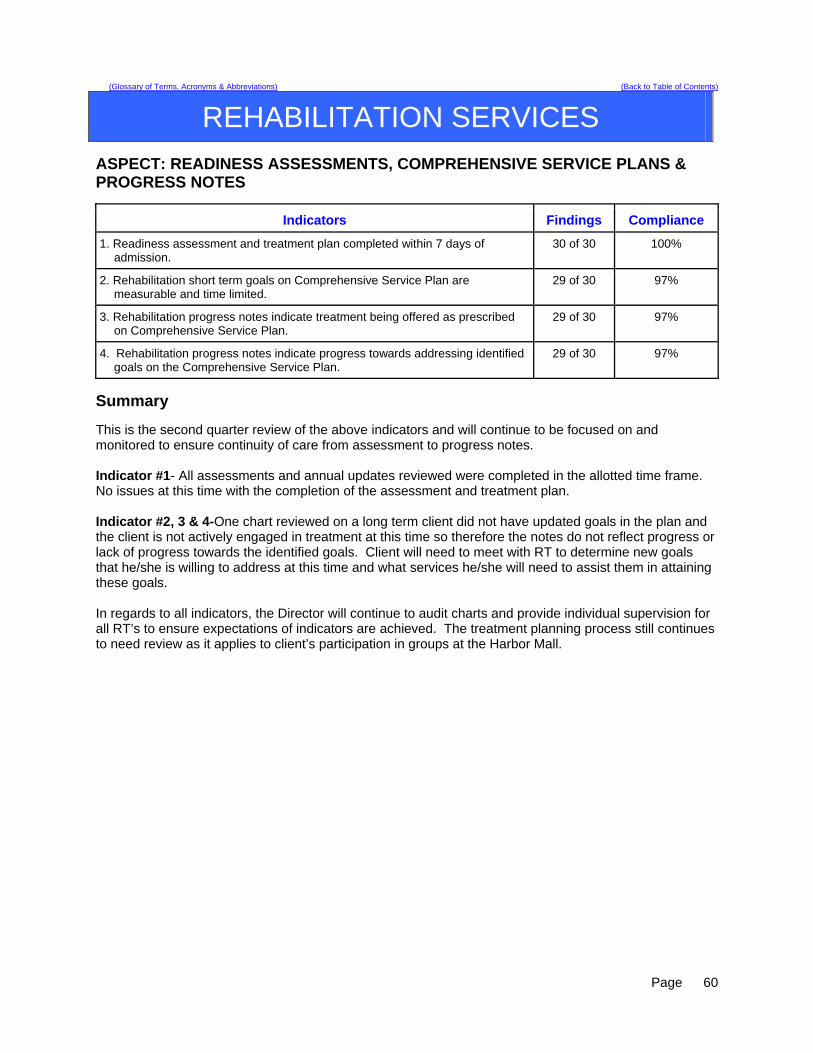
(Glossary of Terms, Acronyms & Abbreviations) (Back to Table of Contents)
REHABILITATION SERVICES
ASPECT: READINESS ASSESSMENTS, COMPREHENSIVE SERVICE PLANS & PROGRESS NOTES
Indicators Findings Compliance
1. Readiness assessment and treatment plan completed within 7 days of admission.
30 of 30 100%
2. Rehabilitation short term goals on Comprehensive Service Plan are measurable and time limited.
29 of 30 97%
3. Rehabilitation progress notes indicate treatment being offered as prescribed on Comprehensive Service Plan.
29 of 30 97%
4. Rehabilitation progress notes indicate progress towards addressing identified goals on the Comprehensive Service Plan.
29 of 30 97%
Summary This is the second quarter review of the above indicators and will continue to be focused on and monitored to ensure continuity of care from assessment to progress notes. Indicator #1- All assessments and annual updates reviewed were completed in the allotted time frame. No issues at this time with the completion of the assessment and treatment plan. Indicator #2, 3 & 4-One chart reviewed on a long term client did not have updated goals in the plan and the client is not actively engaged in treatment at this time so therefore the notes do not reflect progress or lack of progress towards the identified goals. Client will need to meet with RT to determine new goals that he/she is willing to address at this time and what services he/she will need to assist them in attaining these goals. In regards to all indicators, the Director will continue to audit charts and provide individual supervision for all RT’s to ensure expectations of indicators are achieved. The treatment planning process still continues to need review as it applies to client’s participation in groups at the Harbor Mall.
Page
60
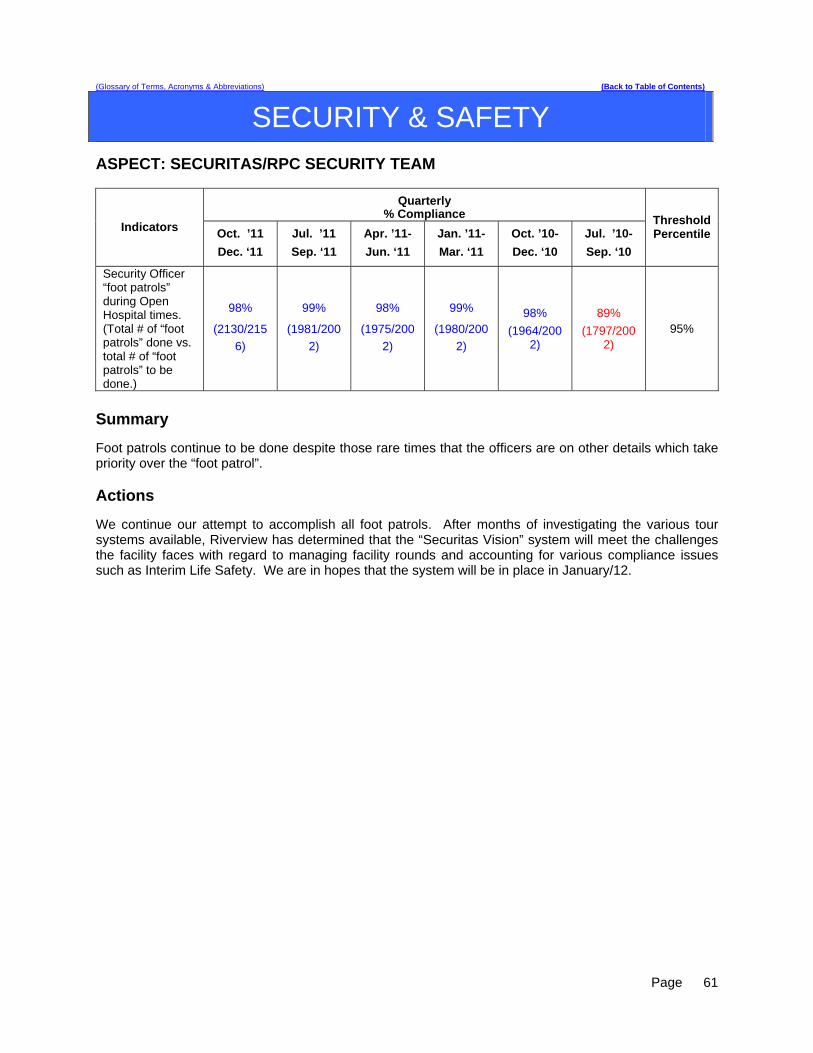
(Glossary of Terms, Acronyms & Abbreviations) (Back to Table of Contents)
SECURITY & SAFETY
ASPECT: SECURITAS/RPC SECURITY TEAM
Quarterly % Compliance
Indicators Oct. ’11
Dec. ‘11
Jul. ’11
Sep. ‘11
Apr. ’11-
Jun. ‘11
Jan. ’11-
Mar. ‘11
Oct. ’10-
Dec. ‘10
Jul. ’10-
Sep. ‘10
Threshold Percentile
Security Officer “foot patrols” during Open Hospital times. (Total # of “foot patrols” done vs. total # of “foot patrols” to be done.)
98%
(2130/215
6)
99%
(1981/200
2)
98%
(1975/200
2)
99%
(1980/200
2)
98%
(1964/2002)
89%
(1797/2002)
95%
Summary Foot patrols continue to be done despite those rare times that the officers are on other details which take priority over the “foot patrol”. Actions We continue our attempt to accomplish all foot patrols. After months of investigating the various tour systems available, Riverview has determined that the “Securitas Vision” system will meet the challenges the facility faces with regard to managing facility rounds and accounting for various compliance issues such as Interim Life Safety. We are in hopes that the system will be in place in January/12.
Page
61
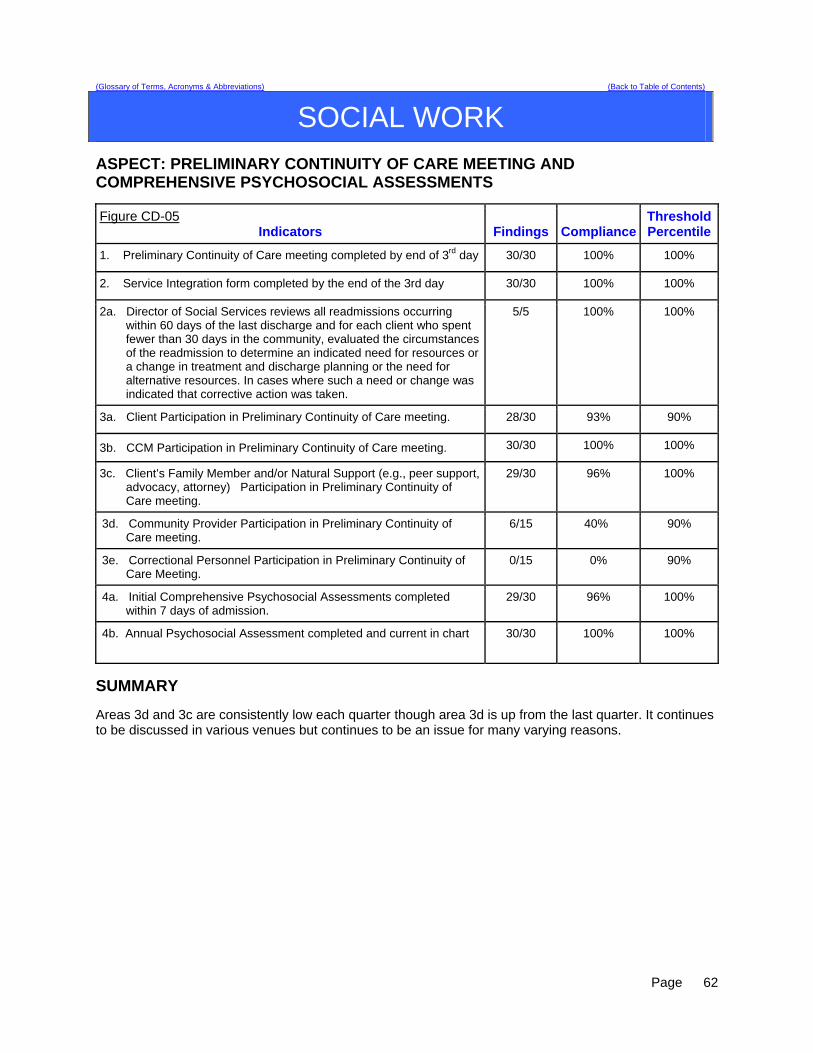
(Glossary of Terms, Acronyms & Abbreviations) (Back to Table of Contents)
SOCIAL WORK
ASPECT: PRELIMINARY CONTINUITY OF CARE MEETING AND COMPREHENSIVE PSYCHOSOCIAL ASSESSMENTS
Figure CD-05 Indicators Findings Compliance
ThresholdPercentile
1. Preliminary Continuity of Care meeting completed by end of 3rd day 30/30 100% 100%
2. Service Integration form completed by the end of the 3rd day 30/30 100% 100%
2a. Director of Social Services reviews all readmissions occurring within 60 days of the last discharge and for each client who spent fewer than 30 days in the community, evaluated the circumstances of the readmission to determine an indicated need for resources or a change in treatment and discharge planning or the need for alternative resources. In cases where such a need or change was indicated that corrective action was taken.
5/5 100% 100%
3a. Client Participation in Preliminary Continuity of Care meeting. 28/30 93% 90%
3b. CCM Participation in Preliminary Continuity of Care meeting. 30/30 100% 100%
3c. Client’s Family Member and/or Natural Support (e.g., peer support, advocacy, attorney) Participation in Preliminary Continuity of Care meeting.
29/30 96% 100%
3d. Community Provider Participation in Preliminary Continuity of Care meeting.
6/15 40% 90%
3e. Correctional Personnel Participation in Preliminary Continuity of Care Meeting.
0/15 0% 90%
4a. Initial Comprehensive Psychosocial Assessments completed within 7 days of admission.
29/30 96% 100%
4b. Annual Psychosocial Assessment completed and current in chart 30/30 100% 100%
SUMMARY Areas 3d and 3c are consistently low each quarter though area 3d is up from the last quarter. It continues to be discussed in various venues but continues to be an issue for many varying reasons.
Page
62
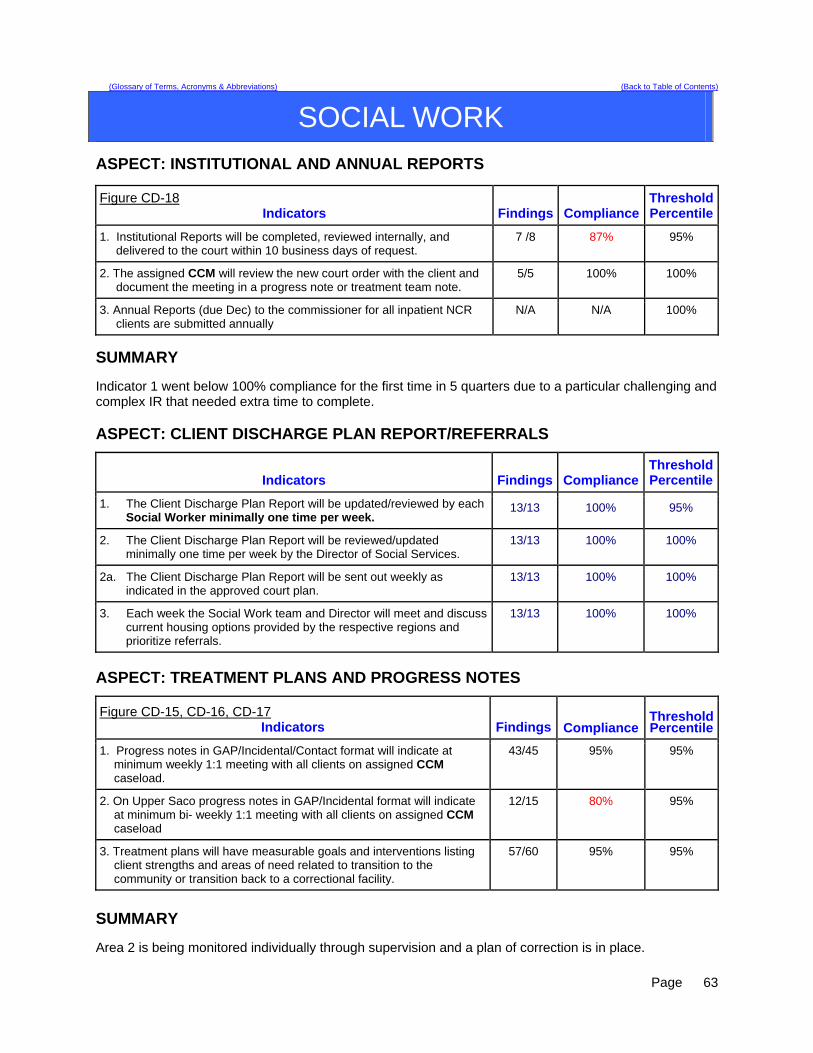
(Glossary of Terms, Acronyms & Abbreviations) (Back to Table of Contents)
SOCIAL WORK
ASPECT: INSTITUTIONAL AND ANNUAL REPORTS
Figure CD-18 Indicators Findings Compliance
ThresholdPercentile
1. Institutional Reports will be completed, reviewed internally, and delivered to the court within 10 business days of request.
7 /8 87% 95%
2. The assigned CCM will review the new court order with the client and document the meeting in a progress note or treatment team note.
5/5 100% 100%
3. Annual Reports (due Dec) to the commissioner for all inpatient NCR clients are submitted annually
N/A N/A 100%
SUMMARY Indicator 1 went below 100% compliance for the first time in 5 quarters due to a particular challenging and complex IR that needed extra time to complete. ASPECT: CLIENT DISCHARGE PLAN REPORT/REFERRALS
Indicators Findings Compliance ThresholdPercentile
1. The Client Discharge Plan Report will be updated/reviewed by each Social Worker minimally one time per week.
13/13 100% 95%
2. The Client Discharge Plan Report will be reviewed/updated minimally one time per week by the Director of Social Services.
13/13 100% 100%
2a. The Client Discharge Plan Report will be sent out weekly as indicated in the approved court plan.
13/13 100% 100%
3. Each week the Social Work team and Director will meet and discuss current housing options provided by the respective regions and prioritize referrals.
13/13 100% 100%
ASPECT: TREATMENT PLANS AND PROGRESS NOTES
Figure CD-15, CD-16, CD-17 Indicators Findings Compliance
ThresholdPercentile
1. Progress notes in GAP/Incidental/Contact format will indicate at minimum weekly 1:1 meeting with all clients on assigned CCM caseload.
43/45 95% 95%
2. On Upper Saco progress notes in GAP/Incidental format will indicate at minimum bi- weekly 1:1 meeting with all clients on assigned CCM caseload
12/15 80% 95%
3. Treatment plans will have measurable goals and interventions listing client strengths and areas of need related to transition to the community or transition back to a correctional facility.
57/60 95% 95%
SUMMARY Area 2 is being monitored individually through supervision and a plan of correction is in place.
Page
63
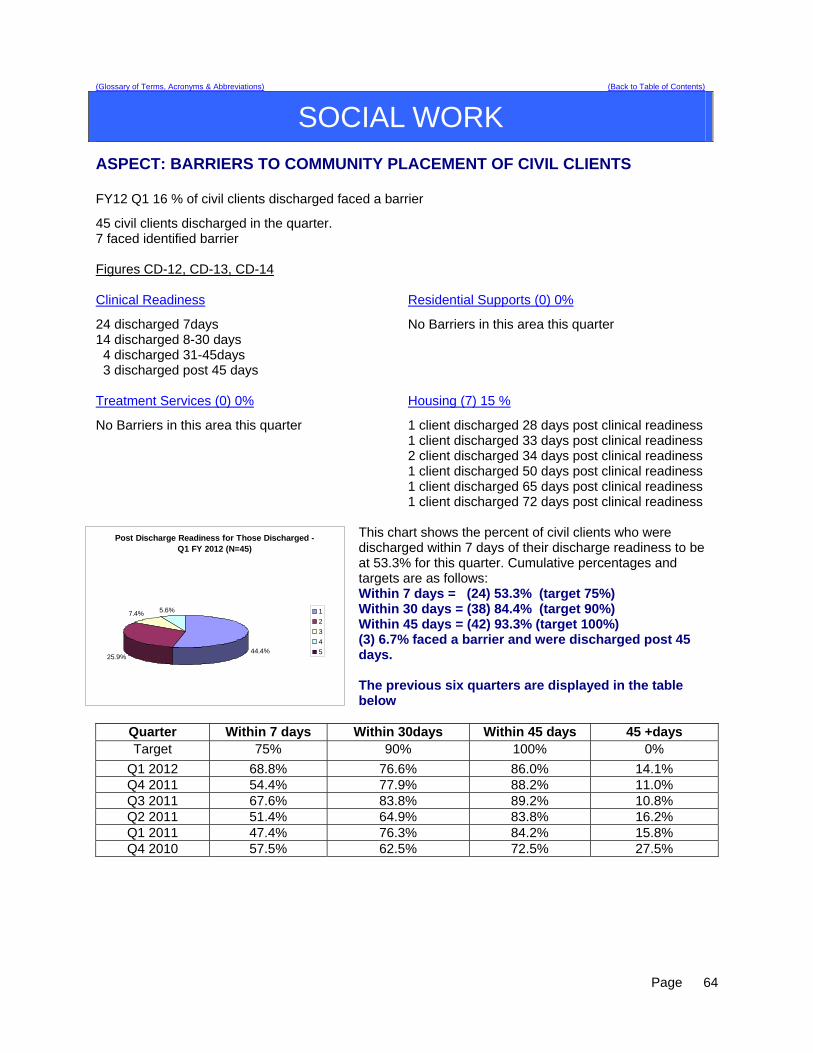
(Glossary of Terms, Acronyms & Abbreviations) (Back to Table of Contents)
SOCIAL WORK
ASPECT: BARRIERS TO COMMUNITY PLACEMENT OF CIVIL CLIENTS FY12 Q1 16 % of civil clients discharged faced a barrier
45 civil clients discharged in the quarter. 7 faced identified barrier Figures CD-12, CD-13, CD-14 Clinical Readiness
Residential Supports (0) 0%
24 discharged 7days 14 discharged 8-30 days 4 discharged 31-45days 3 discharged post 45 days
No Barriers in this area this quarter
Treatment Services (0) 0%
Housing (7) 15 %
No Barriers in this area this quarter
1 client discharged 28 days post clinical readiness 1 client discharged 33 days post clinical readiness 2 client discharged 34 days post clinical readiness 1 client discharged 50 days post clinical readiness 1 client discharged 65 days post clinical readiness 1 client discharged 72 days post clinical readiness
This chart shows the percent of civil clients who were discharged within 7 days of their discharge readiness to be at 53.3% for this quarter. Cumulative percentages and targets are as f
Post Discharge Readiness for Those Discharged - Q1 FY 2012 (N=45)
44.4%25.9%
7.4% 5.6% 1
2
3
4
5
ollows:
Within 7 days = (24) 53.3% (target 75%) Within 30 days = (38) 84.4% (target 90%) Within 45 days = (42) 93.3% (target 100%) (3) 6.7% faced a barrier and were discharged post 45 days. The previous six quarters are displayed in the table below
Quarter Within 7 days Within 30days Within 45 days 45 +days Target 75% 90% 100% 0%
Q1 2012 68.8% 76.6% 86.0% 14.1% Q4 2011 54.4% 77.9% 88.2% 11.0% Q3 2011 67.6% 83.8% 89.2% 10.8% Q2 2011 51.4% 64.9% 83.8% 16.2% Q1 2011 47.4% 76.3% 84.2% 15.8% Q4 2010 57.5% 62.5% 72.5% 27.5%
Page
64

(Glossary of Terms, Acronyms & Abbreviations) (Back to Table of Contents)
STAFF DEVELOPMENT
ASPECT: NEW EMPLOYEE AND MANDATORY TRAINING Figure CD-19 and CD-20
Indicators
Quarterly Findings
YTD Findings
Compliance Threshold Percentile
1. New employees will complete new employee orientation within 60 days of hire.
28 of 28 completed orientation
47 of 47 scheduled employees completed orientation
100%
100 %
2. New employees will complete CPR training within 30 days of hire.
28 of 28 completed CPR
training
47 of 47 scheduled employees completed
CPR training
100%
100 %
3. New employees will complete NAPPI training within 60 days of hire.
28 of 28 completed
Nappi training
47 of 47 scheduled employees completed
NAPPI training
100%
100 %
4. Riverview and Contract staff will attend CPR training bi-annually.
38 of 38 attended
scheduled CPR Recertification
74 of 74 scheduled employees completed
CPR training
99%
100 %
5. Riverview and Contract staff will attend NAPPI training annually.
148 of 148 have
completed NAPPI training
214 of 214 scheduled employees completed
NAPPI training
24%
100 %
6. Riverview and Contract staff will attend Annual training.
73 of 73 have completed
annual training
289 of 289 have
completed annual training
56%
100 %
Findings The indicators are based on the requirements for all new/current staff to complete mandatory training and maintain current certifications. 28 out 28 of (100%) new Riverview/Contract employees completed these trainings. 38 of 38 (100%) Riverview/Contract employees attended a CPR certification. 28 of 28 (100%) Riverview/Contract employees attended Nappi training. 73 of 73 (100%) employees complete Annual training. All indicators remained at 100% compliance for quarter 2-FY 2012.
Page
65
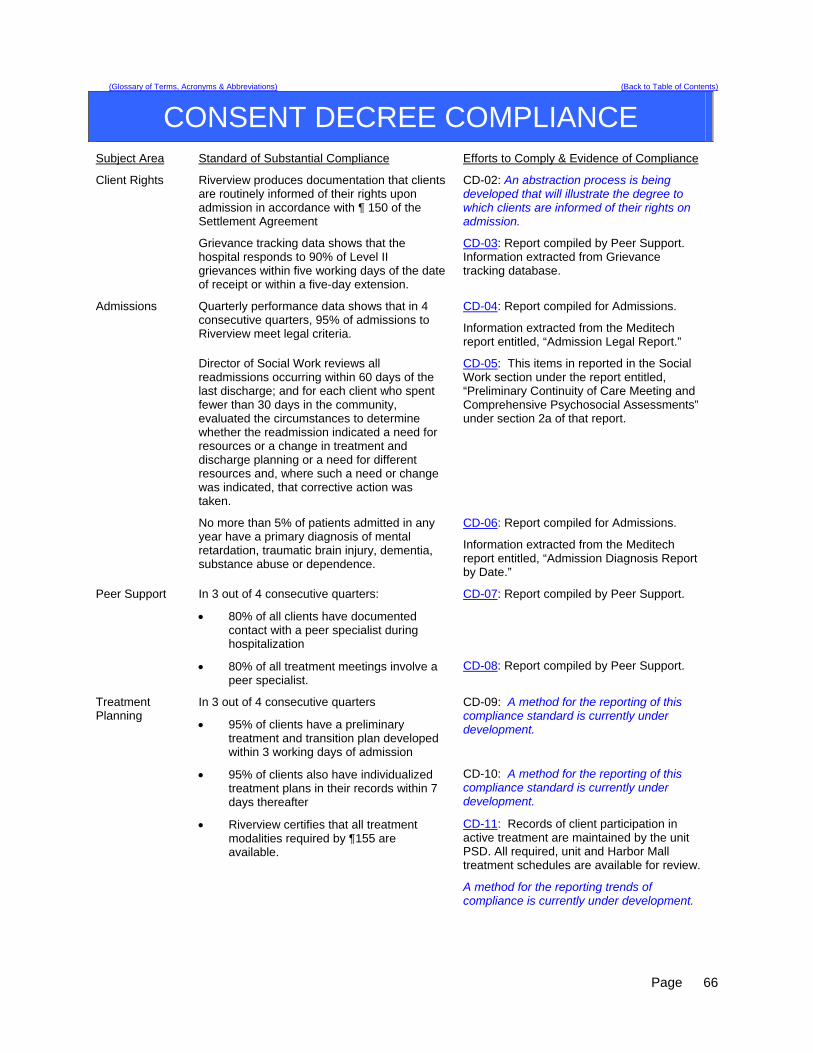
(Glossary of Terms, Acronyms & Abbreviations) (Back to Table of Contents)
CONSENT DECREE COMPLIANCE
Subject Area Standard of Substantial Compliance Efforts to Comply & Evidence of Compliance
Riverview produces documentation that clients are routinely informed of their rights upon admission in accordance with ¶ 150 of the Settlement Agreement
CD-02: An abstraction process is being developed that will illustrate the degree to which clients are informed of their rights on admission.
Client Rights
Grievance tracking data shows that the hospital responds to 90% of Level II grievances within five working days of the date of receipt or within a five-day extension.
CD-03: Report compiled by Peer Support. Information extracted from Grievance tracking database.
Quarterly performance data shows that in 4 consecutive quarters, 95% of admissions to Riverview meet legal criteria.
CD-04: Report compiled for Admissions.
Information extracted from the Meditech report entitled, “Admission Legal Report.”
Director of Social Work reviews all readmissions occurring within 60 days of the last discharge; and for each client who spent fewer than 30 days in the community, evaluated the circumstances to determine whether the readmission indicated a need for resources or a change in treatment and discharge planning or a need for different resources and, where such a need or change was indicated, that corrective action was taken.
CD-05: This items in reported in the Social Work section under the report entitled, “Preliminary Continuity of Care Meeting and Comprehensive Psychosocial Assessments” under section 2a of that report.
Admissions
No more than 5% of patients admitted in any year have a primary diagnosis of mental retardation, traumatic brain injury, dementia, substance abuse or dependence.
CD-06: Report compiled for Admissions.
Information extracted from the Meditech report entitled, “Admission Diagnosis Report by Date.”
In 3 out of 4 consecutive quarters:
80% of all clients have documented contact with a peer specialist during hospitalization
CD-07: Report compiled by Peer Support. Peer Support
80% of all treatment meetings involve a peer specialist.
CD-08: Report compiled by Peer Support.
In 3 out of 4 consecutive quarters
95% of clients have a preliminary treatment and transition plan developed within 3 working days of admission
CD-09: A method for the reporting of this compliance standard is currently under development.
95% of clients also have individualized treatment plans in their records within 7 days thereafter
CD-10: A method for the reporting of this compliance standard is currently under development.
Treatment Planning
Riverview certifies that all treatment modalities required by ¶155 are available.
CD-11: Records of client participation in active treatment are maintained by the unit PSD. All required, unit and Harbor Mall treatment schedules are available for review.
A method for the reporting trends of compliance is currently under development.
Page
66
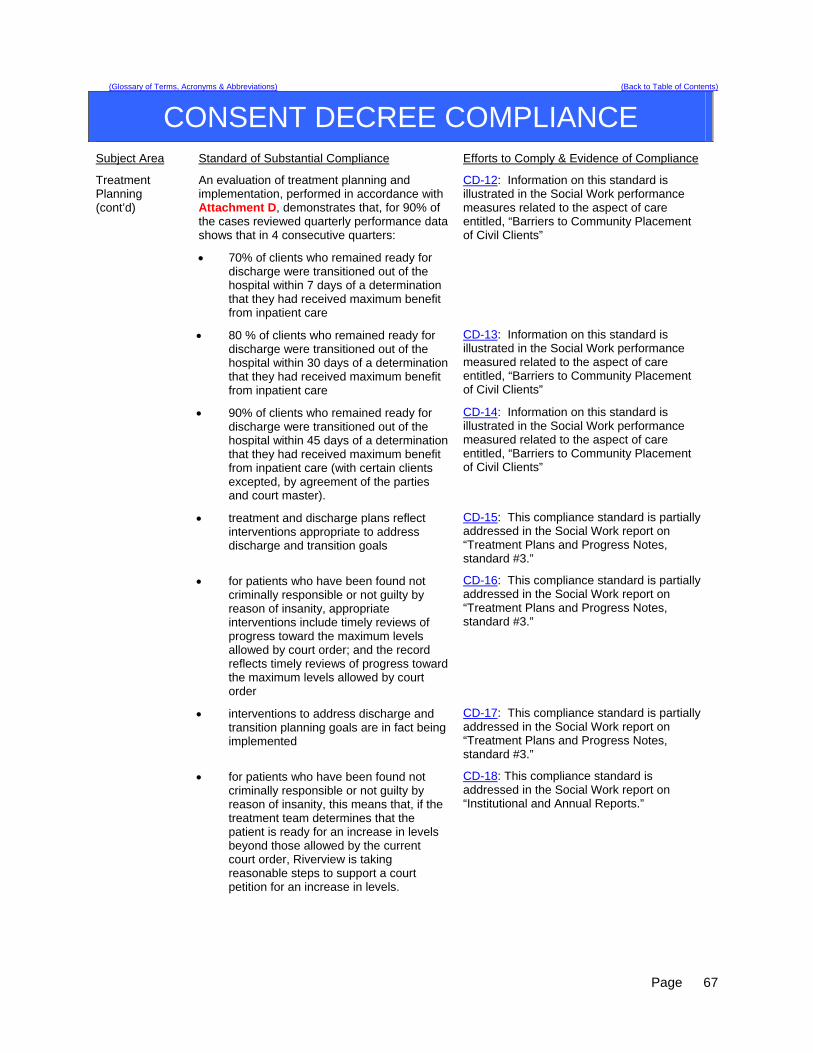
(Glossary of Terms, Acronyms & Abbreviations) (Back to Table of Contents)
CONSENT DECREE COMPLIANCE
Subject Area Standard of Substantial Compliance Efforts to Comply & Evidence of Compliance
An evaluation of treatment planning and implementation, performed in accordance with Attachment D, demonstrates that, for 90% of the cases reviewed quarterly performance data shows that in 4 consecutive quarters:
70% of clients who remained ready for discharge were transitioned out of the hospital within 7 days of a determination that they had received maximum benefit from inpatient care
CD-12: Information on this standard is illustrated in the Social Work performance measures related to the aspect of care entitled, “Barriers to Community Placement of Civil Clients”
80 % of clients who remained ready for discharge were transitioned out of the hospital within 30 days of a determination that they had received maximum benefit from inpatient care
CD-13: Information on this standard is illustrated in the Social Work performance measured related to the aspect of care entitled, “Barriers to Community Placement of Civil Clients”
90% of clients who remained ready for discharge were transitioned out of the hospital within 45 days of a determination that they had received maximum benefit from inpatient care (with certain clients excepted, by agreement of the parties and court master).
CD-14: Information on this standard is illustrated in the Social Work performance measured related to the aspect of care entitled, “Barriers to Community Placement of Civil Clients”
treatment and discharge plans reflect interventions appropriate to address discharge and transition goals
CD-15: This compliance standard is partially addressed in the Social Work report on “Treatment Plans and Progress Notes, standard #3.”
for patients who have been found not criminally responsible or not guilty by reason of insanity, appropriate interventions include timely reviews of progress toward the maximum levels allowed by court order; and the record reflects timely reviews of progress toward the maximum levels allowed by court order
CD-16: This compliance standard is partially addressed in the Social Work report on “Treatment Plans and Progress Notes, standard #3.”
interventions to address discharge and transition planning goals are in fact being implemented
CD-17: This compliance standard is partially addressed in the Social Work report on “Treatment Plans and Progress Notes, standard #3.”
Treatment Planning (cont’d)
for patients who have been found not criminally responsible or not guilty by reason of insanity, this means that, if the treatment team determines that the patient is ready for an increase in levels beyond those allowed by the current court order, Riverview is taking reasonable steps to support a court petition for an increase in levels.
CD-18: This compliance standard is addressed in the Social Work report on “Institutional and Annual Reports.”
Page
67
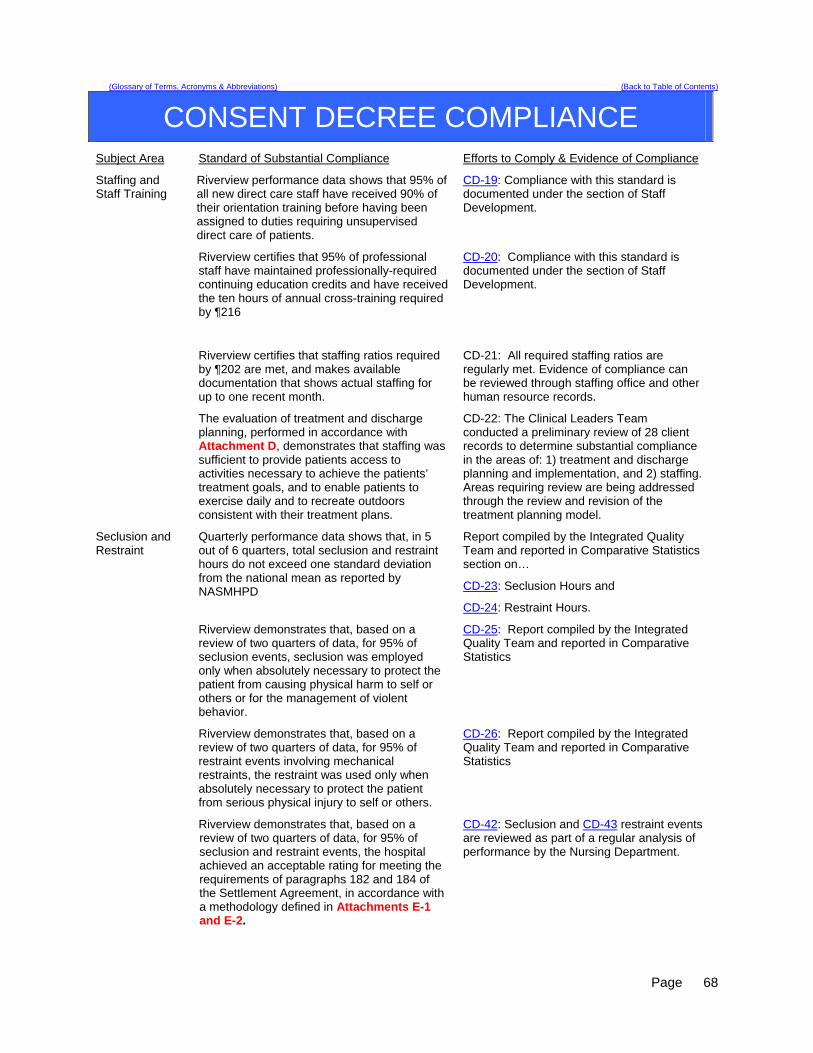
(Glossary of Terms, Acronyms & Abbreviations) (Back to Table of Contents)
CONSENT DECREE COMPLIANCE
Subject Area Standard of Substantial Compliance Efforts to Comply & Evidence of Compliance
Riverview performance data shows that 95% of all new direct care staff have received 90% of their orientation training before having been assigned to duties requiring unsupervised direct care of patients.
CD-19: Compliance with this standard is documented under the section of Staff Development.
Riverview certifies that 95% of professional staff have maintained professionally-required continuing education credits and have received the ten hours of annual cross-training required by ¶216
CD-20: Compliance with this standard is documented under the section of Staff Development.
Riverview certifies that staffing ratios required by ¶202 are met, and makes available documentation that shows actual staffing for up to one recent month.
CD-21: All required staffing ratios are regularly met. Evidence of compliance can be reviewed through staffing office and other human resource records.
Staffing and Staff Training
The evaluation of treatment and discharge planning, performed in accordance with Attachment D, demonstrates that staffing was sufficient to provide patients access to activities necessary to achieve the patients’ treatment goals, and to enable patients to exercise daily and to recreate outdoors consistent with their treatment plans.
CD-22: The Clinical Leaders Team conducted a preliminary review of 28 client records to determine substantial compliance in the areas of: 1) treatment and discharge planning and implementation, and 2) staffing. Areas requiring review are being addressed through the review and revision of the treatment planning model.
Quarterly performance data shows that, in 5 out of 6 quarters, total seclusion and restraint hours do not exceed one standard deviation from the national mean as reported by NASMHPD
Report compiled by the Integrated Quality Team and reported in Comparative Statistics section on…
CD-23: Seclusion Hours and
CD-24: Restraint Hours.
Riverview demonstrates that, based on a review of two quarters of data, for 95% of seclusion events, seclusion was employed only when absolutely necessary to protect the patient from causing physical harm to self or others or for the management of violent behavior.
CD-25: Report compiled by the Integrated Quality Team and reported in Comparative Statistics
Seclusion and Restraint
Riverview demonstrates that, based on a review of two quarters of data, for 95% of restraint events involving mechanical restraints, the restraint was used only when absolutely necessary to protect the patient from serious physical injury to self or others.
CD-26: Report compiled by the Integrated Quality Team and reported in Comparative Statistics
Riverview demonstrates that, based on a review of two quarters of data, for 95% of seclusion and restraint events, the hospital achieved an acceptable rating for meeting the requirements of paragraphs 182 and 184 of the Settlement Agreement, in accordance with a methodology defined in Attachments E-1 and E-2.
CD-42: Seclusion and CD-43 restraint events are reviewed as part of a regular analysis of performance by the Nursing Department.
Page
68

Page
69
(Glossary of Terms, Acronyms & Abbreviations) (Back to Table of Contents)
CONSENT DECREE COMPLIANCE
Subject Area Standard of Substantial Compliance Efforts to Comply & Evidence of Compliance
Elopement Quarterly performance data shows that, in 5 out of 6 quarters, the number of client elopements does not exceed one standard deviation from the national mean as reported by NASMHPD.
CD-27: Report compiled by the Integrated Quality Team and reported in Comparative Statistics section on Elopement.
Client Injuries Quarterly performance data shows that, in 5 out of 6 quarters, the number of client injuries does not exceed one standard deviation from the national mean as reported by NASMHPD.
CD-28: Report compiled by the Integrated Quality Team and reported in Comparative Statistics section on Client Injuries.
Patient Abuse, Neglect, Exploitation, Injury or Death
Riverview certifies that it is reporting and responding to instances of patient abuse, neglect, exploitation, injury or death consistent with the requirements of ¶¶ 192-201 of the Settlement Agreement.
CD-29: Regular reports of any events related to allegations of abuse, neglect, exploitation, injury or death are submitted to the Disability Rights Center, the Human Rights Committee and the Consent Decree Court Master per the requirements of the Settlement Agreement. Minutes of the Human Rights Committee are available for review by regulators and accreditation agencies upon request. The Superintendent also certifies annually according to 22 MRSA, Chapter 1684, and 10-44 CMR Chapter 114, Rules Governing the Reporting of Sentinel Events that all sentinel and serious reportable events are reported to the DHHS DLRS Sentinel Events Team as required by this law.
Riverview maintains JCAHO accreditation CD-30: A joint commission survey conducted on November 15-19, 2010 resulted in a full accreditation determination for both the hospital and the Community Forensic ACT team. Documentation of this action can be viewed in the office of the Superintendent.
Riverview maintains its hospital license CD-40: Documentation of the hospital’s licensure status can be viewed in the office of the Superintendent and verified with the Maine DHHS Department of Licensure and Regulatory Services.
Performance Improvement
The hospital does not lose its CMS certification (for the entire hospital excluding Lower Saco SCU so long as Lower Saco SCU is a distinct part of the hospital for purposes of CMS certification) as a result of patient care issues
CD-41: Documentation of the hospital’s CMS certification status can be viewed in the office of the Superintendent.
The items listed in this table were abstracted from the Standards for Defining Substantial Compliance dated October 29, 2007.