performance highlights & growth
TRANSCRIPT


Board of Directors
Promoter-Directors
Mr. Soshil Kumar Jain Chairman
Mr. Ravinder Jain Managing Director
Dr. Rajesh Jain Joint Managing Director
Mr. Sandeep Jain Joint Managing Director
Mr. Sumit Jain Director - Operations &
Projects
Independent Directors
Mr. R.L. Narasimhan
Mr. N.N. Khamitkar
Mr. Sunil Kapoor
Mr. Gurmeet Singh
Mr. K.M. Lal
Dr. A.N. Saksena
G.M. Legal & Company Secretary
Mr. Vinod Goel
Registered Office
Ambala-Chandigarh Highway
Lalru – 140 501, Punjab, India
Corporate Offices
• B-1 Extn./G-3, Mohan Co-operative Indl. Estate
Mathura Road, New Delhi – 110 044, India
• B-1 Extn./A-27, Mohan Co-operative Indl. Estate
Mathura Road, New Delhi – 110 044, India
Works
• Ambala-Chandigarh Highway
Lalru – 140 501, Punjab, India
• Malpur, Baddi, Dist. Solan
Himachal Pradesh – 173 205, India
• B-1/E-12, Mohan Co-operative Indl. Estate
Mathura Road, New Delhi – 110 044, India
• A-241/242, Okhla Indl. Area, Phase – I
New Delhi – 110 020, India
R & D Centers
• Ambala-Chandigarh Highway
Lalru – 140 501, Punjab, India
• B-1/E-12, Mohan Co-operative Indl. Estate
Mathura Road, New Delhi – 110 044, India
• A-224, Okhla Indl. Area, Phase – I
New Delhi – 110 020, India
• Plot No. E-4, Phase II, Indl. Area
Mohali – 160 055, Punjab, India
• Plot No. 72/3, Gen Block, T.T.C. Indl. Area
Mahape, Navi Mumbai – 400 710, India
Sales & Marketing Office
701, Sagar Tech Plaza, ‘A’ Wing, Saki Naka,
Andheri (East), Mumbai – 400 072, India
Statutory Auditors
M/s. S.R. Batliboi & Co.
Chartered Accountants, Gurgaon, India
Cost Auditors
M/s. J.P. Gupta & Associates
Cost Accountants, New Delhi, India
Registrar & Transfer Agents
M/s. Skyline Financial Services Pvt. Ltd.
246, Sant Nagar, 1st Floor, Main ISKCON Temple Road,
East of Kailash, New Delhi – 110 065, India
Banks
Axis Bank Ltd.
IDBI Bank Ltd.
Indian Overseas Bank
State Bank of India
State Bank of Mysore
State Bank of Travancore
Union Bank of India
Website
www.panaceabiotec.com
(As on 30th July, 2009)
Corporate Information


It’s the time of the year when I look forward to speak to you all about your company’s performance. Our principles and values continue to propel us towards our vision to become the largest and most admired health management company, leading the industry in developing brands and vaccines that preserve and improve human life across the globe.
In February, 2009, your company completed 25 years of spectacular growth & success. It is a significant milestone. We have grown from a small establishment located in Delhi to a major player in the health management industry and have created a significant shareholders’ value.
We have continuously introduced new brands and nourished our existing brands with appropriate focus for growth. We have begun exploring alternative ways to create value and to infuse our products and services with even better innovative technology. Going forward, we intend to build our portfolio of brands in a way that gives customers multiple reasons to continue their engagement with us. R & D is where we seed and nurture new growth platforms and this year too we continued to invest in it. This will help our Company to deliver sustainable growth for many years to come.
Throughout the year, initiation of major and highly innovative projects highlighted our team’s ability to carry ambitious projects through to successful
completion. Responding quickly to the global need, Panacea Biotec is partnering with WHO for manufacturing the vaccine candidate for protection against H1N1 virus (swine flu), a major global threat.
The financial storm that swept across the world impacted businesses across the globe. Uncharacteristic forex losses due to unprecedented international currency imbalance, manifested in the aftermath of global financial crisis. Forex losses were a bane for many Indian companies and Panacea Biotec too was saddled with its fair share.
Risk has become an integral part of all business activities. It becomes our foremost responsibility to manage it effectively and to ensure that our business activities are beneficial to our customers & other stake holders To mitigate it, we shall continue to focus on rigorous investment discipline, operational excellence and pursuing all opportunities to enhance the underlying performance of our business.
On behalf of the Board, my sincere thanks to every member and employee of Panacea Biotec for their commitment, enthusiasm and unstinting efforts as well as to all our partners and associates for their encouragement & support, which we continue to count on as we forge ahead.
Best wishes to you all!!
Chairman’s Message
Soshil Kumar Jain

In the year under review, we have experienced both change and continuity. What remained unchanged is our tradition - commitment to innovation, consistency and integrity - the distinct hallmarks of Panacea Biotec.
A strong financial standing, impressive and dedicated customer service and technological progress at all levels reflect the steady and dynamic nature of your company.
Panacea Biotec has been focusing its R&D efforts on preventive as well as therapeutic healthcare solutions. We have launched world’s first fully liquid vaccines - EasyFour & EasyFive and have partnered with WHO & UNICEF in their effort to maximize coverage of vaccines under the expanded program on immunization.
The day is not far away when Panacea Biotec would be known as a truly global organization.
As a leading health management company, we can deal with future challenges most effectively by exhibiting innovation in all our systems, processes
and strategies. We are committed to introducing a steady flow of innovative health care and vaccine products to fulfill the unmet healthcare needs of the masses.
Our excellence lies in execution. On the basis of
our strengths, a significant portfolio of projects,
robust pipeline of products, solid financials and the
confidence of our stakeholders, your company is
looking ahead to pursue steady and well balanced
growth and exhibit significant global presence.
Our goal remains to create long term wealth for
our shareholders. We’ll continue to build a multi-specialty company with a goal to become a leading health management company across the world.
I express my heartily thanks and look forward to your continued support as stakeholders of the company. It is with your valuable support that we can achieve our vision to be a global health management Company.
With best wishes!!
Managing Director’s Message
Ravinder Jain

Financial Highlights (Rs. in million)
Particulars 2008-09 2007-08 2006-07 2005-06 2004-05 2003-04 2002-03 2001-02 2000-01 1999-00
Financial Performance Summary
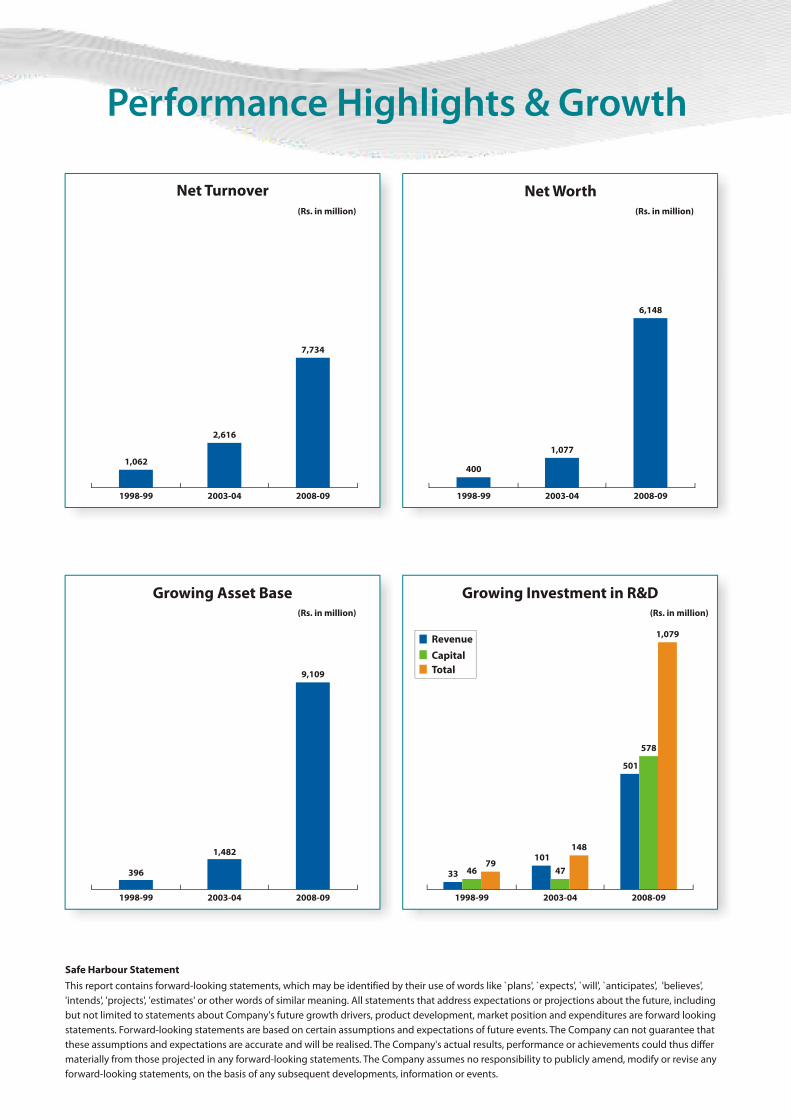
Net Turnover 7,734.2 8,304.4 8,315.5 5,363.5 3,255.4 2,616.2 2,691.5 2,739.3 2,176.7 1,866.3
Total Income 7,993.9 8,676.2 8,615.1 5,434.5 3,309.9 2,686.7 2,733.0 2,763.4 2,251.7 1,873.8
EBITDA 2,444.6 2,177.6 2,298.8 1,233.8 652.3 389.2 520.5 547.0 480.0 412.7
PBT (923.7) 1,903.9 2,091.0 1,002.1 429.4 217.6 336.3 406.4 426.1 329.3
PAT (690.5) 1,331.7 1,468.1 609.4 300.7 164.5 214.2 249.3 228.8 259.3
Cash Accruals 2,001.4 1,802.2 1,823.2 791.6 463.1 283.2 310.5 314.5 287.6 291.0
Balance Sheet Summary
Equity Share Capital 66.8 66.8 65.8 57.2 57.2 57.2 57.2 57.2 57.2 57.2
Preference Share Capital - - - 904.3 904.3 957.8 53.5 63.0 68.0 100.0
Reserves & Surplus 6,084.7 6,905.3 5,325.1 1,546.0 1,192.4 1,039.0 948.1 805.8 701.6 546.0
Net Worth 6,147.9 6,966.7 5,383.9 1,593.6 1,235.1 1,076.9 981.2 839.9 754.5 603.2
Loan Funds 7,002.9 3,982.4 2,134.2 5,866.5 1,610.4 1,680.2 1,292.2 1,060.1 719.8 681.3
Deferred Tax Liability 333.8 595.0 383.9 246.8 135.1 74.8 60.6 73.5 - -
Total Liabilities 13,488.2 11,549.5 7,909.0 8,620.9 3,899.3 3,808.9 2,411.6 2,059.5 1,546.6 1,384.5
Net Fixed Assets 6,938.7 5,343.7 4,136.1 2,337.1 1,376.8 1,054.5 963.0 893.5 565.3 408.4
Investments 2,165.7 2,049.3 229.5 61.4 61.4 39.1 52.6 52.6 47.1 18.1
FCMITDA† 96.0 - - - - - - - - -
Net Current Assets 4,284.2 4,151.2 3,536.4 6,212.8 2,446.7 2,696.0 1,371.8 1,090.4 929.9 958.0
Miscellaneous Expenditure 3.6 5.3 7.0 9.6 14.4 19.3 24.1 23.1 4.3 -
Total Assets 13,488.2 11,549.5 7,909.0 8,620.9 3,899.3 3,808.9 2,411.6 2,059.5 1,546.6 1,384.5
Key Performance Indicators
Profitability Ratios
EBITDA Margin 32% 26% 28% 23% 20% 15% 19% 20% 22% 22%
PBT Margin (12%) 23% 25% 19% 13% 8% 12% 15% 20% 18%
PAT Margin (9%) 16% 18% 11% 9% 6% 8% 9% 11% 14%
Shareholders related Ratios
Equity Dividend - 100% 100% 100% 150% 100% 100% 100% 100% 100%
EPS (Basic)* (in Rs.) (10.3) 20.1 23.7 9.9 4.4 2.7 3.6 4.2 3.8 4.4
Cash EPS (Basic)* (in Rs.) 30.0 27.0 29.5 13.1 7.2 4.8 5.3 5.4 4.9 4.9
Book Value* (in Rs.) 92.1 104.3 81.9 27.9 21.6 18.8 17.2 14.7 13.2 10.6
Return on Net Worth (11%) 19% 27% 35% 19% 14% 20% 29% 28% 40%
Other Ratios
Current Ratio 1.6 2.8 3.0 2.8 1.4 1.7 1.3 1.3 1.3 1.4
Debt Equity Ratio 0.9 0.5 0.4 2.9 0.3 0.5 0.4 0.4 0.1 0.2
Return on Capital Employed (6%) 13% 20% 8% 10% 8% 14% 17% 19% 23%
Interest Coverage Ratio 7.6 18.7 15.1 10.4 6.6 3.2 4.0 5.5 6.8 7.0
Debt Service Coverage Ratio 7.2 16.2 6.8 4.1 2.3 1.6 2.8 3.5 1.8 5.9†Foreign Currency Monetary Item Translation Difference Account*Per Equity Share of Re.1 each.

Setting the Scene 2
Management Discussion & 3 Analysis Report
• Industry Structure & Developments
• Panacea Biotec - Innovation in Support of Life
• Business Segments
• Pharmaceutical Formulations
• Vaccines
• Manufacturing Facilities
• Research & Development
• Subsidiaries, Joint Ventures, Collaborations
and Tie-ups
• Financial Performance
• Opportunities & Outlook
• Future Growth Drivers
• Risks, Challenges & Threats
• Corporate Social Responsibility
Directors’ Report 43 Corporate Governance Report 53
Auditors’ Report 66
Financial Statements 68
• Balance Sheet
• Profit & Loss Account
• Schedules to Balance Sheet and
Profit & Loss Account
• Cash Flow Statement
• Statement u/s 212 in respect of
Subsidiary Companies
• Financial details of Subsidiary Companies
Auditors’ Report on Consolidated 99 Financial Statements
Consolidated Financial Statements 100
• Consolidated Balance Sheet
• Consolidated Profit & Loss Account
• Schedules to Consolidated Balance Sheet and
Profit & Loss Account
• Consolidated Cash Flow Statement
Contents
Panacea Biotec • Annual Report 2008-091

Setting the Scene
• Panacea Biotec is the 2nd Largest Vaccine producer in India
• 3rd Largest Biotechnology Company in India (ABLE Survey 2009)
• Panacea Biotec has been pre-qualified by WHO to supply Oral Polio, Hepatitis B, Ecovac4 (DTwP-Hep B), Easyfour (DTwP-Hib) and Easyfive (DTwP-Hep B-Hib) Vaccines
• First Indian company to develop and launch innovative combination vaccines viz. Ecovac4, Easyfour and Easyfive in India
• Ranked 48th amongst Pharmaceutical Companies in India (ORG IMS MAT March’09)
• Pharmaceutical formulation facility at Baddi certified as cGMP compliant by various regulatory authorities including the German Regulatory Authority and ANVISA (Brazil)
• 26 product patents valid in more than 60 countries world wide
• 1,158 patent applications filed, 325 granted/accepted for grant globally as on 31.03.2009
• Company’s Products reach more than 35 countries globally
• Played a key role in eradicating polio by supplying more than 6 billion doses of Oral Polio Vaccine to Govt. of India & UNICEF
• Millions of patients enjoying happy & healthy life through our well established brands in niche therapeutic areas like pain management, diabetes management, organ transplant
• Stupendous contribution to Shareholders’ value
• Continuous investment in Research & Development activities - around 14% of net turnover invested during fiscal 2009
• Over 260 Scientists working in 5 state-of-the art R&D Centers
• A family of around 3,200 people working relentlessly in improving quality of life of billions of people across the globe

Management Discussion and AnalysisIndustry Structure & DevelopmentsGlobal Vaccine Industry
The global market for vaccines is expected
to grow at a CAGR of more than 16% in the
next five years and is expected to reach US$
30 billion by 2012, as per various industry
estimates. The vaccine industry will emerge
as the fastest growing therapeutic area.
The US and Europe represents the two
largest vaccine markets and will continue to
experience healthy growth in future.
Presently, Paediatric vaccines dominate
the global vaccines market but the share
of adult and therapeutic vaccines is likely
to increase significantly and will fuel the
future growth in the global vaccines market.
The cancer vaccine market, led by cervical
cancer vaccines, is presently one of the most
lucrative areas for vaccine manufacturers.
Overall, cancer vaccines are expected to
account for nearly 27% of the total vaccine
revenues by 2012. Successful development
of vaccines against pandemic flu, Pneumo,
Dengue, HIV & TB in addition to the
Hexavalent paediatric combination vaccines
would add to the growth of the vaccine
industry.
Immunization is the most important and
cost-effective way of eliminating child
mortality. The development of combination
vaccines has resulted in lower cost of
immunization and simplified the current
immunization schedule as it offers an
opportunity of fighting against multiple
diseases with a single injection.
WHO and UNICEF have taken a number
of measures to boost the awareness and
access to vaccines in their efforts to meet
the challenges in global immunization. One
of them being, the Global Immunization
Vision and Strategy (GIVS), launched in
2005. In brief, GIVS aims to assist countries
to immunize more people, from infants to
seniors, with a greater range of vaccines.
GIVS is the first ever global ten-year
framework to fight vaccine-preventable
diseases through immunization and covers
the period 2006 to 2015.
GIVS has four main aims:
• to immunize more people against more
diseases, to reduce childhood morbidity
and mortality;
• to introduce a range of newly available
vaccines and technologies;
• to integrate other critical health
interventions with immunization; and
• to manage vaccination programmes
within the context of global
interdependence.
Indian Vaccine Market
India represents one of the fastest
growing vaccine markets in the world.
With the national immunization program
(NIP) gaining more importance, several
multinational companies now see India as
a key market for their vaccine business. As
per industry estimates, the Indian vaccine
market was US$665 million in 2007-08
and is growing at over 20%. This market is
primarily driven by exports worth more than
US$360 million. The domestic market for
vaccines is around US$300 million with the
private sector accounting for around half
of it.
Domestic companies presently dominate
this market with around seven out of top
ten players being domestic companies. But
with India’s IPR (Intellectual Property Right)
The global market for vaccines is expected to grow at a CAGR of more than 16% in the next five years and is expected to reach US$ 30 billion by 2012.
Panacea Biotec • Annual Report 2008-093

laws improving considerably and healthcare
expenditure increasing, foreign companies
have started to acknowledge India’s
potential as a vaccine hub.
Owing to the factors like increasing public
and private healthcare spending, birth of
around 25 million babies each year and
a large prevalence of both infectious and
chronic diseases, the domestic demand
for vaccines in India will continue to grow
at double-digit growth rate, offering
vaccine players enough challenges and
opportunities to expand their horizon in the
country.
Apart from the domestic market, India is
also emerging as a center for exports. Both
research and manufacturing of vaccines can
be undertaken in India at much lower cost
than in the west. Exports presently account
for more than 50% of the country’s vaccine
market and with growing investment by
both domestic and international players,
India is expected to fulfill the vaccine
demand of both developing and developed
countries alike.
Polio Eradication in India
The goal of Global Polio Eradication Initiative
(GPEI) is to ensure that no child will ever
again know the crippling effects of polio.
Polio is a highly infectious disease which
invades the nervous system and can cause
total paralysis in a matter of hours. It can
strike at any age, but affects mainly children
under five. Polio is mainly passed through
person-to-person (i.e. fecal-oral) contact,
and infects those who do not have immunity
against the disease. There is no cure for
polio, but the disease can be prevented by
immunization with polio vaccine.
Polio Cases Data Year No. of Polio Cases 1998 1934 1999 1126 2000 265 2001 268 2002 1600 2003 225 2004 134 2005 66 2006 676 2007 874 2008 559 2009 206*
(Source: www.npspindia.org) *data as on July, 2009

As per WHO guidelines, a WHO region can be
certified polio free only if it does not record
any case of polio during three consecutive
years following the year in which zero case
is registered first time. Assuming that India
achieves zero case for the first time in 2010
and thereafter, if it does not record any case
of polio in 2011, 2012 and 2013, India can
achieve its target of becoming polio free and
become eligible for being declared as a polio
free nation by WHO. However, immunization
activities will continue until the entire region
(Pakistan & Afghanistan) becomes polio free.
Immunization against Polio to
Continue: In developing countries, low
OPV effectiveness in the highest-risk
communities (believed to be caused by a
combination of high incidence of diarrheal
diseases, malnutrition and the high force
of Wild Polio Virus infection attributed to
crowding) has been identified as the key
challenge to interrupting Wild Polio Virus
transmission. Responses being explored,
include inactivated poliovirus vaccine as a
supplement to Oral Polio Vaccine (mOPV) &
development of a bivalent OPV containing
both type 1 and type 3 virus.
The immunization against polio will
continue in the post polio eradication
era. It is expected that the mode of
immunization may change from Oral Polio
Vaccine to Inactivated Polio Vaccine (IPV).
In those countries, where polio has been
eradicated, IPV is being used. The world
health regulatory bodies suggest that the
vaccination against polio must continue even
after achieving polio eradication.
Global Pharmaceutical Market
The global pharmaceutical market audited
sales grew by approximately 5.1% (at
constant exchange rate) to reach US$726
billion in 2008. (Source: IMS MAT Sept.’08),
largely as a result of strong sales for new
innovative products and high market growth
in emerging pharmaceutical markets such as
India and China.
The global pharmaceutical market is
expected to grow 4.5 - 5.5 percent in 2009 (a
pace similar to 2008) and reach the level of
more than US$820 billion and is expected to
reach US$929 billion in 2012.
North America, Europe and Japan continued
to remain the key markets accounting for
85% of the global pharmaceutical market
in 2008. The emerging economies further
consolidated their position in the global
arena with growth in countries like India,
China, Russia, Brazil and Turkey exceeding
the growth in developed markets and are
expecting to continue with the trend.
The global pharmaceutical market is expected to grow 4.5 - 5.5 percent in 2009 (a pace similar to 2008) and will reach the level of more than US$820 billion and is expected to reach US$929 billion in 2012.
Region-wise Global Pharmaceutical Sales, 2008
Audited Market 2008 Sales* % Growth
US $ bn % Mkt Share (Constant US$)
North America 312 43 1.5Europe 242 33 6.2Asia, Africa & Australia 72 10 15.0Japan 65 9 4.4Latin America 35 5 12.0
Total Audited 726 100 6.1*Excludes unaudited markets and Russia, Ukraine and Belarus audited data. Sales cover direct and indirect
pharmaceutical channel purchases in U.S. dollars from pharmaceutical wholesalers and manufacturers. The figures above include prescription and certain over-the-counter data and represent manufacturer prices.
Total may not add due to rounding off.
As a result of the pharmaceutical industry’s increased focus on these high-growth markets, the
developing countries are benefiting from greater government spending on healthcare and
broader public and private healthcare funding - which is driving greater access to, and demand
for, innovative medicines.
Panacea Biotec • Annual Report 2008-095
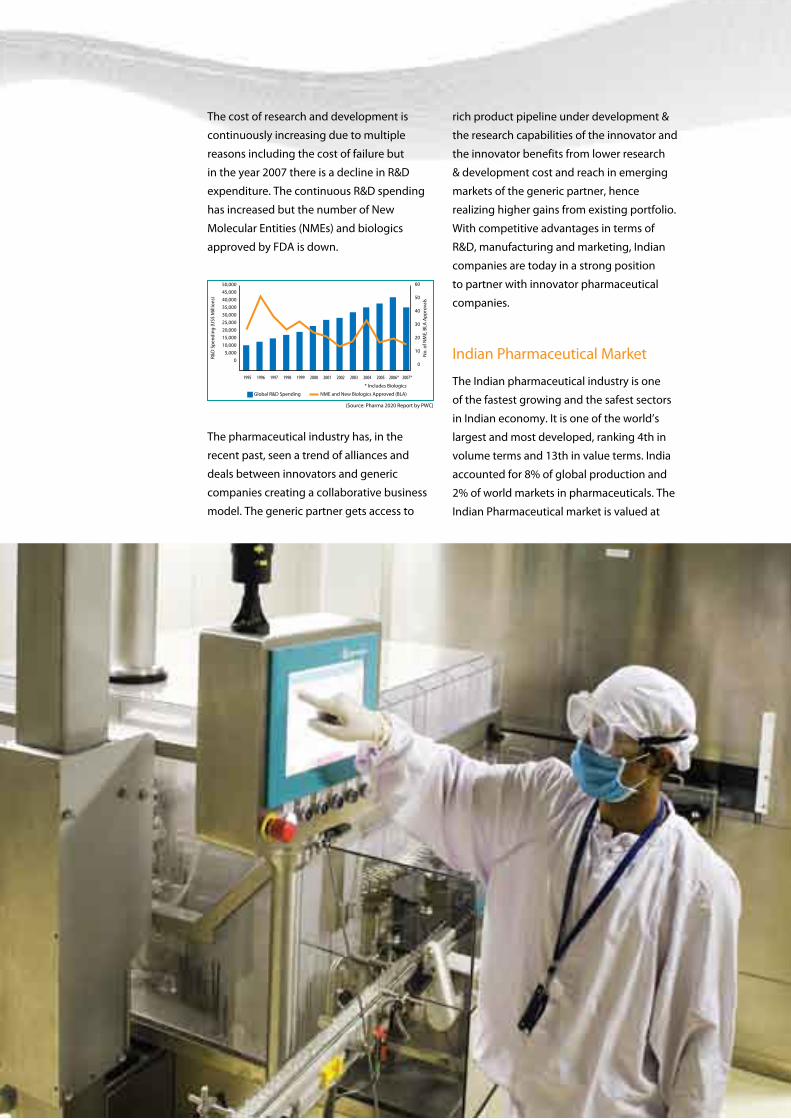
The cost of research and development is
continuously increasing due to multiple
reasons including the cost of failure but
in the year 2007 there is a decline in R&D
expenditure. The continuous R&D spending
has increased but the number of New
Molecular Entities (NMEs) and biologics
approved by FDA is down.
The pharmaceutical industry has, in the
recent past, seen a trend of alliances and
deals between innovators and generic
companies creating a collaborative business
model. The generic partner gets access to
rich product pipeline under development &
the research capabilities of the innovator and
the innovator benefits from lower research
& development cost and reach in emerging
markets of the generic partner, hence
realizing higher gains from existing portfolio.
With competitive advantages in terms of
R&D, manufacturing and marketing, Indian
companies are today in a strong position
to partner with innovator pharmaceutical
companies.
Indian Pharmaceutical Market
The Indian pharmaceutical industry is one
of the fastest growing and the safest sectors
in Indian economy. It is one of the world’s
largest and most developed, ranking 4th in
volume terms and 13th in value terms. India
accounted for 8% of global production and
2% of world markets in pharmaceuticals. The
Indian Pharmaceutical market is valued at

The Indian pharmaceutical industry is one of the fastest growing and the safest sectors in Indian economy. It is one of the world’s largest and most developed, ranking 4th in volume terms and 13th in value terms.
Rs.353.7 billion and growing at 10.1% as per
ORG MAT Mar’09.
The Indian Pharmaceutical Market is
expected to treble in the next decade and
catapult the country into top 10 markets
in the World by 2015, overtaking Mexico,
Turkey & South Korea.
The chronic therapy segment recorded a
growth of 13.1% and contributed 28.3%
of the total market while acute therapy
segment grew at a rate of 8.6%. The
overall market growth was a mix of higher
volumes of existing products, new product
introductions and price increases with all
three witnessing a positive trend. Around
75% of the overall market growth was led by
volume increases in existing products.
Semi-urban and rural markets are becoming
an important driver for growth in the Indian
market. Extra-urban markets accounted
for 40% of the total sales in 2008. Acute
therapies dominate the extra-urban markets
with 80% contribution while chronic
therapies are also growing especially in
cardiac therapy (8%).
In the coming years, upcoming small cities
and rural areas will contribute almost as
much to the pharma market growth as
metros and top-tier towns.
Amongst the markets where the Company
operates the highest contributing group is
anti-biotics (contributing around 18% to IPM)
and growing at par as compared to IPM and
has added an incremental value of Rs.5.6
billion last year.
The second largest group in terms of
value contribution to IPM, Cardio Vascular
system has recorded 13% growth with an
incremental value of Rs.4.6 billion. The anti-
diabetics category has recorded the highest
growth at 16% adding an incremental
value of Rs.2.6 billion. Other categories
with substantial presence of the Company,
viz. Pain & Analgesic and GI & Respiratory
have shown decent growth of 9% and 8%
respectively.
With higher per capita income, increasing
access to modern medicines, the emergence
of an organised retail segment and the fast
growing area of medical insurance, this
segment is expected to continue its strong
growth momentum and is estimated to
be worth US$30 billion by 2020, growing
at about 8% annually as compared to an
increase of 6% in the world as a whole.
But, even then, India’s share in the world
pharmaceutical market would only come to
slightly over 2%.
Playing a key role in promoting and
sustaining development in the vital field of
medicines, Indian Pharma Industry boasts of
quality producers and many units approved
by regulatory authorities in USA and UK.
The Indian Pharmaceutical sector is
highly fragmented with more than
20,000 registered units. The leading 250
pharmaceutical companies control around
70% of the market with market leader
holding nearly 7% of the market share. It is
an extremely fragmented market with severe
price competition and government price
control.
The pharmaceutical industry in India meets
around 70% of the country’s demand
for bulk drugs, drug intermediates and
pharmaceutical formulations. There are
about 250 large units and about 8,000
Small Scale Units, which form the core
of the pharmaceutical industry in India
(including 5 Central Public Sector Units).
These units produce the complete range of
pharmaceutical formulations, i.e., medicines
ready for consumption by patients and
about 350 bulk drugs, i.e., chemicals having
therapeutic value and used for production of
pharmaceutical formulations.
Panacea Biotec • Annual Report 2008-097


Panacea Biotec – Innovation in Support of LifePanacea Biotec occupies a distinct
position in the Indian pharmaceutical and
biotechnology industry with its business
model focussing on innovation, collaboration
and brand building. The Company has
endeavoured to provide research based
products to fulfil the unmet medical needs.
The Company has established infrastructure
and capabilities in research & development,
manufacturing and marketing of vaccines,
pharmaceuticals and biopharmaceuticals.
Panacea Biotec occupies the position of the
2nd largest vaccine producer in India and has
been ranked as the 3rd largest biotechnology
Company (ABLE Survey 2009). Based on
the finished pharmaceutical formulations
business, the Company is placed at 48th rank
amongst pharmaceutical companies in India
(ORG IMS MAT March 2009).
The Company has also moved ahead towards
diversification in the field of healthcare
through its subsidiaries as part of its
corporate vision to become a leading Health
Management Company.
Core Strengths at a glance
Panacea Biotec is well positioned and
recognized as a leading, research based
Health Management Company with
an objective to discover, develop and
successfully market innovative products to
meet unmet medical needs. To achieve these
objectives, Panacea Biotec has:
Established capabilities in R&D: Panacea
Biotec has established five state-of-the-art
R&D Centers with each center dedicated
to specific research areas, driven by the
intellectual capabilities of over 260 scientists.
The research facilities are self-reliant with
cross-functional capabilities for research and
development of drugs starting right from
lead identification to pre-clinical and clinical
development and product registration. The
current research strengths of Panacea Biotec
are focused, inter-alia, on:
• Drug delivery system design and
optimization;
• Discovery and synthesis of new chemical
and biological entities;
• Design and development of new
generation prophylactic and therapeutic
vaccines; and
• Development of humanized and
fully human therapeutic monoclonal
antibodies.
The Company has been granted 26 product
patents worldwide valid in more than 60
countries including the U.S., E.U. Member
State, Russia, Japan, China, South Korea,
Australia and Brazil.
State-of-the-art manufacturing
facilities: Panacea Biotec has state of the
art manufacturing facilities for vaccines
and pharmaceuticals complying to cGMP
standards. The Company is setting up
bulk vaccine manufacturing facility for cell
culture based vaccines, biopharmaceuticals,
recombinant and viral vaccines at Lalru,
Punjab.
The vaccine formulation facility at New
Delhi is approved by WHO for Oral Polio
and Recombinant Hepatitis B vaccines and
Combination vaccines Ecovac-4 (DTwP-
HepB), Easyfour (DTwP-Hib) and Easyfive
(DTwP-HepB-Hib). The Pharmaceutical
Formulations facility at Baddi has been
audited and certified as cGMP compliant by
various regulatory agencies, including the
German Regulatory Authority and ANVISA
(Brazil).
WHO Pre-qualification Status: The
pre-qualified supplier status enables the
Company to participate in UN Organizations
procurement process around the world. The
Company has been pre-qualified by WHO to
supply Oral Polio (mOPV and tOPV), HepB,
Ecovac-4, Easyfour and Easyfive Vaccines.
Panacea Biotec occupies the position of the 2nd largest vaccine producer in India and has been ranked as the 3rd largest biotechnology Company (ABLE Survey 2009).
Panacea Biotec • Annual Report 2008-099
The Company is currently supplying Oral Polio, Hepatitis B and Easyfive Vaccines to UNICEF. The Company has also commenced supplying Easyfive Vaccines to Pan American Health Organization (PAHO) during fiscal 2009.
Established Brand Equity: Panacea Biotec has established brand equity in a number of therapeutic areas like diabetes management, pain management, organ transplantation and paediatric immunization. Its leading brands including Glizid-M, Nimulid, Panimun Bioral, Pangraf and Mycept are amongst the top five positions in their respective therapeutic segments. Its flagship brand, Glizid-M is ranked at 171 amongst the top brands in Indian Pharmaceutical Market, according to the stockists secondary audit by ORG IMS (MAT Mar’09).
International Presence: In addition to the strategic alliances with leading regional companies in Latin America, South East Asia, CIS and Africa; Panacea Biotec has created a global presence through its wholly-owned subsidiaries in strategic markets including US, Germany, Switzerland and UAE.
Relationship with Key Business Associates: Panacea Biotec has a long-standing relationship with its key customers and business partners including successful business record of 10 years with UNICEF. It
has been supplying oral polio vaccines to
UNICEF since fiscal 2000 and has steadily
expanded and grown on this relationship
with the commencement of supply of
Easyfive vaccines during fiscal 2009. In
addition to long-standing relationship
with its customers, the relationships with
key suppliers like Novartis Vaccines, Sanofi
Pasteur and PT Bio Farma are also a source of
its competitive strength.
Collaborations & Joint Ventures with Key
Industry Players: Panacea Biotec has a
rich history of collaborations and ventures
with various industry players and has
several business relationships with various
national/international research institutes,
academic universities and commercial
corporations including National Institutes
of Health (USA), Novartis Vaccines, Sanofi
Aventis, Biotech Consortium India Ltd.,
Nederland Vaccin Institut (NVI), PT Bio Farma,
etc. These collaborations, ventures and
relationships enable the Company to secure
in-licensing, out-sourcing and other business
opportunities.
Qualified & Experienced Manpower:
Panacea Biotec has 3,196 employees
including 261 scientists engaged in R&D,
1,006 in production and 1,213 in sales &
marketing.
Panacea Biotec • Annual Report 2008-0910

Business SegmentsDomestic Sales & Marketing Network
Panacea Biotec has successfully established
leading brands through a focused scientific
marketing approach. To cater to the
individual nuances of specific therapeutic
segments, Panacea Biotec operates through
seven strategic business units (SBUs).
The domestic pharmaceutical business
is organised into three classes – Super-
speciality i.e., Critical Care & OncoTrust,
Speciality i.e., Diacar Alpha & Diacar Delta
and Multi-specialty i.e., Procare & Growcare.
To cater to the large and voluminous
bottom of the Indian Pharmaceutical Market
pyramid, the Company has taken an initiative
by launching a new SBU, viz. Value India
Healthcare.
The aim of each SBU is to attain leadership
position in its chosen markets and establish
brand equity in respective therapeutic
segment by way of innovative products as
well as innovative marketing approach with
differentiated products. The SBUs promote
a portfolio of brands with a special focus on
Orthopedicians, Cardiologists, Diabetologists,
Physicians, Nephrologists, Chest Physicians,
Surgeons, Dentists, Consulting Physicians,
Paediatricians and Gastro-enterologists.
Diacar Alpha & Diacar Delta
Diacar Alpha & Diacar Delta together
are the highest contributing SBU of the
Company with dedicated marketing
and sales infrastructure for Diabetes and
Cardiovascular management. These SBUs
are committed to provide new therapies
and innovations in drug delivery and overall
diabetes disease management. India’s
diabetic population is estimated to be
around 41 million and growing rapidly. WHO
estimates that diabetes related mortality
could increase to 35% by 2015.
These SBU promote the brands to
target specialists viz. Endocrinologists,
Diabetologists, Cardiologists and Physicians
in a fiercely competitive scenario and have
achieved significant leadership position
in oral anti-diabetic segment. Of late
the SBU has also started focusing on the
Nephrologists.
To tap the growing cardiology segment
the SBU now has sharpened its focus on
Cardiology by having an additional team
which would have a dual focus on Cardiology
and Diabetology.
The flagship brand of the SBU, Glizid-M
(Gliclazide + Metformin) is the No. 1 brand
while Glizid (Gliclazide) is the no. 2 brand in
their respective categories. Glizid-M apart
Panacea Biotec • Annual Report 2008-0911
from the above is ranked at 171st position
amongst 30,000 odd pharmaceutical brands.
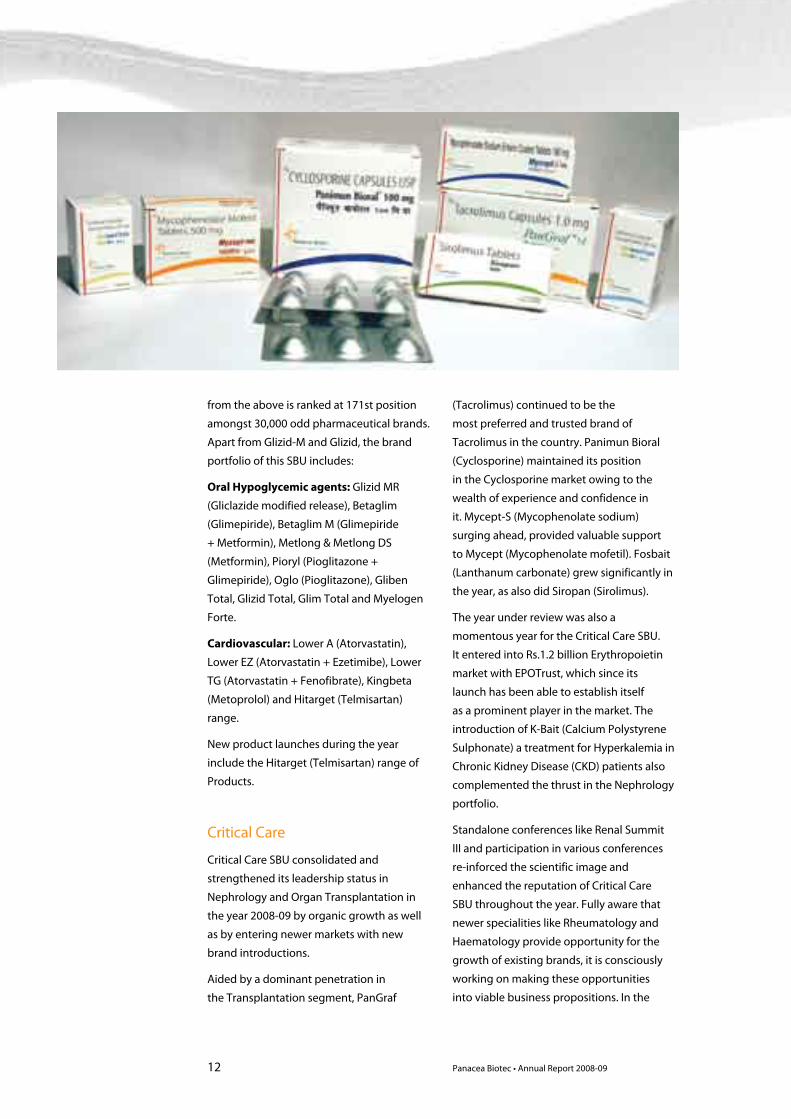
Apart from Glizid-M and Glizid, the brand
portfolio of this SBU includes:
Oral Hypoglycemic agents: Glizid MR
(Gliclazide modified release), Betaglim
(Glimepiride), Betaglim M (Glimepiride
+ Metformin), Metlong & Metlong DS
(Metformin), Pioryl (Pioglitazone +
Glimepiride), Oglo (Pioglitazone), Gliben
Total, Glizid Total, Glim Total and Myelogen
Forte.
Cardiovascular: Lower A (Atorvastatin),
Lower EZ (Atorvastatin + Ezetimibe), Lower
TG (Atorvastatin + Fenofibrate), Kingbeta
(Metoprolol) and Hitarget (Telmisartan)
range.
New product launches during the year
include the Hitarget (Telmisartan) range of
Products.
Critical Care
Critical Care SBU consolidated and
strengthened its leadership status in
Nephrology and Organ Transplantation in
the year 2008-09 by organic growth as well
as by entering newer markets with new
brand introductions.
Aided by a dominant penetration in
the Transplantation segment, PanGraf
(Tacrolimus) continued to be the
most preferred and trusted brand of
Tacrolimus in the country. Panimun Bioral
(Cyclosporine) maintained its position
in the Cyclosporine market owing to the
wealth of experience and confidence in
it. Mycept-S (Mycophenolate sodium)
surging ahead, provided valuable support
to Mycept (Mycophenolate mofetil). Fosbait
(Lanthanum carbonate) grew significantly in
the year, as also did Siropan (Sirolimus).
The year under review was also a
momentous year for the Critical Care SBU.
It entered into Rs.1.2 billion Erythropoietin
market with EPOTrust, which since its
launch has been able to establish itself
as a prominent player in the market. The
introduction of K-Bait (Calcium Polystyrene
Sulphonate) a treatment for Hyperkalemia in
Chronic Kidney Disease (CKD) patients also
complemented the thrust in the Nephrology
portfolio.
Standalone conferences like Renal Summit
III and participation in various conferences
re-inforced the scientific image and
enhanced the reputation of Critical Care
SBU throughout the year. Fully aware that
newer specialities like Rheumatology and
Haematology provide opportunity for the
growth of existing brands, it is consciously
working on making these opportunities
into viable business propositions. In the
Panacea Biotec • Annual Report 2008-0912

coming years, Critical Care SBU proposes to
launch molecules aimed at satisfying unmet
medical needs, thereby aiming to grow faster
and become bigger in the Nephrology and
Transplantation market.
Procare
Procare SBU of the Company endeavours to
consolidate and strengthen its image in the
field of chronic health care management
with specific focus on Osteoarthritis, Pain
management and Gastrointestinal disorders.
Pain is a frequent cause for clinical visits
with around 45% of the population seeking
medical help for pain at some point in their
lives. Pain occurs across the life span, and
it has been estimated that 4 out of every
10 people with moderate or severe pain
do not get adequate relief. Chronic pain is
widely believed to represent a disease itself
causing long-term detrimental changes in
musculoskeletal and nervous system. Pain
interferes with sleep, activities of daily living
and productivity. In order to help millions
of patients suffering from various painful
inflammatory disorders, Procare SBU is
marching ahead to provide therapeutic
modalities to these patients and has recently
launched JAIHO (Lornoxicam + Paracetamol)
in pain management segment.
Procare has taken definite steps towards
making significant inroads in the
Gastroenterology segment with two
important launches of Livoluk Fibre
(Lactulose + Isapghula) and Sitcom
(Euphorbia Prostata) during the year.
This SBU promotes a portfolio of brands with
special focus on Orthopedicians, Surgeons,
Dentists & Gastroenterologists apart from
Consulting Physicians & General Physicians.
Some of the major brands of Procare across
different therapeutic segments are:
Anti-arthritis: Willgo, Kondro OD,
KondroAcute
Pain relievers: Nimulid, Nimulid SP, Nimulid
MR, Nimulid HF
Gastrointestinals: Livoluk, Livoluk Fibre,
OD-pep, Sitcom
Anti-osteoporosis: Alphadol, Alphadol-C,
Kingcal.
On the prescription front there has been gain
in equity from Specialties like Gastro and
Ortho during the year under review.
Growcare
Growcare is the Multi-Specialty business
of Panacea Biotec with special focus
in Respiratory Disorders. The different
Panacea Biotec • Annual Report 2008-0913

The overall size of the domestic oncology market is around Rs.9.6 billion and is growing at around 22%. More than 50% of the world’s cancer burden, in terms of both number of cases and deaths, occurs in developing countries.
specialties covered are Chest physicians,
Consulting Physicians, General Physicians,
ENT, Paediatricians, Surgeons and
Orthopedicians. 37 different products are
marketed by this SBU with presence in
multiple therapy areas.
Some of the popular brands of Growcare are:
Anti-infective: Cefmentin (Cefixime+
Lactobacillus), Ocimix (Ornidazole+Ofloxacin)
Anti-Allergic: Zomont Range
Cough, Cold and Fever: Toff MD, Toff DC &
Toff expectorant, Orangemol Suspension
Pain Management: Nimulid MD & Nimulid
MD Kid (Mouth dissolving) tablets, Nimulid
Suspension, Nimulid Transgel.
Anti TB: Xeed 2, Xeed 3E & Xeed 4 tablets
fixed dose combinations, Myser (Cycloserine)
& Myobid (Ethionamide).
Anti haemmorohidal: Thank OD Tablets.
OncoTrust
Panacea Biotec made its maiden entry into
the rapidly growing field of Oncology in
fiscal 2008 with launch of a new SBU called
‘OncoTrust’. Oncology as a therapeutic
segment is rated as one of the fastest
growing fields globally and in India also.
The Oncology market is well poised for a
promising future ahead with steady increase
in cancer incidence rate, superior and more
accessible diagnostic facilities, increased
awareness about the disease and feverish
pace of new molecule introduction. The
overall size of the domestic oncology market
is around Rs.9.6 billion and is growing at
around 22%. More than 50% of the world’s
cancer burden, in terms of both number
of cases and deaths, occurs in developing
countries.
The current product portfolio of OncoTrust
comprises of Cytotoxic chemotherapy
covering indications therapeutic segments
such as Breast Cancer, Lung Cancer,
Pancreatic Cancer, Ovarian Cancer and Brain
Tumor and a supportive therapy for patients
suffering from bone metastases.
The Brand Portfolio includes PacliTrust
(Paclitaxel Injection); DoceTrust (Docetaxel
Injection); GemTrust (Gemcitabine injection);
TemoTrust (Temzolomide Capsules) and
ZoleTrust (Zoledronic Acid Injection). Two
new brands, viz. GefiTrust (Gefitinib) and
OxiTrust (Oxaliplatin) were launched during
the year under review. The ‘Trust’ umbrella
branding has gained recognition amongst
the oncologist community and is helping
build OncoTrust as a big brand.
Value India Healthcare
Value India Healthcare is the SBU launched
to cater to mass markets. This SBU’s main
aim is to provide a unique ‘value for money’
proposition in its offering to the General
Physicians practicing mainly in semi-urban
and rural set up.
This SBU is setting a trend in offering
significant innovative brands to fight pain,
allergy and gastro-intestinal disorders to
the semi urban and rural markets. The
main brands are TwoWks, Combipunch,
Instanim MD, TwinEase ER, RojOD, Takecal,
Kofzero and Koldzero. Anti-infectives as a
class is a fast growing market. The Value
range of anti-infectives offered by the SBU,
ValueCef, ValueOrni, ValueMox, ValueMentin,
ValueLevo and ValueThral are steadily
gaining acceptance.
This SBU currently operates in Rest of
Maharashtra region, Madhya Pradesh and
Chattisgarh with plans for expansion to other
states in due course of time.
Brands Review
Over the years, Panacea Biotec has
established leading brands that enjoy top
of the mind recall by the medical fraternity.
The Company’s brands command excellent
market share in their therapeutic segments.
By ORG (MAT Mar’09) Sales value, Panacea
Panacea Biotec • Annual Report 2008-0914

Biotec is the 50th ranked company in
the Indian Pharmaceutical Market with
Nephrologists, Dentists, Orthopaedicians and
Diabetologists giving the best support. As
per Stockist Secondary Audit of ORG (MAT
Mar’09), Glizid-M stands at 171st rank among
Top brands in the Indian Pharmaceutical
market and retain number one position
within its category.
The following table set forth the key
brands of the Company across therapeutic
categories and their ranking/ market share in
India as per ORG IMS audit:
Brand Standing and Market share
Brands Market Ranking Share %
Diabetes and Cardiac Care:Glizid M 24 1Glizid 80mg 23 1Glizid 40 mg 31 1Glizid MR 60mg 13 2Glizid MR 30mg 16 2Glizid Total 21 2Pain Management:Willgo 60 1Nimulid MD 28 1Nimulid 100mg 7 2Nimulid Suspension 14 2Nimulid Safeinject 15 2Nimulid Transgel 17 2Nimulid Nugel 11 2Nimulid SP 10 4Nimulid MR 12 4Softdiclo 11 3Kondro OD 21 3Tuberculosis Management:Myser 19 3Gastro-intestinal:Livoluk 8 4
• Source of the data is ORG IMS SSA audit MAR 2009.
• Market Share and rank is calculated within its immediate operating market i.e the strength or the immediate market (wherever applicable).
Critical care brands, Panimun Bioral, Mycept
and Pangraf are also the leading brands in
the Organ Transplantation segment but have
a poor reflection in ORG IMS audit, as ORG
IMS SSA audit does not track institutional
sales or Direct to patient sales.
International Pharmaceuticals Business The year under review marked the
achievement of landmark initiatives &
accolades for the Company’s international
formulations business. The Company clocked
a robust sales growth of 27% over previous
year and reached to a level of Rs.426.1
million. The major markets continue to do
well inspite of recessionary trends in the later
part of the year. In addition to this, successful
commercialization happened in newer
markets across Central America, Africa and
Asia.
The Company has identified Organ
Transplantation, Nephrology, Metabolic
Disorders, Pain management, Oncology,
Gastro-intestinal & Anti-infective products
as major thrust areas for the future. The
Company is currently in the process of
registering its products in key new markets
including US, European Union, Switzerland,
South Africa, Turkey, Brazil, Mexico,
Columbia, Venezuela, Chile, Philippines
& Malaysia. The Company has set-up
international subsidiaries in US, Germany,
Switzerland and UAE to steer product
registration.
The Company focuses on brand building
primarily leveraging its portfolio of novel
patented products in key segments. The
major achievements in terms of international
formulation business during the year have
been:
• Supply of Kidney Transplant
product, Mycept in the 1st year of
commercialization to Russian Ministry of
Health.
• Introduction of 10 products especially
in the Nephrology & Organ Transplant
category in various markets.
• Approval of Manufacturing facilities from
main regulatory agencies viz. German
Regulatory Authority and ANVISA (Brazil),
paving the way for entry into nearly US$
600 million Nephrology space in the
The Company is currently in the process of registering its products in key new markets including US, European Union, Switzerland, South Africa, Turkey, Brazil, Mexico, Columbia, Venezuela, Chile, Philippines & Malaysia.
Panacea Biotec • Annual Report 2008-0915


represented markets. In addition, this
approval allows the Company an entry
into markets of CIS (Ukraine), Africa
(Tanzania, Ethiopia, Uganda) and Middle
East (Syria).
In its efforts to build brands, Panacea Biotec
has continued to chase its commitment
of working closely with the leading
Nephrologists & Transplant Surgeons in
represented/planned markets. Due to
these efforts, the Company’s products are
being routinely procured & purchased by
the Ministries of Health in Asia (Sri Lanka,
Vietnam, Mongolia) and in CIS (Ukraine).
The Company has initiated a series of
unique promotional activities in represented
markets; thereby re-affirming its credentials
as a scientifically focused company. Some of
them are “Free Blood level for patients taking
Tacrolimus (in Sri Lanka)” and “Bone Mineral
Density (BMD) estimation for patients to
detect & manage early onset of Osteoporosis
patients (in Sri Lanka & other markets)”.
In addition, the Company’s products are in
the advanced stage of registration in majority
of the potential markets viz: Latin America
(Brazil and other MERCOSUR markets), Africa
(South Africa, Nigeria, Kenya), Middle East
(Jordan, Egypt, Yemen) and Asia (Philippines,
Malaysia, Singapore). These commercial
realizations is expected to enable the
Company to register quantum increases in
the business outlook in the coming 2-3 years.
Vaccines
Panacea Biotec has an excellent portfolio
of innovative paediatric vaccines which
protect children against dreadful diseases
such as polio, hepatitis, diphtheria, tetanus,
pertusis & haemophilus influenza. The
portfolio of vaccines includes the Trivalent
Oral Polio Vaccine (tOPV), Monovalent
(Type I and Type III) Oral Polio Vaccine
(mOPV), Enivac HB (Hepatitis B) Vaccine
and innovative Combination Vaccines such
as Ecovac4 (Diphtheria-Tetanus-wholecell
Pertusis (DTwP)-Hepatitis B), Easyfour
(DTwP-Haemophilus Influenza type B (Hib))
and Easyfive (DTwP-Hepatitis B-Hib). The
Company has WHO pre-qualification for all
these vaccines and is currently supplying oral
polio, Hepatitis B and Easyfive Vaccines to
UNICEF for their global requirements.
The Company also received an award for
supply of Easyfive Vaccines from PAHO and
has initiated supplies of Easyfive vaccines
during the current year.
The vaccines, Ecovac4, Easyfour and Easyfive
are also being marketed in India through
its joint venture Company Chiron Panacea
Vaccines Pvt. Ltd. (CPV). The Company
has gained significant market share in the
combination vaccine segment in domestic
market.
During the year, the Company has launched
PolProtec, an innovative injectable polio
vaccine, in the Indian market in pre-filled
syringe, NovoHib (monovalent Hib) vaccine
and PrimOpol, triavalent Oral Poliomyelitis
Vaccine in multi-dose through CPV.
As regards combination vaccines, developing
countries would need these vaccines to the
tune of around 300 million doses annually.
The combined demand of all combination
paediatric vaccines worldwide was valued at
US$ 600 million in 2005 and is estimated to
grow to US$ 1.6 billion by 2012. Pentavalent
vaccine market is estimated to cross a mark
of US$ 1 billion out of which UN agencies
are likely to procure this vaccine worth more
than US$ 350 million (around Rs.17 billion) by
2009 itself.
As regards Polio Vaccines, Panacea Biotec
has made dynamic progress in the field of
Polio protection with many new vaccines
coming into medical practice in recent times.
Under current circumstances, it is imperative
for the Company to be in harmony with
the Government’s policies & the medical
fraternity.
Hence, the Company has adopted a unique
strategy which harness with the government
The Company has launched PolProtec, an innovative injectable polio vaccine, in the Indian market in pre-filled syringe, NovoHib (monovalent Hib) vaccine and PrimOpol, triavalent Oral Poliomyelitis Vaccine in multi-dose through CPV.
Panacea Biotec • Annual Report 2008-0917

in their fight against polio known as
“Sequential dosing strategy”. This sequential
dosing strategy is OPV followed by
Inactivated Polio Vaccine (IPV). This strategy
is intended to decrease the incidence of
Polio, while maintaining high levels of
population immunity to poliomyelitis
outbreaks. It is expected to remain until
further progress towards global eradication
is achieved.
International Vaccines Business
Immunization has become one of the most important & cost effective ways of reducing child mortality. keeping this trend in mind, Panacea Biotec has adopted a strategy by the development of enhanced combination vaccines; opening a whole new dimension towards protecting multiple diseases with just single injection.
The company is poised to make inroads into global Vaccine markets and has deployed specialized team for its Vaccine Business in emerging (ROW) markets.
The Company has started establishing its ground work in various potential vaccine markets & also obtained registration in Nepal & Pakistan.
Panacea Biotec is all set to launch GeneratioNext vaccines such as Easyfive - a WHO pre-qualified pentavalent vaccine,
which is also amongst the world’s first fully
liquid vaccine & WHO stated high priority
vaccine, Polprotec (enhanced Inactivated
Polio vaccine, eIPV) & NovoHib (Haemophilus
influenzae type b conjugate - mono Hib
vaccine), in the emerging markets in years to
come. The International Vaccines Business is
well poised for a promising future ahead with
a steady increase in preventive healthcare
spending.
Logistics Network
Panacea Biotec has an advanced professional
logistics network throughout the country.
The Company has a nationwide sales and
marketing network covering approximately
450 districts in India and targets more than
1.1 million customers through a field force of
more than 1000 trained marketing and sales
professionals and 23 sales depots/carrying
and forwarding agents all over India. The
Company through its efficient sales force
reaches more customers more effectively.
The Company has its Central Warehouse at
Delhi. Besides this the Company also has
expertise in cold chain management for
storage and distribution of Vaccines under
monitored conditions using a system of
Vaccine Vial Monitors, Data Loggers, Ice
Boxes, Coolant, Cold Rooms and Refrigerated
Vehicles. This ensures that the Vaccines
remain safe and effective against changes in
the variant temperature conditions.
Panacea Biotec • Annual Report 2008-0918
Manufacturing Facilities Panacea Biotec has its manufacturing
facilities for vaccines and pharmaceutical
formulations in India in Delhi, at Lalru in
Punjab and at Baddi in Himachal Pradesh.
The Company is in the process of setting
up new manufacturing facilities for Cell
Culture based Vaccines in bulk form at Lalru,
which is expected to be completed in the
current financial year. The manufacturing
facilities have been set up in compliance with
international regulatory standards including
WHO-cGMP, US-FDA, European Union
standards for GMP and Good Laboratory
Practices (GLP).
The Company’s manufacturing expertise
lies in various solid, semi solid & liquid oral
dosage forms and vaccines such as:
• Oral-solids - Conventional tablets/
capsules, Controlled/delayed release/
enteric coating tablets and capsules,
Tablet in Tablet, Tablet in Capsule, Multi
Layered Capsules, Hard gelatin/ Soft
Gelatin capsules, Mouth Dissolving/
Chewable Tablets, Beads Encapsulation,
Coating: film, sugar & functional, Taste
masking and fast-dissolving tablets.
• Semi-solids - Ointments/Creams/Gels,
Transdermal Drug Delivery System.
• Liquids - Suspensions/Syrups/Solutions.
• Vaccines - Recombinant Vaccines,
Combination Vaccines and Cell culture
Vaccines and live vaccines.
Manufacturing Facilities for Vaccine
Antigens at Lalru, Punjab
The Company has three separate dedicated
bulk vaccine manufacturing facilities for
Recombinant, Bacterial and Tetanus Vaccines
at Lalru in Punjab. In addition to the existing
bulk vaccine manufacturing facilities, the
Company is setting up one more state of the
art bulk manufacturing facility comprising of
three suites at Lalru in Punjab, which have
been designed, constructed, adapted and
maintained for production of bulk vaccines
and cell culture based biopharmaceutical
products following current Good
Manufacturing Practices (cGMPs) prescribed
by WHO and US FDA with an investment
of around Rs.1 billion. One of the suites will
cater to the biopharmaceutical / vaccine
on mammalian cell culture system with the
option of conventional as well as disposable
bioreactors. The second facility would be
multi-product facility for microbial products
and the third facility will be for viral vaccines.
The Company expects these facilities to be
commissioned in the current financial year.
Two bulk vaccines manufactured at
Company’s Lalru unit (Recombinant
Hepatitis B Vaccine and Haemophilus
influenzae type b conjugate vaccine) are
WHO pre-qualified which are being used
for manufacture of innovative combination
vaccines for supply to UNICEF and PAHO.
Pharmaceutical Formulations facility at
Baddi
The Company’s state of the art
pharmaceuticals formulations manufacturing
facility at Baddi, built in compliance with
USFDA standards, received encouraging
acclaim and numerous plant approvals from
various regulatory authorities. The facility is
now approved for Brazil as well as for several
other markets like Yemen, Syria, Ukraine
& Ethiopia. The Company’s soft gelatin
manufacturing facility is also approved for
markets in European Union. The Company is
expecting clearances from other regulatory
agencies like MCC South Africa and UK
MHRA in the current fiscal. The facility has
annual capacity for producing 900 million
tablets, 120 million hard gelatin capsules, 12
million tubes and bottles each, 150 million
soft gelatin capsules and 60 million herbal
tablets.
Vaccines Formulation facility at Baddi
The Vaccine Formulation plant (VFP) at Baddi
in Himachal Pradesh, has two filling lines for
bacterial and viral vaccines complying with
WHO-cGMP norms for liquid Vaccines in pre-
The Company is in the process of setting up new manufacturing facilities for Cell Culture based Vaccines in bulk form at Lalru, which is expected to be completed in the current financial year.
Panacea Biotec • Annual Report 2008-0919

filled syringes, liquid & lyophilized Vaccines
in vials. The total production capacity of
this facility is 600 million doses per annum
which is scheduled to be increased by the
addition of third line to one billion doses per
annum by the end of current financial year.
This facility has increased the production
capacity of vaccines substantially in scale
and size. It would significantly improve our
market presence globally and augment our
plans to become a global leader in this field.
The three-storey main building consisting
of production, quality control and quality
assurance departments is spread over
approx. 2800 M² construction area at each
floor. The plant also has a five-storey block
of Warehouse-cum-Cold Storage facility
admeasuring approx. 2500 M² on each floor.
Vaccines Formulation facility in Delhi
Vaccines formulation facility in Delhi is a
WHO cGMP approved facility with WHO Pre-
qualification for Oral Polio and Recombinant
Hepatitis B Vaccine and combination
vaccines Ecovac-4, Easyfour & Easyfive. The
facility has been designed, constructed
and maintained to suit production of
vaccines following Good Manufacturing
Practices. It has three vial filling lines - two
lines dedicated to Oral Polio Vaccines
both Trivalent & Monovalent and one line
dedicated to Hepatitis B & Combination
Vaccines.
Manufacturing Facility for Anti-Cancer
Products at Navi Mumbai
The Company is setting up a manufacturing
facility for anti-cancer products at Mahape,
Navi Mumbai. This manufacturing plant will
have a state-of-the-art containment facilities
for clinical / commercial production of high-
end anti-cancer range of products.
Production facility at Baddi, Himachal Pradesh

Research & Development Panacea Biotec has built a strong R&D
base over the last decade to support its
business segments, vaccines, formulations
and biopharmaceuticals. It has five highly
sophisticated ultra-modern R&D centers
with 391 employees including 261 qualified
and experienced scientists for its various
research projects. The core area of research
& development includes new Vaccine
Development, Biopharmaceuticals, proteins,
peptides, monoclonal antibodies, Novel
Drug Delivery Systems projects, Advanced
Drug Delivery System projects and Drug
Discovery (small molecules), in compliance
with international regulatory standards. All
the five R&D Centers have been accorded
registration by Department of Scientific and
Industrial Research, Ministry of Science &
Technology, New Delhi.
As a result of its research efforts, the
Company has been granted more than 300
patents in India and worldwide including
major countries like U.S., Europe, Australia,
Canada, China, Japan, Russia etc.
For carrying out pre-clinical research, the
Company has a state-of-the-art animal house
and facilities for undertaking in-vitro and
in-vivo microbiology, pharmacology, safety,
efficacy, proof of concept and toxicology
studies.
The Company has been steadily increasing
its expenditure on R&D, both revenue and
capital expenditure, and has spent Rs.500.9
million (6.5% of net turnover) in fiscal 2009,
as compared to Rs.410.5 million (4.9% of net
turnover) in fiscal 2008, an increase of around
22% in value terms. Further, the Company
has also invested an amount of Rs.578.42
million as capital expenditure on R&D as
compared to Rs.666.2 million in previous
year.
The total R&D Expenditure has been
Rs.1,079.3 million (14.0% of net turnover)
as against Rs.1,076.7 million (13.0% of the
net turnover) in previous financial year. The
Company has plans to further strengthen
the R&D base to cater to more profitable
and expanding niches in vaccine and
formulations segments, both in domestic as
well as international markets.
LAKSH Drug Discovery R&D Center at
Mohali in Punjab
Laksh, the Company’s state-of-the art
Research Center for development of New
Chemical Entities (small molecules) at
Mohali, Punjab is spread over 70,000 sq.
ft. of Laboratory Space and employs more
than 70 scientists including 9 PhDs. Laksh
has expertise to carry out work on different
aspects of drug discovery which include
medicinal chemistry, in vitro and in vivo
biology, analytical & bio-analytical research,
pharmacokinetics and drug metabolism and
toxicology studies. The focus of research is
on development of NCEs for the treatment
of metabolic disorders, CNS and infectious
diseases.
Sampann R&D Center at Lalru in Punjab
The R&D Centre at Lalru named as SAMPANN
Drug Delivery is one of the major part of
Panacea Biotec’s Pentagon of R&D centers
which spread across 40,000 sq. ft. of
laboratory space with superior infrastructure,
specialized machinery, adequate resources
and skilled manpower to conduct research
in the areas of Formulation Development,
Novel Drug Delivery, Pharmacology,
Analytical Chemistry, Medicinal Chemistry
and Natural Products. The said research
facility also boasts of an in-house IPR
Management Department and Information
Science Department.
The primary focus of the Sampann Drug
Delivery is to develop value added drug
delivery products that would address unmet
medical needs, focus on patient convenience
and compliance, augment the intellectual
capital and contribute towards achieving
the organizational business goals. A large
number of high potential drug delivery
based projects have been selected for
The Company has been granted more than 300 patents in India and worldwide including major countries like U.S., Europe, Australia, Canada, China, Japan, Russia etc.
Panacea Biotec • Annual Report 2008-0921

development based on highly specialized
drug delivery technologies including Site
Specific Drug Delivery, Topical System, Depot
Injectable Preparations, Nanoparticulate
Drug Delivery, Pulmonary Drug Delivery
and Oral Controlled Release Systems. These
projects are targeted towards both the
domestic and global markets. In addition
to above mentioned differentiated drug
delivery systems, biopharmaceutical product
development to deliver stable and robust
formulations, has been initiated.
In year 2008-09, Product development
has been done for different categories of
drugs which include Anti-inflammatory,
Anti-allergics, Anti-tubercular, Anti-
haemmorrhoidal, Anti-emetics,
Anti-psychotics, Anti-bacterials, Anti-
hypertensives, Anti-depressants,
Immunosuppressants, Anti-arrhythmics, Anti-
retrovirals, Anti-diabetics etc. and various
combinations thereof the above category of
drugs.
Saha Vaccine Research Center in Delhi
The Saha Vaccine Research Center (SVRC) in
Delhi, spread across 24,000 Sq ft of laboratory
space has been established with an objective
to develop novel, effective and affordable
vaccines against various epidemic /endemic
life threatening diseases for global market.
SVRC has the infrastructure and expertise
to take an ‘idea’ through different stages of
product development towards a successful
commercialization. In view of company’s
strategy for expanding its scientific strength
to innovate more vaccines, this center is
carrying out extensive research in vaccines
and biologicals using genetic engineering,
animal cell culture, fermentation,
purification, serology, analytical and bio-
analytical development.
Specific areas in which Research &
Development being carried out include:
• Development of conjugate vaccine
against Streptococcus pneumoniae and
Neisseria meningitides
• Development of a novel recombinant
protein based vaccine for Anthrax
• Development of Vero cell derived
inactivated Japanese encephalitis vaccine
using animal component free media
GRAND R&D Center at Navi Mumbai

This R&D Centre is inter-alia, focused in
respect of:
• Development and improvement in
existing conjugation technology for
better yield and clinical application.
• IND submission for recombinant Anthrax
vaccine to US FDA for initiation of clinical
trials for providing a competitive edge
based on quality and pricing.
• Further development of recombinant,
polysaccharide conjugate and cell culture
based vaccines. The candidate vaccines
would be taken forward for scale up,
followed by pre-clinical and clinical
studies.
• Initiating the development of vaccine for
pertussis using a genetically modified
strain of B. pertussis.
Biopharmaceutical R&D Center in Delhi
The Biopharmaceutical R&D center (BRC) has
around 40 scientists working in the area of
molecular biology, cell biology, immunology
and peptides. The centre has been working
on different discovery and developmental
projects. Development of novel preventive
& therapeutic vaccines, novel therapeutic
peptides and therapeutic fully human
monoclonal antibodies for treating infectious
diseases and life style related disorders are
the focus of discovery projects. BRC is also
actively involved in developing different
biosimilar products.
During the year 2008-09 the centre has made
significant progress in the following fields:
• Optimisation of the process for the scale-
up production of hair growth peptide,
a technology for alopecia (hair loss)
management in-licensed from National
Institute of Health, USA. A pre-clinical
toxicological study has been planned.
• Identification of a novel peptide for the
treatment of Rheumatoid Arthritis. Proof
of concept has been established. The
synthetic process for this molecule has
been developed and optimized.
• Generation of recombinant clones for
several biosimilars. The technology for
one of the biosimilar molecule is ready
for transfer to the production unit.
Several in vitro assays for determining
bioactivity, binding and functionalities of
various biosimilars have been developed
and validated.
• In an attempt to develop vaccine to
control Dengue virus infection, a suitable
cell line for the assay and amplification
technology of recombinant chimeric
Dengue virus has been prepared.
Appropriate Dengue viruses have been
amplified and immunogenicity of the
candidate virus has been planned.
• A unique recombinant inactivated H5N1
candidate vaccine has been designed.
The immunogenicity of this candidate
has shown promising results.
• In order to identify appropriate clone
for fully human monoclonal antibodies,
a library of human antibodies has been
developed. The library is being screened
against various targets.
Further, responding to the threat of
widespread deadly disease of swine flu,
the Center has expedited development of
candidate vaccine for H1N1 swine flu.
GRAND R&D Center at Navi Mumbai
Global Research and Development (GRAND)
Center at Mahape, Navi Mumbai which
was inaugurated in February, 2008, is fully
functional. There is a team of around 50
highly skilled and committed research
scientists working relentlessly to discover
better therapeutic alternates for unmet
medical needs of the society. Broadly,
the Center is working on drug delivery
technologies based on:
• Nano-particle systems for targeted
delivery and reduced side effect with
improved bioavailability
• Microparticulate systems for depot
injections with reduced frequency of
dosing
Responding to the threat of widespread deadly disease of swine flu, the Center has expedited development of candidate vaccine for H1N1 swine flu.
Panacea Biotec • Annual Report 2008-0923

• Micellar systems for bioactive targeting
and bioavailability enhancement,
specially for cancer targeted drug
delivery
• Stealth liposomes for prolonged systemic
circulation to achieve better therapeutic
effects
• Controlled drug delivery for oral
application by utilizing the concept of
Gastroretentive systems, zero order
release systems and site specific delivery
system in gastrointestinal tract
• Nanoparticle for topical delivery with
better patient compliance and reduced
frequency of application
Few concepts based on above mentioned
technology platforms have cleared proof
of concept studies and are entering clinical
trials. Center has emerged as a strong
intellectual property earning member of
Panacea Biotec family with many patent
filings last year and few are in process.
Quality Assurance
Quality is among the most important reasons
to persuade a customer to buy a product.
Total Quality Management has always been
the cornerstone of your Company which has
resulted in achieving greater milestones in
the past couple of years. At Panacea Biotec,
Quality is in-built in products & services and it
is integrated in each step of R&D, Production,
Packaging, Storage, Marketing, Sales &
Distribution. Your Company is committed to
adhere to the highest quality standards for
products it manufactures and is ensuring this
through a highly qualified, techno-innovative
& dedicated team.
Clinical Research Operations
Clinical Research plays a pivotal role in
the drug development process. Clinical
development establishes the safety and
efficacy of a new drug product involving
significant expertise, time and investment.

The Company also successfully completed
clinical part of trial of bOPV, aimed towards
the planned application for WHO pre-
qualification.
The year 2008-09 witnessed several
milestone achievements for Clinical Research
Operations of the Company, including:
• a large randomized controlled trial
in ~1,800 subjects across 40 centers
for a novel drug delivery product for
osteoarthritis;
• a multinational trial, spread across two
geographical regions (Asia/EU) & three
countries (India/Germany/Poland) for a
GI product;
• a long duration trial with a 2-year follow-
up to evaluate the relapse rate 24 months
after the completion of therapy for an
anti-infective product;
Panacea Biotec is the first Indian
pharmaceutical company to indigenously
implement the Oracle Remote Data Capture
(RDC) enabling it to conduct e-clinical trials.
Intellectual Property
Panacea Biotec has its full fledged Intellectual
Property Rights department which manages
all the Intellectual Property from inception to
enforcement.
As at the end of fiscal 2009, the Company
has filed over 1,150 patent applications
worldwide including 189 Indian patent
applications and 67 applications have been
filed through the PCT (Patent Cooperation
Treaty) route.
Out of the total number of patent
applications filed, 325 patents had been
granted / accepted for grant. Apart from
this, the Company had in-licensed several
patent applications, some of which are under
prosecution in different countries of the
world.
During fiscal 2009, the Company had
filed 17 new Provisional Indian patent
applications relating to various drug delivery
technologies, synthetic processes, new
chemical entities, improved chemical entities,
vaccines, pharmaceutical compositions and
natural product compositions out of which
11 applications were filed through the PCT
route.
Till date Panacea Biotec has been granted
10 patents in India and 26 product
patents worldwide for different products/
technologies during the year under review
Some of the key patents granted to Panacea
Biotec during the fiscal 2009 are: Euphorbia
Prostrata (Thank OD & Sitcom) granted in
India, Mexico, New Zealand, South Africa &
USA; Nimesulide Controlled Release (Willgo)
granted in Indonesia & Israel; Domperidone &
Pantoprazole Combination (OD-PEP) granted
in New Zealand & South Africa; Nimesulide
Gel (Nimulid Transgel) two patents granted
in India & one in Kenya; Nimesulide Injection
(Nimulid Safeinject) granted in India;
Amoxicillin (Modified Release) granted
in Australia & South Africa; Nimesulide
Effervescent Tablets granted in India; and
Paclitaxel granted in Morocco.
Besides this, the Company had filed
123 applications for the registration of
Copyrights (41 applications in 2008-09)
of which 80 had been granted. So far the
company has filed over 566 applications for
registration of Trade Marks (25 applications
in 2008-09) of which 273 have been
registered. In addition to this, the Company
has also filed 55 International Trade Mark
Applications in various countries of which 24
have been granted. The company has so far
filed 4 Design Applications (1 application in
2008-09) and 3 of them have already been
registered.
Human Resources
Human Resources have been a strategic
partner in the organization in its endeavour
to lead market with its differentiated
products. Human resources have been taking
The Company has filed over 1,150 patent applications worldwide including 189 Indian patent applications and 67 applications have been filed through the PCT (Patent Cooperation Treaty) route.
Panacea Biotec • Annual Report 2008-0925
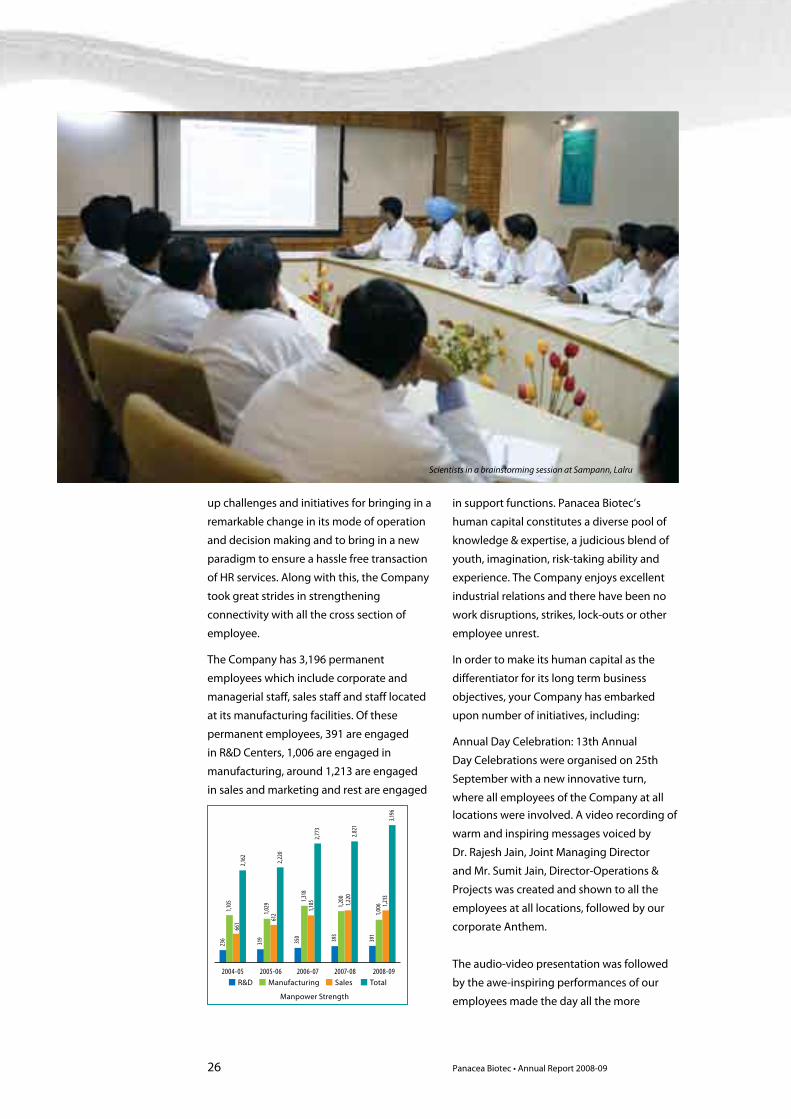
up challenges and initiatives for bringing in a
remarkable change in its mode of operation
and decision making and to bring in a new
paradigm to ensure a hassle free transaction
of HR services. Along with this, the Company
took great strides in strengthening
connectivity with all the cross section of
employee.
The Company has 3,196 permanent
employees which include corporate and
managerial staff, sales staff and staff located
at its manufacturing facilities. Of these
permanent employees, 391 are engaged
in R&D Centers, 1,006 are engaged in
manufacturing, around 1,213 are engaged
in sales and marketing and rest are engaged
in support functions. Panacea Biotec’s
human capital constitutes a diverse pool of
knowledge & expertise, a judicious blend of
youth, imagination, risk-taking ability and
experience. The Company enjoys excellent
industrial relations and there have been no
work disruptions, strikes, lock-outs or other
employee unrest.
In order to make its human capital as the
differentiator for its long term business
objectives, your Company has embarked
upon number of initiatives, including:
Annual Day Celebration: 13th Annual
Day Celebrations were organised on 25th
September with a new innovative turn,
where all employees of the Company at all
2004-05
236
319 350
1,318
1,105
2,77
3
393
1,200
1,220
2,82
1
391
1,006 1,2
133,1
96
1,029
612
2,22
0
1,105
661
2,162
2005-06 2006-07
Manpower Strength
2007-08 2008-09R&D Manufacturing Sales Total
locations were involved. A video recording of
warm and inspiring messages voiced by
Dr. Rajesh Jain, Joint Managing Director
and Mr. Sumit Jain, Director-Operations &
Projects was created and shown to all the
employees at all locations, followed by our
corporate Anthem.
The audio-video presentation was followed
by the awe-inspiring performances of our
employees made the day all the more
Scientists in a brainstorming session at Sampann, Lalru
Panacea Biotec • Annual Report 2008-0926

colorful and memorable across locations to
celebrate the “Spirit of Togetherness”. With
enthusiastic participation, the Annual Day
was a great success.
Company Newsletter: A quarterly Company
Newsletter has been launched with the
main objective to internally connect the
employees which can ignite the true spirit of
togetherness and bring in a sense of pride for
our achievements.
HR Buddy: HR4U to help employees with an
instant answer to their ‘pain area’, an email
based employee connect initiative has been
rolled out this year. The ‘HR4U’ mailbox is
an efficient and friendly channel to answer
every query within a short span of time by
the HR Buddy.
HR SAP Blitz - Go Live and ESS Online:
Going Live on HR SAP across all business
function was a
major success
during the year.
It has helped
the Company in
way of having
a time effective
and cost effective
operational
process in HR.
The launch of ESS
has curtailed the
manual processes
and has taken
the Company
to an improved
information edge
which successfully promotes the
concept of having a paperless HR
in the years to come.
Baddi Housing: To bring in a
healthy work/life balance for
employees of the Company at
Baddi and to provide employees
with quality accommodation in
areas where there is a shortfall
of rented accommodation, the
Company has come up with its
own housing of 80 residential
flats with all modern amenities at moderate
rentals for its employees.
Learning and Performance management:
Continuous development of its human
resources has always been the focus of the
Company. Panacea Biotec continuously
strives to provides seminars and training
programs to meets of employees. Proper
training schedule was formed up during
the year including Creativity Retreat, People
Leadership, Zero Defect and Cost Reduction
to name a few. The leadership team of
Panacea Biotec underwent a 3-day workshop
on the ‘7 Habits of Highly Effective People’
as part of their Leadership Development
Programme.
Information Technology
As a research based organization, your
Panacea Biotec • Annual Report 2008-0927

Company believes in accelerating value
realization and delivering operational
efficiencies in healthcare. Panacea Biotec has
been continuously investing in information
technology to enhance communication
facilities with a view to provide a strong
knowledge base to its employees, enable
faster scanning & monitoring of external
environment and improve the knowledge
of best practices and relevant leading-edge
technologies.
As an effort towards implementation
and leveraging of technology initiatives
to improve the efficiency of various
departments, your Company has already
implemented System Analysis and Product
in Data Processing (SAP) covering Financial
Accounting, Controlling, Asset Management,
Materials Management, Production Planning
and Sales Distribution. SAP HR Module
has also been successfully implemented.
Implementation of some other modules
like Project Systems, Plant Maintenance,
Business process consolidation & Strategy
management are in pipeline.
The Company has also adopted Oracle
clinical trial software and SAS analysis tool
to manage, standardize and control clinical
data for fast study set-up and consistent
interpretation of data in compliance with
regulatory requirements.
Microsoft Exchange and Share point
portal solution is available for messaging
& collaboration, addressing the internal
& external communication and workflow
needs. The Company’s sales depots &
manufacturing facilities are well connected
through secure and robust Virtual Private
Network (VPN)
BestOnHealth Portal: The Company’s health
portal “www.bestonhealth.com”, developed
and launched in the year 2002 with an
objective to provide comprehensive health
related information & services to common
man & medical practitioners.
It offers a unique interactive ‘Individualized
Health Management plan’ which links
individual health record with investigations,
diet, exercise, yoga & medication; knowledge
base of Holistic healing with focus on
Ayurveda, Homeopathy & Yoga apart
from Allopathy; Health Calculators & ready
reckoners; Path finders to various common
illnesses and disease; Comprehensive health
information with focus on children & elderly;
and Neighborhood Resources for doctors,
labs, chemists etc.
It also offers unique interactive facility for
Medical practitioners, including creation
of their own Information & Resource
Centre; tools to create and maintain patient
records & interact with them online; latest
information on diseases & therapeutic areas
of their interest; attend Continuing Medical
Education (CME) programs online and in
person; interface with peers and specialists
from related fields online; explore placement
opportunities; opportunities for participation
in clinical trials; and holding patient/public
awareness programs.
As a member of BestOnHealth.com portal,
one can also order disease-specific patient
education corners and regular supply of
offline material like brochures, leaflets,
booklets etc. and can also keep a track
of events and appointments through
interactive reminder service.
For Patients & Healthy individuals, this portal
is one of a kind, individualized management
tool in investigation, medication, diet,
exercise, yoga. It offers information on
customized diets that compliment health as
well as the taste buds; different treatment
options and new diagnostic techniques;
specific information about investigations,
preparation required before hand and what
the test reports mean.
This Portal also provide a customized,
disease-specific bi-monthly newsletters
providing contemporary knowledge about
diseases & their treatment; information on
novel researches & seminars; information
about the “BestOnHealth” patient education
programs; schedulers to remind about daily
The Company’s health portal “www.bestonhealth.com” provides comprehensive health related information & services to common man & medical practitioners and offers a unique interactive ‘Individualized Health Management plan’.
Panacea Biotec • Annual Report 2008-0928

or important events; and interactive exercise
& yoga plans.
The portal also provides an interactive
Address book to keep track of contacts and
a common platform to share experiences in
tackling disease with other patient groups.
The portal is becoming widely popular
and is being regularly accessed by healthy
individuals, patients & medical practitioners
from all across the globe. During last 4
months, the average number of hits (attempt
to access the site) is around 3000/day. The
number of visitors who read the contents is
more than 300/day. The visitors are coming
from various parts of the world, including
40% from US, 23% from India, 17% from
China and rest from UK, Korea, Japan,
Sweden, Singapore, France, Canada, etc. A
significant percentage of visitors are Medical
practitioners.
Future Perspectives: It will continue to
address the needs of medical fraternity
& patients and be an excellent source
of patient education and furthering the
ultimate objective of a healthy world. The
Company has planned to enhance the
coverage of the health portal in current
financial year and expects the portal:
• To add value to Panacea Biotec’s
perception amongst doctors as a leading
health management company;
• To benefit doctors to enhance their
practice with IT enabled services & form
closer ties with our organization
• To publish medical practitioner’s articles,
quotes, photos in the portal periodically;
• Information sharing regarding various
healthcare/ medical conferences/
exhibits calendar based;
• To show patient’s opinion about the
doctors;
• To include Specialty & city-wise contact
details database of our member medical
practitioners;
• To show doctors achievement & the
content they wanted to put about
themselves; and
• To be the online interface of the
Company’s upcoming healthcare facility.
Internal Audit and Control
The Company believes that its internal
control systems and procedures are
in line with its size of operations and
provide, among other things, a reasonable
assurance that transactions are executed
with Management authorization and they
are recorded in all material respects to
permit preparation of financial statements
in conformity with established accounting
principles and that the assets of your
Company are adequately safeguarded
against significant misuse or loss. The
internal control systems are supplemented
through an extensive internal audit
programme and periodic review by Audit
Committee.
M/s. Dass Gupta & Associates, Chartered
Accountants, M/s. S.K. Badjatya & Co.,
Chartered Accountants and M/s. K.K. Garg
& Associates, Chartered Accountants,
continue to act as the Internal Auditors
of the Company. The internal auditors
independently evaluate adequacy of
internal controls and audit the majority of
the transactions in value terms. Post audit
reviews are carried out to ensure that audit
recommendations have been implemented.
The Audit Committee of the Board of
Directors comprising of three non-
executive independent Directors viz.
Mr. R.L. Narasimhan, Mr. N.N. Khamitkar
and Mr. Sunil Kapoor, reviews Internal Audit
Reports and the adequacy of the Internal
Controls. The Auditors, Joint Managing
Director, Associate Director, Chief Financial
Officer, D.G.M. (Accounts & Finance) and
other senior officials are invited to attend the
Audit Committee Meetings.
The number of visitors who read the content of health portal is more then 300/day. The visitors are coming from various parts of the world, including 40% from US, 23% from India, 17% from China and rest from UK, Korea, Japan, Sweden, Singapore, France, Canada, etc.
Panacea Biotec • Annual Report 2008-0929


Subsidiaries, Joint Ventures, Collaborations & Tie-upsSubsidiaries
Best On Health Limited - The Company’s
wholly-owned subsidiary (WOS) namely
Best On Health Ltd. (“BOH”), which owns
a prime immovable property being used
by the Company as its Corporate Office,
has charted out a plan for diversification in
related health management space as part
of its future growth plans. The Company
has so far invested Rs.2,013.9 million in BOH
including Rs.1,991 million as 0.5% optionally
convertible Non Cumulative Preference
Shares to finance its foray into healthcare
industry. BOH has four WOS namely Radicura
& Co. Ltd, Panacea Hospitality Services Pvt
Ltd., Sunanda Steel Company Ltd & Panacea
Educational Institute Pvt. Ltd.
Umkal Medical Institute Pvt. Ltd. - The
Company is expanding its portfolio by
entering the fast growing healthcare
sector and has entered into collaboration
with Umkal Group to set-up a multi
super-specialty hospital with the modern
equipments in the NCR of Delhi at Gurgaon.
With your Company’s leadership in
providing innovative medical therapies and
Umkal’s long term experience in providing
specialized healthcare, the collaboration
would be unique and one of its kind. Your
Company has invested an amount of
Rs.76.14 million for acquiring 75.2% stake
(27% paid-up) in Umkal Medical Institute
Private Limited, during the year under
review. Further, during the current fiscal, the
Company has also paid second call money of
Rs.24.0 million (representing 8.5% payment).
Panacea Biotec Inc. - During the year under
review, the Company has incorporated a
wholly owned subsidiary (WOS), Panacea
Biotec Inc. in US with its main objects
of, inter-alia, research, development,
manufacture, register, market, distribute,
import and export pharmaceutical and
biological products etc. in United States. The
Company has remitted an amount of Rs.2.4
million (US$ 50,000) as a capital contribution,
during the current financial year.
Panacea Biotec FZE – This WOS was
incorporated in UAE to perform the activities
relating to registration and marketing of the
Company’s patented products worldwide
and an amount of Rs.5.5 million (AED
500,000) had been remitted towards its
capital contribution.
Panacea Biotec GmbH - During the year
under review, your Company had remitted
an amount of Rs.1.6 million (Euro 25,000) for
setting-up WOS in Germany, namely Panacea
Biotec GmbH, with a view to perform
activities relating to registration of the
Company’s products in European Union.
Rees Investments Limited – It has been
set-up as a Company’s WOS in Islands
of Guernsey with its main objects of
manufacture, marketing and/or import/
export of pharmaceutical formulations,
vaccines and other products, making
strategic investments in other entities,
entering into joint venture and
collaborations and/or for carrying out such
other permissible activities. The Company
has given a loan of Rs.710.8 million (US$ 14
million) to it. Rees Investments has further
established its WOS company namely,
Kelisia Holdings Limited, Cyprus whose
principal activity is holding of Investments.
Kelisia Investment Holding AG and Panacea
Biotec (International) SA had been set-up in
Switzerland as step-down WOS companies
of Rees Investments Ltd., with the purpose of
carrying out investment activity as well as to
engage in all other related activities.
During the year, Kelisia Holdings Ltd.
has made a strategic equity investment
of US$13.1 million in PharmAthene, Inc.,
Annapolis, MD, US, a biodefense company
developing medical countermeasures
against biological and chemical threats, in
exchange for the purchase of common stock
and warrants in PharmAthene.
The Company is expanding its portfolio by entering the fast growing healthcare sector and has entered into collaboration with Umkal Group to set-up a multi super-specialty hospital with the modern equipments in the NCR of Delhi at Gurgaon.
Panacea Biotec • Annual Report 2008-0931

Joint Ventures & Associates
Panacea Biotec has the following Joint
Venture and Associate Companies:
Chiron Panacea Vaccines Pvt. Ltd. - Your
Company’s Joint Venture Company (JV
Company), Chiron Panacea Vaccines Pvt. Ltd.
(“CPV”), was incorporated in fiscal 2005 in
India with Chiron Vaccines Holding Srl., Italy
(now Novartis Vaccines and Diagnostics),
a division of Novartis, world’s fifth largest
vaccines manufacturer, for marketing of
innovative combination and other vaccines
in India. The Company has invested Rs.23.0
million in CPV for a 50% equity stake. With
the launch of Hepatitis A vaccine HAVpur,
a new generation vaccine with virosome
technology in collaboration with Berna
Biotech Ltd., Switzerland and the Company’s
Injectable Polio Vaccine (PolProtec),
monohib vaccine (novoHib), Triavalent Oral
Poliomyelitis Vaccine (PrimOpol) in the
Indian market, CPV has a strong portfolio of
innovative paediatric vaccines, which in short
span has taken significant position at market
place. CPV achieved a turnover of Rs.538.4
million and net profit of Rs.41.6 million
during the year under review and commands
a significant market share in the paediatric
combination vaccines segment in India. It has
introduced innovative concepts like Peel off
stickers, Easy Track SMS service and Pre-filled
Syringes with Plastic Rigid Tip Cap.
Cambridge Biostability Ltd. - The Company’s
another JV Company, Cambridge Biostability
Ltd. (CBL), a U.K. based Company, in which
the Company acquired 10% stake and also
given a convertible loan of £ 1.5 million
during earlier years, has gone into creditors’
voluntary liquidation proceedings due to its
adverse financial position.
PanEra Biotec Private Limited - Your
Company’s associate Company, PanEra
Biotec Pvt. Ltd. (PanEra) is continuing to
meet the Company’s requirement of bulk
vaccines and antigens for the manufacture
of Hepatitis B and Combination Vaccines
by your Company. PanEra has become
a specialized company focused on bulk
manufacture of vaccines and plans to
venture into new products and technologies.
It has also launched its web-site namely
www.panerabiotec.com.
Lakshmi & Manager Holdings Limited
- During the year under review, the
Company’s associate firm, viz. M/s Lakshmi
& The Manager, in which the Company
had invested Rs.40.0 million (40% share),
has been taken over by a newly formed
company, Lakshmi & Manager Holdings
Limited. As a result of takeover of the said
firm, the Company has been allotted Equity
Shares for an amount of Rs.41.26 million in
the said company.
Collaborations and Tie-ups
Apart from the above, Panacea Biotec has
important business relationships with various
research institutes, academic universities &
commercial corporations, including:
National Institute of Immunology, India:
The Company has an exclusive ten-year
license agreement with National Institute
of Immunology, India for in-licensing of
technology and processes for production of
tissue culture derived formalin inactivated,
Japanese encephalitis vaccine. The
technology has been further modified
significantly at our research center to yield a
commercially viable and safer vaccine.
Biotech Consortium India Ltd.: The Company
has a ten-year in-licensing arrangement
with Biotech Consortium India Ltd. for the
development, manufacture and marketing
of anthrax vaccine developed by Jawahar Lal
Nehru University, India. Phase I/IIa of human
trials have been successfully completed
and the Phase-IIb clinical trials are to begin
shortly, subsequent to which the company
plan to make IND submission to US FDA for
initiation of clinical trials in US and supply the
anthrax vaccine to the U.S. Government.
Panacea Biotec • Annual Report 2008-0932

National Institutes of Health (NIH), USA.: The
Company has an in-licensing arrangement
with NIH, USA, for use of a peptide based
product for generation of hair follicles
and hair growth for alopecia (hair loss)
management. Process for the scale-up
production of hair growth peptide has been
optimized. A pre-clinical toxicological study
has been planned.
Dr. Reddy’s Laboratories Ltd.: The Company
has a License and Supply Agreement with
Dr. Reddy’s for the supply of its patented
product, Nimesulide Injection, for marketing
in India. The Company has another License
and Supply Agreement with Dr. Reddy’s
for another patented product, Nimesulide
Transdermal Gel, for marketing, distribution
and sale in Russian Federation.
Nederlands Vaccine Institute (NVI),
Netherlands: The Company has an
agreement with NVI for manufacturing
and marketing of Inactivated Polio Vaccine
(PolProtec) in global markets except
Netherlands, Denmark, Norway and Finland.
National Research Development Corporation
(NRDC), India: The Company had in-licensing
arrangement with NRDC for manufacturing
the Foot and Mouth Disease (FMD) Vaccine
developed by Indian veterinary Research
Institute (IVRI).
PT BioFarma, Indonesia : The Company has
an agreement with PT BioFarma, Indonesia to
manufacture & market the Measles Vaccine
and plans to supply the vaccine to UNICEF,
PAHO and CIS, African, LATAM and Asian
Countries in furtherance to Global Measles
Reduction Strategy of WHO and UNICEF.
Punjab University, Chandigarh: The
Company has a MoU with Punjab University,
Chandigarh for a Drug Discovery Project
to identify lead molecules with an aim to
bring a New Chemical Entity (NCE) superior
to existing marketed products in the
therapeutic area of Psychiatric Disorders.
Panacea Biotec will undertake their pre-
clinical and clinical development leading to
their launch worldwide.
Dr. Rajesh Jain, Mr. Vinod Goel, Mr. Ankesh Jain (4th, 7th & 8th from left) with European Partners and competency team (from Left to Right) Dr. Konstanze Kral, Dr. Wolfgang Klotz, Mr. Gerd-Peter Heberling, Mr. Hartmurt Bannert,
Mr. Klaus Manlik and Dr. Bernd G. Ruttger, during a recent meeting in Munich, Germany
Panacea Biotec • Annual Report 2008-0933

Financial PerformanceSummarised Balance Sheet
(Rs. in million)
Particulars As on As on 31.03.09 31.03.08
Sources of Funds:
Shareholders Funds 6,151.5 6,972.1
Loan Funds 7,002.9 3,982.4
Deferred Tax Liability 333.8 595.0
Total Liabilities 13,488.2 11,549.5
Application of Funds:
Net Fixed Assets 6,938.7 5,343.7
Investments 2,165.7 2,049.3
FCMITDA† 96.0 -
Net Current Assets 4,284.2 4,151.2
Miscellaneous Expenditure 3.6 5.3
Total Assets 13,488.2 11,549.5
†Foreign Currency Monetary Item Translation Difference Account
Net Worth: The Net Worth of your Company
is Rs. 6,147.9 million during the year under
review as compared to Rs.6,966.7 million as
at the end of previous year.
Loan Funds: The total loan funds as at 31st
March, 2009, has increased to Rs.7,002.9
million as against Rs.3,982.4 million as a
result of raising of Foreign Currency Term
Loans to part finance its expansion projects
including setting up of manufacturing
facilities at Baddi & Lalru and R&D Center at
Mumbai and other ongoing expansion/ New
projects.
Deferred Tax Liability: The deferred tax
liability has decreased to Rs.333.8 million
as at the end of fiscal 2009 as compared to
Rs.595.0 million as at the end of the previous
year.
Fixed Assets: The net fixed assets have grown
to Rs.6,938.7 million as against Rs.5,343.7
million as at the end of the previous year on
account of capital expenditure on ongoing
expansion/ new projects and capitalization
of forex exchange losses as per option given
by the Companies (Accounting Standards)
Amendment Rules, 2009.
Investments: The investments have increased
to Rs.2,165.7 million from Rs 2,049.3 million
as at the end of previous year primarily on
account of investment of Rs.200.0 million
in its WOS Best on Health Ltd. and Rs.76.1
million in its subsidiary Umkal Medical
Institute Pvt. Ltd. to finance its foray in
healthcare industry. Further, a provision
on account of permanent diminution in
value of investment of Rs.168.1 million in
the Company’s joint venture Cambridge
Biostability Ltd. was made during the year.
Net Current Assets: The Company’s net
current assets have improved to Rs.4,284.2
million as against Rs.4,151.2 million as at
the end of previous financial year. The
inventories have increased to Rs.4,478.0
million from Rs.2,116.4 million and the
inventories to net turnover ratio increased to
58% from 25% during previous year mainly
on account of postponement of deliveries
of finished products and purchase of raw
materials as per commitments in the existing
agreements. The receivables decreased
to Rs.1,238.8 million as against Rs.1,482.6
million as at the end of previous financial
year and the receivables to net turnover ratio
decreased to 16% from 18% during previous
year. The Cash and bank balances declined to
Rs.594.8 million as against Rs.1,411.8 million
as at the end of previous financial year. Other
current assets increased to Rs.1,358.2 million
as against Rs.434.1 million due to advances
of Rs.710.8 million to the Company’s WOS,
Rees Investments Ltd. and advances of
Rs.108.8 million to the Company’s Joint
Venture, CBL as against Rs. Nil and Rs.39.78
million respectively as at the end of the
previous year.
The current liabilities increased to Rs.1,528.1
million as compared to Rs.1,078.0 million
as at the end of previous financial year.
Increase in current liabilities is mainly on
account of increase in amount payable
to vendors for vaccines raw material. The
Provisions increased to Rs.1,857.5 million as
against Rs.215.8 million mainly on account
The net fixed assets have grown to Rs.6,938.7 million as against Rs.5,343.7 million as at the end of the previous year.
Panacea Biotec • Annual Report 2008-0934

of increase in provision for Open Derivative
Contracts to Rs.1,743.1 million as compared
to Rs.40.5 million as at the end of previous
financial year.
Profit & Loss Account
Summarised Profit & Loss Account (Rs. in million)
Particulars As on As on 31.03.09 31.03.08
Gross Turnover 7,753.0 8,342.2
Less : Excise Duty 18.8 37.8
Net Turnover 7,734.2 8,304.4
Materials & Finished Goods Purchases 2,660.9 3,658.4
Operating & Other Expenses 806.4 705.0
Personnel Expenses 916.1 924.9
Selling & Distribution Expenses 434.5 451.1
Research & Development Expenses 500.9 410.5 (Excl. Depreciation)
Misc. Expenses 1.7 1.7
Earnings Before Interest, Depreciation, 2,444.6 2,177.6 Taxes & Amortization (EBITDA)
Foreign Exchange Fluctuation 2,260.4 40.5
Financial Expenses 347.4 150.1
Depreciation 705.1 430.0
Other Income 259.7 371.7
Provision for impairment 284.2 -
Profit/ (Loss) Before Tax (PBT) (923.7) 1,903.9
Provision for Taxes – current - 330.0
Provision for Taxes – deferred (261.2) 211.2
Provision for FBT 28.0 31.0
Profit/ (Loss) After Tax (PAT) (690.5) 1,331.7
Turnover: The Company has achieved net
turnover of Rs.7,734.2 million during financial
year 2008-09 as compared to Rs.8,304.4
million during financial year 2007-08.
The decline in Net Turnover is mainly on
account of lower sales of vaccines due
to postponement of supplies to UNICEF,
which is down by 15% as compared to
previous year, whereas overall decline in Net
Turnover is by 7% as compared to previous
year. Balance growth comes from Pharma
segment. In other words, the Company’s
dependence on vaccines in general and
oral polio vaccine in particular is gradually
shifting towards other vaccines and
Pharmaceutical formulation products.
Segment-wise Turnover
Fiscal 2009 2008
Rs. Million % Rs. Million %
Vaccines 5,470.17 70.7 6,324.5 76.1
Pharmaceutical
Formulations* 2,262.30 29.2 1,976.0 23.8
Research &
Development 1.7 0.1 3.9 0.1
Total 7,734.17 100.0 8,304.4 100.0
* Net of excise duty of Rs.18.8 million and Rs.37.8 million
during fiscal 2009 & 2008, respectively.
Vaccines
In fiscal 2009, the vaccines segment’s turnover
contributed Rs.5,470.2 or 70.7% of net
turnover, as compared to Rs.6,324.5 million or
76.1% of net turnover for fiscal 2008.
The institutional vaccine business contributed
Rs.5,186.9 million as against Rs.6,106.3 million
during the fiscal 2008.
The vaccine sales to JV company for domestic
market increased by 11.4% to Rs.243.3 million
as against Rs.218.3 million during fiscal 2008.
Despite having pricing pressure from entry of
generic players, the JV company continued to
grow and maintained leadership position in
the paediatric combination vaccine segment.
Pharmaceutical formulations
The pharmaceutical formulations segment’s
turnover grew by 14% and contributed
Rs.2,262.3 million or 29.2% of net turnover
during fiscal 2009, as compared to Rs.1,976.0
million or 23.8% of the net turnover for fiscal
2008.
In the Pharmaceutical Formulations segment
the domestic net turnover increased by
10.7% to Rs.1,815.3 million during fiscal 2009
from Rs.1,639.5 million during fiscal 2008.
The export turnover of formulations
increased significantly by 26.7% to Rs.426.0
million during fiscal 2009 from Rs.336.5
million during fiscal 2008.
The following table sets forth the Company’s
The pharmaceutical formulations segment’s turnover grew by 14% and contributed Rs.2,262.3 million or 29.2% of net turnover during fiscal 2009.
Panacea Biotec • Annual Report 2008-0935

gross turnover (inclusive of excise duty)
from pharmaceutical formulations in various
categories:
Fiscal 2009 2008
Rs. in Rs. in million % million %
Renal Disease 658.6 30% 487.6 24% Management
Diabetes & Cardiovascular 619.6 28% 547.0 27% Management
Pain Management 397.9 18% 554.4 28%
Anti-Osteoporosis 144.9 7% 57.5 3%
Gastro-Intestinal & 127.6 6% 105.4 5% constipation
Oncology 45.0 2% 29.6 1%
Anti-Tubercular 50.7 2% 54.0 3%
Other Segments 172.9 7% 178.2 9%
Total 2,217.2 100% 2,013.7 100%
Expenditures:
Materials & Finished Goods Purchases:
The raw and packing materials consumed
and finished goods purchased during the
year under review has decreased by 27.3%
at Rs.2,660.9 million as against Rs.3,658.4
million during the previous financial year.
The materials consumption ratio as a
percentage to net turnover has improved to
34.4% from 44.1% during previous year.
Operating & Other Expenses: The operating
& other expenses increased by 14.4% to
Rs.806.4 million for fiscal 2009 from Rs.705.0
million for fiscal 2008. As a percentage of
net turnover, the said expenses increased
by 1.9% in fiscal 2009 to 10.4% from 8.5% in
fiscal 2008. The increase in these expenses
was mainly on account of increase in various
operating expenses like power & fuel,
insurance, legal & professional charges and
travelling costs, etc.
Personnel Expenses: The personnel expenses
decreased by 0.9% to Rs.916.1 million for
fiscal 2009 from Rs.924.9 million for fiscal
2008. As a percentage of net turnover, these
expenses marginally increased to 11.8% in
fiscal 2009 from 11.1% in fiscal 2008.
Selling & Distribution Expenses: The Selling &
Distribution expenses decreased by 3.7% to
Rs.434.5 million for fiscal 2009 from Rs.451.1
million for fiscal 2008. As a percentage of net
turnover, these expenses increased to 5.6%
in fiscal 2009 from 5.4% in fiscal 2008.
Research & Development (R&D) Expenses:
The R&D expenses, excluding depreciation
on R&D assets, increased by 22.0% to
Rs.500.9 million as against Rs.410.5 million
during fiscal 2008. The increase is mainly
on account of expenses of new R&D
Centers which got operational during the
previous year and increase in personnel
cost of existing R&D Centers and research
related costs. Depreciation on R&D assets
increased by 28.7% at Rs.169.0 million as
against Rs.131.4 million during previous
financial year. Total R&D expenses (including
depreciation) increased to 8.7% of net
turnover during fiscal 2009 as against 6.5%
during previous year.
Interest: Interest charges increased to
Rs.321.1 million during fiscal 2009 as against
Rs.116.3 million during fiscal 2008. The
increase in interest charges is attributable
to overall increase in interest rates, higher
utilization of borrowed funds on account
of Foreign Currency Loan and utilisation of
increased working capital limits from Banks.
As a percentage of net turnover, the interest
charges increased to 4.1% from 1.4% in fiscal
2008.
Finance & Miscellaneous Charges: Finance
and miscellaneous charges decreased to
Rs.28.0 million during fiscal 2009 from Rs.35.5
million during fiscal 2008. As a percentage of
net turnover, these expenses were at 0.4%.
Depreciation: Depreciation increased by
64.0% to Rs.705.1 million as compared to
Rs.430.0 million during fiscal 2008 due to
capitalization of new production facilities
and R&D Centers, increase in other fixed
assets and capitalization of exchange
fluctuation losses in terms of the Companies
(Accounting Standards) Amendment Rules,
2009. Depreciation as a percentage of net
turnover increased to 9.1% in fiscal 2009
from 5.2% in fiscal 2008.
Total R&D expenses increased to Rs.669.9 or 8.7% of net turnover during fiscal 2009 as against Rs.541.9 or 6.5% of net turnover during previous year.
Panacea Biotec • Annual Report 2008-0936

Profitability Margins:
Earnings Before Interest, Tax, Depreciation
& Amortisations (EBITDA): The Company
registered EBITDA of Rs.2,444.6 million for
fiscal 2009 as compared to Rs.2,177.6 million
for fiscal 2008. The EBITDA margin was 31.6%
during fiscal 2009 as against 26.2% during
fiscal 2008.
Profit / (Loss) Before Tax (PBT): The Company
suffered a loss before tax of Rs.923.7 million
for fiscal 2009 as against profit before tax
of Rs.1,903.9 million for fiscal 2008, mainly
on account of foreign exchange fluctuation
losses of Rs.2,260.4 million, provisioning
due to permanent diminution of investment
made and doubtful loans/ advances
including interest thereon aggregating
Rs.284.2 million and also partially due to
increase in depreciation and other expenses.
Profit/ (Loss) After Tax (PAT): The PAT turns
to negative at Rs.690.5 million for fiscal year
2009 from positive of Rs.1,331.7 million for
fiscal 2008.
Earning per Share (EPS): The basic EPS and
diluted EPS stood at negative Rs.10.35 per
share of Re.1 as compared to Rs.20.14 and
Rs.18.85 per share respectively during fiscal
2008.
Cash Flow Statement
The following table summarizes our
statements of cash flows:
(Rs. in million)
Fiscal 2009 Fiscal 2008
Cash Flows from:
- Operating Cash Profit 1,917.7 2,301.2
- Changes in Working (1,632.6) (812.0) Capital
- Net Direct Taxes Paid (235.2) (336.5)
- Operating Activities 49.9 1,152.6
- Investing Activities (1,261.9) (4,270.8)
- Financing Activities 1,571.3 2,109.0
Net Cash Flows 359.3 (1,009.2)
Cash Flow from Operating Activities: The
liquidity position of the Company remained
almost constant with just 16.7% decline in
Operating Cash Profit during fiscal 2009 to
Rs.1,917.7 million as compared to Rs.2,301.2
million during fiscal 2008.
The net cash from operating activities
declined by 95.7% during fiscal 2009
primarily on account of increase in
inventories, trade and other receivables and
decline in current liabilities.
Cash Flow from Investing Activities: Net
cash used in investing activities amounting
to Rs.1,261.9 million was primarily used for
acquiring fixed assets for various ongoing
expansion/ new projects and loans/
investment in subsidiaries/joint ventures
during the year under review.
Cash Flow from Financing Activities: The
Cash Flow from Financial Activities had
declined by 25.5% to Rs.1,571.3 million,
which basically consists of funds raised by
way of long term / working capital loans to
fund various ongoing projects / working
capital requirement.
Consolidated Financial Statements
The consolidated net turnover of the
Company as a group has been Rs.7,881.7
million during financial year 2008-09 as
compared to Rs.8,413.4 million during
financial year 2007-08.
The consolidated EBITDA was Rs.2,473.0
million for fiscal 2009 as compared to
Rs.2,175.0 million for fiscal 2008. On
consolidated basis, the Company suffered
a loss before tax of Rs.866.7 million for fiscal
2009 as against profit before tax of Rs.1,876.0
million for fiscal 2008, in line with the
profitability on stand-alone basis.
The consolidated PAT also turned to negative
at Rs.659.9 million for fiscal year 2009 from
positive of Rs.1,289.8 million for fiscal 2008.
The Company registered EBITDA of Rs.2,444.6 million for fiscal 2009 as compared to Rs.2,177.6 million for fiscal 2008. The EBITDA margin was 31.6% during fiscal 2009 as against 26.2% during fiscal 2008.
Panacea Biotec • Annual Report 2008-0937

Despite all hue and cries about financial turmoil across the globe in recent times, Indian CRAMS with their ready infrastructure and R&D capability in hand stands strong to deliver better growth.
Opportunities and OutlookIndia accounts for over one-third of drug
master files (DMFs) in biggest market, viz.
US and ranks 2nd in approved Abbreviated
New Drug Applications (ANDAs) with a major
share of 30% of total approvals in US.
Despite all hue and cries about financial
turmoil across the globe in recent times,
Indian Contract Research and Manufacturers
(CRAMS) with their ready infrastructure and
R&D capability in hand stands strong to
deliver better growth.
India has the highest number of US
FDA approved plants outside the US.
Pharmaceutical production costs in India are
almost 50% lower as compared with western
nations.
Cost of conducting clinical trials in India is
also around 50-60% lower than the cost in
the US. Hence, global Pharma Innovators
who are already facing tremendous pressure
to protect their profitability are focusing
on cost rationalization activities and are
switching for outsourcing facilities from India
which would boost the earning potential of
Indian CRAMS.
The Indian Pharmaceutical sector is emerging
as one of the major contributors to Indian
exports with export earnings rising from a
negligible amount in early 1990s to Rs.291
billion (US$7.24 bn) by 2007-08. The exports
have grown at a CAGR of 17.8% during the
five-year period 2003-04 to 2007-08.
At present, India is among the top 20
pharmaceutical exporters world-wide. As per
industry estimates, pharmaceutical exports
will continue to grow at a CAGR of 18.5%
between 2008-09 and 2011-12.
SWOT Analysis
Strengths:
• Cost competitiveness
• Well Developed industry with strong
manufacturing base
• Third largest English speaking scientific
and technical manpower in the world
• Strong marketing and distribution
network.
Weakness:
• Highly fragmented industry
• Low investments in innovative R&D
• High Price Regulation
• Production of spurious and low quality
drugs
• Strong linkages between industry and
academia is lacking
Opportunities:
• Significant export potential
• Marketing alliances with MNCs to sell
their products in domestic market
• Opening up of the health insurance
sector
• Potential for developing India as a centre
for international clinical trials.
• Niche player in global pharmaceutical
R&D.
• Increased expenditure on healthcare
due to inter-alia, the ageing population,
emergence of “life-style” drugs, a shift
to newer and more expensive drugs, an
increase in therapeutic coverage (i.e. new
drugs for diseases that previously could
not be treated).
• Innovation in Biotechnology
• Emerging geographical markets
• Huge unmet need for medication.
• Rapidly increasing global population of
seniors and obese patients leading to
higher risks for cardiovascular diseases,
certain types of cancer, diabetes and
arthritis.
Threats, Risks and Concerns
Risks, challenges and threats are inherent
in any type of industry and needs to be
mitigated through well planned strategies.
The major risks associated to the industry as
a whole are as under:
Panacea Biotec • Annual Report 2008-0938

• Global meltdown – The recent global
meltdown has resulted in lower
investments both in existing business
and new drug research. However, this has
not impacted your Company much.
• Pricing pressure imposed by DPCO
• Foreign Exchange fluctuations due to the
unprecedented international currency
imbalances in the aftermath of the global
financial crisis.
• Increased competition from low cost
manufacturing base such as China, Korea
and Taiwan.
• FDA Compliance – Rising audit burdens,
inspections and fines
• Risk of Product failure
Apart from the above, there are a few risk
factors that are relevant to the Company’s
operations and business. While the Company
takes effective measures to minimize or
eliminate the impact of these risks on its
business performance, they nonetheless
exist.
Some such risks, challenges or threats are
outlined below:
• The Company operates in a highly
regulated industry and must comply with
a broad range of dynamic regulatory
controls.
• In an industry where R&D is of critical
importance, the Company faces a risk
of all R&D initiatives not leading to
commercially viable and successful
products.
• Patent challenges or delay in receipt of
regulatory approvals could delay product
launch in key markets. Moreover, failure
to obtain regulatory approval for new
drugs under development could affect
long term business opportunities.
• The Company has several joint ventures
and collaborations with varied partners.
Any adverse developments in such
JVs and collaborations may impact the
Company.
• The Company also faces competition
from other players in the industry.
• Delay in approvals from regulatory
agencies in various international markets.
Apart from these, other risks faced by the
Company include rise in input costs, rise
in interest rates, loss of key personnel,
exchange rate fluctuations, environmental
liabilities, tax laws, litigation, labour relations
and significant changes in the global political
and economic environment.
Way Forward:
With a number of countries in recession
and drugs becoming almost a necessity
and Indian drug companies being generic
manufacturers, export growth is unlikely to
fall.
Domestic growth is expected to remain
healthy especially with the Government
expected to open more Jan Aushadhis (a
new low-priced medicine store chain). The
outbreak of swine flu is also expected to aid
the sales growth of Indian drug companies.
Further, this industry has witnessed a
tremendous growth in consumer spending
on healthcare and is expected to continue
the same.
There is no doubt about the capacity of
Indian pharmaceutical sector in taking the
big leap forward. Therefore, with the rise in
disposable income, tremendous growth in
exports, edge in CRAMS, stunning interest of
global investors in Indian pharma and large
number of USFDA approved plants, Indian
pharmaceuticals industry’s growth is vast
and is expected to materialize soon.
With the rise in disposable income, tremendous growth in exports, edge in CRAMS, stunning interest of global investors in Indian pharma and large number of USFDA approved plants, Indian pharmaceuticals industry’s growth is vast and is expected to materialize soon.
Panacea Biotec • Annual Report 2008-0939

• Global launch of a NCE of herbal origin in GI segment.
• Launch of Vaccine for Swine flu (H1N1)
• Launch of organ transplantation products in ICH regions and key emerging markets.
• Launch of drug delivery based products in anti-cancer, CVD, GI and Pain Management therapeutic segments in key markets across the world.
• Diversification in related healthcare segment.
• Launch of new combination and other Vaccines currently under development for pediatric and adults.
• Supply of anti-TB and ARV products to WHO/UNICEF.
• Launch of biosimilars
• Global Launch of NCEs and NBEs.
• Launch of thermostable vaccines.
• Potential supply of Anthrax Vaccine to US for national stockpiling program.
• Expansion of healthcare segment.
Short-term < 2 years Medium-term 2-5 years Long-term > 5 years
In addition to above identified growth factors, the Company will continue to explore in-
licensing of technologies/products from national/international research agencies/institutions
to fasten its growth strategy
Future Growth DriversPanacea Biotec aims to become a leading
global research based health management
company with an established leadership in
niche therapeutic areas. The Company has well
laid strategy for its future growth with clearly
identified growth drivers to sustain and boost
its revenues and profitability over the short,
medium to long term. The key growth drivers
are as under:
Corporate Social ResponsibilitySafety, Health and Environment Protection
Panacea Biotec undertakes all its operations
with a high concern for safety, health
and environment and is committed to
maintaining high standards in these areas.
Substantial investments have been made
in setting up Effluent Treatment Plants and
in developing a “Green Belt” and green
land scapping at the manufacturing sites at
Lalru & Baddi to prevent possible adverse
environmental impact on the community.
The vaccine R&D facility has been created
with classified laboratories including BL-3
facility for carrying out certain R&D activities
which require containment. All personnel
working in R&D are vaccinated as per the
Vaccination Policy. Bio-waste is disposed
off as per the bio-waste management
system. All the bio-safety measures in R&D
are periodically reviewed by Bio-safety
Committee.
The Company has installed Modern Fire
Hydrant System with sprinkler system and
smoke detection & sensing devices at its all
major facilities, for an early detection and
extinguishing of accidental fire. Surprised
mock fire-fighting drills are also undertaken
to create awareness amongst the employees
to meet any challenge which may arise out of
such incidents.
Regular training is also provided to the
Company’s employees about the importance
of safety in day-to-day life in general
and work in particular. The integration
of environment friendly measures and
cleaner production practices in the business
process has resulted in better efficiency of
operations.
The key growth drivers during short term inter-alia, include global launch of a NCE of herbal origin in GI segment, launch of Vaccine for Swine flu (H1N1) and launch of organ transplantation products in ICH regions and key emerging markets.
Panacea Biotec • Annual Report 2008-0940
Social Responsibility
Panacea Biotec works closely towards the
development of society, in line with its
philosophy of creating happier and healthier
society. Health, education, disaster relief and
patient awareness have been identified as
the areas of priority. The emphasis has been
to provide assistance on a need basis, and
that too, assistance at a local level.
The Company is regularly providing financial
assistance/ sponsorship for pursuing post
graduates/ doctorate studies, attending
International Conferences and carrying
out Research Projects being undertaken by
Research Associates in various Institutes &
Universities.
The Company regularly takes initiatives
towards fulfilling its corporate social
responsibility including:
• Patient Home delivery for Transplant
drugs.
• Donation of life saving drugs to hospitals
as per their need.
• Transplant Fortnight - Patient awareness
activities spread across India covering
72 Organ Transplant centers and
drawing more than 3500 patients. Major
emphasis has been on ways and means
to improve the Post-transplant life of
transplant recipients
• Organized a symposium on “Challenges
in Prevention and Management of
Dengue” at Delhi, which was well
attended by Doctors, experts on this
field and media personnel, with a view
to provide a global snap shot of Dengue
to the medical fraternity and facilitate
deep insights about prevention and
management of Dengue.
• Organized various renal function
detection camps as part of the awareness
towards prevention of Chronic Kidney
Disease on World Kidney Day.
• Diacar SBU was vigorously involved in
spreading awareness and facilitating
detection for diabetes and neuropathic
complications of diabetes through
regular diabetes detection and
neuropathy screening initiatives.
• The company uses its BMD machines
to conduct highly subsidized tests
to measure bone mineral density of
patients for facilitating early diagnosis of
osteoporosis, which not only has a huge
morbidity burden but also is a leading
cause of death in older patients due to
hip fractures. In last 12 months, Panacea
Biotec has screened more than 1 lac
patients.
• On the occasion of ‘World Piles Day‘
on November 20th, the Company
conducted 145 Piles Detection Camps
across geographies in India with a view
to facilitate piles detection across all
strata of patient population and to bring
awareness for piles, which is highly under
diagnosed in India.
• One of the first Indian companies to
successfully run a month long Breast
Cancer Awareness Program to create
awareness on Importance of Early
Detection in Breast Cancer.
• To keep pace with the rapidly advancing
field of Oncology, 3 therapy specific
symposiums were conducted on Breast
Cancer, Lung Cancer and Radiation
Oncology.
Doctor’s Day: Continuing the gesture of
showing it’s gratitude towards the medical
fraternity, your company wished all the
doctors a happy Doctor’s Day on 1st July.
Messages of good wishes from the Chairman
Mr. Soshil Kumar Jain for the doctors were
released through Newspapers, SMS as well as
FM Radio.
The patients were also encouraged to
show their gratitude towards their doctors
The Company is regularly providing financial assistance/ sponsorship for pursuing post graduates/ doctorate studies, attending International Conferences and carrying out Research Projects.
Panacea Biotec • Annual Report 2008-0941

by wishing them on the occasion. Many
doctors responded to the message of the
Chairman by sending e-mails and SMS. This
pioneering activity from Panacea Biotec
would strengthen the relationship between
the doctors and the people at large.
CHINH: As in the past, during the current
year, the Company continued to support
CHINH to make a difference in lives of
nomads in foothills of Aravali and began a
tradition of development that must continue.
CHINH is an NGO’s initiative to support
Nomadic communities in generating
livelihood through harnessing their
traditional wisdom, art and culture.
Dedicated to nomads of India, this initiative’s
prime focus is helping future generation of
nomads in creating space for them in civil
society and encouraging them to lead a life
of dignity.
People for Animals: During the year under
review, the Company also supported People
for Animals an NGO based at Delhi to bring
help and hope to thousands of needy
animals around the Country.
Cautionary Note
Certain statements in the “Management Discussion and Analysis” and other sections in the Annual
Report are forward-looking statements. These statements and expectations envisaged by the
management are only estimates in nature and are based on current expectations and forecasts
about future events. Such statements involve known/unknown risks, uncertainties and other
factors and may cause and defer the actual results materially. Such factors include, but are not
limited to, changes in local and global economic conditions, the Company’s ability to successfully
implement its strategies, the market acceptance and demand of the Company’s products and
services, the Company’s growth rates, expansion, technological changes and the Company’s
exposure to market risks. By this nature, these indications and forecasts/projections are only
estimates and actual results could differ from these in future. The Company does not undertake any
obligation to update forward-looking statements to reflect events or circumstances after the date
hereof.
Note: As a result of rounding-off adjustments, the figures/percentages in a column in various sections in the Annual Report may not add up to the total for such column.
Panacea Biotec • Annual Report 2008-0942

Panacea Biotec • Annual Report 2008-0943
Directors’ Report
Dear Members,
We are pleased to present the 25th Annual Report on business and operations together with the audited financial statements and the auditors’ report of your Company for the financial year ended March 31, 2009. The financial highlights for the year under review are given below:
a growth of 12%. The PBT and PAT for the year under review turned negative at Rs.923.7 million and Rs.690.5 million respectively as compared to profits of Rs.1,903.9 million and Rs.1,331.7 million respectively inter-alia, on account of drastic reduction of exchange rate of Indian Rupee vis-a-vis US dollar from Rs.40.11 per dollar as on 31.03.2008 to Rs.50.72 per dollar as at 31.03.2009, provisioning of unrealized foreign exchange loss of Rs.1,702.6 million on open forward contracts for the unexpired period of contracts and provisioning of Rs.168.0 million on account of permanent diminution of investment (representing 10% stake) in Cambridge Biostability Ltd. (CBL) and of Rs.116.2 million as doubtful on account of Convertible Loan and interest accrued thereon due from CBL.
In terms of revised AS-11, the Company has opted for change in accounting policy in respect of foreign exchange fluctuation difference relating to translation of long term foreign currency monetary liabilities. Consequently foreign exchange fluctuation gain of Rs.131.7 million up to March 31, 2008 and foreign exchange fluctuation loss of Rs.994.7 million during the year under review, has been adjusted to the cost of depreciable asset or transferred to the Foreign Currency Monetary Item Translation Difference Account, depending upon nature of utilization. This has resulted into reduction in losses during the year by Rs.850.1 million.
Nevertheless, the Company was still able to earn operating profit of Rs.1,244.6 million during financial year 2008-09 as against Rs.1,836.7 million during the corresponding previous financial year.
Your Company continues to focus on sustaining growth in emerging markets, cost optimization and efficient management of working capital.
A detailed discussion on operations for the year ended 31st March, 2009 is given in the Management Discussion and Analysis section.
Dividend
In view of non-availability of profits during the year under review, the Board of Directors has not recommended any dividend on the Equity Shares of the Company.
Share Capital
During the year under review, the Issued Equity Share Capital of the Company remained unchanged at
Financial Results
(Rs. in million)
Particulars For the For the year ended year ended March 31, 09 March 31, 08
Net Turnover 7,734.2 8,304.4
Other Income 259.7 371.7
Total Income 7,993.9 8,676.1
Profit before Interest, 2,444.6 2,177.6 Depreciation, Exceptional items & Tax (EBITDA)
Depreciation 705.1 430.0
Financial Expenses 347.4 150.1
Unrealised Foreign 1,750.7 40.5 Exchange Fluctuation Loss
Profit/(Loss) before (639.5) 1,903.9 Exceptional items & Tax
Exceptional item 284.2 -
Profit/(Loss) before Tax (PBT) (923.7) 1,903.9
Provision for Taxation (233.2) 572.2
Profit/ (Loss) after Tax (PAT) (690.5) 1,331.7
Dividend Paid/Proposed - 66.7 on Equity Shares
Tax on Dividend - 11.3
Transfer to General Reserve - 133.1
Balance in Profit & Loss 2,155.2 2,845.7 Account
Basic EPS (Rs.)* (10.3) 20.1
Cash EPS (Rs.)* 30.0 27.0
Book Value per Share (Rs.)* 92.1 104.3
Dividend per Equity Share (Rs.) - 1.0
* Face value Re.1/- per share
Operations Review
During the year ended March 31, 2009, the Company registered net turnover of Rs.7,734.2 million as against Rs.8,304.4 million during the corresponding financial year. The Company registered EBITDA of Rs.2,444.6 million as compared to Rs.2,177.6 million during the corresponding previous financial year, registering
Panacea Biotec • Annual Report 2008-0943
Panacea Biotec • Annual Report 2008-0944
Rs.66.8 million consisting of 66,842,746 Equity Shares of Re.1 each.
Corporate Governance
The Company has duly complied with the provisions of the Corporate Governance Code as prescribed under Clause 49 of the listing agreement with the Stock Exchanges. A separate section on Corporate Governance Report along with a certificate from M/s. Dass Gupta & Associates, Chartered Accountants confirming the level of compliance is annexed and forms a part of the Directors’ Report.
Management Discussion & Analysis
As required by Clause 49 of the Listing Agreement with the Stock Exchanges, a detailed Management Discussion and Analysis Report forms part of the Annual Report.
Subsidiaries
The Company, as on March 31, 2009, has 5 wholly owned subsidiaries (WOS), viz. Best On Health Ltd., Panacea Biotec, Inc., Panacea Biotec FZE, Panacea Biotec GmbH and Rees Investments Ltd. and a subsidiary, viz Umkal Medical Institute Pvt. Ltd., in terms of Section 4(1)(b)(ii) of the Companies Act, 1956. Besides, Radicura & Co. Ltd., Panacea Hospitality Services Pvt. Ltd., Sunanda Steel Company Ltd. & Panacea Educational Institute Pvt. Ltd. are the WOS of Best On Health Ltd.; Kelisia Holdings Limited, Cyprus is the WOS of Rees Investments Ltd. and Kelisia Investment Holdings AG, Switzerland & Panacea Biotec (International) SA, Switzerland are step-down subsidiaries of Rees Investments Ltd. In terms of Section 4(1)(c) of the Companies Act, 1956, these 7 companies are the subsidiaries of the Company.
In terms of the approval granted by the Central Government under Section 212(8) of the Companies Act, 1956, copies of the Balance Sheet, Profit and Loss Account and Reports of the Board of Directors and Auditors of the Subsidiaries have not been attached with the Balance Sheet of the Company. However, these documents will be made available upon request by any investor of the Company/ subsidiary, interested in obtaining the same. As directed by the Central Government, the financial data of the subsidiaries has been furnished elsewhere in the Annual Report. The annual accounts of the subsidiary companies will be kept for inspection by any investor at the Company’s Corporate Office at B-1 Extn./G-3, Mohan Co-operative Industrial Estate, Mathura Road, New Delhi – 110044, India and at the office of the respective subsidiary companies during business hours of the Company.
Joint Ventures
Chiron Panacea Vaccines Pvt. Ltd. - During the year under review, your Company’s Joint Venture Company (JV Company), Chiron Panacea Vaccines Pvt. Ltd. (“CPV”), set-up for marketing of innovative combination and other vaccines in India has launched Hepatitis A vaccine HAVpur, a new generation vaccine with virosome technology in collaboration with Berna Biotech Ltd., Switzerland and the Company’s Injectable Polio Vaccine “PolProtec” and monohib Vaccine (novoHib) in the Indian market. With these launches, CPV has a strong portfolio of innovative paediatric vaccines and in short span has taken significant position at market place. CPV achieved a turnover of Rs.538.4 million and net profit of Rs.41.6 million during the year under review. CPV continues to maintain a significant market share in the pediatric combination vaccines segment in India.
Cambridge Biostability Ltd. - The Company’s another JV Company, Cambridge Biostability Ltd. (CBL), a U.K. based Company, in which the Company acquired 10% stake and also lent a Convertible Loan of £ 1.5 million during earlier years, has gone into Creditors’ Voluntary Liquidation proceedings during current fiscal, due to its adverse financial position.
Associates
Your Company’s Associate Company, PanEra Biotec Pvt. Ltd. is continuing to meet requirement of bulk vaccines and antigen for the manufacture of Hepatitis B and Combination Vaccines by your Company. PanEra has become a specialised company focused on bulk manufacture of vaccines and plans to venture into new product and technologies.
During the year under review, the Company’s associate firm, viz. M/s Lakshmi & The Manager, in which the Company had invested Rs.40.0 million (40% share), has been taken over by a newly formed company, Lakshmi & Manager Holdings Limited. As a result of takeover of the said firm, the Company has been allotted Equity Shares for an amount of Rs.41.3 million in the said company.
Consolidated Financial Statements
As required under clause 41 of the Listing Agreement with the stock exchanges, a consolidated financial statement of the Company and its subsidiaries, joint venture and associates, as prepared in accordance with the Accounting Standard AS-21 on ‘Consolidated Financial Statements’ read with Accounting Standard AS-27 on ‘Financial Reporting of Interest in Joint Ventures’ and Accounting Standard AS-23 on ‘Accounting for Investments in Associates’, as issued
Panacea Biotec • Annual Report 2008-0944

Panacea Biotec • Annual Report 2008-0945
by the Institute of Chartered Accountants of India, is attached herewith and the same together with Auditors’ Report thereon forms part of the Annual Report of the Company.
Listing of Equity Shares / Bonds
The Equity Shares of the Company continue to be listed on National Stock Exchange of India Ltd. (NSE) and Bombay Stock Exchange Ltd. (BSE). The Foreign Currency Convertible Bonds (FCCBs) are listed at Singapore Stock Exchange. The annual listing fees for the year 2009-10 have been paid to these Exchanges.
Public Deposits
During the year under review, your Company has not invited or accepted any deposits from the public pursuant to the provisions of Section 58A of the Companies Act, 1956 and no amount of principal or interest was outstanding in respect of deposits from the public as of the date of Balance Sheet. However, during the year under review, the Company has continued to accept deposits from the Company’s Directors, their relatives, associates and the Company’s employees without inviting deposits from them.
Insurance
The Company’s properties and insurable assets like building, plant & machinery, stocks and upcoming projects have been adequately insured, against major risks. The Company has also taken appropriate product liability insurance policies for conducting clinical trials and for insuring its products (manufactured & sold) with an add on cover of pollution liability and limited unnamed vendor extension liability to cover the risk on account of claims, if any, filed against the company.
Internal Control System
The Company has a sound Internal Control System, which ensures that all assets are protected against loss from unauthorized use and all transactions are recorded and reported correctly. The internal control systems are further supplemented by internal audit carried out by independent firms of Chartered Accountants and periodical review by management. The Audit Committee of the Board addresses significant issues raised by both, the internal Auditors and the Statutory Auditors.
Directors
There was no change in the composition of the Board of Directors of the Company during the year under review.
In accordance with the provisions of the Companies Act, 1956 and Articles of Association of the Company,
Mr. R. L. Narsimhan, Mr. N. N. Khamitkar and Mr. Sunil Kapoor, Directors of the Company, are liable to retire by rotation and being eligible, offer themselves for re-appointment.
A brief resume, expertise, shareholding in the Company and details of other directorships of these directors as stipulated under clause 49 of the Listing Agreement with the Stock Exchange forms part of the Notice of ensuing Annual General Meeting.
The Board recommends the appointment of Mr. R. L. Narsimhan, Mr. N. N. Khamitkar and Mr. Sunil Kapoor.
Auditors
As per the provisions of the Companies Act, 1956, M/s. S.R. Batliboi & Co., Chartered Accountants, hold office as Statutory Auditors of your Company till the conclusion of the ensuing Annual General Meeting and have shown their willingness to be re-appointed as the Auditors of the Company.
Based on the recommendation of the Audit Committee, the Board of Directors of the Company proposes the re-appointment of M/s. S.R. Batliboi & Co., Chartered Accountants, as the Auditors of the Company. Further, as required under Section 224(1B) of the Companies Act, 1956, they have confirmed that the said appointment, if made, will be within the limits as prescribed under the provisions thereof.
Auditors’ Report
With regard to the matters of emphasis and observations contained in the Auditors’ Report, management’s explanations are given below:
a. Non-provision of proportionate premium on redemption of ‘US$ 50 million Zero Coupon Convertible Bonds due 2011’ amounting to Rs.470,992,269: The Board of directors are of the opinion that since the bonds are redeemable only if there is no conversion of bonds earlier, the probability of which cannot be presently ascertained, hence, the payment of premium on redemption is contingent in nature, the outcome of which is dependent upon uncertain future events. Therefore, the same has been disclosed as a contingent liability. Moreover, in case of redemption, the redemption premium will be offset against the Securities Premium Account, thus having no impact on the Profit & Loss Accounts.
b. Capitalization of expenditure on clinical trials amounting to Rs.123,978,449 for the purpose of registration of Company’s products in US and/or Europe: The expenditure is not towards basic research and there is no experience to suggest that the studies conducted by CRO on
Panacea Biotec • Annual Report 2008-0945

Panacea Biotec • Annual Report 2008-0946
behalf of the Company would lead to or make it difficult for the Company to obtain regulatory approval. Hence, the management believes that these products would be commercially viable and there is no reason to believe that there is any uncertainty that may lead to not securing registration for the products from regulatory authorities in US and/or Europe.
c. Payment of managerial remuneration of approximately Rs.38,169,706 for the current year in excess of limits prescribed as per Part II of Schedule XIII to the Companies Act, 1956, without Central Government approval: The Company had adequate profits for past many years and thus has been paying remuneration to its managerial personnel as per shareholders approval within overall limits as specified under the Companies Act, 1956. However, since in view of the reasons explained elsewhere in this Report the Company has incurred losses during the year under review, the managerial remuneration paid during the year amounting to Rs.63,035,463 exceeded the limits prescribed under the Act by Rs. 38,169,706. The Company has sought approval of the Central Government for protection of such remuneration.
d. Slight delay in deposition of Value Added Tax (VAT), Employees’ State Insurance (ESI) and Service Tax in few cases: The amount involved was not significant and the said delays were due to normal operational difficulties. The total amount of such VAT, ESI and Service Tax was Rs.2,163,478, Rs.379,832 and Rs.436,256, respectively only and the Company had already deposited the said amount. Interest amounting to Rs.447,675 was also paid in respect of delay in payment of Service Tax for the delayed period.
Further, with regard to the matter of emphasis and observation contained in the Auditors’ Report on the Consolidated Financial Statement as regards Unaudited Annual Accounts of Subsidiaries – Panacea Biotec GmbH, Germany, Kelisia Investment Holdings AG, Switzerland and Panacea Biotec (International) SA, Switzerland, though the Annual Accounts of these subsidiaries were prepared by their respective Board of Directors but the audit thereof could not be completed till the date on which the Company’s Accounts were finalised. The audit exercise had since been completed and there is no change in the assets, revenues and cash flows thereof.
The notes to the accounts and other observations, if any, in the Auditors’ Report are self-explanatory and, therefore, do not call for any further comments.
Cost Auditors
Pursuant to the provisions of Section 233B of the
Companies Act, 1956, M/s J.P. Gupta & Associates, Cost Accountants, have been appointed as the Cost Auditors to conduct the audit of the Company’s Cost Records in respect of formulations for the year ended 31st March, 2009 with the approval of the Central Government. The cost audit is under process and the Company will submit the Cost Auditors’ Report to the Central Government in time. M/s J.P. Gupta & Associates, have also been appointed by the Board as the Cost Auditors for the financial year 2009-10 subject to the approval of Central Government.
Disclosures under Section 217 of the Companies Act, 1956
Except as disclosed elsewhere in the report, there have been no material changes and commitments, which can affect the financial position of the Company between the end of financial year and the date of report.
As required under Section 217(2) of the Companies Act, 1956, the Board of Directors inform the members that during the financial year there has been no material changes, except as disclosed elsewhere in this report:
• in the nature of Company’s business,
• in the Company’s subsidiaries or in the nature of business carried out by them,
• in the classes of business in which the Company has an interest.
Energy Conservation, Technology Absorption & Foreign Exchange
Particulars required under Section 217(1)(e) of the Companies Act, 1956, read with the Companies (Disclosure of Particulars in the Report of Board of Directors) Rules, 1988, regarding conservation of energy, technology absorption and foreign exchange earnings & outgo, is given in Annexure A, forming part of this Report.
Information regarding Employees
The information required to be furnished under section 217(2A) of the Companies Act, 1956, read with Companies (Particulars of Employees) Rules,1975 as amended, the names and other particulars of employees covered under these Rules are set out in Annexure B, forming part of this Report.
Directors’ Responsibility Statement
The Directors hereby confirm:
i. that in the preparation of the annual accounts, the applicable accounting standards had been
Panacea Biotec • Annual Report 2008-0946

Panacea Biotec • Annual Report 2008-0947
followed along with proper explanation relating to material departures;
ii. that the directors had selected such accounting policies and applied them consistently and made judgments and estimates that are reasonable and prudent so as to give a true and fair view of the state of affairs of the Company at the end of the financial year and of the profit or loss of the Company for that period;
iii. that the directors had taken proper and sufficient care for the maintenance of adequate accounting records in accordance with the provisions of the Companies Act, 1956 for safeguarding the assets of the Company and for preventing and detecting fraud and other irregularities; and
iv. that the directors had prepared the annual accounts on a going concern basis.
Acknowledgments
Your Directors take this opportunity to express sincere thanks to the medical fraternity and patients for their
continued co-operation, patronage and trust reposed on the Company and its products. The Directors place on record their gratitude to the government, other statutory bodies, our strategic partners, business associates, banks, financial institutions and shareholders for their assistance, co-operation and encouragement they extended to the Company.
Your Directors also place on record their sincere appreciation for significant contribution made by the employees at all levels through their dedication, hard work and commitment and look forward to their continued support and unstinting efforts in ensuring an excellent all round operational performance. It is this unity of purpose that breeds success and your Directors look forward to receiving similar support and encouragement from the larger Panacea family in the years ahead.
For and on behalf of the Board
New Delhi Soshil Kumar Jain
30th July, 2009 Chairman
I. Conservation of Energy
1. Energy Conservation measures taken
The Company accords highest priority to energy conservation and is committed for energy conservation measures including regular review of energy consumption and effective control on utilization of energy. The Company had devised its production lines and other facilities keeping in view the objective of minimum energy losses.
The following are the major energy conservation measures implemented during the financial year 2008-09 with an objective to substantially reduce power consumption:
• Stoppage of Chilled Brine Refrigeration plants during night shifts at Pharma Formulation Plant, Baddi and maintaining the required Facility conditions by running them in day shift operations. Also increased Cut off Set point temperature.
• Increased Chilled Water Evaporator temperature and reduced Air Compressor Working Pressure for Vaccine Formulation Plant, Baddi to reduce the Power consumption.
• Installed Variable Frequency Drive (VFD) on Chilled Water Transfer Pump of Refrigeration Plant at Pharma Formulation Plant, Baddi.
• Discontinued the operation of Primary Chilled water circulation pumps of Refrigeration plants by taking Secondary Chilled water transfer pumps also in the Primary Circuit by carrying out the Chilled water line modification.
• Stoppage of Electrical Heaters as well as Hot Water Circulation to Dehumidifiers of Pharma Formulation Plant, Baddi by maintaining the required RH (Relative Humidity) with the help of Chilled Brine only.
• Operating Hours of AHUs have been optimized at various sections at Lalru and Baddi.
• Started stopping of hot water circulation pump for HVAC operations during night hours at Vaccine Formulation Plant, Baddi.
• Started stoppage of Cooling Tower dedicated pumps to Air Compressors and Diesel Gen Sets and the same was optimized with Cooling Tower pumps of
Annexure to the Directors’ Report
Annexure A
Statement of Particulars pursuant to the Companies (Disclosure of Particulars in the Report of Board of Directors) Rules, 1988.
Panacea Biotec • Annual Report 2008-0947

Panacea Biotec • Annual Report 2008-0948
Refrigeration plants of Pharma Formulation Plant, Baddi.
• Optimized Air Compressor running hours at Vaccine Block-1, Lalru by providing lower capacity Air Compressor during Night Hours.
• Optimized Hot Water circulation by replacing Pump set with lower capacity at Vaccine Block-2, Lalru.
• Optimized Lighting circuits at Lalru.
• Provided Timer Circuit to Animal House Exhaust Air Units, Lalru Plant.
• Started stopping Raw Water Boosting Pump during night hours at Lalru Plant.
• Installed Temperature controllers for all Cooling Tower Fans with respect to Wet Bulb Temperatures.
• Installed Level Controller on Soft Water storage tank to prevent the overflow of water and atomized the Soft Water Pump.
• Started stoppage of Split Air Conditioning Units during winter season at various sections in Vaccine Formulation Plant at Okhla, New Delhi.
• Optimized running hours of AHUs of non critical areas of Okhla Vaccine Formulation plant.
• Optimized running hours of Machine Room AHUs of GRAND, Mumbai.
• Optimized Lift working hours at GRAND, Mumbai.
• Installed Motion sensors for lighting at all Toilets of GRAND, Mumbai.
• Increased the Power Factor across all locations to reduce the Power Consumption.
• Reduced Boiler working pressure and Compressed Air Pressure at vaccine facility at Okhla.
• Reusing the R.O. reject water for non critical use like feed for cooling towers.
• Incorporated temp. controller in CT fan for the Chiller.
• Reduced/replaced the GLS, flouroscent tube lights with CFL at all locations.
• De-scaled indoor & outdoor units of AC’s so as to reduce the electrical load.
• Modified the needles of Vial washing M/c OPV & Line III reducing the consumption of DM water.
• Inbuilt battery charger installed in the D.G. sets.
• Introduction of light control device
for controlling street lamps so that it automatically gets off in the morning.
• Installed PRV for oxygen generation plant and there running of only one air compressor in place of 2 Air Compressors.
• Modified the Brine water lines and removed the primary pump concept.
• Effective running of Air Compressor and removed all air leakages.
• Throttling of Chilled water discharge valves and decreased the motor loads.
• Ensure switching off all corridors lights in day time.
• Close monitoring of FO consumption in Boilers and reduced its working pressure
• Close Monitoring of HSD consumption for DG
• Hot water system replaced the 3.7 KW motor with 2.2 KW for HVAC system
2. Additional Investments/ Proposals, if any, for reduction of Energy Consumption
Continuous efforts are being made to further reduce the expenditure on power & fuel in the time to come. Continuous Energy Conservation Campaign is going on at all locations and based on that steps are being taken related to optimization in existing as well as new system implementation. Many Techniques have already been introduced during the financial year 2008-09:
• Modification of Cold rooms so as to increase the efficiency of the cold rooms & to reduce the electrical load.
• Installation of the ETP to comply the statutory compliance against Pollution control board norms.
• New central dispatch facility to carry out the dispatch activities includes secondary packing material storage.
Further, a few new Energy Conservation technologies including Earth Air Tunnel, Thermal Refrigeration Storage, Side Stream Cooling Tower Water Cleaning on-line Technology etc. are in pipeline for future implementation.
3. Impact of measures taken and impact on cost of production of goods
The energy conservation measures indicated above have helped the Company to restrict the impact of increase in the cost of energy thereby reducing the cost of production of goods to that extent.
Panacea Biotec • Annual Report 2008-0948

Panacea Biotec • Annual Report 2008-0949
The particulars of consumption of energy, are given below:
Current Year Previous Year
A. Power and Fuel Consumption 1. Electricity (a) Purchased Units (Nos.) 15,011,387 8,624,456 Total Amount (Rs.) 67,830,374 38,257,058 Rate/Unit (Rs.) 4.52 4.44 (b) Own generation (i) Through Diesel Generator Units (Nos.) 3,397,584 2,827,525 Unit per litre of Diesel Oil 3.49 3.49 Cost/Unit (Rs.) 8.91 8.07 (ii) Through Steam/Turbine Generator Nil Nil Units (Nos.) Unit per litre of Fuel Oil/ Gas Cost/Unit 2. Coal Nil Nil Quantity (tonnes) Total Cost Average Rate 3. Furnace Oil Quantity (Litres) 505,115 - Total Amount 11,824,571 - Average Rate/litre 23.41 - 4. Others/Internal generation Nil Nil Quantity Total Cost Rate/Unit
B. Consumption per unit of production Tablets Production (Nos. in thousand) 504,389 420,871 Electricity Consumption (Units per thousand) 4.52 3.67 Capsules Production (Nos. in thousand) 61,027 51,414 Electricity Consumption (Units per thousand) 24.33 66.55 Syrups Production (in litres) 283,921 246,057 Electricity Consumption (Units per thousand) 0.76 1.41 Gels Production (in kilograms) 23,475 65,586 Electricity Consumption (Units per thousand) 2.62 3.05 Vaccines Production (No. of vials in thousand) 50,554 69,507 Electricity Consumption (Units per thousand) 65.44 46.52 Pre-filled Syringe (PFS) Production (Ml. in thousand) 1,680 - Electricity Consumption (Units per thousand) 244.15 - Granules Production (Packs in thousand) 17,639 - Electricity Consumption (Units per thousand) 17.07 -
FORM A
FORM B
II. Technology Absorption
Form for disclosure of particulars with respect to Technology AbsorptionThe areas of research being pursued by the Company include:• Development of novel preventive & therapeutic
vaccines, novel therapeutic peptides and therapeutic fully human monoclonal antibodies.
• Development of advanced drug delivery technologies.
Research & Development (R&D)
1. Specific areas in which R & D carried out by the CompanyThe Company is a research focused & IPR oriented company whose one of the end objectives is innovation and development of patentable products and technologies.
Panacea Biotec • Annual Report 2008-0949

Panacea Biotec • Annual Report 2008-0950
• Discovery & synthesis of new chemical and biological entities.
• Development of recombinant clones for biosimilars.
• Product development for different categories of drugs.
2. Benefits derived as a result of above R&D• Improved product quality leading to customer
satisfaction• Vaccine against bioterrorism • Safe and environment friendly process • Novel drug delivery products• Competitively priced products• Waste minimisation• Grant of Product/Process Patents• Import substitution leading to lower cost of
goods• Enhanced global presence• Export of Quality Products
3. Future plan of ActionThe Company will continue to focus its Research &
Technology absorption, adaptation and Innovation
1. Efforts, in brief, made towards technology adaptation and innovation: The Company has built a strong R&D base to support its business segments, vaccines, formulations and biopharmaceuticals. It has five highly sophisticated ultra-modern R&D centers with 391 employees including 261 qualified and experienced scientists for its various research projects. The core area of research & development includes new Vaccine Development, Biopharmaceuticals, proteins, peptides, monoclonal antibodies, Novel Drug Delivery Systems projects, Advanced Drug Delivery System projects and Drug Discovery (small molecules), in compliance with international regulatory standards.
The Company has developed indigenous technologies in respect of various products being manufactured by it and at present working on several novel products and technologies. Further, the Company has made in-licensing arrangements for technologies and development of (a) Vero cell adapted Japanese encephalitis (JE) Vaccine, (b) Peptide based product for generation of hair follicles and hair growth, and (c) Recombinant Chimeric Dengue Vaccine, during earlier financial years. The technology in-licensed for JE Vaccine, has been further modified significantly at our research center to yield a commercially viable and safer product. The candidate vaccine is in trial stages of development and should enter preclinical/clinical development by next year.
2. Benefit derived as a result of the above efforts, e.g., product improvement, cost reduction, product development, import substitution, etc.: Competitive products, Product quality improvement, Product Development and Import Substitution and with in-licensing arrangements, the Company will be able to commercialize these products in domestic and international markets.
3. In case of imported technology (imported during the last 5 years reckoned from the beginning of the financial year), following information may be furnished;
Technology imported Year of Has technology If not fully absorbed, areas where this import been fully has not taken place, reasons thereof absorbed and future plan(s) of action
(a) (b) (c) (d)
1. Technology for use of 2004-05 No The technologies are being worked upon. The process peptide based products for the scale-up production of hair growth peptide has for generation of hair been optimized. A pre-clinical toxicological study follicles and hair growth has been planned. 2. Tetravalent Dengue 2006-07 No The technologies are being worked upon. A suitable cell Virus Vaccine line for the assay and amplification technology of recombinant chimeric Dengue virus has been prepared. Appropriate Dengue viruses have been amplified and immunogenicity of candidate virus has been planned.
3. Technology for 2007-08 Yes NA manufacture of Hep B Antigen & Bulk Vaccines
Development activities for growing the revenues & profitability, inter-alia, in the following areas:• Development and improvement in existing
conjugation technology for better yield and quality.
• Drug Discovery Research• Advanced Drug Delivery Research• Research for development of novel preventive
& therapeutic vaccines, therapeutic fully human monoclonal antibodies and therapeutic peptides.
• Development of thermostabilised vaccines.• Natural Products Research• Chemical Research & Development
4. Expenditure on R&D (Rs. in million) 2008-09 2007-08a) Revenue 500.9 410.5b) Capital 578.4 666.2c) Total 1,079.3 1,076.7d) Total (as a % of net sales) 14.0% 13.0%
Panacea Biotec • Annual Report 2008-0950

Panacea Biotec • Annual Report 2008-0951
III. Foreign Exchange Earnings and Outgo
1. Activities relating to exports
The total export turnover of the Company was Rs.5,612.9 million (including deemed exports of Rs.3,708.4 million) during the year under review as against Rs.6,442.8 million (including deemed exports of Rs.5,797.3 million) during fiscal 2008.
The Company is supplying Oral Polio and Combination Vaccines to various countries through UNICEF against its global tenders and achieved an export turnover of Rs.1,478.4 million by way of supplies of vaccines to various countries including Afghanistan, Central Africa, Kenya, Sudan, Myanmar, Namibia, Nigria, Pakistan, Russia, Tanzania, Uganda Uzbekistan through UNICEF, as against Rs.309 million during the previous year, achieving an excellent growth of more than 370%.
As regards formulations, the Company is continuously expanding its global aspirations by improving its international marketing efforts into various markets across the globe and is currently exporting its branded formulations in CIS countries, Asia, Eastern Europe and African region. Today the Company’s products are available to people in various countries across the globe.
The export turnover of formulations during fiscal 2009 increased by 27% to Rs.426.0 million from Rs.336.5 million during fiscal 2008.
The major markets continue to do well inspite of recessionary trends in the later part of the year. In addition to this, successful commercialization happened in newer markets across Central America, Africa and Asia. The exports to Russia & Thailand have shown excellent growth of 77% & 53%, respectively over the previous fiscal.
2. Initiatives taken to increase export
The year under review marked the achievement of landmark initiatives & accolades for the Company’s international formulations business.
The company has identified Organ Transplantation, Nephrology, Metabolic Disorders, Pain management, Oncology, Gastro-intestinal, Anti-infectives products as major thrust areas for the future. The Company has been adopting a strategy of increasing its international brand image and is rapidly expanding to reach out to more and more countries. It has also obtained brand registration for various brands in different countries and is actively exploring opportunities for launching as well as licensing out some of its patented products for manufacture/ marketing in Europe, North America, Latin America, etc.
The Company is also currently in the process of registering its products in key new markets including US, European Union, Switzerland, South Africa, Turkey, Brazil, Mexico, Columbia, Venezuela, Chile, Philippines & Malaysia.
3. Development of new export markets for products and Export Plans
With a view to increase opportunities, the efforts on international marketing have been further intensified. The Company has been adopting a strategy of increasing its international brand image and is actively exploring opportunities for launching as well as licensing out some of its patented products for manufacture/ marketing in key new markets including US, European Union, Switzerland, South Africa, Turkey, Brazil, Mexico, Columbia, Venezuela, Chile, Philippines & Malaysia.
The company is also poised to make inroads into global vaccine markets by deploying specialized team for its Vaccine Business in emerging (ROW) markets. The Company has started establishing its ground work in various potential vaccine markets & also obtained registration in Nepal & Pakistan. The Company is all set to launch GeneratioNext vaccines in the emerging markets in years to come.
4. Total foreign exchange earned and used (Rs. in million)
2008-09 2007-08
Foreign Exchange Earned F.O.B. value of Exports 5,589.0 6,414.1 (including deemed export of Rs.3,708.4 million (Previous Year Rs.5,797.3 million)) R & D Services (Know-how) income 1.7 3.9 Interest on Exchange Earners’ Foreign Currency Deposits - 0.6 Interest received on loan from 16.9 2.0 Joint Venture Company Interest accrued but not due on 28.9 - loan from subsidiary company Total 5,636.5 6,420.6
Foreign Exchange Used Raw Materials & Packing 4,571.3 2,743.0 MaterialsCapital Goods 457.2 193.1 Know-how Fee 12.8 8.6Royalty 0.0 0.3Interest 206.2 59.4Professional & Consultation Fees 54.7 29.8Other Expenses - Patents, Trade marks & 26.3 23.4 Product registration - Advertising and Sales Promotion 5.3 33.2 - Printing & Stationary 0.1 3.3 - Commission on Sales 65.8 44.7 - Market Research 30.3 - - Others 39.6 27.5Total 5,469.6 3,166.3
For and on behalf of the Board
New Delhi Soshil Kumar Jain30th July, 2009 Chairman
Panacea Biotec • Annual Report 2008-0951

Panacea Biotec • Annual Report 2008-0952
Annexure B
Statement pursuant to Section 217(2A) of the Companies Act, 1956 and the Companies (Particulars of Employees) Rules, 1975 and forming part of the Directors’ Report for the year ended 31st March, 2009.
Notes: 1. Remuneration includes salary, commission on profits, house rent allowance, bonus, Company’s contribution to Provident Fund, Leave Travel Allowance, Medical Assistance and all allowances
paid in cash and monetary value of taxable perquisites wherever applicable and also includes Gratuity/ Retirement Benefit. 2. There was no employee who was employed either throughout the financial year or part thereof, who was holding either by himself or along with the spouse and dependent children 2% or
more of the Shares of the Company and drawing remuneration in excess of the remuneration drawn by Managing Director / Joint Managing Director / Whole-time Director. 3. The terms and conditions of employees at Sl. No. 1 to 5 are as approved by the Board of Directors and Shareholders. The employees at Sl. No. 6 to 34 are paid remuneration as per the policy/
rules of the Company. 4. All the above said appointments are contractual. 5. None of the above employees is related to any of the Directors except that Mr. Soshil Kumar Jain, Mr. Ravinder Jain, Dr. Rajesh Jain, Mr. Sandeep Jain and Mr. Sumit Jain are related to each
other. 6. The nature of duties of Chairman, Managing Director and Joint Managing Directors is as under: Mr. Soshil Kumar Jain, Chairman - Strategic planning, vision and formulation of strategies.
Mr. Ravinder Jain, Managing Director - Overall supervision of day-to-day operations with emphasis on strategic planning and business development. Dr. Rajesh Jain, Joint Managing Director - Overall supervision of day-to-day operations with emphasis on R&D, business development and marketing. Mr. Sandeep Jain, Joint Managing Director - Overall supervision of day-to-day operations with emphasis on finance, international marketing and regulatory affairs.
For and on behalf of the Board
New Delhi Soshil Kumar Jain30th July, 2009 Chairman
S. Name Designation and Remuneration Qualifications Experience Date of Age Particulars of Last Employment No. Nature of Duties (Rs.) (Years) Commencement (Yrs.) Name of Employer, Designation, of Employment Period of Service (Years)
A. Persons employed throughout the Financial Year ended 31st March, 2009, who were in receipt of remuneration for the year in which the aggregate was not less than Rs.2,400,000.
1. Mr. Soshil Kumar Jain Chairman 17,673,850 Pharmacist 54 02.02.1984 76 None, NA, NA2. Mr. Ravinder Jain Managing Director 21,770,429 Matriculate 29 15.11.1984 52 None, NA, NA3. Dr. Rajesh Jain Joint Managing Director 14,688,440 B. Sc., PGDBM & 25 15.11.1984 45 None, NA, NA Advanced Mgmt. Diploma in Market Research, Ph.D.4. Mr. Sandeep Jain Joint Managing Director 14,688,440 B. Com 24 15.11.1984 43 None, NA, NA5. Mr. Sumit Jain Director - Operations & Projects 3,520,582 B. Com, MBA 6 16.05.2003 28 None, NA, NA6. Mr. Narayan B. Gad Chief Executive 7,950,003 B. Sc, D. Pharma, MBA 33 26.10.2005 58 Nicholas Piramal India Ltd. Formulations (Marketing) President Mktg. & Org. Dev., 4 years7. Dr. V.K. Vinayak President BRC- (R&D) 3,735,453 Ph.D., M. Sc, FICAI, 38 01.10.2005 66 Dept. of Biotechnology, Govt. of India, FRSTMH (London) Sr. Advisor, 11 years8. Dr. Sanjay Trehan Sr. Vice President - 6,535,395 Ph.D., M.Sc. (H) 21 01.07.2004 50 Dr. Reddy’s Laboratories Ltd., Drug Discovery Research Research Director, 3 years9. Mr. R.K. Suri Sr. V.P. - New Initiative 3,409,552 M.Sc. (Hons) 31 12.11.2007 54 Sanofi Aventis, Sr. Dir.-Bus. Effect., 9 years10. Dr. M. Sitaram Kumar Vice President - 5,589,053 M. Sc, Ph.D. 33 17.06.2005 59 Dr. Reddy’s Laboratories Ltd. Drug Discovery Research Sr. Director, 4.5 years11. Mr. Kallol Chakraborty Vice President (HR) 4,746,091 PG Dip. In Pers. Mgmt., LLB 19 19.11.2007 45 Federal Mogul Goetze (India) Ltd. Director HR, 8 months12. Mr. Sukhjeet Singh Vice President (R&D) 4,136,027 Post Graduate 15 17.08.2006 40 Strides Acrolabs Ltd., VP - Formulations & Development, 1 year13. Dr. Ashok Panwar Vice President - Quality & 3,999,329 M. Sc., Ph.D. 15 01.05.2001 41 Dishman Pharmaceuticals & Chemicals Compliance Ltd., AGM-Q.C., 2 years14. Mr. Kulvinder Sarao V.P. - Audit & Compliance (HR) 3,967,750 PGDPMIR 24 14.01.2005 47 Hero Honda Motors Ltd, DGM-HR, 5 Mths15. Dr. Arani Chatterjee V.P. - Clinical Research 3,942,092 MBBS, M. Phil. 18 24.07.2004 41 Dr. Reddy’s Labs Ltd., Principal Physician, 6 yrs.16. Mr. Sunil K. Bajaj Vice President - Sales & Mkg. 3,688,850 B.Sc. 29 15.09.2004 48 Novartis India Ltd., NSM, 20 years17. Mr. Ganesh R. Kumraj Vice President Bio. Oper. 3,529,921 Post Graduate 21 15.01.1992 42 National Facility for Animal Tissue & Cell, DGM, 3 years18. Dr. Jagattaran Das G.M. (R&D) 3,397,241 M.Sc., Ph.D. 15 01.07.2005 45 Dr. Reddy’s Labs Ltd., Sr. Scientist, 6 years19. Ms. Neeta S. Sanghi Head-Value India Healthcare 4,038,198 B.Sc. (Hons) 24 01.06.2007 50 Nicholas Piramal (I) Ltd. V.P. Dom. Form. Supply Chain, 11 years20. Mr. Syed Sadir Ahmed Head - International 3,424,243 B Pharma, MBA 15 14.01.2006 39 Nicholas Piramal India Ltd.., GM. S&M, Vaccine Business 2 years21. Mr. Karunakar J. Shetty Head of Operations-India 4,963,887 B.Com 24 01.01.2006 50 Nicholas Piramal India Ltd. (Marketing) President Mktg. & Org. Dev., 4.5 years
B. Persons employed for a part of the Financial Year ended 31st March, 2009, who were in receipt of remuneration for any part of the year, at the rate which in the aggregate was not less than Rs.200,000 per month.
22. Dr. Lallan Giri President & Chief Operating 7,752,060 B.S., M.S., Ph.D. 26 01.07.2008 63 Oshiva Enterprise LLC, USA. CEO/ M.D., Officer 3 years23. Mr. S. C. Marwah CEO - Healthcare Venture 3,248,822 MBBS, Dip. Av. PGADHM, MBA 38 16.06.2008 62 Fortis Health Care Ltd., Head Medical Edu. & Facility Planning, 4.5 Months24. Mr. Partha Sarathi De C.F.O and Head IT & BPR 4,702,177 B.Sc. (Econ.), ACA, AICWA 21 02.06.2008 47 Gujarat Glass Ltd., President Finance Glass Group, 2.5 years25. Dr. Goutam Ghosh V.P. - Tech Mgmt Group 2,284,676 M.Tech, Ph.D. 23 02.06.2008 48 The Pearey Lal Group, CEO., 1 year26. Dr. Sanjiv Sharma Vice President-Regulatory 3,389,186 Ph.D. Org. Chem. 20 30.06.2008 43 Orchid Chemicals & Pharma Ltd., VP-RA., Affairs 4 years27. Mr. Abhay N. Lonkar Country Head - India 3,940,026 B.Sc., MMS 20 11.06.2008 49 Unichem Labs Ltd., VP, 5 years28. Dr. S. Mahender Rao Vice President-CRD 1,323,978 Ph.D. - Doctor of Philosophy 13 08.12.2008 43 Orchid Chemicals & Pharma Ltd., Vice President, 4.5 years29. Dr. Amarjit Singh President R&D 1,920,275 M. Pharma, Ph.D. 29 01.03.2005 51 Sun Pharmaceutical Industries Ltd., CSO & EVP (R&D), 2 years30. Mr. Mahesh Shrihari Head - Strategy 1,786,861 B.Pharma, MMS 17 01.07.2008 38 ORG - IMS Research Pvt. Ltd., Kalsekar Manager- Engagement, 11.5 years31. Mr. Govind Pandey V.P.- Pharma Operations 1,728,805 M.Pharma 18 10.05.2007 42 Alkem Labs Ltd, VP Operations, 2 years32. Mr. S. Anuj Readdy Head Sales & Marketing 1,616,563 MBA 12 02.05.2007 36 Novo Nordisk Pharma India Ltd., Mktg. Dir., 10 years33. Dr. Anil Chawla Vice President (R&D) 1,540,021 Ph.D. 22 15.01.1992 41 Bharat Immunological & Biological Corporation Ltd., DGM, 4.5 years
34. Mr. Maheshh Jain G.M. - Accounts, Finance, 391,523 CA, CS 20 04.12.2007 45 Jubilant Organosys Ltd., GM Accounts, Budget & Cost 4.5 years.
Panacea Biotec • Annual Report 2008-0952

Panacea Biotec • Annual Report 2008-0953
1. Philosophy on Corporate Governance The Company’s philosophy on Corporate Governance originates from its belief that attainment of the highest levels of transparency, disclosure, financial controls, accountability and equity are the pillars of any good system of corporate governance. Panacea Biotec is committed to continuously evolving and adopting corporate governance’s best practices in all facets of its operations and in all interactions with its stakeholders including shareholders, employees, consumers, lenders and the community at large.At Panacea Biotec, good Corporate Governance process includes independence, integrity, commitment to values, ethical business conduct and a high degree of transparency directing the intellectual capabilities and moral authority of its independent Board that go a long way in preserving stakeholders trust while maximizing long-term corporate values.
2. Board of DirectorsComposition & size of the BoardPanacea Biotec’s Board consists of an optimal combination of Executive Directors and Independent Non-executive Directors which represents a mix of professionalism, thorough knowledge and experience. The Directors bring in expertise in the fields of human resource development, strategy, management, finance and economics among others. The Board provides leadership, strategic guidance, objective and independent view to the Company’s management while discharging its fiduciary responsibilities, thereby ensuring that the management adheres to high standards of ethics, transparency and disclosure. At present, the Board comprise of 5 (Five) Executive Directors and 6 (Six) Non-Executive Directors. All the Executive Directors are promoter-directors (1 Executive Chairman, 1 Managing Director, 2 Joint Managing Directors and 1 Whole-time Director). The non-executive Directors bring external and wider perspective in the Board’s deliberations and decisions. The size and composition of the Board exceeds the requirements of the Clause 49 of the Listing Agreement (Corporate Governance Guidelines) with the Stock Exchanges.
Board Functioning & Procedure Panacea Biotec’s board is committed to ensuring good governance. Its style of functioning is self-governing. The members of the Board always have complete liberty to express their opinion and decisions are taken on the basis of consensus arrived at after detailed discussion. They are also free to bring up any matter for discussion at the Board Meetings. Panacea Biotec’s Board meets at least once in every quarter to discuss and review the quarterly results and other items of agenda including the information required to be placed before the Board as required under Annexure 1A of Clause 49 of Listing Agreement and additional meetings are held as and when required. Dates for the Board Meetings are decided well in advance and communicated to the Directors. The Chairman of the Board and the Company Secretary discuss the items to be included in the agenda and the agenda is sent in advance to the Directors along with the draft of relevant documents and explanatory notes. During the financial year 2008-09, 5 (Five) Board Meetings were held on 30th April, 2008, 26th June, 2008, 28th July, 2008, 31st October, 2008 (which was originally called on 17th October, 2008 but was adjourned due to lack of quorum) and 29th January 2009.
Attendance of Directors at the Board Meetings & last Annual General Meeting and number of other Directorships & Committee membership as on 31st March, 2009
Report on Corporate Governance
Note: WTD = Whole-time Director, MD = Managing Director, JMD = Joint Managing Director, ID = Independent Director.$ Excludes directorships in Private Limited Companies, Foreign Companies, membership of managing committees of various chambers/bodies/section 25 companies.* Membership in Audit and Shareholders’ Grievance Committees.
Sl. Name of Director Category of No. of No. of Attendance No. of other Directorships$ No. Directorship Board Board at last & Committee Memberships/ Meetings Meetings AGM Chairmanships* held attended Other Committee Committee Directorships Memberships Chairmanships
1. Mr. Soshil Kumar Jain Promoter – 5 5 No 1 - - WTD Chairman2. Mr. Ravinder Jain Promoter – MD 5 4 No 3 1 Nil3. Dr. Rajesh Jain Promoter –JMD 5 3 No - - -4. Mr. Sandeep Jain Promoter –JMD 5 4 Yes 1 - -5. Mr. Sumit Jain Promoter –WTD 5 3 No 1 - -6. Mr. Sunil Kapoor Non–Executive–ID 5 5 Yes 6 - -7. Mr. R.L. Narasimhan - do - 5 4 Yes 1 - -8. Mr. N.N. Khamitkar - do - 5 5 Yes 1 - -9. Mr. Gurmeet Singh - do - 5 0 Yes - - -10. Mr. K.M. Lal - do - 5 4 No 7 5 Nil11. Dr. A.N. Saksena - do - 5 5 Yes - - -
Panacea Biotec • Annual Report 2008-0953

Panacea Biotec • Annual Report 2008-0954
None of the Directors on the Board is a member in more than ten committees and/or acts as chairman of more than five committees across all the companies in which he is a Director.Brief information on Directors proposed for re-appointment
The brief resume, experience and other details pertaining to the Directors seeking appointment / re-appointment in the ensuing Annual General Meeting, to be provided in terms of Clause 49 of the Listing Agreement with the Stock Exchanges, are furnished below:
a) Mr. R.L. Narasimhan Age : 68 Years Qualification : Post Graduate degree in Science from Madras University Professional Expertise : He retired as the Deputy Director General, Central Statistical Organization, to the
Government’s Ministry of Statistics & Programme Implementation in New Delhi and has held various senior and middle level positions in various Government ministries. Prior to his positions with the Government, Mr. R.L. Narasimhan has also worked with Hoechst Pharmaceuticals Ltd., Chennai, a multinational pharmaceutical company. His expertise lies in the field of budgeting, data management, programme evaluation & research and marketing.
Directorships : He is a director of Best On Health Ltd. Shareholding in : Nil the Company
b) Mr. N.N. Khamitkar Age : 68 Years Qualification : B.E. – Electrical and Mechanical (Pune University), MBA (University of District
of Columbia, Washington DC, USA) and Post Graduate Diploma in Public Administration, Indian Institute of Public Administration.
Professional Expertise : He is a retired Govt. Official belonging to Indian Engineering Service and retired as Dy. Director General, Ministry of Home Affairs, Govt. of India, New Delhi.
He has held various senior and middle level positions in various Govt. Ministries and Offices before his retirement. His expertise lies in the field of administration, planning & procurement.
Directorships : He is a director of Best On Health Limited. Shareholding in : Nil the Company
c) Mr. Sunil Kapoor Age : 52 Years Qualification : Commerce graduate from Shri Ram College of Commerce, University of Delhi and
holds a LL.B. degree from Law Faculty, University of Delhi. Professional Expertise : He practices as an advocate and is a member of the Delhi High Court Bar
Association and Bar Association Income Tax, New Delhi. Directorships : He is a director of Golden Peakock Overseas Ltd., Stross Crystals Ltd., Residency
Resorts Pvt. Ltd., Indo-dan Lamp Shade Ltd., GPL Exports Ltd, Hitkari Industries Ltd., Best On Health Ltd., Residency Hospitality Services (P) Ltd., Reis Magos Fort Restors (Pvt.) Ltd. and Raihl Estate (Pvt.) Ltd.
Shareholding in : Nil the Company
Information supplied to the BoardIn addition to the regular business items, the Company provides the following information to the Board and Board Committees as and when required. Such information is submitted either as part of the agenda papers in advance of the meetings or by way of presentations and discussions material during the meetings:1. Annual operating plans and budgets and any updates. 2. Capital budgets and any updates. 3. Quarterly results for the company and its operating divisions or business segments. 4. Minutes of meetings of audit committee and other committees of the Board. 5. The information on recruitment and remuneration of senior officers just below the Board level, including
appointment or removal of Chief Financial Officer and the Company Secretary.6. Show cause, demand, prosecution notices and penalty notices which are materially important. 7. Fatal or serious accidents, dangerous occurrences, any material effluent or pollution problems. 8. Any material default in financial obligations to and by the company, or substantial non-payment for goods
sold by the company.
Panacea Biotec • Annual Report 2008-0954

Panacea Biotec • Annual Report 2008-0955
9. Any issue, which involves possible public or product liability claims of substantial nature, including any judgement or order which, may have passed strictures on the conduct of the company or taken an adverse view regarding another enterprise that can have negative implications on the company.
10. Details of any joint venture or collaboration agreement. 11. Transactions that involve substantial payment towards goodwill, brand equity or intellectual property. 12. Significant labour problems and their proposed solutions. Any significant development in Human Resources/
Industrial Relations front like signing of wage agreement, implementation of Voluntary Retirement Scheme, etc.
13. Sale of material nature of investments, subsidiaries, assets, which is not in normal course of business. 14. Quarterly details of foreign exchange exposures and the steps taken by management to limit the risks of
adverse exchange rate movement, if material. 15. Non-compliance of any regulatory, statutory or listing requirements and shareholders service such as non-
payment of dividend, delay in share transfer etc., if any.Statutory Compliance of LawsThe Board periodically reviews the compliance report of the laws applicable to the Company as well as steps taken by the Company to rectify the instances of non-compliances, if any.Code of ConductThe Board has laid down a code of conduct for all Board Members and senior management of the Company. The said Code has been communicated to the Directors and Senior Management Personnel and is also posted on the web-site of the company viz. www.panaceabiotec.com.Declaration from the Managing Director confirming that the Company has received affirmations from the Board Members and the Senior Management Personnel regarding compliance of Code of conduct during the year under review, is attached as Annexure-I.
3. Audit CommitteeComposition & Terms of ReferenceThe Audit Committee of the Company has been constituted as per Section 292A of the Companies Act, 1956 and the guidelines set out in the Listing Agreements with the Stock Exchanges. The Audit Committee of the Company comprises of three non-executive directors, all of them being independent Directors viz. Mr. R.L. Narasimhan, Mr. N.N. Khamitkar and Mr. Sunil Kapoor. Mr. R.L. Narasimhan is the Chairman of the Committee. All the members are financially literate and one member is having requisite accounting and financial management expertise. The management is responsible for the Company’s internal controls and the financial reporting process while the statutory auditors are responsible for performing independent audits of the Company’s financial statements in accordance with generally accepted auditing practices and for issuing reports based on such audits. The Board of Directors has entrusted the Audit Committee to supervise these processes and thus ensure accurate and timely disclosures that maintain the transparency, integrity and quality of financial control and reporting. The terms of reference and scope of the activities of the Audit Committee is as set out in Clause 49 of the Listing Agreements with the Stock Exchanges as well as in Section 292A of the Companies Act, 1956, including the following:• To review compliance with internal control systems;• To review the findings of the Internal Auditor relating to various functions of the Company;• To hold periodic discussions with the Statutory Auditors and Internal Auditors of the Company concerning the
accounts of the Company, internal control systems, scope of audit and observations of the Auditors/Internal Auditors;
• To review the quarterly, half-yearly and annual financial results of the Company before submission to the Board;
• To make recommendations to the Board on any matter relating to the financial management of the Company, including Statutory & Internal Audit Reports;
• Recommending the appointment of statutory auditors and internal auditors and fixation of their remuneration.
Review of information by Audit CommitteeApart from other matters, as per Clause 49 of the Listing Agreement the Audit Committee reviewed, to the extent applicable, the following information:i) Management discussion and analysis of financial condition and results of operations;ii) Statement of significant transactions, submitted by the Management;iii) Management letters/letters of internal control weakness issued by statutory auditors;iv) Internal Audit Reports relating to internal control weakness;v) The appointment, removal and terms of remuneration of the Internal Auditors; vi) Related party transactions. Meetings of Audit Committee and attendance of members during the yearDuring the year, 5 (five) Audit Committee meetings were held on 29th April, 2008, 25th June, 2008, 28th July, 2008, 16th October, 2008 and 28th January, 2009.
Panacea Biotec • Annual Report 2008-0955

Panacea Biotec • Annual Report 2008-0956
The attendance of members of the Audit Committee at these meetings were as follows:
Sl. Name of the Member Designation Category of Directorship No. of No. of No. Meetings Meetings held attended
1. Mr. R. L. Narasimhan Chairman Independent Director 5 52. Mr. N. N. Khamitkar Member Independent Director 5 53. Mr. Sunil Kapoor Member Independent Director 5 5
The Statutory Auditors, Internal Auditors, Cost Auditors, Chief Financial Officer, DGM (Accounts & Finance), AGM (Finance), AGM Audit & Compliances are the permanent invitees of the meetings of Audit Committee. Apart from them, Joint Managing Director(s), Director (Operations and Projects), Associate Director, General Manager (HR), V.P. (HR), V.P. Audit & Compliance (HR) etc. attended one or more of the Audit Committee Meetings.The Company Secretary is acting as the Secretary to the Audit Committee. The Chairman of the Audit Committee, Mr. R.L. Narasimhan, was present at the Annual General Meeting of the Company held on 27.09.2008.
Subsidiary CompaniesDuring the year, the Company’s wholly owned subsidiary, Best On Health Limited acquired the status of a material non-listed Indian subsidiary of the Company as its net worth (i.e. paid-up capital and free reserves) exceeded 20% of the consolidated net worth of the Company and its subsidiaries in the immediately preceding accounting year i.e. financial year 2007-08. The Company’s independent Directors, Mr. R.L. Narasimhan, Mr. N.N. Khamitkar and Mr. Sunil Kapoor are directors on the Board of Directors of Best on Health Limited w.e.f. 1st January 2008.The Audit Committee of the Company reviewed the financial statements, in particular, the investments made by all unlisted subsidiary companies except the financial statements of two of its subsidiaries namely Kelisia Investment Holdings AG & Panacea Biotec (International) SA as the first financial year of these companies will end on 31st March 2010.The Board minutes of unlisted subsidiary companies are placed at the Board Meeting of the Company and the significant transactions or arrangements entered into by the unlisted subsidiary companies are periodically informed to the Board.
4. Remuneration Committee
Brief description of terms of referenceThe Company has constituted a Remuneration Committee. The terms of reference of the Committee include:
- to decide elements of remuneration package of all the directors;- to decide the service contracts, notice period and severance fees of executive directors.
Composition
Remuneration Committee comprises of three non-executive independent Directors viz. Mr. R.L. Narasimhan, Mr. N.N. Khamitkar and Mr. Sunil Kapoor, Mr. R.L. Narasimhan is the Chairman of the Committee. The Company Secretary is acting as the Secretary to the Remuneration Committee. No meeting of the Remuneration Committee was held during the year.
Remuneration Policy
The Directors’ Remuneration Policy of your Company is in conformity with the provisions under the Companies Act, 1956. Subject to the approval of the Company’s shareholders in general meeting and such other approvals as may be necessary, the Managing/Joint Managing Directors and the Whole-time Directors are paid remuneration as per the terms of remuneration decided by the Board/ Remuneration Committee and approved by the Shareholders. The remuneration payable to the executive Directors is decided from time to time keeping in view the overall performance of the Company, the performance of the concerned Director and the industry trends. The key components of the Company’s Remuneration Policy are:• Compensation will be a major driver of performance. • Compensation will be competitive and benchmarked with a select group of companies from the pharmaceutical
sector. • Compensation will be fully transparent and tax compliant.
Directors’ remuneration
In view of the loss incurred by the Company for the financial year ended 31st March 2009, the Company has applied to the Central Government for protection of the remuneration paid for the financial year 2008-09 to Mr. Soshil Kumar Jain, Chairman, Mr. Ravinder Jain, Managing Director, Dr. Rajesh Jain, Joint Managing Director and Mr. Sandeep Jain, Joint Managing Director and the approval is awaited. The details of the remuneration of Executive Directors for the year ended 31st March, 2009 are as under:
Panacea Biotec • Annual Report 2008-0956

Panacea Biotec • Annual Report 2008-0957
i) Executive Directors (Managing/Joint Managing/Whole-time Directors)
(Rs. in Lac)S. No. Name Salary Allowances Perquisites Total
1. Mr. Soshil Kumar Jain 144.00 6.46 1.09 151.552. Mr. Ravinder Jain 144.00 6.46 42.76 193.223. Dr. Rajesh Jain 120.00 5.38 1.10 126.484. Mr. Sandeep Jain 120.00 5.38 1.10 126.485. Mr. Sumit Jain 27.00 1.21 4.75 32.96
Notes:1. The tenure of office of Mr. Soshil Kumar Jain, Chairman, Mr. Ravinder Jain, Managing Director, Dr. Rajesh Jain and Mr. Sandeep Jain, Joint
Managing Directors of the Company is for 5 years w.e.f.1st April, 2006.The tenure of office of Mr. Sumit Jain, Director (Operations and Projects) is for 5 years w.e.f. 22nd July, 2005.
2. Notice period for termination of appointment of Managing/Joint Managing/ Whole time Directors is three months by either party or a shorter period decided mutually. No severance fee is payable on termination of contract.
3. The Company does not have any Stock Option Scheme. 4. All elements of remuneration of the Managing/Joint Managing/ Whole-time Directors, i.e., Salary, Perquisites and other benefits, etc. are
given in Schedule XX C annexed to and forming part of Balance Sheet and Profit & Loss Account of the Company.5. Provision for Gratuity and Leave Encashment amounting to Rs.60.08 Lac and Rs.32.64 Lac respectively, made during the year, has not
been included above.
ii) Non-Executive DirectorsPayment Criteria:The Board of Directors determines the remuneration of the non-executive Directors within the limits approved by the shareholders. Apart from the sitting fees for attending meetings of the Board or Committee thereof, the remuneration is paid to the non-executive Directors (other than Mr. Gurmeet Singh) by way of monthly allowances for telephone, mobile, conveyance expenses, etc. @ Rs.15,500 p.m. (with the confirmation obtained from Central Government) to enable them to meet their expenses for attending to their responsibilities as non-executive director. As approved by the Board in their Meeting held on 31st October 2008, the sitting fees payable to the Independent Directors of the Company for attending meetings of the Board and Audit Committee was increased to Rs.10,000 per meeting from Rs.5,000 payable earlier for meetings held on or after 1st November 2008. Such increase is within the statutory limits prescribed under rule 10-B of the Companies (Central Govt.’s) General Rules & Forms, 1956. The details of remuneration paid to the non-executive directors during financial year ended 31st March, 2009 are as under: (Rs. in Lac)
Sl. No. Name Allowances Sitting Fees Total1 Mr. R.L. Narasimhan 1.86 0.60 2.462. Mr. N.N. Khamitkar 1.86 0.65 2.513. Mr. Sunil kapoor 1.86 0.60 2.464. Mr. Gurmeet Singh - 0.50 0.505. Mr. K.M. Lal 1.86 0.20 2.066. Dr. A.N. Saksena 1.86 0.90 2.76
None of the non-executive Directors hold any shares/ convertible securities of the Company.
5. Share Transfer cum Investors’ Grievance Committee The Investors Grievance Committee aims at redressal of shareholder complaints and overseeing investor services.The Board of Directors of the company has, with a view to expedite the process of share transfers, delegated the power of share transfer to the Company Secretary who attends to share transfer formalities on weekly basis.Terms of referenceThe terms of reference of Share Transfer cum Investors’ Grievance Committee include transfer or transmission of shares, dematerialisation of shares, issue of duplicate share certificates, review or redressal of investors’ grievances and other areas of investor service. CompositionThe Share Transfer-cum-Investors’ Grievance Committee comprises of three Directors viz. Dr. A.N. Saksena, Mr. Ravinder Jain and Mr. Gurmeet Singh. Dr A.N. Saksena, an independent non-executive Director acts as Chairman of the Committee.The Company Secretary is acting as the Secretary to the Committee as well as the Compliance Officer pursuant to Clause 47(a) of the Listing Agreement with Stock Exchanges:
Sl. Name of the Member Designation Category of Directorship No. of No. of No. Meetings Meetings held attended 1. Dr. A. N. Saksena Chairman Independent Director 12 122. Mr. Ravinder Jain Member Promoter Director 12 93. Mr. Gurmeet Singh Member Independent Director 12 10
Panacea Biotec • Annual Report 2008-0957
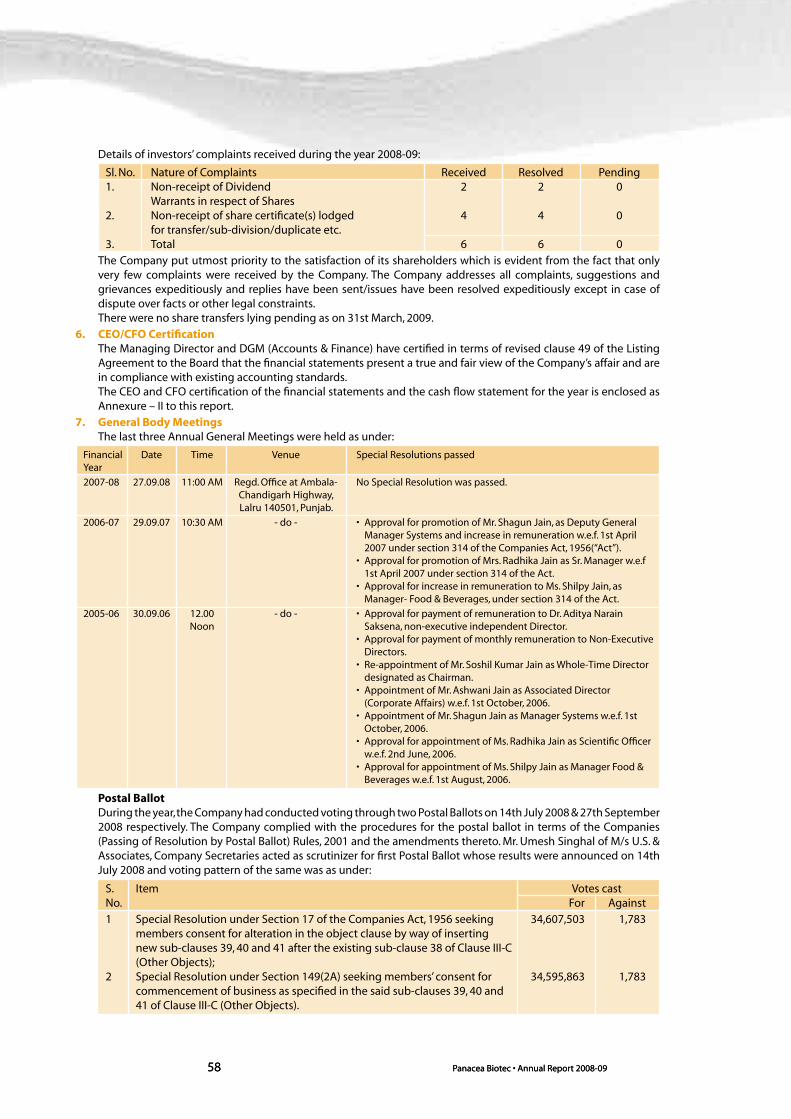
Panacea Biotec • Annual Report 2008-0958
Details of investors’ complaints received during the year 2008-09:
Sl. No. Nature of Complaints Received Resolved Pending 1. Non-receipt of Dividend 2 2 0 Warrants in respect of Shares2. Non-receipt of share certificate(s) lodged 4 4 0 for transfer/sub-division/duplicate etc.3. Total 6 6 0
The Company put utmost priority to the satisfaction of its shareholders which is evident from the fact that only very few complaints were received by the Company. The Company addresses all complaints, suggestions and grievances expeditiously and replies have been sent/issues have been resolved expeditiously except in case of dispute over facts or other legal constraints. There were no share transfers lying pending as on 31st March, 2009.
6. CEO/CFO Certification The Managing Director and DGM (Accounts & Finance) have certified in terms of revised clause 49 of the Listing Agreement to the Board that the financial statements present a true and fair view of the Company’s affair and are in compliance with existing accounting standards.The CEO and CFO certification of the financial statements and the cash flow statement for the year is enclosed as Annexure – II to this report.
7. General Body Meetings The last three Annual General Meetings were held as under:
Financial Date Time Venue Special Resolutions passed Year
2007-08 27.09.08 11:00 AM Regd. Office at Ambala- No Special Resolution was passed. Chandigarh Highway, Lalru 140501, Punjab.
2006-07 29.09.07 10:30 AM - do - • Approval for promotion of Mr. Shagun Jain, as Deputy General Manager Systems and increase in remuneration w.e.f. 1st April 2007 under section 314 of the Companies Act, 1956(“Act”). • Approval for promotion of Mrs. Radhika Jain as Sr. Manager w.e.f 1st April 2007 under section 314 of the Act. • Approval for increase in remuneration to Ms. Shilpy Jain, as Manager- Food & Beverages, under section 314 of the Act.
2005-06 30.09.06 12.00 - do - • Approval for payment of remuneration to Dr. Aditya Narain Noon Saksena, non-executive independent Director. • Approval for payment of monthly remuneration to Non-Executive Directors. • Re-appointment of Mr. Soshil Kumar Jain as Whole-Time Director designated as Chairman. • Appointment of Mr. Ashwani Jain as Associated Director (Corporate Affairs) w.e.f. 1st October, 2006. • Appointment of Mr. Shagun Jain as Manager Systems w.e.f. 1st October, 2006. • Approval for appointment of Ms. Radhika Jain as Scientific Officer w.e.f. 2nd June, 2006. • Approval for appointment of Ms. Shilpy Jain as Manager Food & Beverages w.e.f. 1st August, 2006.
Postal BallotDuring the year, the Company had conducted voting through two Postal Ballots on 14th July 2008 & 27th September 2008 respectively. The Company complied with the procedures for the postal ballot in terms of the Companies (Passing of Resolution by Postal Ballot) Rules, 2001 and the amendments thereto. Mr. Umesh Singhal of M/s U.S. & Associates, Company Secretaries acted as scrutinizer for first Postal Ballot whose results were announced on 14th July 2008 and voting pattern of the same was as under:
S. Item Votes castNo. For Against
1 Special Resolution under Section 17 of the Companies Act, 1956 seeking 34,607,503 1,783 members consent for alteration in the object clause by way of inserting new sub-clauses 39, 40 and 41 after the existing sub-clause 38 of Clause III-C (Other Objects);2 Special Resolution under Section 149(2A) seeking members’ consent for 34,595,863 1,783 commencement of business as specified in the said sub-clauses 39, 40 and 41 of Clause III-C (Other Objects).
Panacea Biotec • Annual Report 2008-0958

Panacea Biotec • Annual Report 2008-0959
Mr. U. K. Singhal of M/s Singhal Law Associates, Advocates acted as scrutinizer for second postal ballot and the results of the same were announced on 27th September, 2008 and voting pattern for the resolutions was as under:
S. Item Votes castNo. For Against
1 Ordinary Resolution under Section 293(1)(d) of the Companies Act ,1956 for 34,247,228 1,720 increase in borrowing powers of Board upto Rs.1500 Crore;
2 Ordinary Resolution under Section 293(1)(a) of the Companies Act, 1956 34,240,774 3,720 authorizing the Board of Directors to mortgage and/or charge/hypothecate any of its movable and/or immovable properties or the whole or substantially the whole of an undertaking or undertakings of the Company.
Thus, all the resolutions were passed with overwhelming majority.
Procedure for voting by Postal Ballot:
The Postal Ballot Forms and the draft Resolution(s) along with the Explanatory Statement pertaining the said Resolution(s) explaining in detail the material facts and the self-addressed, postage prepaid envelope, are sent to all the members, under Certificate of Posting.The members are required to carefully read the instructions printed in the Postal Ballot Form, give their assent or dissent on the resolution(s) at the end of the Form and sign the same as per the specimen signatures available with the Company or Depository Participant, as the case may be, and return the form duly completed in the attached self-addressed postage prepaid envelope so as to reach the scrutinizer before the close of working hours of the last date fixed for the purpose. Postal Ballot Forms received after this date are strictly treated as if the form has not received from the member.The scrutinizer appointed for the purpose scrutinizes the postal ballots received and submit his report to the Company.Voting rights are reckoned on the basis of number of shares and paid-up value of shares registered in the name of the shareholders as on the date of dispatch of the postal ballot notice. A resolution is deemed to have been passed as special resolution if the votes cast in favour are at least three times than the votes cast against and in case of ordinary resolution, the resolution is deemed to have been passed, if votes cast in favour are more than the votes cast against.
8. Disclosurea) Related Party Transactions – During the year, there were no materially significant related party transactions
with the promoters, the directors or the management, their subsidiaries or relatives, etc. that may have potential conflict with the interests of the Company at large. The other related party transactions are given in Note No.9 of Schedule XXC annexed to and forming part of Balance Sheet and Profit & Loss Account of the Company.
b) Disclosure of Accounting Treatment - There has not been any change in accounting policies of the Company during the year except as stated in Note No.2 of Schedule XXB annexed to and forming part of Balance Sheet and Profit & Loss Account of the Company.
c) Risk Management - The Company has a procedure to inform the Board about the risk assessment and minimization procedures. The Board of Directors periodically reviews the risk management framework of the Company.
d) Compliances by the Company - During the last three years, there were no strictures or penalties imposed by either SEBI or the Stock Exchanges or any other statutory authority for non-compliance of any matter related to the capital markets.
e) The Company has complied with all the mandatory requirements of clause 49 of the listing Agreement. As regards, the adoption of non-mandatory requirements as contained in Annexure I-D to clause 49 of the listing agreement, the Company has implemented the requirements as per details give below:
i) Chairman of the Board - The Chairman of Panacea Biotec is an Executive Director and he maintains the Chairman’s Office at the Company’s expenses.
ii) Remuneration Committee - The Board of Directors has constituted a Remuneration Committee, which is composed of independent Directors. The details of the Remuneration Committee and its powers have already been discussed in this Report.
iii) Shareholders rights - The quarterly/ half-yearly results, after they are approved by the Board of Directors, are sent forthwith to the Stock Exchanges where the Company’s shares are listed, published in the newspapers as mentioned under the heading “Means of Communication” at Sl. No. 10 hereinbelow and also displayed on the Company’s web-site www.panaceabiotec.com. The results are not separately circulated to the shareholders.
iv) Training of Board Members - No specific training programme was arranged for Board members. However,
Panacea Biotec • Annual Report 2008-0959

Panacea Biotec • Annual Report 2008-0960
at the Board/Committee meetings detailed presentations are made by Professionals, Consultants as well as Senior Executives of the Company on the business related matters, risk assessment, strategy, effect of the regulatory changes, etc.
v) Mechanism for evaluating non-executive Board members - The Company has not adopted any mechanism for evaluating individual performance of Non- Executive Directors.
vi) Whistle Blower Policy - The Company has implemented a Whistle Blower Policy in the Company and no personnel is denied access to the Audit Committee of the Company.
9. Prohibition of Insider TradingIn compliance with the SEBI Regulations on Prevention of Insider Trading, the Company has instituted a comprehensive Code of Conduct for its management, staff and relevant business associates. The Code lays down guidelines, which advises them on procedures to be followed and disclosures to be made, while dealing with Shares of the Company.
10. Means of communication1. The Quarterly and Half-Yearly results are published in one or more of the prominent daily newspapers, viz.
Business Line and Business Standard, All editions, Hindustan Times, New Delhi, Chandigarh, Lucknow, Kolkata, Patna, Ranchi and Bhopal; DNA Money, Mumbai; Financial Express, Delhi, Mumbai and in Punjabi Tribune, Chandigarh, the local newspaper published in the language of the region in which Registered Office is situated.
2. The Company also intimate the Stock Exchanges all price sensitive matters or such matters which in its opinion are material and of relevance to the shareholders and subsequently issues a Press Release on the matter, wherever necessary.
3. The Annual Results (Annual Report containing Balance Sheet etc.) are posted to every shareholder of the Company.
4. The Company’s web-site, viz. www.panaceabiotec.com, is regularly updated with the financial results, annual report and other important events.
5. Pursuant to clause 51 of the listing agreement, financial information like annual and quarterly financial statements, segment-wise results, shareholding pattern(s) and annual report(s) are made available on the SEBI’s web-site www.sebiedifar.nic.in.
6. Management’s Discussion and Analysis Report has been included in the Annual Report being sent to the shareholders of the Company.
11. General Shareholder Information i) Date of AGM
The Annual General Meeting is proposed to be held on Friday, the 25th day of September, 2009, at 11:00 A.M. at the registered office of the Company at Ambala-Chandigarh Highway, Lalru - 140 501, Punjab.
Posting of Annual Report On or before 1st September, 2009
Last date of receipt of Proxy Form 23rd September, 2009 before 11.00 A.M.
ii) Financial Calendar 2009-10 (tentative)
S. No. Tentative Schedule Tentative Date
1. Financial reporting for the quarter ended 30th June, 2009 30th July, 2009 (Actual)
2. Financial reporting for the half year ending 30th September, 2009 End of October, 2009
3. Financial reporting for the quarter ending 31st December, 2009 End of January, 2010
4. Financial reporting for the quarter ending 31st March, 2009 End of April, 2010*
5. Annual General Meeting for the year ending 31st March, 2010 End of September, 2010
*As provided in clause 41 of Listing Agreement, Board may also consider publishing Audited Results for the year 2009-10 in lieu of Unaudited Results for fourth quarter, by 30th June, 2010 (or such other period as may be stipulated from time to time).
iii) Date of Book ClosureThe Share Transfer Books and Register of Members of the Company will remain closed from Wednesday, 23rd September, 2009 to Friday, 25th September, 2009 (both days inclusive).
iv) No DividendIn view of non-availability of profits during the current financial year, the Board of Directors has not recommended any dividend on the Equity Shares of the Company.
v) Unclaimed DividendsAs provided in Section 205A and 205C of the Companies Act, 1956, dividend for the financial year ended 31st March, 2002 and thereafter, which remain unpaid or unclaimed for a period of 7 years, will be transferred to the
Panacea Biotec • Annual Report 2008-0960

Panacea Biotec • Annual Report 2008-0961
Investor Education and Protection Fund (IEP Fund) established by the Central Government and no payments shall be made in respect of any such claims by the IEP Fund.
During the year, the Company had transferred Rs.143,640 lying unclaimed in Unpaid Dividend Account in respect of Dividend for the Year 2000-2001 to the said Fund on 18th October, 2008.
Information in respect of other unclaimed dividend when due for transfer to the said Fund is given below:
Financial Year Date of declaration Last date for claiming Due date for of Dividend unpaid Dividend transfer to IEP Fund
2001-02 24.08.2002 21.09.2009 20.10.2009
2002-03 20.09.2003 18.10.2010 16.11.2010
2003-04 18.09.2004 16.10.2011 14.11.2011
2004-05 20.08.2005 17.09.2012 16.10.2012
2005-06 30.09.2006 29.10.2013 28.11.2013
2006-07 29.09.2007 28.10.2014 27.11.2014
2007-08 27.09.2008 26.10.2015 25.11.2015
Shareholders who have not yet encashed their dividend warrant(s) for the above said financial year(s) may send their request for revalidation of Dividend Warrant(s) or issue of duplicate Dividend Warrant(s), as the case may be, to the Company’s Corporate Office immediately. Shareholders are requested to note that no claims shall lie against the Company or the said Fund in respect of any amounts, which were unclaimed or unpaid for a period of 7 years from the dates on which they first became due for payment and no payment shall be made in respect of any such claims.
vi) Listing on Stock ExchangeThe Company’s Equity Shares are listed on the following Stock Exchanges:
• National Stock Exchange of India Ltd. (NSE), Bandra Kurla Complex, Bandra (E), Mumbai.
• Bombay Stock Exchange Ltd. (BSE), P J Tower, Dalal Street, Fort, Mumbai.
The Foreign Currency Convertible Bonds (FCCBs) of the Company are listed on Singapore Exchange Ltd. (SGX), 2 Shenton Way, #19-00 SGX Centre 1, Singapore 068804, under the BONDS Sector.
The Company has paid listing fees to all the above stock exchanges and there is no outstanding payment as on date.
vii) Stock Code of Equity Shares / FCCBsTrade symbol at National Stock Exchange is PANACEABIO.
Stock Code at Bombay Stock Exchange is 531349.
ISIN No. for Dematerialisation : INE922B01023.
Stock Code of FCCBs : XS0243888830
Panacea Biotec • Annual Report 2008-09Panacea Biotec • Annual Report 2008-0961

Panacea Biotec • Annual Report 2008-0962
ix) Registrar and Transfer Agents
Skyline Financial Services Pvt. Ltd., are acting as Registrar & Transfer Agents (RTA) for handling the shares related matters both in physical as well as dematerialised mode. All works relating to Equity Shares are being done by them. The Shareholders are therefore, advised to send all their correspondence to the RTA.
However, for the convenience of shareholders, documents relating to shares received by the Company are forwarded to the RTA for necessary action thereon.
x) Nomination Facility
The shareholders holding shares in physical form may, if they so want, send their nominations in prescribed Form 2B of the Companies (Central Government’s) General Rules and Forms, 1956, (which can be either obtained from the Company’s RTA or downloaded from the Company’s website www.panaceabiotec.com under the section ‘Investor Zone’) to the Company’s RTA. Those holding shares in dematerialised form may contact their respective Depository Participant (DP) to avail the nomination facility.
xi) Share Certificates in respect of sub-divided Shares
After the sub-division of the Company’s Equity Shares of Rs.10 each into shares of Re.1 each, in the year 2003, the Company had sent letters to all shareholders holding shares of the face value of Rs.10 in physical form, requesting them to exchange their share certificates into new share certificate(s) in respect of shares of face value of Re.1 each.
All the shareholders who have not yet sent their request for exchange of share certificates, are requested to forward their old share certificates in respect of shares of face value of Rs.10 each (which are no longer tradable) to the Company, along with a request letter duly signed by all the joint holders.
xii) Elimination of Duplicate Mailing
The shareholders who are holding Shares in more than one folio in identical name or in joint holders’ name in similar order, may send the share certificate(s) along with request for consolidation of holding in one folio to avoid mailing of multiple Annual Reports.
xiii) Share Transfer System
The Company’s shares transfer authority has been delegated to the Company Secretary. The delegated authority generally attends the share transfer formalities on weekly basis and as and when required to expedite all matters relating to transfer, transmission, transposition and dematerialisation of shares and redressal of Investors’ grievance, etc., if any. The shares received by the Company/ RTA for registration of transfers, are processed by RTA (generally within a week of receipt) and transferred expeditiously and the Share Certificate(s) are returned to the shareholder(s) by registered post.
viii) Market Price data:
The High and Low prices of the shares of the Company at Bombay Stock Exchange Limited (BSE) and National Stock Exchange of India Ltd. (NSE) for the year ended 31st March, 2009 are as under:
Month Share Prices (Rs.) at BSE Share Prices (Rs.) at NSE
High Low High Low
April,2008 405.00 340.05 400.00 330.05
May, 2008 413.00 345.00 412.00 368.00
June, 2008 392.00 292.00 395.60 295.00
July, 2008 363.40 273.05 363.60 270.25
August, 2008 340.00 247.50 365.00 269.00
September, 2008 308.50 214.50 310.00 216.10
October, 2008 249.00 144.00 248.50 141.00
November, 2008 197.00 123.20 198.00 123.45
December, 2008 151.00 126.00 147.00 124.20
January,2009 138.95 51.95 139.50 51.70
Februray,2009 77.20 51.00 78.40 50.00
March,2009 62.10 52.00 62.30 51.10
Panacea Biotec • Annual Report 2008-0962

Panacea Biotec • Annual Report 2008-0963
As per the requirement of clause 47 (c) of the Listing Agreement with the Stock Exchanges, the Company has obtained the half yearly certificates from a Company Secretary in Practice for due compliance of share transfer/ consolidation/ exchange formalities.
The Securities and Exchange Board of India (SEBI) vide circular ref. no. MRD/DoP/Cir-05/2009 dated 20th May, 2009 directed that for securities market transactions and off-market/private transactions involving transfer of shares in physical form of listed companies, it shall be mandatory for the transferee(s) to furnish copy of PAN card to the Company/ RTA for registration of such transfer of shares.
xiv) Secretarial Audit
A Practising Company Secretary carries out secretarial audit in each of the quarter to reconcile the total admitted capital with National Securities Depository Limited (NSDL) and Central Depository Services (India) Ltd. (CDSL) and total issued and listed capital. The audit reports confirm that the total issued/ paid up capital is in agreement with the total number of shares in physical form and the total number of dematerialised shares held with NSDL and CDSL. The Secretarial Audit Reports for each quarter of the Financial Year ended March 31, 2009 has been filed with Stock Exchanges within one month of end of each quarter.
xv) Dematerialisation of Shares and its liquidity
The Company has been among the few top-most companies in India in which maximum number of shares have been dematerialised. As on 31st March, 2009, 99.05% of the Company’s total Equity Share Capital representing 66,204,985 Equity Shares were held in dematerialised form and only 637,761 Equity Shares were in paper/physical form.
The shareholders holding shares in physical form are requested to get their shares dematerialised at the earliest, as the Company’s Shares are required to be compulsorily traded at Stock Exchanges in dematerialised form only.
The shares of the Company are regularly traded at the National Stock Exchange and the Bombay Stock Exchange.
xvi) Share Dematerialisation System
The requests for dematerialisation of shares are processed by RTA expeditiously and the confirmation in respect of dematerialisation of shares is entered by RTA in the depository system of the respective depositories, by way of electronic entries for dematerialisation of shares generally on weekly basis. In case of rejections, the documents are returned under objection to the Depository Participant with a copy to the shareholder and electronic entry for rejection is made by RTA in the Depository System.
xvii) Distribution of Shareholding as on 31st March, 2009
No. of Shares No. of Shareholders No. of Shares
0-2500 8,190 2,021,221
2501-5000 111 407,293
5001-10000 29 215,713
10001-100000 42 1,323,499
100001 and above 39 62,875,020
Total 8,411 66,842,746
xviii) Pattern of Shareholding as on 31st March, 2009
S. No. Category No. of Shares %
1. Promoters, Relatives & 45,451,699 68.00 Associates2. Institutional Investors (FIIs, 11,554,491 17.29 Banks & Mutual Funds)3. Domestic Companies 5,403,079 8.084. Indian Public 2,876,080 4.305. NRIs / OCBs / Foreign 1,527,450 2.29 Corporate Bodies6. Others 29,947 0.04
Total 66,842,746 100.00
Shareholding Pattern
Panacea Biotec • Annual Report 2008-0963

Panacea Biotec • Annual Report 2008-0964
xix) GDRs / ADRs / Warrants or other convertible instruments
No GDRs/ADRs/Warrants were outstanding as on 31st March, 2009. However, Foreign Currency Convertible Bonds (FCCBs) (US$ 50,000,000 Zero coupon Convertible Bonds due 2011) aggregating US$ 36.8 million (Rs.1,866,496,000) were outstanding as on 31st March, 2009.
xx) Plant Locations
• Bulk Vaccine facilities at Village Samalheri, Ambala-Chandigarh Highway,Lalru-140 501, Punjab.
• Pharmaceutical Formulations facility at Malpur, Baddi, Dist. Solan, Himachal Pradesh-173 205.
• Vaccines Formulations facility at Malpur, Baddi, Dist. Solan, Himachal Pradesh-173 205.
• Vaccines Formulations facility at A-241/242, Okhla Indl. Area, Phase I, New Delhi - 110 020.
• Pharmaceutical Formulations facility at B-1/E-12, Mohan Co-operative Indl. Estate, Mathura Road, New Delhi - 110 044.
xxi) Address for correspondence
For transfer/ Skyline Financial Services Pvt. Ltd. dematerialisation of shares, 246, Sant Nagar, 1st Floor, ISKCON Temple Road, payment of dividend and any East of Kailash, New Delhi – 110 065, India.other query relating to shares Phone : +91-11-26292681-84 Tele-fax : +91-11- 26292681 E-mail : [email protected], [email protected] investors assistance The Company Secretary Panacea Biotec Limited B-1 Extn./G-3, Mohan Co-operative Indl. Estate, Mathura Road, New Delhi - 110 044, India.
Phone : +91-11-41679000 Extn. 2081 (D) 41578024 Fax : +91-11-41679075, 41679070 E-mail : [email protected] [email protected]
Contact Person : Mr. Vinod Goel, G.M. Legal & Company Secretary/ Ms. Sangeeta Nagpal, Deputy Manager-Secretarial.
For query relating to : Mr. Chandresh Ohrifinancial matters Manager - Banking & Treasury Phone : +91-11-41679000 Fax : +91-11-41679066, 41679070 E-mail : [email protected]
Annexure - I
Declaration under Clause 49-I (D) of the Listing Agreement
To
The Members of Panacea Biotec Ltd.
I hereby declare that all the Board Members and the Senior Management Personnel of the Company have affirmed the compliance with the provisions of the Code of Conduct for the period ended 31st March, 2009.
For Panacea Biotec Ltd.
Date : 27th May, 2009 Ravinder JainPlace : New Delhi Managing Director
For and on behalf of the Board
Place : New Delhi Soshil Kumar JainDate : 30th July, 2009 Chairman
Panacea Biotec • Annual Report 2008-0964

Panacea Biotec • Annual Report 2008-0965
Annexure - II
Certificate from Managing Director & Chief Financial Officer
To
The Board of DirectorsPanacea Biotec Limited
We do hereby confirm and certify that:
(a) We have reviewed financial statements and the cash flow statement for the year and that to the best of our knowledge and belief:
i) These statements do not contain any materially untrue statement or omit any material fact or contain statements that might be misleading;
ii) These statements together present a true and fair view of the company’s affairs and are in compliance with existing accounting standards, applicable laws and regulations.
(b) There are, to the best of our knowledge and belief, no transactions entered into by the company during the year which are fraudulent, illegal or violative of the company’s code of conduct.
(c) We accept responsibility for establishing and maintaining internal controls and that we have evaluated the effectiveness of the internal control systems of the company and we have disclosed to the auditors and the Audit Committee, deficiencies in the design or operation of internal controls, if any, of which we are aware of and the steps we have taken or propose to take to rectify these deficiencies.
(d) We have indicated to the auditors and the Audit committee:
i) significant changes in internal control during the year;
ii) significant changes in accounting policies during the year and that the same have been disclosed in the notes to the financial statements; and
iii) instances of significant fraud of which we are aware and the involvement therein, if any, of the management or an employee having a significant role in the company’s internal control system.
For Panacea Biotec Ltd.
Date : 27th May, 2009 Ravinder Jain I.K. SharmaPlace : New Delhi Managing Director DGM (Accounts & Finance)
AUDITORS’ CERTIFICATE
To
The Members of Panacea Biotec Limited
We have examined the compliance of conditions of Corporate Governance by Panacea Biotec Limited, for the year ended on 31st March 2009, as stipulated in clause 49 of the Listing Agreement of the said Company with stock exchange(s).
The compliance of conditions of Corporate Governance is the responsibility of the management. Our examination was limited to procedures and implementation thereof, adopted by the Company for ensuring the compliance of the conditions of the Corporate Governance. It is neither an audit nor an expression of opinion on the financial statements of the Company.
In our opinion and to the best of our information and according to the explanations given to us, we certify that the Company has complied with the conditions of Corporate Governance as stipulated in the above-mentioned Listing Agreement.
We state that no investor’s grievance is pending for a period exceeding one month against the Company as per the records maintained by the Shareholders/ Investors’ Grievance Committee.
We further state that such compliance is neither an assurance as to the future viability of the Company nor the efficiency or effectiveness with which the management has conducted the affairs of the Company.
Dass Gupta & AssociatesChartered Accountants
Per
Raaja JindalPlace : New Delhi PartnerDate : 30th July, 2009 Membership No. 504111
Panacea Biotec • Annual Report 2008-0965

Panacea Biotec • Annual Report 2008-0966
To the Members of Panacea Biotec Limited
1. We have audited the attached balance sheet of Panacea Biotec Limited (“the Company”) as at March 31, 2009 and also the profit and loss account and the cash flow statement for the year ended on that date annexed thereto. These financial statements are the responsibility of the Company’s management. Our responsibility is to express an opinion on these financial statements based on our audit.
2. We conducted our audit in accordance with auditing standards generally accepted in India. Those Standards require that we plan and perform the audit to obtain reasonable assurance about whether the financial statements are free of material misstatement. An audit includes examining, on a test basis, evidence supporting the amounts and disclosures in the financial statements. An audit also includes assessing the accounting principles used and significant estimates made by management, as well as evaluating the overall financial statement presentation. We believe that our audit provides a reasonable basis for our opinion.
3. As required by the Companies (Auditors’ Report) Order, 2003 (as amended) issued by the Central Government of India in terms of sub-section (4A) of Section 227 of the Companies Act, 1956, we enclose in the Annexure a statement on the matters specified in paragraphs 4 and 5 of the said Order.
4. Without qualifying our opinion, we draw attention to:
a) Note 3(ii) of Schedule XXC to the financial statements regarding non-provision of proportionate premium on redemption of ‘US$ 50 Million Zero Coupon Convertible Bonds due 2011’ amounting to Rs.470,992,269. The same has been disclosed as a contingent liability. Management has represented, that the redemption premium will be offset against the securities premium account and, hence, no adjustments have been considered in the accounts.
b) Note 17 of Schedule XXC to the financial statements regarding capitalization of expenditure on clinical trials amounting to Rs.123,978,449. The ultimate approval of such products, which has been considered as highly likely by the management, is not within direct control of the Company. Pending such final approval, no adjustments have been made to the accompanying financial statements.
c) Note 5(b) of Schedule XXC to the financial statements, The Company has incurred managerial remuneration of Rs.63,035,463 during the year, which is in excess of the limits specified by the relevant provisions of the Companies Act, 1956, by Rs.38,169,706. The Company has made an application to the appropriate regulatory authorities in this regard, for payment of such excess remuneration to managerial personnel. Pending the final outcome of the Company’s application, no adjustments have been made to the accompanying financial statements in this regard.
5. Further to our comments in the annexure referred to in para 3 above, we report that: -
i) we have obtained all the information and explanations which, to the best of our knowledge and belief, were necessary for the purposes of our audit;
ii) in our opinion, proper books of account as required by law, have been kept by the Company, so far as appears from our examination of the books;
iii) The balance sheet, profit and loss account and cash flow statement dealt with by this report are in agreement with the books of account;
iv) in our opinion, the balance sheet, profit and loss account and cash flow statement dealt with by this report, comply with the accounting standards referred to in sub-section (3C) of section 211 of the Companies Act, 1956;
v) on the basis of written representations received from the
directors, as on March 31, 2009, and taken on record by the Board of Directors, we report that none of the directors is disqualified as on March 31, 2009 from being appointed as a director in terms of clause (g) of sub-section (1) of section 274 of the Companies Act, 1956;
vi) In our opinion and to the best of our information and according to the explanations given to us, the said accounts give the information required by the Companies Act, 1956, in the manner so required and give a true and fair view in conformity with the accounting principles generally accepted in India:
a) in the case of the balance sheet, of the state of the affairs of the Company as at March 31, 2009;
b) in the case of the profit and loss account, of the loss for the year ended on that date; and
c) in the case of the cash flow statement, of the cash flows for the year ended on that date.
For S.R. Batliboi & Co. Chartered Accountants
per Manoj Gupta New Delhi PartnerMay 27, 2009 Membership No. 83906
Annexure referred to in paragraph [3] of our report of even date, Re: Panacea Biotec Limited
i) a) The Company has maintained proper records showing full particulars, including quantitative details and situation of fixed assets.
b) All fixed assets have not been physically verified by the management during the year but there is a regular program of verification, which in our opinion, is reasonable having regard to the size of the Company and the nature of its assets. As informed, no material discrepancies were noticed in respect of the fixed assets physically verified during the year.
c) There was no substantial disposal of fixed assets during the year.
ii) a) The management has conducted physical verification of inventory at reasonable intervals during the year.
b) The procedures of physical verification of inventory followed by the management are reasonable and adequate in relation to the size of the Company and the nature of its business.
c) The Company is maintaining proper records of inventory and no material discrepancies were noticed on physical verification.
iii) a) The Company has granted loan to three companies covered in the register maintained under section 301 of the Companies Act, 1956. The maximum amount involved during the year was Rs.819,644,921 and the year-end balance of loans granted to such parties was Rs.819,644,921.
b) In our opinion and according to the information and explanations given to us, the rate of interest and other terms and conditions for such loans are not prima facie prejudicial to the interest of the Company.
c) The loans granted are re-payable on demand. As informed, the company has not demanded repayment of any such loan during the year, thus, there has been no default on the part of the parties to whom the money has been lent. The payment of interest (whenever due) for loans has been regular.
d) There is no overdue amount of loans granted to companies, firms or other parties listed in the register maintained under section 301 of the Companies Act, 1956.
e) The Company has taken loan from one partnership
AUDITORS’ REPORT
Panacea Biotec • Annual Report 2008-0966

Panacea Biotec • Annual Report 2008-0967
firm covered in the register maintained under Section 301 of the Companies Act, 1956. The maximum amount involved during the year was Rs.533,428,059 and the year-end balance of loans taken from such parties was Rs.300,000,000.
f ) In our opinion and according to the information and explanations given to us, the rate of interest and other terms and conditions for such loans are not prima facie prejudicial to the interest of the Company.
g) In respect of loans taken, repayment of the principal amount is as stipulated and payment of interest has been regular.
iv) In our opinion and according to the information and explanations given to us, there is an adequate internal control system commensurate with the size of the Company and the nature of its business, for the purchase of inventory and fixed assets and for the sale of goods and services. During the course of our audit, no major weakness has been noticed in the internal control system in respect of these areas.
v) a) According to the information and explanations provided by the management, we are of the opinion that the particulars of contracts or arrangements referred to in section 301 of the Act that need to be entered into the register maintained under section 301 have been so entered.
b) In our opinion and according to the information and explanations given to us, the transactions made in pursuance of such contracts or arrangements exceeding value of Rupees five lakhs have been entered into during the financial year at prices which are reasonable having regard to the prevailing market prices at the relevant time.
vi) In respect of deposits accepted, in our opinion and according to the information and explanations given to us, directives issued by the Reserve Bank of India and the provisions of sections 58A, 58AA or any other relevant provisions of the Companies Act, 1956 and the rules framed there under, to the extent applicable, have been complied with. We are informed by the management that no order has been passed by the Company Law Board, National Company Law Tribunal or Reserve Bank of India or any Court or any other Tribunal.
vii) In our opinion, the Company has an internal audit system commensurate with the size and nature of its business.
viii) We have broadly reviewed the books of account maintained by the Company pursuant to the rules made by the Central Government for the maintenance of cost records under section 209(1)(d) of the Companies Act, 1956, and are of the opinion that prima facie, the prescribed accounts and records have been made and maintained.
ix) a) Undisputed statutory dues including provident fund, investor education and protection fund, employees’ state insurance, income-tax, sales-tax, wealth-tax, service tax, custom duty, excise duty, cess have generally been regularly deposited with the appropriate authorities except for slight delay in few cases, where amount involved is not significant, in the depositing of Value added tax (VAT), employees’ state insurance and service tax.
b) According to the information and explanations given to us there are no undisputed amounts payable in respect of provident fund, investor education and protection fund, employees’ state insurance, income-tax, wealth-tax, service tax, sales-tax, customs duty, excise duty, cess and other undisputed statutory dues were outstanding, at the year end, for a period of more than six months from the date they became payable.
c) According to the records of the Company, the dues
outstanding of income-tax, sales-tax, wealth-tax, service tax, customs duty, excise duty and cess on account of any dispute, are as follows:
x) The Company has no accumulated losses at the end of the financial year and it has not incurred cash losses in the current and immediately preceding financial year.
xi) Based on our audit procedures and as per the information and explanations given by the management, we are of the opinion that the Company has not defaulted in repayment of dues to a financial institution, bank or debenture holders.
xii) According to the information and explanations given to us and based on the documents and records produced to us, the Company has not granted loans and advances on the basis of security by way of pledge of shares, debentures and other securities.
xiii) In our opinion, the Company is not a chit fund or a nidhi/ mutual benefit fund / society. Therefore, the provisions of clause 4(xiii) of the Order are not applicable to the Company.
xiv) In our opinion, the Company is not dealing in or trading in shares, securities, debentures and other investments. Accordingly, the provisions of clause 4(xiv) of the Companies (Auditor’s Report) Order, 2003 (as amended) are not applicable to the Company.
xv) According to the information and explanations given to us, the Company has not given any guarantee for loans taken by others from banks or financial institutions.
xvi) Based on information and explanations given to us by the management, term loans were applied for the purpose for which the loans were obtained.
xvii) According to the information and explanations given to us and on overall examination of the balance sheet and cash flow statement of the Company, we report that no funds raised on short-term basis have been used for long term investments.
xviii) The Company has not made any preferential allotment of shares to parties or companies covered in the register maintained under Section 301 of the Companies Act, 1956.
xix) The Company has unsecured ‘Zero Coupon Convertible Bonds due 2011’ outstanding during the year on which no security or charge is required to be created.
xx) We have verified that the end use of money raised by public issues is as disclosed in the notes to the financial statements (Refer Note 3(iii) of Schedule XXC to Financial Statements).
xxi) Based upon the audit procedures performed for the purpose of reporting the true and fair view of the financial statements and as per the information and explanations given by the management, we report that no fraud on or by the Company has been noticed or reported during the course of our audit.
For S.R. Batliboi & Co.
Chartered Accountants
per Manoj Gupta
New Delhi Partner
May 27, 2009 Membership No. 83906
ANNEXURE TO THE AUDITORS’ REPORT
Name of Nature Amount (Rs.) Period to Forum where the statute of dues which the dispute amount relates is pending
Income Tax Demand raised by 50,000 Assessment Appeal pending Act, 1961 Assessing Officer Year 2005-06 with CIT (Appeals)
Income Tax Demand raised by 60,557 Assessment Appeal pending Act, 1961 Assessing Officer Year 2006-07 with CIT (Appeals)The Finance Demand raised by 29,789,842 Financial Year Pending with Act, 1994 Assessing Officer 2003-04 to 2007-08 Assessing Officer
Panacea Biotec • Annual Report 2008-0967

Panacea Biotec • Annual Report 2008-0968
Amount in Rs.
Schedule As at As at No. 31st March, 2009 31st March, 2008
BALANCE SHEET AS AT 31st MARCH, 2009
The Schedules referred to above and notes thereon form an integral part of the Balance Sheet.
As per our attached report of even date
S.R. Batliboi & Co. For and on behalf of the BoardChartered Accountants Ravinder Jain Managing Directorper Manoj GuptaPartner I.K. Sharma Dr. Rajesh JainMembership No. 83906 D.G.M. (Accounts & Finance) Joint Managing Director
Place : New Delhi Vinod GoelDated : May 27, 2009 G.M. Legal & Company Secretary
SOURCES OF FUNDS
1 Shareholders’ Funds
Share Capital I 66,786,312 66,786,312
Reserves and Surplus II 6,084,706,629 6,151,492,941 6,905,260,347 6,972,046,659
2 Loan Funds
Secured Loans III 4,835,939,044 2,070,352,415
Unsecured Loans IV 2,166,996,000 7,002,935,044 1,912,075,828 3,982,428,243
3 Deferred Tax Liability (Net) 333,785,665 595,029,653
(Refer note no.7 of Schedule XXC)
Total 13,488,213,650 11,549,504,555
APPLICATION OF FUNDS
1 Fixed Assets V
Gross Block 7,411,174,436 4,658,106,038
Less : Depreciation/Amortisation 2,170,081,361 1,476,040,319
Net Block 5,241,093,075 3,182,065,719
Capital Work-in-Progress (including Capital Advances) 1,697,610,032 6,938,703,107 2,161,628,242 5,343,693,961
2 Investments VI 2,165,697,596 2,049,308,818
3 Foreign Currency Monetary item Translation 95,961,134 - Difference Account (net of amortisation) (Refer note no.2 of Schedule XXB and note no.19 of Schedule XXC)
4 Current Assets, Loans & Advances VII
Inventories 4,478,012,741 2,116,423,533
Sundry Debtors 1,238,801,509 1,482,608,423
Cash and Bank Balances 594,809,396 1,411,802,807
Other Current Assets 54,409,736 29,548,820
Loans and Advances 1,303,765,120 404,505,998
Sub-total (A) 7,669,798,502 5,444,889,581
Less : Current Liabilities and Provisions VIII
Current Liabilities 1,528,090,478 1,077,957,657
Provisions 1,857,508,130 215,764,467
Sub-total (B) 3,385,598,608 1,293,722,124
Net Current Assets (A)-(B) 4,284,199,894 4,151,167,457
5 Miscellaneous Expenditure IX 3,651,919 5,334,319
(To the extent not written off or adjusted)
Total 13,488,213,650 11,549,504,555
Significant Accounting Policies and Notes XX to Accounts
Panacea Biotec • Annual Report 2008-0968

Panacea Biotec • Annual Report 2008-0969
PROFIT & LOSS ACCOUNT FOR THE YEAR ENDED ON 31st MARCH, 2009 Amount in Rs.
Schedule For the year ended For the year ended No. 31st March, 2009 31st March, 2008
The Schedules referred to above and notes thereon form an integral part of the Profit & Loss Account.
As per our attached report of even date
S.R. Batliboi & Co. For and on behalf of the BoardChartered Accountants Ravinder Jain Managing Directorper Manoj GuptaPartner I.K. Sharma Dr. Rajesh JainMembership No. 83906 D.G.M. (Accounts & Finance) Joint Managing Director
Place : New Delhi Vinod GoelDated : May 27, 2009 G.M. Legal & Company Secretary
INCOME
Turnover (Gross) X 7,753,017,108 8,342,198,952
Less: Excise Duty 18,845,112 7,734,171,996 37,756,574 8,304,442,378
Other Income XI 259,677,471 371,741,692
Total 7,993,849,467 8,676,184,070
EXPENDITURE
Purchases of Traded Goods 155,870,989 172,969,336
Raw and packing material consumed XII 2,951,977,608 3,463,719,981
Operating and other expenses XIII 3,350,885,603 745,519,847
(Increase)/ Decrease in inventories XIV (446,904,922) 21,787,534
Personnel Expenses XV 916,095,844 924,897,239
Selling and Distribution Expenses XVI 434,544,751 451,093,211
Research and Development Expenses XVII 669,944,045 541,856,120
Financial Expenses XVIII 347,420,187 150,139,383
Depreciation/ Amortisation V 536,073,835 298,660,739
Miscellaneous Expenditure written off IX 1,682,400 1,682,400
during the year
Total 8,917,590,340 6,772,325,790
Profit / (Loss) before tax (923,740,873) 1,903,858,280
Provision for Income Tax - 330,000,000
Deferred Income Tax (Credit)/ Charge (261,243,988) 211,160,506
(Refer note no.7 of Schedule XXC)
Provision for Fringe Benefit Tax 28,000,000 31,000,000
Profit / (Loss) after Tax (690,496,885) 1,331,697,774
Add : Balance brought forward from previous year 2,845,720,793 1,725,221,144
Profit available for Appropriations 2,155,223,908 3,056,918,918
APPROPRIATIONS
Dividend
Equity Shares - Proposed (not liable to TDS) - 66,693,746
Dividend Distribution Tax - 11,334,602
Transfer to General Reserve - 133,169,777
Balance carried to Balance Sheet 2,155,223,908 2,845,720,793
Basic Earnings per Share XIX (10.35) 20.14
Diluted Earnings per Share XIX (10.35) 18.85
Face/ Nominal Value per Share 1.00 1.00
Significant Accounting Policies and Notes XX
to Accounts
Panacea Biotec • Annual Report 2008-0969
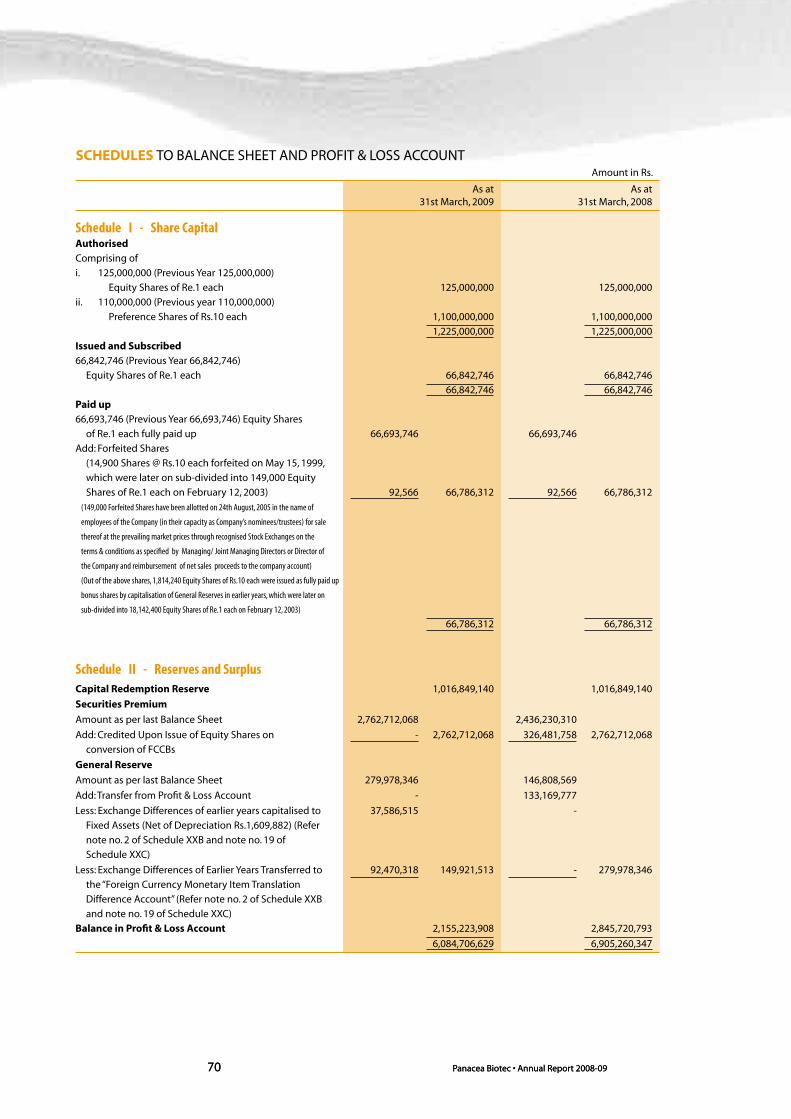
Panacea Biotec • Annual Report 2008-0970
Amount in Rs.
As at As at 31st March, 2009 31st March, 2008
SCHEDULES TO BALANCE SHEET AND PROFIT & LOSS ACCOUNT
Schedule I - Share CapitalAuthorisedComprising of
i. 125,000,000 (Previous Year 125,000,000)
Equity Shares of Re.1 each 125,000,000 125,000,000
ii. 110,000,000 (Previous year 110,000,000)
Preference Shares of Rs.10 each 1,100,000,000 1,100,000,000
1,225,000,000 1,225,000,000
Issued and Subscribed66,842,746 (Previous Year 66,842,746)
Equity Shares of Re.1 each 66,842,746 66,842,746
66,842,746 66,842,746
Paid up66,693,746 (Previous Year 66,693,746) Equity Shares
of Re.1 each fully paid up 66,693,746 66,693,746
Add: Forfeited Shares
(14,900 Shares @ Rs.10 each forfeited on May 15, 1999,
which were later on sub-divided into 149,000 Equity
Shares of Re.1 each on February 12, 2003) 92,566 66,786,312 92,566 66,786,312
(149,000 Forfeited Shares have been allotted on 24th August, 2005 in the name of
employees of the Company (in their capacity as Company’s nominees/trustees) for sale
thereof at the prevailing market prices through recognised Stock Exchanges on the
terms & conditions as specified by Managing/ Joint Managing Directors or Director of
the Company and reimbursement of net sales proceeds to the company account)
(Out of the above shares, 1,814,240 Equity Shares of Rs.10 each were issued as fully paid up
bonus shares by capitalisation of General Reserves in earlier years, which were later on
sub-divided into 18,142,400 Equity Shares of Re.1 each on February 12, 2003)
66,786,312 66,786,312
Schedule II - Reserves and SurplusCapital Redemption Reserve 1,016,849,140 1,016,849,140
Securities Premium
Amount as per last Balance Sheet 2,762,712,068 2,436,230,310
Add: Credited Upon Issue of Equity Shares on - 2,762,712,068 326,481,758 2,762,712,068
conversion of FCCBs
General Reserve
Amount as per last Balance Sheet 279,978,346 146,808,569
Add: Transfer from Profit & Loss Account - 133,169,777
Less: Exchange Differences of earlier years capitalised to 37,586,515 -
Fixed Assets (Net of Depreciation Rs.1,609,882) (Refer
note no. 2 of Schedule XXB and note no. 19 of
Schedule XXC)
Less: Exchange Differences of Earlier Years Transferred to 92,470,318 149,921,513 - 279,978,346
the “Foreign Currency Monetary Item Translation
Difference Account” (Refer note no. 2 of Schedule XXB
and note no. 19 of Schedule XXC)
Balance in Profit & Loss Account 2,155,223,908 2,845,720,793
6,084,706,629 6,905,260,347
Panacea Biotec • Annual Report 2008-0970

Panacea Biotec • Annual Report 2008-0971
SCHEDULES TO BALANCE SHEET AND PROFIT & LOSS ACCOUNT Amount in Rs.
As at As at 31st March, 2009 31st March, 2008
Schedule III - Secured Loans1. Foreign Currency Term Loans (from Banks)
i) State Bank of India 2,028,800,000 802,100,000
(Due within one year Rs. nil (Previous Year Rs. nil))
Interest Accrued and Due 12,416,668 4,974,265
ii) State Bank of Travancore 1,272,932,614 1,006,525,285
(Due within one year Rs. nil (Previous Year Rs. nil))
2. Working Capital Loans from Scheduled Banks 1,521,789,762 256,752,865
4,835,939,044 2,070,352,415
Notes:
1. Foreign Currency Term Loans from State Bank of India and State Bank of Travancore are secured by way of first pari-passu charge by hypothecation
of the Company’s entire movables fixed assets, both present and future and mortgage of immovable properties of the Company being land
admeasuring 96 bighas, 19 biswas & 93 bighas 12 biswas & 10 Biswasi situated at Village Samalheri, Tehsil Dera Bassi, District S.A.S. Nagar (Mohali)
(formerly Tehsil Rajpura, District Patiala), Punjab.The process for creation of first pari-passu charge by way of mortgage of immovable properties
situated at Baddi, Himanchal Pradesh is in progress. Foreign Currency Term Loans from State Bank of India is also collaterally secured by personal
guarantees of the Promoter-Directors of the Company, viz. Mr. Soshil Kumar Jain, Mr. Ravinder Jain, Dr. Rajesh Jain and Mr. Sandeep Jain.
2. Working Capital Loans from Scheduled Banks are secured by way of first pari-passu charge by hypothecation of all current assets and also by way of
2nd pari-passu charge on all the movable fixed assets(including machinery and spares) of the company and existing immovable fixed assets of the
Company being land admeasuring 96 bighas, 19 biswas & 93 bighas 12 biswas & 10 Biswasi situated at Village Samalheri, Tehsil Dera Bassi, District
S.A.S. Nagar (Mohali) (formerly Tehsil Rajpura, District Patiala), Punjab. The process for creation of second pari-passu charge by way of mortgage
of immovable properties situated at Baddi, Himanchal Pradesh is in progress. These are also collaterally secured by personal guarantees of the
Promoter-Directors of the Company, viz. Mr. Soshil Kumar Jain, Mr. Ravinder Jain, Dr. Rajesh Jain and Mr. Sandeep Jain.
Schedule IV - Unsecured LoansFixed Deposits* 300,500,000 436,110,000
(Due within one year Rs.55,000,000
(Previous year Rs.432,500,000))
Interest accrued and due - 101,828
Other Loans:
Foreign Currency Convertible Bonds**
US$ 36,800,000 (Previous Year US$ 36,800,000) 1,866,496,000 1,475,864,000
Zero Coupon Convertible Bonds due 2011
(Due within one year Rs. nil (Previous Year Rs. nil))
2,166,996,000 1,912,075,828
Note:
* includes Rs.300,000,000 (Previous Year Rs.432,500,000) from partnership firm in which some directors and their relatives are partner.
** Unless previously converted, redeemed or repurchased & cancelled, the remaining FCCBs of US $ 36,800,000,which were issued on 13.02.2006, will
be redeemed on Feb 14, 2011 at 142.80% of their outstanding principal amount.
Panacea Biotec • Annual Report 2008-0971

Panacea Biotec • Annual Report 2008-0972
Sche
dule
V -
Fix
ed A
sset
s
(Am
ount
in R
s.)
DESC
RIPT
ION
GROS
S BLO
CK
DEPR
ECIA
TION
/AM
ORTI
SATI
ON
NET B
LOCK
As
At
Addi
tions
Sa
le/A
djus
tmen
t Ot
her
As A
t As
At
Prov
ided
Sa
le /
Othe
r As
At
As A
t As
At
01
/04/
2008
du
ring
durin
g M
ovem
ents
**
31/0
3/20
09
01/0
4/20
08
durin
g Ad
just
men
ts
Mov
emen
ts**
31
/03/
2009
31
/03/
2009
31
/03/
2008
th
e Yea
r*
the Y
ear
th
e Yea
r du
ring
the Y
ear
A. Ta
ngib
le A
sset
s
Land
- Fr
eeho
ld
211,
268,
961
109,
797,
298
27,5
29,9
75
(45,
339)
29
3,49
0,94
5 -
- -
- -
293,
490,
945
211,
268,
961
Land
- Le
aseh
old
16,3
95,6
90
38,4
36,5
40
- -
54,8
32,2
30
461,
198
371,
417
- -
832,
615
53,9
99,6
15
15,9
34,4
92
Build
ings
93
5,35
9,58
0 80
1,20
8,23
4 1,
299,
258
(1,5
52,9
44)
1,73
3,71
5,61
2 19
5,40
1,78
1 11
6,14
7,31
3 22
,185
(1
55,2
94)
311,
371,
615
1,42
2,34
3,99
7 73
9,95
7,79
9
Leas
edho
ld Im
prov
emen
t 76
,765
,577
1,
717,
923
- (5
56)
78,4
82,9
44
64,2
83,5
01
7,06
2,58
6 -
(56)
7
1,34
6,03
1 7,
136,
913
12,4
82,0
76
Plan
t & M
achi
nery
2,
562,
816,
962
1,69
2,78
9,32
5 7,
260,
437
(9,6
74,5
42)
4,23
8,67
1,30
8 78
7,19
7,23
8 45
9,04
4,57
7 3,
865,
000
(1,3
45,7
29)
1,24
1,03
1,08
6 2,
997,
640,
222
1,77
5,61
9,72
4
Furn
iture
& Fi
tting
s 22
7,96
5,25
7 60
,175
,931
76
,076
(1
79,8
70)
287,
885,
242
101,
858,
862
33,1
41,3
24
(60,
741)
(3
2,55
6)
135,
028,
371
152,
856,
871
126,
106,
395
Vehi
cles
119,
594,
971
27,6
78,9
65
8,42
9,47
6 (3
2,53
8)
138,
811,
922
58,6
10,4
49
19,1
19,9
52
5,46
1,66
7 (8
,424
) 72
,260
,310
66
,551
,612
60
,984
,522
Offic
e Equ
ipm
ents
17
9,87
3,88
2 25
,174
,489
-
(61,
083)
20
4,98
7,28
8 65
,137
,502
19
,191
,198
51
,289
(8
,497
) 84
,268
,914
12
0,71
8,37
4 11
4,73
6,38
0
Com
pute
r Equ
ipm
ents
14
3,23
5,78
4 24
,015
,362
19
6,66
6 (1
48,3
14)
166,
906,
166
98,1
88,4
98
24,3
92,9
65
112,
023
(59,
326)
12
2,41
0,11
4 44
,496
,052
45
,047
,286
TOTA
L 4,
473,
276,
664
2,78
0,99
4,06
7 44
,791
,888
(1
1,69
5,18
6)
7,19
7,78
3,65
7 1,
371,
139,
029
678,
471,
332
9,45
1,42
3 (1
,609
,882
) 2,
038,
549,
056
5,15
9,23
4,60
1 3,
102,
137,
635
Capi
tal W
ork i
n Pr
ogre
ss
1,04
9,89
1,10
6 1,
730,
414,
107
PREV
IOUS
YEAR
3,
686,
176,
073
802,
170,
149
15,0
69,5
58
4,
473,
276,
664
973,
362,
236
405,
079,
585
7,30
2,79
2 -
1,37
1,13
9,02
9 3,
102,
137,
635
2,71
2,81
3,83
7
B. In
tang
ible
Ass
ets
Pate
nts, T
rade
mar
ks &
Des
igns
53
,618
,444
4,
584,
400
- -
58,2
02,8
44
43,3
90,5
36
3,03
0,79
0 -
- 46
,421
,326
11
,781
,518
10
,227
,908
Softw
ares
77
,328
,159
8,
076,
565
- -
85
,404
,724
40
,861
,450
13
,254
,435
(3
,105
) -
54,1
18,9
90
31,2
85,7
34
36,4
66,7
09
Web
site
9,20
2,69
5 -
- -
9,20
2,69
5 9,
202,
695
- -
- 9,
202,
695
- -
Prod
uct D
evel
opm
ent
44,6
80,0
76
15,9
00,4
40
- -
60,5
80,5
16
11,4
46,6
09
10,3
42,6
85
- -
21,7
89,2
94
38,7
91,2
22
33,2
33,4
67
TOTA
L 18
4,82
9,37
4 28
,561
,405
-
- 21
3,39
0,77
9 10
4,90
1,29
0 26
,627
,910
(3
,105
) -
131,
532,
305
81,8
58,4
74
79,9
28,0
84
Capi
tal W
ork i
n Pr
ogre
ss
647,
718,
926
431,
214,
135
PREV
IOUS
YEAR
14
0,38
7,00
5 44
,442
,369
-
- 18
4,82
9,37
4 79
,971
,960
24
,929
,330
-
- 10
4,90
1,29
0 79
,928
,084
60
,415
,045
TOTA
L (A+
B)
4,65
8,10
6,03
8 2,
809,
555,
472
44,7
91,8
88
(11,
695,
186)
7,
411,
174,
436
1,47
6,04
0,31
9 70
5,09
9,24
2 9,
448,
318
(1,6
09,8
82)
2,17
0,08
1,36
1 5,
241,
093,
075
3,18
2,06
5,71
9
Capi
tal W
ork i
n Pr
ogre
ss
1,69
7,61
0,03
2 2,
161,
628,
242
PREV
IOUS
YEAR
3,
826,
563,
078
846,
612,
518
15,0
69,5
58
- 4,
658,
106,
038
1,05
3,33
4,19
6 43
0,00
8,91
5 7,
302,
792
- 1,
476,
040,
319
3,18
2,06
5,71
9 2,
773,
228,
882
Note
s:
1. Fr
eeho
ld La
nd in
clude
s Lan
d am
ount
ing
to R
s.17,
285,
690
(Pre
vious
Year
Rs.
17,2
85,6
90) p
endi
ng re
gist
ratio
n in
the n
ame o
f the
Com
pany
.2.
Build
ing
inclu
des O
ffice
Pre
mise
s am
ount
ing
to R
s. 15
5,89
2,40
0(Pr
evio
us Ye
ar R
s. 1,
429,
032)
pen
ding
regi
stra
tion
in th
e nam
e of t
he Co
mpa
ny.
3. Pl
ant &
Mac
hine
ry in
clude
s Pla
nt &
Mac
hine
ry a
mou
ntin
g to
Rs.4
,543
,083
(Pre
vious
Year
Rs.5
,277
,132
) (N
et B
lock
) lyin
g w
ith th
ird p
artie
s.4.
Depr
ecia
tion
for t
he ye
ar in
clude
s Dep
recia
tion
on R
esea
rch &
Dev
elop
men
t Ass
ets a
mou
ntin
g to
Rs.1
69,0
25,4
07 (P
revio
us Ye
ar R
s.131
,348
,176
). 5.
Capi
tal W
ork i
n Pr
ogre
ss in
clude
s pre
-ope
rativ
e exp
endi
ture
. Ref
er N
ote N
o.4
of sc
hedu
le X
X C.
6. Al
l Int
angi
ble a
sset
s (ex
cept
Softw
ares
) are
inte
rnal
ly ge
nera
ted
Inta
ngib
le as
sets
.* I
nclu
des E
xcha
nge D
iffer
ence
s cap
italiz
ed d
urin
g th
e yea
r Rs.
730,
764,
477(
Prev
ious
year
Rs.
NIL)
.**
Exch
ange
diff
eren
ces L
oss /
(Gai
n) o
f ear
lier y
ears
capi
taliz
ed d
urin
g th
e yea
r.
SCHEDULES TO BALANCE SHEET AND PROFIT & LOSS ACCOUNT
Panacea Biotec • Annual Report 2008-0972

Panacea Biotec • Annual Report 2008-0973
Amount in Rs.
As at As at 31st March, 2009 31st March, 2008
SCHEDULES TO BALANCE SHEET AND PROFIT & LOSS ACCOUNT
Schedule VI - InvestmentsLong Term Investments (at cost)
Trade - Unquoted
1) Subsidiary Companies :
a) 1,902,160 (Previous Year 1,902,160) Equity Shares of Re.1 each fully paid in Best On Health Ltd. 22,883,050 22,883,050
b) 6,636,666 (Previous Year 5,970,000), 0.5% Optionally Convertible Non-Cumulative Redeemable Preference Shares of Re.1 each fully paid in Best On Health Ltd. 1,990,999,800 1,791,000,000
c) 5 (Previous Year Nil) Equity Shares of AED 100,000 each fully paid in Panacea Biotec FZE. 5,474,520 -
d) 3,765,701(Previous Year Nil) Equity Shares of Rs.10 each Rs.2.70 paid up in Umkal Medical Institute Pvt. Ltd. 76,143,604 -
e) Investment in Equity Shares (Previous Year Nil) of Panacea Biotec GmbH 1,582,250 -
f ) 1,000 (Previous Year Nil) Equity Shares of US $0.01 each fully paid up in Rees Investments Limited 476 2,097,083,700 - 1,813,883,050
2) Joint Venture Companies :
a) 2,295,910 (Previous Year 2,295,910) Equity Shares of Rs.10 each fully paid up in Chiron Panacea Vaccines Pvt. Ltd. 22,959,100 22,959,100
b) 4,608,608 (Previous Year 4,608,608) Ordinary Shares of GBP 0.01 (Face Value) each fully paid up in Cambridge Biostability Limited, U.K. 168,068,998 168,068,998
Less : Provision for Permanent Diminution in the value of Investments [Refer note no.13 (e) of Schedule XX C] 168,068,998 22,959,100 - 191,028,098
3) 419,767 (Previous Year 419,767) Equity Shares of Rs.10 each fully paid in PanEra Biotec Pvt. Ltd. (formerly known as Panheber Biotec Pvt. Ltd.) 4,197,670 4,197,670
4) 20,000 (Previous Year 20,000) Equity Shares of Rs.10 each fully paid up in Shivalik Solid Waste Management Ltd. 200,000 200,000
Non-Trade - Unquoted
1) Investment in Capital of Partnership Firm - 40,000,000
Lakshmi & The Manager
2) 41,257,126 (Previous Year Nil) Equity Shares of Re.1 each fully paid up in Lakshmi & Manager Holdings Ltd* 41,257,126 -
2,165,697,596 2,049,308,818
*Company under the same management as defined under section 370 (1B) of the Companies Act, 1956
Notes: 1. The aggregate amount of unquoted investments is Rs.2,165,697,596 (net of Provision for Permanent Diminution in the value of Investments of
Rs.168,068,998) (Previous year Rs.2,049,308,818).2. The Company has formed a new subsidiary Panacea Biotec Inc. in USA. Even though the subsidiary has been incorporated, no investment has yet
been made as on March 31, 2009.3. The names of all the partners of the Partnership Firm, ‘Lakshmi & The Manager’, total capital of the firm and the share of each partner was as under: Partners Capital Sharing Ratio Panacea Biotec Ltd. 40,000,000 40% Mr. Ravinder Jain 19,000,000 19% Mrs. Radhika Jain 20,000,000 20% Mrs. Sunanda Jain 18,000,000 18% Mrs. Meena Jain 2,000,000 2% Mrs. Shilpy Jain 1,000,000 1% Total 100,000,000 100%
Panacea Biotec • Annual Report 2008-0973

Panacea Biotec • Annual Report 2008-0974
SCHEDULES TO BALANCE SHEET AND PROFIT & LOSS ACCOUNT Amount in Rs.
As at As at 31st March, 2009 31st March, 2008
Schedule VII - Current Assets, Loans & AdvancesInventoriesi) Raw Materials (including Packing Materials) 3,206,780,619 1,320,981,788 (Including lying with third parties Rs.34,062,940 (Previous Year Rs.57,098,748))ii) Finished Goods 985,858,105 684,208,806 (Including goods in transit of Rs.1,192,568 (Previous Year Rs. Nil) & lying with third parties Rs.844,654 (Previous Year Rs.187,528)iii) Work in Progress (Including lying with third parties 202,833,537 57,577,914 Rs.67,135,348 (Previous Year Rs.9,268,214))iv) Stores & Spare Parts 82,540,480 4,478,012,741 53,655,025 2,116,423,533Sundry Debtors (Refer note no 8 (i) & (iii) of Schedule XX C) (Unsecured, Considered good, unless otherwise stated) Over six months (including Rs.3,108,712 considered doubtful of recovery (Previous year Rs.2,858,916)) 83,409,270 9,572,864Others Debts 1,158,500,951 1,475,894,475 1,241,910,221 1,485,467,339Less : Provision for Bad & Doubtful Debts 3,108,712 1,238,801,509 2,858,916 1,482,608,423Cash and Bank Balancesi) Cash balance on hand 579,589 1,449,297ii) Balance with scheduled banks a) On Current Accounts 25,557,539 33,723,242 b) On Unpaid Dividend Accounts* 1,583,956 1,536,608 c) On Fixed Deposits** 70,467,843 1,250,968,300 d) On Exchange Earner Foreign Currency 496,620,469 594,809,396 124,125,360 1,411,802,807 Current Accounts *Not available for use by the company as they represent corresponding unpaid dividend liabilities**Fixed Deposits amounting to Rs.1,024,123 (previous year Rs.968,300) are pledged with Banks and various Government Authorities.
Other Current AssetsExport Benefits receivable 25,521,973 19,402,794Interest accrued but not due on Loans & Deposits 36,163,233 10,146,026Less : Provision for doubtful of recovery (Refer note no.13 (e) 7,275,470 54,409,736 - 29,548,820 of Schedule XX C)) Loans and Advances(Unsecured, considered good, unless otherwise stated)Advances recoverable in cash or in kind or for value to 116,431,593 103,463,997 be received (Including Rs.818,322 (Previous Year Rs.818,322 ) considered doubtful))Due from PanEra Biotec Pvt. Ltd. (Formerly known as 153,950,194 135,532,654 Panheber Biotec Private Ltd.) * (Including Rs.135,532,654 (Previous Year Rs.135,532,654) considered doubtful))Balance with Excise, Custom etc. 15,027,362 24,870,402Loans & Advances to Subsidiary Company ** 710,811,071 -Loan to Joint Venture Company 108,833,850 39,778,050Staff Loans & Advances (including Rs.4,191,959 16,333,010 18,245,508 (Previous Year Rs.4,191,959) considered doubtful)) 1,121,387,080 321,890,611Less : Provision for Doubtful Loans & Advances (Refer note 108,833,850 - no.13 (e) of Schedule XX C)Less : Provision for Bad & Doubtful Advances 140,542,935 140,542,935 872,010,295 181,347,676Security Deposits 20,534,409 21,892,190Advance Income Tax (Net of Provision of Rs.1,168,500,000 411,220,416 1,303,765,120 201,266,132 404,505,998 (Previous year Rs.1,168,500,000)) 7,669,798,502 5,444,889,581
*Company`s two Directors are also directors in PanEra Biotec Private Limited (Formerly Known as Panheber Biotec Pvt. Ltd.). **Advances include due from Company under the Same Management (wholly owned subsidiary company) as defined under section 370(1B) of the Companies Act, 1956. Refer note no.8(i) & (ii) of Schedule XX C.
Panacea Biotec • Annual Report 2008-0974

Panacea Biotec • Annual Report 2008-0975
Amount in Rs.
As at As at 31st March, 2009 31st March, 2008
SCHEDULES TO BALANCE SHEET AND PROFIT & LOSS ACCOUNT
Amount in Rs.
For the year ended For the year ended 31st March, 2009 31st March, 2008
Schedule X - TurnoverSales 7,730,417,599 8,338,331,922Services (R&D Income) 1,699,562 3,867,030Income from Contract Manufacturing 20,899,947 - 7,753,017,108 8,342,198,952
Schedule VIII - Current Liabilities & ProvisionsA. Liabilities
i) Acceptances 1,115,093,540 336,979,264
ii) Sundry Creditors
a) Dues to Micro & Small Enterprises 1,274,843 1,177,455 (Refer note no.6 of Schedule XX C)
b) Dues to other than Micro & Small Enterprises 358,326,378 631,043,756
iii) Payable to Subsidiary Company 202,620 3,079,105
iv) Advances from Customers 5,367,817 7,595,465
v) Deposits from C & F Agents 15,195,000 15,158,000
vi) Unpaid dividend on Equity Shares* 1,585,056 1,536,608
vii) Other Liabilities 31,002,816 81,388,004
viii) Interest accrued but not due on Loans / Deposits 42,408 1,528,090,478 - 1,077,957,657 * This amount does not include amount due/outstanding
to be credited to Investor Education & Protection Fund, same shall be credited as and when due
B. Provisions
i) Provision for Wealth Tax 913,479 832,746
ii) Provision for Fringe Benefit Tax (Net of Advance 5,045,455 2,349,330 payment of Rs.100,954,545 (Previous year Rs.75,650,670))
iii) Proposed Dividend on Equity Shares - 66,693,746
iv) Provision for Dividend Distribution Tax - 11,334,602
v) Provision for Gratuity 56,754,771 57,679,075
vi) Provision for Leave Encashment 51,690,425 36,374,968
vii) Provision for Open Derivative Contracts 1,743,104,000 1,857,508,130 40,500,000 215,764,467
3,385,598,608 1,293,722,124
Schedule IX - Miscellaneous Expenditure(To the extent not written off or adjusted)
i) License fees
As per last Balance Sheet 5,334,319 7,016,719
Less: Written off during the year 1,682,400 3,651,919 1,682,400 5,334,319
3,651,919 5,334,319
Panacea Biotec • Annual Report 2008-0975

Panacea Biotec • Annual Report 2008-0976
SCHEDULES TO BALANCE SHEET AND PROFIT & LOSS ACCOUNT Amount in Rs.
For the year ended For the year ended 31st March, 2009 31st March, 2008
Schedule XI - Other IncomeInterest received - - from Banks (Tax deducted at source Rs.25,897,168 (Previous year Rs.8,955,419)) 121,771,587 42,725,158 - from Inter Company Loans / Deposits (Tax deducted at 45,756,516 3,093,565 source Rs. Nil (Previous year Rs.226,646)) - on Income Tax Refund - 6,527,472 - from others* (Tax deducted at source Rs. Nil (Previous year Rs. Nil)) 534,417 189,117Export Incentives 30,855,454 24,814,711Miscellaneous Balances/ Provisions written back - 123,151,118Sale of Scrap 1,779,942 1,769,296Lease Rent 17,823,031 1,138,945Profit on Sale of Fixed Assets (Net of loss Rs.2,039,733 7,171,144 22,887,632 (Previous year Rs.770,491))Foreign Exchange Fluctuation Gain (Net of loss Rs. Nil (Previous year Rs.125,552,613)) - 124,807,357 Profit on Sale of Long Term Trade Investments - 8,062,060Share of Profit From Partnership Firm, in which Company was Partner 1,257,126 -Insurance Claim Received 4,430,371 8,283,596Royalty Income 9,266,380 1,235,464Dividend Received From Long Term Trade Investments (Joint Venture) 18,367,280 -Miscellaneous Income 664,223 3,056,201 259,677,471 371,741,692*Interest from others includes Rs.87,800 (Previous year Rs.64,500) from employees, Rs.188,248 (Previous year Rs.124,617) from debtors Rs.258,369(Previous year Rs. Nil) from Excise department.
Schedule XII - Raw & Packing Material ConsumedRaw & Packing Materials consumed Opening Stock 1,320,981,788 1,256,131,191 Add : Material purchased during the year 4,857,397,558 3,561,460,905 6,178,379,346 4,817,592,096 Less : Closing Stock 3,206,780,619 1,320,981,788 2,971,598,727 3,496,610,308 Less: Material consumed for Research & Development 19,621,119 32,890,327 2,951,977,608 3,463,719,981
Schedule XIII - Operating and other ExpensesProcessing Charges 35,289,443 5,843,974Analytical Testing & Trial Charges 6,995,652 11,026,412Stores & Spare Parts consumed (Refer note no.4 of Schedule XX C) 57,939,559 45,981,822Power & Fuel (Refer note no.4 of Schedule XX C) 112,167,409 96,918,851Repair & Maintenance (Refer note no.4 of Schedule XX C) -Buildings 16,628,948 19,041,472 -Plant & Machinery 22,609,114 23,277,261 -Others 28,139,583 67,377,645 26,284,547 68,603,280Rent (Refer note no.4 of Schedule XX C) 53,248,013 51,749,980Royalty 14,742,764 4,385,550Directors’ Sitting Fees 345,000 340,000Printing & Stationery 40,206,382 31,434,720Postage & Communication expenses 45,366,215 39,061,671Insurance 41,379,420 42,761,472Travelling & Conveyance expenses (Refer note no.4 of Schedule XX C) 103,288,987 101,364,603Books & Periodicals 2,240,467 1,505,062Legal & Professional charges (Refer note no.4 of Schedule XX C) 108,984,641 72,094,552Vehicle Running & Maintenance 17,147,781 14,765,877Auditors’ Remuneration: (Refer note no.14 of Schedule XX C) -Statutory Audit Fee 3,309,000 3,400,060 -Limited Review Fees 1,685,400 1,348,320 -Out of pocket expenses 161,721 69,317 -Others 134,832 5,290,953 113,217 4,930,914Rates & Taxes (Refer note no.4 of Schedule XX C) 15,252,931 9,486,175Donation 3,408,970 6,550,004Subscription 13,700,941 12,226,353Staff Training & Recruitment 31,477,974 29,976,294Bad Debts & Advances written off 72,285 -Provision for Doubtful Debts & Advances 116,494,114 27,044,708Wealth Tax 936,368 832,746Foreign Exchange Fluctuation Loss {Net of Gain 557,888,608 - Rs.214,791,328 (Previous year Rs. Nil)}Provision for Loss on Open Derivative Contracts 1,702,604,000 40,500,000Provision for Permanent Diminution in the value of 168,068,998 - Investments (Refer note no.13 (e) of Schedule XX C))Miscellaneous expenses (Refer note no.4 of Schedule XX C) 28,970,083 26,134,827 3,350,885,603 745,519,847
Panacea Biotec • Annual Report 2008-0976

Panacea Biotec • Annual Report 2008-0977
Amount in Rs.
For the year ended For the year ended 31st March, 2009 31st March, 2008
SCHEDULES TO BALANCE SHEET AND PROFIT & LOSS ACCOUNT
Schedule XIV - (Increase)/ Decrease In InventoriesClosing Stock: Finished Goods 985,858,105 684,208,806 Work in Progress 202,833,537 1,188,691,642 57,577,914 741,786,720Less: Opening Stock Finished Goods 684,208,806 713,506,988 Work in Progress 57,577,914 741,786,720 50,067,266 763,574,254 (446,904,922) 21,787,534
Schedule XV - Personnel ExpensesSalary, Wages and Bonus* (Refer note no.4 of Schedule XX C) 837,086,165 834,390,802Contribution to Provident and other Funds 26,949,018 22,070,028Workmen/Staff Welfare expenses 39,995,607 35,339,196Gratuity 12,065,054 33,097,213 916,095,844 924,897,239* For Director’s Remuneration refer note no.5(a)
of Schedule XX C
Schedule XVI - Selling & Distribution ExpensesAdvertising & Sales Promotion 226,910,009 238,368,058Meetings & Conferences 62,306,063 93,088,068Freight & Cartage 64,098,422 61,294,777Commission on Sales (other than sole selling agents) 81,230,257 58,342,308 434,544,751 451,093,211
Schedule XVII - Research & Development ExpensesRaw Material & Packing Material consumed 19,621,119 32,890,327Stores & Spare Parts consumed 134,104,256 91,423,646Salary, Wages and Bonus 182,045,564 155,895,586Contribution to Provident & other Funds 4,096,340 3,607,381Workmen/Staff Welfare expenses 9,504,657 7,046,234Gratuity 1,062,491 3,287,690Analytical Testing & Trial charges 26,736,975 15,803,303Rent 6,401,077 7,569,467Printing & Stationery 2,212,425 2,591,736Postage & Communication 3,151,204 2,794,844Travelling expenses 15,897,191 12,638,102Books & Periodicals 6,317,043 3,966,683Legal & Professional expenses 12,052,167 9,158,686Vehicle Running & Maintenance 2,424,344 2,044,023Donation 30,251 1,880,651Repair & Maintenance : - Buildings 5,726,552 2,386,093 - Plant & Machinery 14,628,824 17,360,639 - Others 3,728,604 24,083,980 1,740,037 21,486,769Rates, Fees & Taxes 622,995 335,366Subscription 9,467,437 4,980,114Electricity & Water charges 33,714,494 22,390,252Meeting & Conferences 2,460,794 4,191,618Staff Training & Recruitment 765,564 815,807Bank charges - 65,407Depreciation 169,025,407 131,348,176Sundry expenses 4,146,270 3,644,252 669,944,045 541,856,120
Panacea Biotec • Annual Report 2008-0977

Panacea Biotec • Annual Report 2008-0978
SCHEDULES TO BALANCE SHEET AND PROFIT & LOSS ACCOUNT Amount in Rs.
For the year ended For the year ended 31st March, 2009 31st March, 2008
Schedule XVIII - Financial ExpensesInterest on: a) Fixed Loans 206,237,568 88,284,701b) Others (Including interest on Working Capital Loans) 114,833,232 321,070,800 28,039,320 116,324,021Bank charges 26,349,387 33,815,362 347,420,187 150,139,383
Schedule XIX - Earning Per ShareCalculation of Profit/ (Loss) for Basic EPSNet profit/ (Loss) before Tax (923,740,873) 1,903,858,280Less: Adjustment for Tax Expense (233,243,988) 572,160,506Net profit/ (Loss) for calculation of Basic EPS (690,496,885) 1,331,697,774Weighted average number of Equity Shares in 66,693,746 66,115,919 calculating basic EPSCalculation of Profit/ (Loss) for Diluted EPSNet profit/ (Loss) for calculation of basic EPS (690,496,885) 1,331,697,774Adjusted Net Profit/ (Loss) for calculating Diluted EPS (690,496,885) 1,331,697,774No. of Equity Shares resulting from conversion of Foreign Currency Convertible Bonds‘US$50 Million Zero Coupon Convertible Bonds due 2011’ 4,542,752 4,542,752 (Outstanding US$36.8 Million) at conversion price Rs.357.57Add: Weighted average number of Equity Shares in 66,693,746 66,115,919 calculating basic EPSWeighted average number of Equity Shares in 71,236,498 70,658,671 calculating diluted EPSBasic Earnings per Share (10.35) 20.14Diluted Earnings per Share (10.35) 18.85Face / Nominal Value per Share 1.00 1.00
Schedule XX - Significant Accounting Policies and Notes on Accounts
A. Nature of OperationsPanacea Biotec Limited is one of the India’s leading research based companies engaged in the business of research, development, manufacture and marketing of Vaccines and Branded Pharmaceutical Formulations. The Company has products for various segments, which include paediatric vaccines, pain management, diabetes management and organ transplantation.
B. Significant Accounting Policies1. Basis of Preparation
The financial statements have been prepared to comply in all material respects with the Notified Accounting Standards pursuant to Companies (Accounting Standards) Rules, 2006 and the relevant provisions of the Companies Act, 1956. The financial statements have been prepared under the historical cost convention on an accrual basis except in case of assets for which provision for impairment is made and revaluation is carried out. The accounting policies have been consistently applied by the Company and except for the changes in accounting policies discussed more fully below, are consistent with those used in the previous year.
2. Change in Accounting Policy
For the financial year ended 31st March, 2008, the Company was charging off exchange differences arising on foreign currency monetary assets and liabilities to profit and loss account. Pursuant to Companies (Accounting Standards) Amendments Rules, 2009, the Company has exercised the option of deferring the charge of exchange difference to the Profit and Loss Account, in respect of accounting periods commencing on or after 7th December, 2006, on long-term foreign currency monetary items (i.e. monetary assets or liabilities expressed in foreign currency and having a term of 12 months or more at the date of origination). As a result, such exchange differences so far as they relate to the acquisition of a depreciable capital asset have been adjusted with the cost of such asset and are being depreciated over the balance life of the asset, and in other cases, have been accumulated in Foreign Currency Monetary Item Translation Difference Account and are being amortized over the balance period of such long term asset/liability but not beyond, accounting period ending on or before 31st March 2011.
In the current year, such exchange differences, pertaining to accounting periods commencing on 1st April, 2007 and ending on 31st March, 2008 are transferred from General Reserve, to the extent they related to acquisition of depreciable capital assets are adjusted with the cost of such assets Rs.24,810,859 (net of depreciation of Rs.1,609,882) (net of tax of Rs.12,775,656) and in other cases, are transferred to the Foreign Currency Monetary Item Translation Difference Account Rs.61,039,657 (net of tax of Rs.31,430,661).
Panacea Biotec • Annual Report 2008-0978

Panacea Biotec • Annual Report 2008-0979
Had the Company continued to use the earlier basis of accounting for exchange differences arising on long-term foreign currency monetary items, the loss after tax for the current period would have been higher by Rs.561,174,198 (net of tax of Rs.288,960,930), the net block of fixed assets would have been lower by Rs.624,117,162 (net of depreciation of Rs.94,952,131) and general reserve would have been higher by Rs.130,056,833.
3. Use of Estimates
The presentation of financial statements in conformity with the Generally Accepted Accounting Principles requires management to make estimates and assumptions that affect the reported amount of assets and liabilities and disclosure of contingent liabilities at the date on the financial statements and the reported amount of revenues and expenses during the reporting period. Difference between the actual results and estimates are recognized in the period in which the results are known/ materialized.
4. Revenue Recognition
Revenue is recognized to the extent that it is probable that the economic benefits will flow to the Company and the revenue can be reliably measured.
Sale of Goods - Revenue is recognized when the significant risks and rewards of ownership of the goods have
passed to the buyer and is stated net of trade discounts, returns and Sales Tax /VAT but includes Excise Duty. Excise Duty deducted from turnover is the amount that is included in the amount of turnover (gross) and not the entire amount of liability arisen during the year.
Research & Development - Income from Research & Development Services is accounted for as per the stage of completion.
Contract Manufacturing - Revenue is recognized on an accrual basis in accordance with the term of the relevant agreement.
Interest - Revenue is recognized on a time proportion basis taking into account the amount outstanding and the rate applicable.
Dividends - Revenue is recognized when the shareholders’ right to receive payment is established by the balance sheet date. Dividend from subsidiaries is recognized even if same are declared after the Balance Sheet date but pertains to the period on or before the date of Balance Sheet, as per the requirements of Schedule VI to the Companies Act, 1956.
Royalties - Revenue is recognized on an accrual basis in accordance with the term of the relevant agreement.
Export Benefits - Export entitlements under Duty Entitlement Pass Book Schemes and Advance Licenses are recognized in the Profit & Loss Account when the right to receive credit as per terms of scheme is established in respect of export made and where there is no significant uncertainty regarding the ultimate collection of the relevant export proceeds.
5. Fixed Assets
Fixed assets are stated at cost less accumulated depreciation and impairment losses, if any. Cost comprises the purchase price and any attributable cost of bringing the asset to its working condition for its intended use. Borrowing costs relating to acquisition of fixed assets which takes substantial period of time to get ready for its intended use are also included to the extent they relate to the period till such assets are ready to be put to use.
As a result of change in Accounting Policy during the year (refer note no. 2 above) in respect of accounting periods commencing on or after 7th December, 2006, exchange differences arising on reporting of the long-term foreign currency monetary items at rates different from those at which they were initially recorded during the period, or reported in the previous financial statements are added to or deducted from the cost of the asset and are depreciated over the balance life of the asset, if these monetary items pertain to the acquisition of a depreciable fixed asset.
6. Impairment of Fixed Assets
The carrying amounts of assets are reviewed at each Balance Sheet date as to whether if there is any indication of impairment based on internal/external factors. An impairment loss is recognized wherever the carrying amount of an asset exceeds its recoverable amount. The recoverable amount is the greater of the assets net selling price and value in use. In assessing value in use, the estimated future cash flows are discounted to their present value at the weighted average cost of capital.
After impairment, depreciation is provided on the revised carrying amount of the assets over its remaining useful life.
7. Intangibles
Patents, Trademarks & Designs - Costs relating to patents, trademarks and designs, which are acquired, are capitalized.
Research and Development Costs - Research costs are expensed as incurred. Development expenditure incurred on an individual project is carried forward when its future recoverability can reasonably be regarded as assured.
Product Development – Product Development is capitalized on successful completion of development activities and commercial launch of developed products.
Technical Know how - Technical Know how is being capitalized on successful transfer of technology when its future recoverability can reasonably be regarded as assured.
Software and Website - Software and website is stated at cost of acquisition and includes all attributable costs of bringing them to their working condition for their intended use.
The carrying value of intangible assets is reviewed for impairment annually when the asset is not yet in use, and otherwise when events or changes in circumstances indicate that the carrying value may not be recoverable.
8. Depreciation / amortization
a) Depreciation on fixed assets is provided on written down value method as per the rates based on the useful life of the assets estimated by the management, or as per rates prescribed in Schedule XIV to the Companies Act, 1956 whichever is higher. Depreciation is provided on the following rates:
SCHEDULES TO BALANCE SHEET AND PROFIT & LOSS ACCOUNT
Panacea Biotec • Annual Report 2008-0979

Panacea Biotec • Annual Report 2008-0980
b) Amortization on intangibles is provided on the basis of the estimated useful lives as follows:-Software - Amortized on straight line basis over a period of 5 years.Websites - Amortized on straight line basis over a period of 2 years.Patents, Trade Marks & Designs - Amortized on straight line basis over a period of 7 years.Product Development - Amortized on straight line basis over a period of 5 years.Technical Know-how - Amortized on straight line basis over a period of 5 years.
c) Leasehold Land is depreciated over the period of lease or useful life, whichever is shorter.
d) Leasehold Improvements are amortized over the initial period of lease or useful life, whichever is shorter.
9. Borrowing Costs
Borrowing costs attributable to the acquisition, construction or production of a qualifying asset are capitalized as part of the cost of that asset. Borrowing costs, which are not relatable to qualifying assets, are recognized as an expense in the period in which they are incurred.
10. Leases
Where the Company is the Lessee
Leases, where the lessor effectively retains substantially all the risks and benefits of ownership of the leased term, are classified as operating leases. Operating lease payments are recognized as an expense in the Profit and Loss account on a straight-line basis over the lease term.
Where the Company is the Lessor
Assets subject to operating leases are included in fixed assets. Lease income is recognized in the Profit and Loss Account on a straight-line basis over the lease term. Costs, including depreciation are recognized as an expense in the Profit and Loss Account. Initial direct costs such as legal costs, brokerage costs, etc. are recognized immediately in the Profit and Loss Account.
11. Deferred Revenue Expenditure
Expenditure incurred prior to April 1, 2003 towards procuring license for new products is written off over the period of agreement or ten years whichever is shorter. Expenditure of the similar nature incurred during the year is charged off to revenue.
12. Investments
Investments that are readily realizable and intended to be held for not more than a year are classified as current investments. All other investments are classified as long-term investments. Current investments are carried at lower of cost and fair value determined on an individual investment basis. Long-term investments are carried at cost. However, provision for diminution, if any, in value is made to recognize a decline other than temporary in the value of the investments.
13. Inventories
Finished Goods, Work in Progress, Goods held for Resale, Raw Materials, Packing Materials and Stores & Spares are stated at lower of cost and net realizable value. However, materials and other items held for use in the production of inventories are not written down below cost if the finished goods in which they will be incorporated are expected to be sold at or above cost.
‘Cost’ of Finished Goods, Work in progress, Raw Materials, Packing Materials and Stores & Spares is arrived at by using ‘Moving Average Price’ method.
Cost of Work in Progress and Finished Goods is determined by considering direct material cost and appropriate portion of manufacturing overheads based on normal operating capacity. Cost of traded goods is arrived at by using ‘Moving Average Price’ method. Cost of finished goods includes Excise Duty.
Net realizable value is the estimated selling price in the ordinary course of business, less estimated costs of completion and to make the sale.
14. Retirement and Other Benefits
a) Retirement benefits in the form of Provident Fund are defined contribution scheme and the contributions are charged to the Profit and Loss Account of the year when the contributions to the respective funds are due. There are no other obligations other than the contribution payable to the respective funds.
b) The contribution to Gratuity Fund, which is a defined benefit plan, is expensed on the basis of funding claims of the fund manager, Life Insurance Corporation of India. At the end of the accounting year, actuarial valuation is done as per projected unit credit method by an independent Actuary and any shortfall in the fund balance is further provided for.
c) Short term compensated absences are provided for based on estimates. Long term compensated absences are provided for based on actuarial valuation done as per projected unit credit method.
Leave encashment payable /adjustable during the year is provided on the basis of last salary drawn by employees.
Actuarial gains/losses are adjusted in Profit & Loss Account and are not deferred.
SCHEDULES TO BALANCE SHEET AND PROFIT & LOSS ACCOUNT
Tangibles Assets WDV %
Building – Factory 10.00Building – Office Premises 5.00Plant & Machinery 13.91Furniture & Fittings 18.10Vehicles 25.89Office Equipments 13.91Computer Equipments 40.00
Panacea Biotec • Annual Report 2008-0980

Panacea Biotec • Annual Report 2008-0981
15. Foreign Currency Transactions
Initial Recognition
Foreign currency transactions are recorded in the reporting currency, by applying to the foreign currency amount, the exchange rate between the reporting currency and the foreign currency at the date of the transaction.
Conversion
Foreign currency monetary items are reported using the closing rate. Non-monetary items which are carried in terms of historical cost denominated in a foreign currency are reported using the exchange rate at the date of the transaction and non-monetary items which are carried at fair value or other similar valuation denominated in a foreign currency are reported using the exchange rates that existed when the values were determined.
Exchange Differences
Exchange differences arising on the settlement of monetary items or on reporting such monetary items at rates different from those at which they were initially recorded during the year, or reported in previous financial statements, are recognized as income or as expenses in the year in which they arise except those monetary items as mentioned below.
Exchange differences, in respect of accounting periods commencing on or after 7th December, 2006, arising on reporting of long-term foreign currency monetary items at rates different from those at which they were initially recorded during the period, or reported in previous financial statements, in so far as they relate to the acquisition of a depreciable capital asset, are added to or deducted from the cost of the asset and are depreciated over the balance life of the asset, and in other cases, are accumulated in a “Foreign Currency Monetary Item Translation Difference Account” in the financial statements and amortized over the balance period of such long-term asset/liability but not beyond accounting period ending on or before 31st March, 2011.
Exchange differences arising on a monetary item that, in substance, form part of company’s net investment in a non-integral foreign operation is accumulated in a foreign currency translation reserve in the financial statements until the disposal of the net investment, at which time they are recognized as income or as expenses.
Forward Exchange Contracts not intended for trading or speculation purposes
The premium or discount arising at the inception of forward exchange contracts is amortized as an expense or income over the life of the contract. Exchange differences on such contracts are recognized in the statement of Profit and Loss Account in the year in which the exchange rates change. Any profit or loss arising on cancellation or renewal of forward exchange contract is recognized as income or as expense for the year.
16. Income Taxes
Tax expense comprises of current, deferred and fringe benefit tax. Current Income Tax and Fringe Benefit Tax is measured at the amount expected to be paid to the tax authorities in accordance with the Income Tax Act, 1961, enacted in India. Deferred Income Taxes reflect the impact of current year timing differences between taxable income and accounting income for the year and reversal of timing differences of earlier years.
Deferred Income Tax is measured based on the tax rates and the tax laws enacted or substantively enacted at the balance sheet date. Deferred tax assets are recognized only to the extent that there is reasonable certainty that sufficient future taxable income will be available against which such deferred tax assets can be realized. If the Company has unabsorbed depreciation or carry forward tax losses, deferred tax assets are recognized only if there is virtual certainty supported by convincing evidence that such deferred tax assets can be realized against future taxable profits.
At each Balance Sheet date the Company re-assesses unrecognized deferred tax assets. It recognizes unrecognized deferred tax assets to the extent that it has become reasonably certain or virtually certain, as the case may be, that sufficient future taxable income will be available against which such deferred tax assets can be realized.
The carrying amount of deferred tax assets are reviewed at each balance sheet date. The Company writes down the carrying amount of a deferred tax assets to the extent that it is no longer reasonably certain or virtually certain, as the case may be, that sufficient future taxable income will be available against which deferred tax assets can be realized. Any such write-down is reversed to the extent that it becomes reasonably certain or virtually certain, as the case may be, that sufficient future taxable income will be available.
17. Earnings Per Share
Basic Earnings per Share are calculated by dividing the net profit or loss for the period attributable to Equity Shareholders (after deducting preference dividends and attributable taxes) by the weighted average number of Equity Shares outstanding during the period. Partly paid Equity Shares, if any are treated as a fraction of an Equity Share to the extent that they were entitled to participate in dividends relative to a fully paid Equity Share during the reporting period. The weighted average number of Equity Shares outstanding during the period is adjusted for events of bonus issue, bonus element in a rights issue to existing shareholders, share split, and reverse share split (consolidation of shares), if any.
For the purpose of calculating diluted Earnings per Share, the net profit or loss for the period attributable to Equity Shareholders and the weighted average number of Shares outstanding during the period are adjusted for the effects of all dilutive potential Equity Shares.
18. Provisions
A provision is recognized when the company has a present obligation as a result of past event and it is probable that an outflow of resources will be required to settle the obligation, in respect of which a reliable estimate can be made. Provisions are not discounted to its present value and are determined based on management estimate required to settle the obligation at the Balance Sheet date. These are reviewed at each Balance Sheet date and adjusted to reflect the current best estimates.
SCHEDULES TO BALANCE SHEET AND PROFIT & LOSS ACCOUNT
Panacea Biotec • Annual Report 2008-0981

Panacea Biotec • Annual Report 2008-0982
19. Segment Reporting Policies
(a) Identification of Segments:
Primary Segment
Business Segment: The Company’s operating businesses are organized and managed separately according to the nature of products, with each segment representing a strategic business unit that offers different products. The identified segments are Vaccines, Formulations and Research & Development Activities.
Secondary Segment
Geographical Segment: The analysis of geographical segment is based on the geographical location of the customers.
The geographical segments considered for disclosure are as follows:
• Revenue from domestic market includes sales to customers located within India.
• Revenue from overseas market includes sales to customers located outside India.
(b) Allocation of Common Costs: Common allocable costs are allocated to each segment on a rational basis based on nature of each such common cost.
(c) Unallocated Items: Corporate income and expenses are considered as a part of unallocable income & expense, which are not identifiable to any business segment.
20. Derivative Instruments
As per announcement of Institute of Chartered Accountants of India, accounting for derivative contracts, other than those covered under AS-11, are marked to market on a portfolio basis, and the net loss after considering the offsetting effect on the underlying hedge item is charged to the Profit & Loss Account. Net Gains are ignored.
21. Cash & Cash Equivalent
Cash and cash equivalents in the balance sheet comprise cash at bank and in hand and short-term investments with an original maturity of three months or less.
22. Expenditure on new projects and substantial expansion
Expenditure directly relating to construction activity is capitalized. Indirect expenditure incurred during construction period is capitalized as part of the indirect construction cost to the extent to which the expenditure is indirectly related to construction or is incidental thereto. Other indirect expenditure (including borrowing costs) incurred during the construction period which is not related to the construction activity nor is incidental thereto is charged to the Profit and Loss Account. Income earned during construction period is deducted from the total of the indirect expenditure.
All direct capital expenditure on expansion are capitalized. As regards indirect expenditure on expansion, only that portion is capitalized which represents the marginal increase in such expenditure involved as a result of capital expansion. Both direct and indirect expenditure are capitalized only if they increase the value of the asset beyond its original standard of performance.
C. Notes to Accounts (All amounts are in Rs. unless otherwise stated)
1. Contingent Liabilities (to the extent not provided for)
Particulars Current Year Previous Year
Disputed demands/ show-cause notices under:-
a) Sales Tax Cases - 13,809
b) Income Tax Cases 110,557 2,863,251
c) Customs Duty Cases 3,999,923 3,999,923
d) Central Excise Duty Cases 6,596,620 6,596,620
e) Service Tax 29,789,842 -
Total 40,496,942 13,473,603
Labour cases (in view of large number of cases, it is impracticable to 2,803,586 4,143,107 disclose each of them)
Other claims against the Company not acknowledged as debts - 64,000
Premium on Redemption of ‘US$ 50 Million Zero Coupon 470,992,269 243,706,599 Convertible Bonds due 2011’ (Refer note 3(ii) below)
Notes:
a) Sales Tax liability of Rs.13,809 was on account of non-receipt of C forms from customers for inter-state sales. No provision was required for
the same as the management was hopeful of receiving the forms before the due date of filing of Sales Tax Returns.
b) In respect of Income Tax, in Assessment Year 2005-06 the department disallowed ‘Club Expenses’ of Rs.255,800 on the ground that these
expenses were incurred in the personal names and not in the name of the company, hence not related to the business of the company in the
order under section 143(3) of the Act. The company preferred appeal before the CIT (Appeals). The CIT (Appeals) restricted the disallowance
to Rs.50,000 from Rs.2,55,800. In Assessment Year 2006-07 the department disallowed depreciation on LAN of Rs.60,557 on the ground
that depreciation on the same is allowable @25% and not @60% in the order under section 143(3) of the Act. No provision is considered
necessary in this regard since the Company believes it has a good case based on nature of the case and legal advice obtained by it.
SCHEDULES TO BALANCE SHEET AND PROFIT & LOSS ACCOUNT
Panacea Biotec • Annual Report 2008-0982

Panacea Biotec • Annual Report 2008-0983
SCHEDULES TO BALANCE SHEET AND PROFIT & LOSS ACCOUNT
c) In respect of Customs Duty demand of Rs.3,999,923 towards Customs Duty on certain items imported as exempted by the Company, the
Company has deposited the entire amount under protest. The matter is pending before the Honorable Supreme Court of India. No provision
is considered necessary in this regard since the Company believes it has a good case based on nature of the case and legal advice obtained
by it.
d) In respect of Central Excise Duty demand of Rs.6,596,620 towards Excise Duty on common inputs used in manufacture of exempted and
taxable products, the Company has deposited the entire amount under protest. The matter is pending before Central Excise and Customs
Tribunal. No provision is considered necessary in this regard since the Company believes it has a good case based on nature of the case and
legal advice obtained by it.
e) In respect of service tax demand of Rs.29,789,842/- relating to foreign services rendered & delivered outside India & others services, which
were brought in service tax net w.e.f. 18.04.06 and against which numerous decisions/ judgments have been pronounced by the competent
courts/judicial authorities, the Company has sent suitable reply to the concerned authority. No provision is considered necessary in this
regard since the Company believes it has a good case based on nature of the demand and legal advice obtained by it.
2. Estimated amount of contracts remaining to be executed on Capital Account, net of advances and not provided in the books are as follows:-
S. No. Particulars Current Year Previous Year
1. Tangibles Assets 420,258,712 306,726,1082. Intangible Assets 21,946,833 90,701,180 Total 442,205,545 397,427,288
3. Foreign Currency Convertible Bonds
i) Conversion price of ‘US$ 50 Million Zero Coupon Convertible Bonds due 2011’ (FCCBs) has already been fixed at Rs.357.57 per Share. This Rate is used to determine dilutive Equity Shares against outstanding Bonds.
ii) ‘US$ 50 Million Zero Coupon Convertible Bonds due 2011’ amounting to US$ 36,800,000 are pending for redemption as on 31st March 2009. Unless these Bonds have been previously converted, redeemed, repurchased and cancelled, the Company will redeem these Bonds at a price equal to 142.80% of the outstanding principal amount on the maturity date i.e. February 14, 2011 (including premium amounting to Rs.798,860,288). Since the redemption of bonds is contingent upon its non-conversion into Equity Shares and the probability of redemption cannot presently be ascertained, the Company has not provided for the proportionate premium on redemption for the period upto 31st March, 2009 amounting to Rs. 470,992,269 (Previous Year Rs.243,706,599). Such premium has been disclosed as contingent liability. These Bonds are considered a monetary liability and are redeemable only if there is no conversion before maturity date.
iii) The Company has fully utilized the issue proceeds of ‘US$ 50 Million Zero Coupon Convertible Bonds due 2011’ in earlier years.
Particulars As at Additions during Capitalised during As at April 1, 2008 the year the year March 31, 2009
Legal & Professional 3,681,923 168,360 3,850,283 - (2,941,783) (2,059,204) (1,319,064) (3,681,923)Store & Spares consumed 22,419,030 50,376 22,469,406 - (2,325,569) (22,126,744) (2,033,283) (22,419,030)Power & Fuel 31,254,050 357,323 31,529,249 82,124 (4,219,189) (27,922,199) (887,338) (31,254,050)Rates & Taxes 9,857,569 - 9,572,561 285,008 (285,008) (9,572,561) - (9,857,569)Repair & Maintenance : - Plant & Machinery 4,452,852 - 4,452,852 - (120,255) (4,362,741) (30,144) (4,452,852) - Others 5,861,464 773,882 6,545,065 90,281 (157,267) (5,713,075) (8,878) (5,861,464)Salary & Wages 13,191,507 - 13,191,507 - (2,335,791) (10,906,537) (50,821) (13,191,507)Office Expenses 2,733,205 73,934 2,807,139 - - (2,733,205) - (2,733,205)Travel & Conveyance Expenses 3,736,531 764,537 3,731,531 769,537 (1,003,717) (2,732,814) - (3,736,531)Rent 25,800 - 25,800 - - (25,800) - (25,800)Miscellaneous Expenses 4,444,120 4,310,572 8,754,693 - (347,310) (4,311,298) (214,488) (4,444,120)
Total 101,658,051 6,498,984 106,930,086 1,226,949 (13,735,889) (92,466,178) (4,544,016) (101,658,051)
Note: Figures in brackets represent previous year figures (2007-08)
4. Details of pre-operative expenses (included in Capital Work in Progress) relating to Fixed Assets are as follows:
Panacea Biotec • Annual Report 2008-0983

Panacea Biotec • Annual Report 2008-0984
SCHEDULES TO BALANCE SHEET AND PROFIT & LOSS ACCOUNT
5. a) Directors’ Remuneration:
Particulars Current Year Previous Year
Managing / Joint Managing Directors/ Whole-time Directors Salary and Allowances* 58,346,813 57,990,386Commission on Profits to Chairman/Managing Director/Joint Managing Directors - 132,000,000Perquisites (taxable value) 4,679,290 12,154,671Contribution to Provident Fund 9,360 9,360Total 63,035,463 202,154,417Non Whole-time Directors Allowances 930,000 1,072,000Sitting Fees 345,000 340,000Total 1,275,000 1,412,000Grand Total 64,310,463 203,566,417
* Provision for leave encashment and gratuity amounting to Rs.3,263,596 (Previous year Rs.3,741,971) and Rs.6,007,834 (Previous year Rs.18, 499,505) respectively, made during the year, is not included above.
b) Computation of net profit in accordance with Section 198 read with section 309(5) of the Companies Act, 1956 (“the Act”) and maximum amount permissible for managerial remuneration.
Particulars Current year Previous Year
Profit/ (Loss) as per Profit & Loss Account (before taxes & extraordinary items) (923,740,873) 1,903,858,280Add:Directors’ Remuneration 64,310,463 203,566,417Loss/ (Profit) on sale of fixed assets (net) (7,171,144) (22,887,632)Provision/ (Write back) for Doubtful Debts and Advances 384,794 27,044,708Loss/ (Profit) on Sale of Investment - (8,062,060)Net profit/ (Loss) in accordance with Section 198 of the Act (866,216,760) 2,103,519,713 Maximum amount permissible under Section 309 read with Section II of Part II of 24,865,757 210,351,971 Schedule XIII to the Act for payment to Managing/Joint Managing Directors and Whole-time DirectorsMaximum amount permissible under Section 309 of the Act for payment to 930,000* 21,035,197 Non Whole-time DirectorsTotal Allowable to Managing/ Joint Managing/ Whole-time and 25,795,757 231,387,168 Non Whole-time Directors
*This amount is as per the approvals of Ministry of Corporate Affairs , New Delhi vide their letters no. 12/301/2006-CL.VII dated 08.02.2007, F.No. 2/119/2005-CL.VII dated 16.01.2005 and 12/304/2006-CL.VII dated 08.02.2007
6. Disclosure of Micro & Small Enterprises
Details of dues to Micro, Small and Medium Enterprises as per Micro Current Year Previous Year Small and Medium Enterprise Development Act, 2006 (MSMED Act) Principal Interest Principal Interest
Principal amount and interest due thereon remaining unpaid to any supplier as at year end. 1,274,843 Nil 1,177,455 NilInterest paid by the Company in terms of section 16 of the MSMED Act along with the amounts of the payment made to the supplier beyond the appointed day during accounting year 3,552,413 68,868 4,703,195 78,680Interest due and payable for the period of delay in making payment (which have been paid but beyond the appointed day during the year) but without adding the interest specified under MSMED Act Nil Nil Nil NilInterest accrued and remaining unpaid at the end of the year. Nil Nil Nil NilFurther interest remaining due and payable in succeeding years, until such date when the interest dues as above are actually paid to the small enterprises for the purpose of disallowance as a deductible expenditure under section 23 of the MSMED Act Nil Nil Nil Nil
Panacea Biotec • Annual Report 2008-0984

Panacea Biotec • Annual Report 2008-0985
7. Deferred Tax Liabilities (Net):
The break-up of deferred tax liability is as follows:- Current Year Previous Year
Deferred Tax Liabilities:Differences in depreciation and amortization in block of fixed assets as 498,736,734 373,239,618 per Income Tax Act and books of accountsDeferred revenue expenditure 1,241,287 1,813,135Capital expenditure on research & development 267,365,739 262,159,287Forex Loss (revenue) deferred as per notification on AS-11 (Revised) 50,254,492 -Gross Deferred Tax Liabilities 817,598,252 637,212,040Deferred Tax Assets: Effect of expenditure debited to Profit and Loss Account in the current year but 47,441,741 42,182,387 allowed for tax purposes in following yearsLoss as per Income Tax Act carried forward 364,509,363 -Unabsorbed Depreciation as per Income Tax Act carried forward 71,861,483 -Gross Deferred Tax Assets 483,812,587 42,182,387Net Deferred Tax Liability 333,785,665 595,029,653
Note: The Company has recorded a loss before tax of Rs.923,740,873 in year ended March 2009 which is mainly on account of foreign currency loss of Rs.1,702,604,000 on open derivative contracts. The Company is otherwise earning good operating margin and based on orders on hand, it is virtually certain that it will earn sufficient margins to generate income to reverse book losses and will generate taxable profits to set-off the unabsorbed depreciation and carry-forward losses and other timing differences resulting into deferred tax assets. Hence, the Company has recognised deferred tax asset as at March 31, 2009 on carry-forward losses component also.
SCHEDULES TO BALANCE SHEET AND PROFIT & LOSS ACCOUNT
8. i) Amounts due from/ payable to group companies (including companies under the same management as defined under section 370 (1B) of the Companies Act, 1956), are as follows–
Particulars Current Year Previous Year
a) Loans and Advances to wholly owned subsidiaries - Best On Health Ltd. Balance recoverable - - Maximum amount due at any time during the year - 1,791,000,000 - Panacea Educational Institute Pvt. Ltd. Balance recoverable - - Maximum amount due at any time during the year - 320,000,000 - Panacea Hospitality Services Pvt. Ltd. Balance recoverable - - Maximum amount due at any time during the year - 320,000,000 - Sunanda Steel Company Ltd. Balance recoverable - - Maximum amount due at any time during the year - 140,000,000 - Radicura & Co. Ltd. Balance recoverable - - Maximum amount due at any time during the year - 620,000,000 - Rees Investments Ltd. Balance Recoverable 710,717,916 Maximum amount due at any time during the year 716,413,472 - Accrued Interest on loan but not due 28,887,763 - - Panacea Biotec, Inc. Balance Recoverable 93,154 - Maximum amount due at any time during the year 93,154 -b) Dues from associates - PanEra Biotec Pvt. Ltd. (Previously known Panheber Biotec Pvt. Ltd. ) Balance Recoverable (including Rs.41,137,053 on account of sale of raw material grouped as sundry debtors under Schedule VII ) 195,087,247 135,532,654 Maximum amount due at any time during the year 195,087,247 135,532,654c) Amount payable to wholly owned subsidiaries - Best On Health Ltd. Balance Payable - 3,079,105 Maximum amount due at any time during the year 3,079,105 3,079,105 - Radicura & Co. Ltd. Balance Payable - - Maximum amount due at any time during the year - 5,214,925 - Panacea Biotec GmbH Balance Payable 202,620 - Maximum amount due at any time during the year 202,620 -
ii) Loans and advances include Rs.116,109,320 (Previous Year Rs.40,312,505) due from Joint Venture Company, in which Company’s director was inter alia director till 1st December, 2008.
Panacea Biotec • Annual Report 2008-0985

Panacea Biotec • Annual Report 2008-0986
iii) Debtors include Rs.78,154,432 (Previous Year Rs.55,117,691) receivable from Joint Venture Company in which company’s directors are, inter-alia, directors.
iv) Details of Loans and advances to subsidiaries, associates and parties in which directors are interested (as required by clause 32 of listing agreement):
Particulars Current Year Previous Year
a) Loans and Advances to wholly owned subsidiaries (Refer note no. 8 (i) above) - -
b) Loan to Joint Venture Company
- Cambridge Biostability Ltd. 108,833,850 39,778,050
Maximum amount due at any time during the year 133,075,781 41,784,182
Accrued interest receivable on loan 7,275,470 534,455
c) Dues from associates (Refer note no. 8 (i) above) - -
9. Related Party Disclosures
A. Names of Related Parties
Names of related parties where control exists irrespective of whether transactions have occurred or not
(a) Joint Ventures Chiron Panacea Vaccines Private Limited; Cambridge Biostability Limited
(b) Subsidiaries BestOnHealth Ltd. (BOH) (Wholly-owned subsidiary (WOS)); Radicura & Co. Ltd. (Indirect WOS through BOH); Panacea Hospitality Services Pvt. Ltd. (Indirect WOS through BOH); Panacea Educational Institute Pvt. Ltd. (Indirect WOS through BOH); Sunanda Steel Company Ltd. (Indirect WOS through BOH); Rees Investments Ltd. (Rees) (Guernsey): (WOS w.e.f. 16th September 2008); Kelisia Holdings Ltd. (Cyprus): (Indirect WOS w.e.f 18th September 2008 through Rees); Kelisia Investment Holding AG (KIH) (Switzerland):(Indirect WOS w.e.f. 22nd October 2008 through Kelisia Holdings Ltd); Panacea Biotec (International) SA (Switzerland) (Indirect WOS w.e.f. 19th Feb. 2009 through KIH); Panacea Biotec FZE, (UAE) ( WOS w.e.f. 16th March 2008); Panacea Biotec GmbH (Germany) ( WOS w.e.f. 11th June 2008); Panacea Biotec, Inc. (USA) (WOS w.e.f. 15th July 2008); Umkal Medical Institute Pvt. Ltd. (Subsidiary w.e.f. 30th June 2008);
(c) Associates PanEra Biotec Private Limited; Lakshmi & The Manager (upto 30th June 2008); Lakshmi & Manager Holdings Ltd. (LMH) (w.e.f. 1st July 2008); Best General Insurance Co.Ltd (Indirect associate- subsidiary of LMH)
(d) Key Management Mr. Soshil Kumar Jain - Chairman and Whole-time Director Personnel Mr. Ravinder Jain - Managing Director Dr. Rajesh Jain - Joint Managing Director Mr. Sandeep Jain - Joint Managing Director Mr. Sumit Jain - Whole-time Director
SCHEDULES TO BALANCE SHEET AND PROFIT & LOSS ACCOUNT
(e) List of Persons having controlling interest together with their relatives*:
Key Father Mother Wife Brother Sister Son Daughter Management Personnel
Soshil Kumar Jain - - Nirmala Jain - - Ravinder Jain, - Rajesh Jain, Sandeep Jain -Ravinder Jain Soshil Kumar Jain Nirmala Jain Sunanda Jain Rajesh Jain, - Sumit Jain, Radhika Jain Sandeep Jain Nipun JainRajesh Jain Soshil Kumar Jain Nirmala Jain Meena Jain Ravinder Jain, - Ankesh Jain, - Sandeep Jain Harshet Jain Sandeep Jain Soshil Kumar Jain Nirmala Jain Pamilla Jain Ravinder Jain, - Priyanka Jain Rajesh JainSumit Jain Ravinder Jain Sunanda Jain Nipun Jain Radhika Jain - -
*Relatives holding Equity shares in the Company have been disclosed
(f ) Relatives of Key Management personnel having transactions with the Company: Mr. Ashwani Jain, Son-in-law of Mr. Soshil Kumar Jain Mr. Shagun Jain, Son-in-law of Mr. Ravinder Jain Mrs. Radhika Jain, Daughter of Mr. Ravinder Jain Mrs. Shilpy Jain, Wife of Mr. Sumit Jain
(g) Enterprises over which Person(s) having control or significant influence over the Company / Key management personnel(s), along with their relatives, are able to exercise significant influence:
i) Neophar Alipro Ltd.; ii) All India S. L. Jain Charitable Foundation; iii) First Lucre Partnership Co.*; iv) Second Lucre Partnership Co.*; v) Radhika Associates; vi) Sumit Nipun & Co.; vii) Rattan Sons; viii) Tahir & Co.; ix) Best On Health Foods Ltd. ; x) Soshil Kumar Jain (HUF)*; xi) Ravinder Jain (HUF)*; xii) Rajesh Jain (HUF)*; xiii) Sandeep Jain (HUF)*.
*These enterprises are also holding Shares in the Company.
Panacea Biotec • Annual Report 2008-0986

Panacea Biotec • Annual Report 2008-0987
B. D
etai
l of t
ran
sact
ion
s w
ith
th
e R
elat
ed p
arti
es
(Am
ou
nt
in R
up
ees)
Best
On
Radic
ura
Pana
cea
Pana
cea
Suna
nda S
teel
Rees
Pa
nace
a Pa
nace
a Um
kal
Pana
cea
Panh
eber
Chiro
n Ca
mbr
idge
PanE
ra La
kshm
i La
kshm
i &
Healt
h Ltd
. &
Co. L
td.
Educ
ation
al
Hosp
italit
y Co
mpa
ny
Inves
tmen
t Bio
tec
Biotec
M
edica
l Bio
tec
Biotec
Pvt.
Pana
cea
Biosta
bility
Bio
tec Pv
t. an
d The
M
anag
er
Ins
titut
e Se
rvice
s Lim
ited
Ltd.
INC
GmbH
Ins
titut
e FZ
E Ltd
. Upt
o Va
ccine
s Ltd
. Ltd
. (w.
e.f
Man
ager
Holdi
ngs L
td.
Pvt. L
td.
Pvt. L
td.
Pvt.L
td.
20
.11.07
Pv
t. Ltd
.
21.11
.07)
No
tes:
1.
Fig
ure
s in
bra
cket
s re
pre
sen
t p
revi
ou
s ye
ar fi
gu
res
2.
In re
spec
t o
f per
son
al g
uar
ante
e g
iven
by
Pro
mo
ters
-Dir
ecto
rs re
fer N
ote
no.
2 o
f Sch
edu
le II
I.
Pa
rticu
lars
Subs
idiari
es
Joint
As
socia
tes
Key
Relat
ives
Enter
prise
s ove
r To
tal
Ve
ntur
es
M
anag
emen
t of
Key
which
Perso
n(s)
Perso
nnel
Man
agem
ent
havin
g con
trol o
r
Pe
rsonn
el sig
nifica
nt in
fluen
ce
ov
er th
e Com
pany
/
Key M
anag
emen
t
Perso
nnel(
s), al
ong
wi
th th
eir re
lative
s,
are
able
to ex
ercise
signifi
cant
influ
ence
A. D
uring
the Y
ear
Pu
rchas
e of r
aw m
ateria
ls -
- -
- -
- -
- -
- -
- -
126,1
85,37
9 -
- -
- -
126,1
85,37
9
(-)
(-)
(-)
(-)
(-)
(-)
(-)
(-)
(-)
(-)
(1
5,595
,358)
(-)
(-)
(2
5,648
,721)
(-)
(-)
(-)
(-)
(-)
(4
1,244
,079)
Sa
le -
- -
- -
- -
- -
- -
243,2
77,97
0 -
41,13
7,053
-
- -
- -
284,4
15,02
3
(-)
(-)
(-)
(-)
(-)
(-)
(-)
(-)
(-)
(-)
(-)
(2
18,34
5,905
) (-)
(-)
(-)
(-)
(-)
(-)
(-)
(2
18,34
5,905
)
Purch
ase o
f Fixe
d Asse
ts -
45,00
0 -
- -
- -
- -
- -
- -
- -
- -
- -
45,00
0
(2
08,70
5)
(-)
(-)
(-)
(-)
(-)
(-)
(-)
(-)
(-)
(-)
(-)
(-)
(-)
(-)
(-)
(-)
(-)
(-)
(208
,705)
Pro
cessi
ng Ch
arges
paid
- -
- -
- -
- -
- -
- -
7,892
,040
25,15
7,135
-
- -
- -
33,04
9,175
(-)
(-)
(-)
(-)
(-)
(-)
(-)
(-)
(-)
(-)
(-)
(-)
(-)
(-)
(-)
(-)
(-)
(-)
(-)
(-)
Re
cove
ry of
dues
on A
ccou
nt of
Expe
nses
27
3,197
-
- -
- -
- -
- -
- -
- 66
,962,8
22
- -
- -
- 67
,236,0
19
(-)
(-)
(-)
(-)
(-)
(-)
(-)
(-)
(-)
(-)
(33,5
55,53
0)
(-)
(-)
(19,2
89,72
5)
(-)
(-)
(-)
(-)
(-)
(52,8
45,25
5)
Reim
burse
men
t on A
ccou
nt of
Expe
nses
-
- -
- -
- -
202,6
20
- -
- -
- -
- -
- -
- 20
2,620
(-)
(-)
(-)
(-)
(-)
(-)
(-)
(-)
(-)
(-)
(-)
(-)
(-)
(-)
(-)
(-)
(-)
(-)
(-)
(-)
Re
nt pa
id 5,3
85,04
0 -
- -
- -
- -
- -
- -
- -
-
- -
- 5,3
85,04
0
(5
,195,5
20)
(-)
(-)
(-)
(-)
(-)
(-)
(-)
(-)
(-)
(7,07
8,680
) (-)
(-)
(-)
(-)
(-)
(-)
(-)
(-)
(1
2,274
,200)
Re
nt re
ceive
d -
- -
- -
- -
- -
- -
- -
17,77
2,031
-
- -
- -
17,77
2,031
(-)
(-)
(-)
(-)
(-)
(-)
(-)
(-)
(-)
(-)
(5
6,000
) (-)
(-)
(1
,082,9
45)
(-)
(-)
(-)
(-)
(-)
(1,13
8,945
)
Rem
unera
tion
- -
- -
- -
- -
- -
- -
- -
- -
63,03
5,463
4,8
43,88
5 0
67,87
9,348
(-)
(-)
(-)
(-)
(-)
(-)
(-)
(-)
(-)
(-)
(-)
(-)
(-)
(-)
(-)
(-)
(2
02,15
4,417
) (4
,842,1
37)
(-)
(206
,996,5
54)
Lo
an /
Adva
nce g
iven
200
- -
- -
667,4
48,50
7 79
,322
- -
- -
- 79
,790,0
00
- -
- -
- -
747,3
18,02
9
(-)
(6
20,00
0,000
) (3
20,00
0,000
) (3
20,00
0,000
) (3
52,00
0,000
) (-)
(-)
(-)
(-)
(-)
(-)
(-)
(4
0,325
,291)
(-)
(-)
(-)
(-)
(-)
(-)
(1
,652,3
25,29
1)
Loan
s/Fixe
d Dep
osits
rece
ived
- -
- -
- -
- -
- -
- -
- -
- -
- -
300,0
00,00
0 30
0,000
,000
(-)
(-)
(-)
(-)
(-)
(-)
(-)
(-)
(-)
(-)
(-)
(-)
(-)
(-)
(-)
(-)
(-)
(-)
(612
,500,0
00)
(612
,500,0
00)
Lo
ans/F
ixed D
epos
its re
paid
- -
- -
- -
- -
- -
- -
- -
- -
- -
432,5
00,00
0 43
2,500
,000
(-)
(5,10
0,000
) (-)
(-)
(-)
(-)
(-)
(-)
(-)
(-)
(-)
(-)
(-)
(-)
(-)
(-)
(-)
(-)
(3
48,39
0,000
) (3
53,49
0,000
)
Intere
st pa
id on
Dep
osits
/ loa
ns
- -
- -
- -
- -
- -
- -
- -
- -
- -
35,89
3,714
35
,893,7
14
(-)
(145
,595)
(-)
(-)
(-)
(-)
(-)
(-)
(-)
(-)
(-)
(-)
(-)
(-)
(-)
(-)
(-)
(-)
(2
5,935
,713)
(2
6,081
,308)
Di
viden
d paid
- Eq
uity S
hares
-
- -
- -
- -
- -
- -
- -
- -
- 19
,503,7
00
24,13
7,900
-
43,64
1,600
(-)
(-)
(-)
(-)
(-)
(-)
(-)
(-)
(-)
(-)
(-)
(-)
(-)
(-)
(-)
(-)
(1
9,503
,700)
(2
4,137
,900)
(-)
(4
3,641
,600)
Inv
estm
ents
mad
e 19
9,999
,800
- -
- -
476
- 1,5
82,25
0 76
,143,6
04
5,474
,520
- -
- -
- 41
,257,1
26
- -
- 32
4,457
,776
(1,79
1,000
,000)
(-)
(1
00,00
0)
(100
,000)
(5
00,00
0)
(-)
(-)
(-)
(-)
(-)
(-)
(-)
(-)
(-)
(40,0
00,00
0)
(-)
(-)
(-)
(-)
(1,83
1,700
,000)
Pu
rchas
e of S
hare
- -
- -
- -
- -
- -
- -
- -
- -
- -
- -
(-)
(-)
(-)
(-)
(-)
(-)
(-)
(-)
(-)
(-)
(-)
(1
00,00
0)
(590
,000)
(-)
(6
90,00
0)
Sale
of Inv
estm
ent/C
onve
rsion
of Lo
an
- -
- -
- -
- -
- -
- -
- -
41,25
7,126
-
- -
- 41
,257,1
26
into S
hare
Capit
al (2
0,128
,500)
(-)
(-)
(-)
(-)
(-)
(-)
(-)
(-)
(-)
(-)
(-)
(-)
(-)
(-)
(-)
(-)
(-)
(-)
(2
0,128
,500)
Re
paym
ent o
f Loa
n/Ad
vanc
e give
n 20
0 -
- -
- -
- -
- -
- -
- -
- -
- -
- 20
0
(-)
(6
20,00
0,000
) (3
20,00
0,000
) (3
20,00
0,000
) (3
52,00
0,000
) (-)
(-)
(-)
(-)
(-)
(-)
(-)
(-)
(-)
(-)
(-)
(-)
(-)
(-)
(1
,612,0
00,00
0)
Intere
st rec
eived
-
- -
- -
- -
- -
- -
- 16
,868,7
53
- -
- -
- -
16,86
8,753
(1
,100,2
19)
(-)
(-)
(-)
(-)
(-)
(-)
(-)
(-)
(-)
(-)
(-)
(1,99
3,346
) (-)
(-)
(-)
(-)
(-)
(-)
(3
,093,5
65)
Do
natio
n -
- -
- -
- -
- -
- -
- -
- -
- -
- 30
0,000
30
0,000
(-)
(-)
(-)
(-)
(-)
(-)
(-)
(-)
(-)
(-)
(-)
(-)
(-)
(-)
(-)
(-)
(-)
(-)
(5
00,00
0)
(500
,000)
Ins
uran
ce cl
aim re
ceive
d 12
,089
- -
- -
- -
- -
- -
- -
- -
- -
- -
12,08
9
(-)
(-)
(-)
(-)
(-)
(-)
(-)
(-)
(-)
(-)
(-)
(-)
(-)
(-)
(-)
(-)
(-)
(-)
(-)
(-)
Ins
uran
ce cl
aim pa
id 12
,089
- -
- -
- -
- -
- -
- -
- -
- -
- -
12,08
9
(-)
(-)
(-)
(-)
(-)
(-)
(-)
(-)
(-)
(-)
(-)
(-)
(-)
(-)
(-)
(-)
(-)
(-)
(-)
(-)
B. Ye
ar en
d bala
nces
Inv
estm
ents
2,013
,882,8
50
- (-)
(-)
(-)
47
6 -
1,582
,250
76,14
3,604
5,4
74,52
0 (-)
22
,959,1
00
168,0
68,99
8 4,1
97,67
0 -
41,25
7,126
-
- -
2,333
,566,5
94
(1,81
3,883
,050)
(-)
(-)
(-)
(-)
(-)
(-)
(-)
(-)
(-)
(-)
(2
2,959
,100)
(1
68,06
8,998
) (4
,197,6
70)
(40,0
00,00
0)
(-)
(-)
(-)
(2
,049,1
08,81
8)
Intere
st ac
crued
and d
ue on
Loan
-
- -
- -
0 -
- -
- -
- -
- -
- -
- -
-
(-)
(-)
(-)
(-)
(-)
(-)
(-)
(-)
(-)
(-)
(-)
(-)
(-)
(-)
(-)
(-)
(-)
(-)
(-)
(-)
Int
erest
accru
ed bu
t not
rece
ivable
-
- -
- -
28,88
7,763
-
- -
- -
- 7,2
75,47
0 -
- -
- -
- 36
,163,2
33
(-)
(-)
(-)
(-)
(-)
(-)
(-)
(-)
(-)
(-)
(-)
(-)
(534
,455)
(-)
(-)
(-)
(-)
(-)
(-)
(5
34,45
5)
Outst
andin
g rec
eivab
le
- -
- -
- -
93,15
4 -
- -
- 78
,154,4
32
- 19
5,087
,247
- -
- -
- 27
3,334
,833
(-)
(-)
(-)
(-)
(-)
(-)
(-)
(-)
(-)
(-)
(-)
(55,1
17,69
1)
(-)
(135
,532,6
54)
(-)
(-)
(-)
(-)
(-)
(190
,650,3
45)
Pro
vision
for b
ad an
d dou
btfu
l adv
ance
s -
- -
- -
- -
- -
- -
- -
135,5
32,65
4 -
- -
- -
135,5
32,65
4
(-)
(-)
(-)
(-)
(-)
(-)
(-)
(-)
(-)
(-)
(-)
(-)
(-)
(1
35,53
2,654
) (-)
(-)
(-)
(-)
(-)
(1
35,53
2,654
)
Outst
andin
g Loa
n -
- -
- -
710,7
17,91
6 -
- -
- -
- 10
8,833
,850
- -
- -
- -
819,5
51,76
6
(-)
(-)
(-)
(-)
(-)
(-)
(-)
(-)
(-)
(-)
(-)
(-)
(3
9,778
,050)
(-)
(-)
(-)
(-)
(-)
(-)
(3
9,778
,050)
Ou
tstan
ding F
ixed d
epos
its
- -
- -
- -
- -
- -
- -
- -
- -
- -
300,0
00,00
0 30
0,000
,000
(-)
(-)
(-)
(-)
(-)
(-)
(-)
(-)
(-)
(-)
(-)
(-)
(-)
(-)
(-)
(-)
(-)
(-)
(432
,500,0
00)
(432
,500,0
00)
Ou
tstan
ding p
ayab
le -
- -
- -
- -
202,6
20
- -
- -
- -
- -
- -
- 20
2,620
(3
,079,1
05)
(-)
(-)
(-)
(-)
(-)
(-)
(-)
(-)
(-)
(-)
(-)
(-)
(-)
(-)
(-)
(-)
(-)
(-)
(3,07
9,105
)
Panacea Biotec • Annual Report 2008-0987

Panacea Biotec • Annual Report 2008-0988
SCHEDULES TO BALANCE SHEET AND PROFIT & LOSS ACCOUNT
10. Derivative Instruments and Hedged/Unhedged Foreign Currency Exposure i) Forward contract outstanding as at Balance Sheet date Sell - Nil; Buy - Nil ii) Particulars of Hedged Export Receivables at applicable exchange rates in respect of Options Contracts outstanding as at Balance Sheet date
Currency Exchange Amount in Foreign Amount in Amount in Amount in Purpose rates Currency Indian Rupees Foreign Currency Indian Rupees
Current Year Current Year Previous Year Previous Year
USD 41.00 - - 28,000,000 1,148,000,000 To hedge
USD 40.55 - - 30,000,000 1,216,500,000 Export
USD 40.00 58,000,000 2,320,000,000 84,000,000 3,360,000,000 Receivables
USD 39.00 48,000,000 1,872,000,000 48,000,000 1,872,000,000
USD 39.60 36,000,000 1,425,600,000 36,000,000 1,425,600,000
142,000,000 5,617,600,000 226,000,000 9,022,100,000
Accordingly, exchange fluctuation loss on marking them to market as of year end amounting to Rs.1,702,604,000 Previous Year Rs.40,500,000) has been accounted for and included in “Provision for Loss on Open Derivative Contracts” under Schedule XIII - Operating and Other Expenses.
iii) Particulars of Hedged Foreign Currency Exposure as at Balance Sheet date
Particulars Amount as at Currency Closing Amount as at Amount as at Currency Closing Amount as at 31st March’09 Exchange 31st Mar’09 31st March’08 Exchange 31st Mar’08 (in Foreign Currency) Rate* (INR) (in Foreign Currency) Rate* (INR)
Export Debtors 15,038,066 USD 50.71 762,580,345 28,387,626 USD 40.12 1,138,769,629
iv) Particulars of Unhedged Foreign Currency Exposure as at Balance Sheet date
Particulars Amount as at Currency Closing Amount as at Amount as at Currency Closing Amount as at 31st March’09 Exchange 31st Mar’09 31st March’08 Exchange 31st Mar’08 (in Foreign Currency) Rate* (INR) (in Foreign Currency) Rate* (INR)
Import Creditors 5,542,275 USD 50.72 281,104,206 5,332,130 USD 40.11 213,845,059 12,841,668 Euro 67.54 867,327,519 887,098 Euro 63.35 56,197,580 33,538 CHF 44.56 1,494,481 35,692 CHF 39.89 1,423,840 12,289 GBP 72.60 892,159 17,355 GBP 79.52 1,380,106 1,217,220 JPY / 100 51.55 627,521 2,576,200 JPY / 100 39.99 1,030,086 16,820 SEK 6.13 103,140 16,820 SEK 6.74 113,399 1,010 CAD 40.47 40,856 - - - -Export Debtors 2,990,037 Euro 67.50 201,827,823 2,589,747 Euro 63.38 164,142,548Foreign Currency Loans 65,097,252 USD 50.72 3,301,732,614 45,221,166 USD 40.11 1,813,599,550Balance with Banks 9,652,566 USD 50.71 489,481,613 874,867 USD 40.12 35,095,290 105761 Euro 67.50 7,138,856 1,404,665 Euro 63.38 89,030,070FCCBs 36,800,000 USD 50.72 1,866,496,000 36,800,000 USD 40.11 1,475,864,000Investment in Subsidiary 10 USD 47.62 476 - - - - 137,000 USD 39.96 5,474,520 - - - - 25,000 Euro 63.29 1,582,250 - - - -Investment in JV 1,935,615 GBP 86.83 168,068,998 1,935,615 GBP 86.83 168,068,998Loan to JV 1,500,000 GBP 72.56 108,833,850 500,000 GBP 79.56 39,778,050Loan to Subsidiaries 14,015,340 USD 50.71 710,717,916 - - - -*Closing Exchange rate has been rounded off to two decimal places.
3. Material related party transactions (More than 10% of aggregate) with individual parties are as follows:
Unsecured Loans/ Fixed Interest Managerial Remuneration Equity Dividend Deposit received/(repaid)
Current Year Previous Year Current Year Previous Year Current Year Previous Year Current Year Previous Year
Key Management personnel
Mr. Soshil Kumar Jain - - - - 15,155,738 48,153,429 5,000,000 5,000,000
Mr. Ravinder Jain - - - - 19,321,956 59,771,725 4,646,200 4,646,200
Dr. Rajesh Jain - - - - 12,648,046 45,645,737 4,706,900 4,706,900
Mr. Sandeep Jain - - - - 12,648,046 45,645,737 4,792,100 4,792,100
Enterprises over which Person(s) having control or significant influence over the Company / Key management personnel(s), along with their relatives, are able to exercise significant influence
First Lucre Partnership Co. 300,000,000 612,500,000 35,893,714 25,405,853 - - - -
(432,500,000) (330,000,000) - - - - - -
All India S.L. Jain Charitable Foundation - - - 415,993 - - - -
Year end Balances
First Lucre Partnership Co. 300,000,000 432,500,000 - - - - - -
Panacea Biotec • Annual Report 2008-0988

Panacea Biotec • Annual Report 2008-0989
SCHEDULES TO BALANCE SHEET AND PROFIT & LOSS ACCOUNT
11. Segmental Information
A. Information about Primary Segments
Particulars Vaccines Formulations Research & Development Total
2008 – 09 2007 – 08 2008 – 09 2007 – 08 2008 – 09 2007 – 08 2008 – 09 2007 – 08
Revenue
Segment Revenue 5,470,170,035 6,324,557,852 2,262,302,399 1,976,017,496 1,699,562 3,867,030 7,734,171,996 8,304,442,378
Other Income 5,952,196 40,218,416 24,950,226 32,517,814 - - 30,902,422 72,736,230
Total 5,476,122,231 6,364,776,268 2,287,252,625 2,008,535,310 1,699,562 3,867,030 7,765,074,418 8,377,178,608
Segment Result 2,661,847,455 2,861,717,201 466,882,428 220,394,689 (668,244,483) (537,989,091) 2,460,485,400 2,544,122,799
Unallocated Corporate Expenses 3,291,930,523 792,637,757
Operating Profit / (Loss) (831,445,123) 1,751,485,042
Interest & Finance charges (321,070,800) (146,632,224)
Other Income 228,775,049 299,005,462
Income Taxes 233,243,988 (572,160,506)
Net Profit / (Loss) (690,496,886) 1,331,697,774
Other Information
Segment Assets 8,164,022,933 4,555,500,911 1,757,286,755 1,914,995,988 2,143,579,827 1,944,924,347 12,064,889,515 8,415,421,246
Unallocated Corporate Assets 4,808,922,747 4,427,805,432
Total Assets 8,164,022,933 4,555,500,911 1,757,286,755 1,914,995,988 2,143,579,827 1,944,924,347 1,6873,812,262 12,843,226,678
Segment Liabilities 812,019,662 469,524,505 391,402,477 257,279,313 65,696,536 88,134,533 1,269,118,675 814,938,351
Unallocated Corporate Liabilities 9,453,200,641 5,056,241,670
Total Liabilities 812,019,662 469,524,505 391,402,477 257,279,313 65,696,536 88,134,533 10,722,319,316 5,871,180,021
Capital Expenditure – Additions 1,948,866,420 372,154,760 123,752,797 82,121,704 578,593,601 175,826,431
Depreciation 350,826,118 111,412,186 125,068,119 129,116,679 169,025,407 131,348,176
B. Information about Secondary Segments
a) Revenue as per Geographical Markets
Segment Domestic* Overseas
Current Year Previous Year Current Year Previous Year
Vaccines 3,991,735,243 6,015,579,612 1,478,434,793 308,978,240Formulations 1,798,741,628 1,604,484,560 463,560,771 371,532,936R & D - - 1,699,562 3,867,030Total 5,790,476,871 7,620,064,172 1,943,695,126 684,378,206
* Domestic revenue includes revenue from deemed exports of Rs.3,708,466,456 (Previous Year Rs.5,797,333,245)
b) Sundry debtors as per Geographical Markets
Segment Domestic Overseas
Current Year Previous Year Current Year Previous Year
Vaccines 336,012,170 1,190,336,164 536,329,974 -Formulations 140,405,116 112,388,470 226,054,249 179,883,789Total 476,417,286 1,302,724,634 762,384,223 179,883,789
c) The Company has common fixed assets for producing goods for Domestic Market and Overseas Markets. Hence, separate figures for segment assets / additions to segment assets cannot be furnished.
12. Leases
i. For assets given under Operating Lease agreements:
a) The Company has leased out the assets situated at Lalru, Punjab on operating lease to its Associate, PanEra Biotec Private
Limited.
Particulars Gross Block Accumulated Depreciation Depreciation charged
to P&L Account
Current Year Previous Year Current Year Previous Year Current Year Previous Year
Building 89,955,066 18,352,562 33,159,226 6,605,854 5,327,263 1,305,186
Furniture and Fixture 10,659,476 6,750,149 5,639,670 3,861,199 1,151,292 638,461
Office Equipment 1,904,239 512,602 769,438 244,331 270,436 43,346
Plant & Machinery 663,486,845 316,043,799 247,986,666 146,532,544 66,307,911 27,388,797
Computer Equipment 5,950,080 671,976 1,549,742 557,752 688,492 76,149
Total 771,955,706 342,331,088 289,104,742 157,801,680 73,745,394 29,451,939
Panacea Biotec • Annual Report 2008-0989
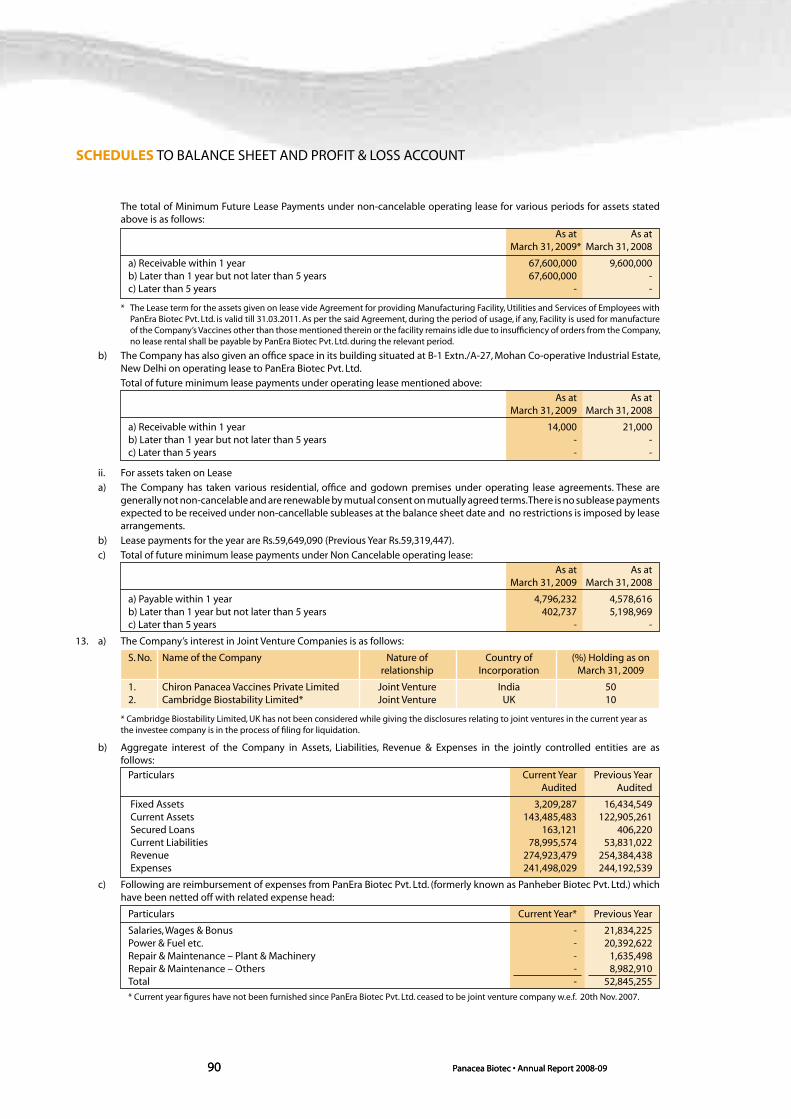
Panacea Biotec • Annual Report 2008-0990
SCHEDULES TO BALANCE SHEET AND PROFIT & LOSS ACCOUNT
The total of Minimum Future Lease Payments under non-cancelable operating lease for various periods for assets stated above is as follows:
As at As at March 31, 2009 * March 31, 2008
a) Receivable within 1 year 67,600,000 9,600,000b) Later than 1 year but not later than 5 years 67,600,000 -c) Later than 5 years - -
* The Lease term for the assets given on lease vide Agreement for providing Manufacturing Facility, Utilities and Services of Employees with PanEra Biotec Pvt. Ltd. is valid till 31.03.2011. As per the said Agreement, during the period of usage, if any, Facility is used for manufacture of the Company’s Vaccines other than those mentioned therein or the facility remains idle due to insufficiency of orders from the Company, no lease rental shall be payable by PanEra Biotec Pvt. Ltd. during the relevant period.
b) The Company has also given an office space in its building situated at B-1 Extn./A-27, Mohan Co-operative Industrial Estate, New Delhi on operating lease to PanEra Biotec Pvt. Ltd.
Total of future minimum lease payments under operating lease mentioned above:
As at As at March 31, 2009 March 31, 2008
a) Receivable within 1 year 14,000 21,000b) Later than 1 year but not later than 5 years - -c) Later than 5 years - -
ii. For assets taken on Lease
a) The Company has taken various residential, office and godown premises under operating lease agreements. These are generally not non-cancelable and are renewable by mutual consent on mutually agreed terms. There is no sublease payments expected to be received under non-cancellable subleases at the balance sheet date and no restrictions is imposed by lease arrangements.
b) Lease payments for the year are Rs.59,649,090 (Previous Year Rs.59,319,447).
c) Total of future minimum lease payments under Non Cancelable operating lease:
As at As at March 31, 2009 March 31, 2008
a) Payable within 1 year 4,796,232 4,578,616b) Later than 1 year but not later than 5 years 402,737 5,198,969c) Later than 5 years - -
13. a) The Company’s interest in Joint Venture Companies is as follows:
S. No. Name of the Company Nature of Country of (%) Holding as on relationship Incorporation March 31, 2009
1. Chiron Panacea Vaccines Private Limited Joint Venture India 502. Cambridge Biostability Limited* Joint Venture UK 10
* Cambridge Biostability Limited, UK has not been considered while giving the disclosures relating to joint ventures in the current year as the investee company is in the process of filing for liquidation.
b) Aggregate interest of the Company in Assets, Liabilities, Revenue & Expenses in the jointly controlled entities are as follows:
Particulars Current Year Previous Year Audited Audited
Fixed Assets 3,209,287 16,434,549 Current Assets 143,485,483 122,905,261 Secured Loans 163,121 406,220 Current Liabilities 78,995,574 53,831,022 Revenue 274,923,479 254,384,438 Expenses 241,498,029 244,192,539
c) Following are reimbursement of expenses from PanEra Biotec Pvt. Ltd. (formerly known as Panheber Biotec Pvt. Ltd.) which have been netted off with related expense head:
Particulars Current Year* Previous Year
Salaries, Wages & Bonus - 21,834,225Power & Fuel etc. - 20,392,622Repair & Maintenance – Plant & Machinery - 1,635,498Repair & Maintenance – Others - 8,982,910Total - 52,845,255
* Current year figures have not been furnished since PanEra Biotec Pvt. Ltd. ceased to be joint venture company w.e.f. 20th Nov. 2007.
Panacea Biotec • Annual Report 2008-0990

Panacea Biotec • Annual Report 2008-0991
SCHEDULES TO BALANCE SHEET AND PROFIT & LOSS ACCOUNT
d) The purchase commitments for fixed assets incidental to the ordinary course of business of companies with which the Company has a joint venture, are as follows :
Name of Company Current Year Previous Year
Chiron Panacea Vaccines Pvt. Ltd. (50% interest) - -Cambridge Biostability Ltd. (10% interest) - -Total - -
e) Subsequent Event: The Company’s Joint Venture Cambridge Biostability Limited (CBL), having regard to its financial position, has initiated steps to place it into creditors’ voluntary liquidation, subsequent to the Balance Sheet date. Due to the financial position of CBL, the Company considers its investments in CBL as well as loan given to it, doubtful of recovery. Accordingly, the following have been provided for in the books of accounts of current year.
Particulars Amount
Investment made 168,068,998 Loan given 108,833,850 Interest accrued on above Loan 7,275,470 Total 284,178,318
14. Auditors` Remuneration includes the following
Particulars Current Year Previous Year
Statutory Auditors - Statutory Audit 3,309,000 3,400,060 - Quarterly Limited Reviews 1,685,400 1,348,320 - Certificates 134,833 113,217 - Out of Pocket Expenses 161,720 69,317 5,290,953 4,930,914Tax Auditors* 140,450 140,450Cost Auditors* 44,944 33,708
* included in Legal & Professional charges given in Schedule XIII.
15. Additional information as required under Para 3 & 4 of Part II of Schedule VI of the Companies Act, 1956.
A. Particulars of Licensed Capacity, Installed Capacity & Production.
a) Licensed Capacity per annum
Recombinant Bulk Vaccine – 180 lac doses Others – Not Applicable
b) Installed Capacity per annum*
Products Units of Measurement Current year Previous Year
Tablets Nos./ Million 1,684.0 1,684.0Capsules Nos. / Million 370.0 370.0Syrups/Liquids Bottles / Million 15.8 15.8Gels Tubes / Million 21.2 21.2Vaccines (Finished Doses) Doses / Million 861.5 820.0Pre-filled Syringes Doses/ Million 17.0 -Recombinant Bulk Vaccines** Doses / Million 12.5 12.5Tetanus Bulk Vaccines*** Doses/ Million 75.0 75.0Bacterial Bulk Vaccines*** Doses/ Million 68.75 50.0
* As Certified by the management** This facility has been leased to Associate Company, PanEra Biotec Pvt. Ltd. and is capable of manufacturing various bulk vaccines including Hep B, Hib TT and Anthrax.*** These facilities have been leased to Associate Company, PanEra Biotec Pvt. Ltd. Bacterial Bulk Vaccines Plant is capable of manufacturing various bulk vaccine including Diphtheria, Whole Cell Pertussis (wP), Acellular Pertussis(aP) and its capacity will come down by 5 million doses to 63.75 million doses in case of production of Acellular Pertussis (aP).
c) Actual Production during the year.
Products Units of Measurement Current Year * Previous Year*
Tablets Nos. 504,389,489 ** 425,555,706 **Capsules Nos. 64,354,858 55,436,411Syrups / Liquids Ml 283,920,530 246,056,820Gels Gms 23,474,760 65,585,870Vaccines Vials 50,553,815 69,507,387 Pre Fill Syringe PFS 1,679,769 -Injection Nos. 456,656 588,105 Other Products Gms. 17,638,965 -
* Actual Production includes production at Loan Licensee locations meant for sale by the Company.** Actual Production includes 155,993,730 (Previous Year 8,104,220) Tablets manufactured for others under Loan License basis.
Panacea Biotec • Annual Report 2008-0991

Panacea Biotec • Annual Report 2008-0992
SCHEDULES TO BALANCE SHEET AND PROFIT & LOSS ACCOUNT
B. Particulars of Stocks & Sales
Units Opening Stock Closing Stock Sample / Destroyed / Sales Expired / Shortages
Current Previous Current Previous Current Previous Current Previous Year Year Year Year Year Year Year Year
a) Own ManufacturingTablets Nos. 78,301,586 116,699,523 59,005,305 78,301,586 4,550,993 9,204,439 519,134,777 454,749,204 Rs. 63,382,524 74,352,761 46,940,103 63,382,524 - - 1,210,177,962 1,051,472,608Capsules Nos. 14,547,473 11,841,247 9,873,246 14,547,473 2,091,314 4,122,595 66,937,771 48,607,590 Rs. 63,436,317 96,557,062 40,651,005 63,436,317 - - 557,856,427 453,957,048Syrups/ Liquids Ml 50,579,060 90,520,100 66,737,470 50,579,060 2,183,150 13,309,190 265,578,970 272,688,670 Rs. 15,939,607 16,910,186 17,837,248 15,939,607 - - 110,582,967 125,338,987Gels Gms 16,354,230 28,407,220 8,458,210 16,354,230 1,132,500 1,144,810 30,238,280 76,494,050 Rs. 7,689,660 13,877,073 3,873,051 7,689,660 - - 35,179,463 76,635,951Vaccines Vials 9,372,994 8,006,588 14,913,671 9,372,994 295,038 576,035 44,718,100 67,564,946 Rs. 477,630,816 469,048,675 733,972,132 477,630,816 - - 5,277,342,364 6,324,557,847Pre Fill Syringe PFS - - 723,796 - 46,492 - 909,481 - Rs. - - 92,961,982 - - - 142,003,221 -Injections Vials 122,833 278,932 66,104 122,833 45,449 182,731 467,936 561,473 Rs. 309,429 715,923 23,805 309,429 - - 3,278,010 6,050,327Husk Gms 9 13,249 - 9 85 13,736 (76) (496) Rs. 203 402,623 - 203 - - (2,097) (15,465)Kit Nos. - 5,663 - - - 5903 - (240) Rs. - 1,400,800 - - - - - (56,165)Granules Nos. - - 4,244,340 - 102,225 - 13,292,400 - Rs. - - 4,872,951 - - - 16,494,980 -Total Rs. 628,388,556 673,265,103 941,132,277 628,388,556 - - 7,352,913,297 8,037,941,138
b) Trading Activities
Tablets Nos. 12,708,601 14,955,314 14,665,408 12,708,601 4,149,231 5,928,120 49,202,158 42,365,574 Rs. 27,372,156 27,768,077 23,835,584 27,372,158 - - 240,420,372 208,427,041Capsules Nos. 3,449,624 3,770,084 2,454,871 3,449,624 1,404,069 1,085,246 6,654,519 7,600,364 Rs. 12,941,050 9,383,668 6,923,483 12,941,050 - - 35,693,185 43,880,361Syrups / Liquids Ml 23,796,760 12,302,790 11,143,960 23,796,760 4,201,200 9,460,820 39,995,770 35,583,300 Rs. 3,171,290 1,985,763 1,559,658 3,171,290 - - 12,547,652 11,218,568Gels Gms 89,460 - 1,830 89,460 5,700 5,520 (80,880) 1,329,420 Rs. 48,430 - 876 48,430 - - (102,920) 1,681,810Injections Vials 15,422 10,272 58,533 15,422 2,819 1,129 105,112 84,006 Rs. 12,210,592 1,075,732 11,716,770 12,210,592 - - 47,473,275 33,496,655Biscuits Nos. 3,659 1,431 - 3,659 7,867 60,066 (4,208) 30,375 Rs. 76,730 28,645 - 76,730 - - (162,354) 1,314,545Granules Nos. - - 1,330,725 - - - 505,005 - Rs. - - 689,458 - - - 1,640,666 -Total Rs. 55,820,248 40,241,885 44,725,829 55,820,250 - - 337,509,876 300,018,980c) Others* Nos. - - - - - - - - Rs. - - - - - - 39,994,426 3,71,804Total Rs. - - - - - - 39,994,426 3,71,804Grand Total Rs. 684,208,804 713,506,988 985,858,106 684,208,806 - - 7,730,417,599 8,338,331,922
*Sales of Raw Material
C. Purchase of Finished goods
Products Units Current Year Previous Year
Tablets Nos. 55,308,196 46,046,980 Rs. 100,757,694 104,564,041Capsules Nos. 7,063,835 8,365,150 Rs. 19,211,568 28,797,661Syrups/Liquids Ml. 31,544,170 56,538,090 Rs. 4,920,952 8,599,667Gel Gms. (162,810) 1,424,400 Rs. (75,949) 663,533Injections Vials 151,042 90,285 Rs. 29,913,166 29,088,706Biscuits Nos. - 92,668 Rs. - 1,255,728Others Gms. 1,835,730 - Rs. 1,143,558 -Total Rs. 155,870,989 172,969,336
Panacea Biotec • Annual Report 2008-0992

Panacea Biotec • Annual Report 2008-0993
SCHEDULES TO BALANCE SHEET AND PROFIT & LOSS ACCOUNT
D. Consumption of Raw materials & Packing materials
Products Current Year Previous Year Oty. (In doses) Value Oty. (In doses) Value
Polio Virus 879,425,400 1,824,633,064 1,355,217,338 2,729,473,985Others* 1,146,965,663 767,136,323Total 2,971,598,727 3,496,610,308
* Items comprised in others are individually less than 10% of total value
E. Value of Imports on CIF basis (on accrual basis)
Particulars Current Year Previous Year
Raw Materials & Packing Materials 4,571,336,927 2,742,992,185
Capital Goods 457,267,055 193,149,620
F. Expenditure in Foreign Currency (on accrual basis)
Particulars Current Year Previous Year
Know-how Fee 12,847,257 8,619,193
Royalty 38,025 272,321
Interest 206,189,558 59,439,075
Professional & Consultation Fees 54,682,275 29,761,306
Other Expenses
- Patents, Trade Marks & Product Registration 26,319,097 23,392,134
- Advertising and Sales Promotion 5,258,076 33,165,756
- Printing & Stationery 110,588 3,337,007
- Commission on Sales 65,806,641 44,655,446
- Market Research 30,286,500 -
- Others 39,604,033 27,471,615
G. Earnings in Foreign Exchange (on accrual basis)
Particulars Current Year Previous Year
F.O.B. value of Exports (including deemed export of Rs.3,708,466,456 5,588,991,868 6,414,111,800 (Previous Year Rs.5,797,333,245)
R & D Services (Know-how) Income 1,699,562 3,867,030
Interest on Exchange Earners Foreign Currency Deposits - 637,893
Interest received on loan from Joint Venture Company 16,868,753 1,993,346
Interest accrued but not dueon loan from subsidiary company 28,887,763 -
H. Value of Imported/Indigenous Raw Materials & Packing Materials consumed
Particulars Current Year Previous Year Amount in Rs. % age Amount in Rs. % age
Indigenous 605,547,690 20.38 493,086,486 14.10
Imported 2,366,051,037 79.62 3,003,523,822 85.90
Total 2,971,598,727 100.00 3,496,610,308 100.00
I. Value of Imported/Indigenous Stores & Spares consumed
Particulars Current Year Previous Year Amount in Rs. % age Amount in Rs. % age
Indigenous 163,479,798 85.13 117,958,440 86.00
Imported 28,564,016 14.87 19,447,028 14.00
Total 192,043,814 100.00 137,405,468 100.00
J. Remittance in foreign currency on account of dividend
Particulars Current Year Previous Year
Dividend on Equity Shares * 1,045,000 1,045,000
Number of Non-resident Equity Shareholders 1 1
No. of Equity Shares held by them 1,045,000 1,045,000
* Dividend of Rs.1,045,000 pertains to 2007-08 (Previous year Rs.1,045,000 pertains to 2006-07).
Panacea Biotec • Annual Report 2008-0993
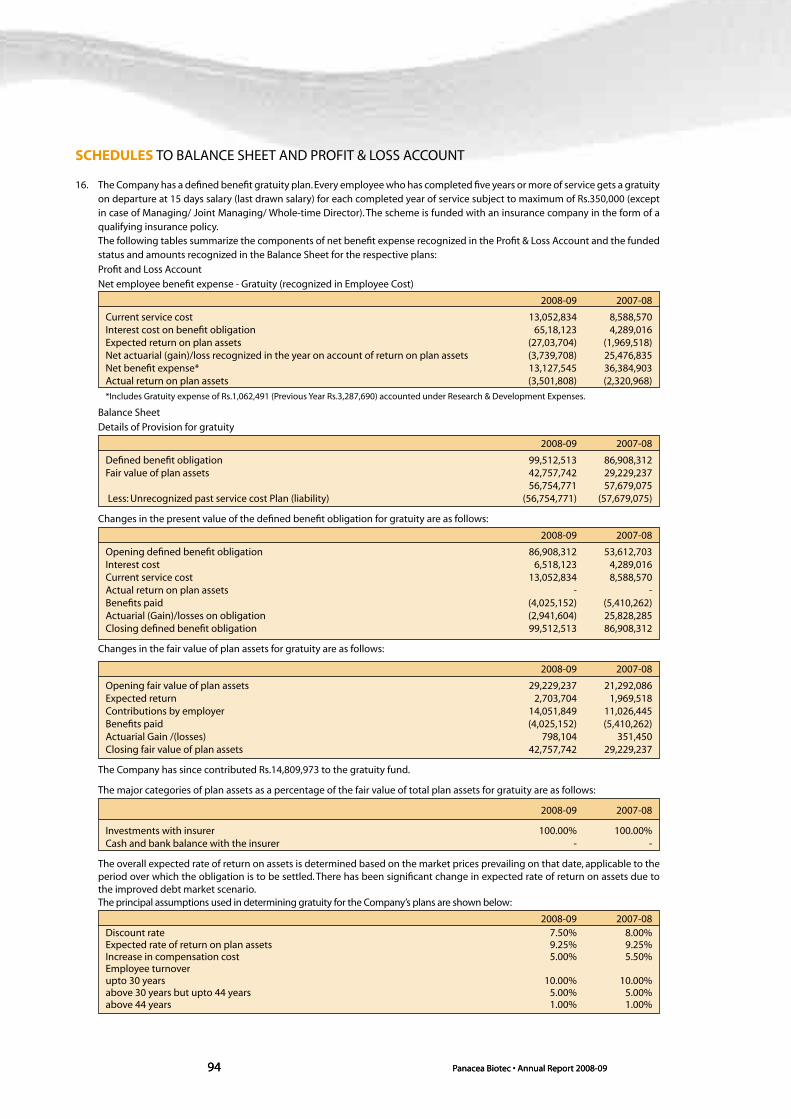
Panacea Biotec • Annual Report 2008-0994
SCHEDULES TO BALANCE SHEET AND PROFIT & LOSS ACCOUNT
16. The Company has a defined benefit gratuity plan. Every employee who has completed five years or more of service gets a gratuity on departure at 15 days salary (last drawn salary) for each completed year of service subject to maximum of Rs.350,000 (except in case of Managing/ Joint Managing/ Whole-time Director). The scheme is funded with an insurance company in the form of a qualifying insurance policy.The following tables summarize the components of net benefit expense recognized in the Profit & Loss Account and the funded status and amounts recognized in the Balance Sheet for the respective plans:
Profit and Loss Account
Net employee benefit expense - Gratuity (recognized in Employee Cost)
2008-09 2007-08
Current service cost 13,052,834 8,588,570Interest cost on benefit obligation 65,18,123 4,289,016Expected return on plan assets (27,03,704) (1,969,518)Net actuarial (gain)/loss recognized in the year on account of return on plan assets (3,739,708) 25,476,835Net benefit expense* 13,127,545 36,384,903Actual return on plan assets (3,501,808) (2,320,968)
*Includes Gratuity expense of Rs.1,062,491 (Previous Year Rs.3,287,690) accounted under Research & Development Expenses.
Balance Sheet
Details of Provision for gratuity
2008-09 2007-08
Defined benefit obligation 99,512,513 86,908,312Fair value of plan assets 42,757,742 29,229,237 56,754,771 57,679,075 Less: Unrecognized past service cost Plan (liability) (56,754,771) (57,679,075)
Changes in the present value of the defined benefit obligation for gratuity are as follows:
2008-09 2007-08
Opening defined benefit obligation 86,908,312 53,612,703Interest cost 6,518,123 4,289,016Current service cost 13,052,834 8,588,570Actual return on plan assets - -Benefits paid (4,025,152) (5,410,262)Actuarial (Gain)/losses on obligation (2,941,604) 25,828,285Closing defined benefit obligation 99,512,513 86,908,312
Changes in the fair value of plan assets for gratuity are as follows:
2008-09 2007-08
Opening fair value of plan assets 29,229,237 21,292,086Expected return 2,703,704 1,969,518Contributions by employer 14,051,849 11,026,445Benefits paid (4,025,152) (5,410,262)Actuarial Gain /(losses) 798,104 351,450Closing fair value of plan assets 42,757,742 29,229,237
The Company has since contributed Rs.14,809,973 to the gratuity fund.
The major categories of plan assets as a percentage of the fair value of total plan assets for gratuity are as follows:
2008-09 2007-08
Investments with insurer 100.00% 100.00%Cash and bank balance with the insurer - -
The overall expected rate of return on assets is determined based on the market prices prevailing on that date, applicable to the period over which the obligation is to be settled. There has been significant change in expected rate of return on assets due to the improved debt market scenario.The principal assumptions used in determining gratuity for the Company’s plans are shown below:
2008-09 2007-08Discount rate 7.50% 8.00%Expected rate of return on plan assets 9.25% 9.25%Increase in compensation cost 5.00% 5.50%Employee turnover upto 30 years 10.00% 10.00%above 30 years but upto 44 years 5.00% 5.00%above 44 years 1.00% 1.00%
Panacea Biotec • Annual Report 2008-0994
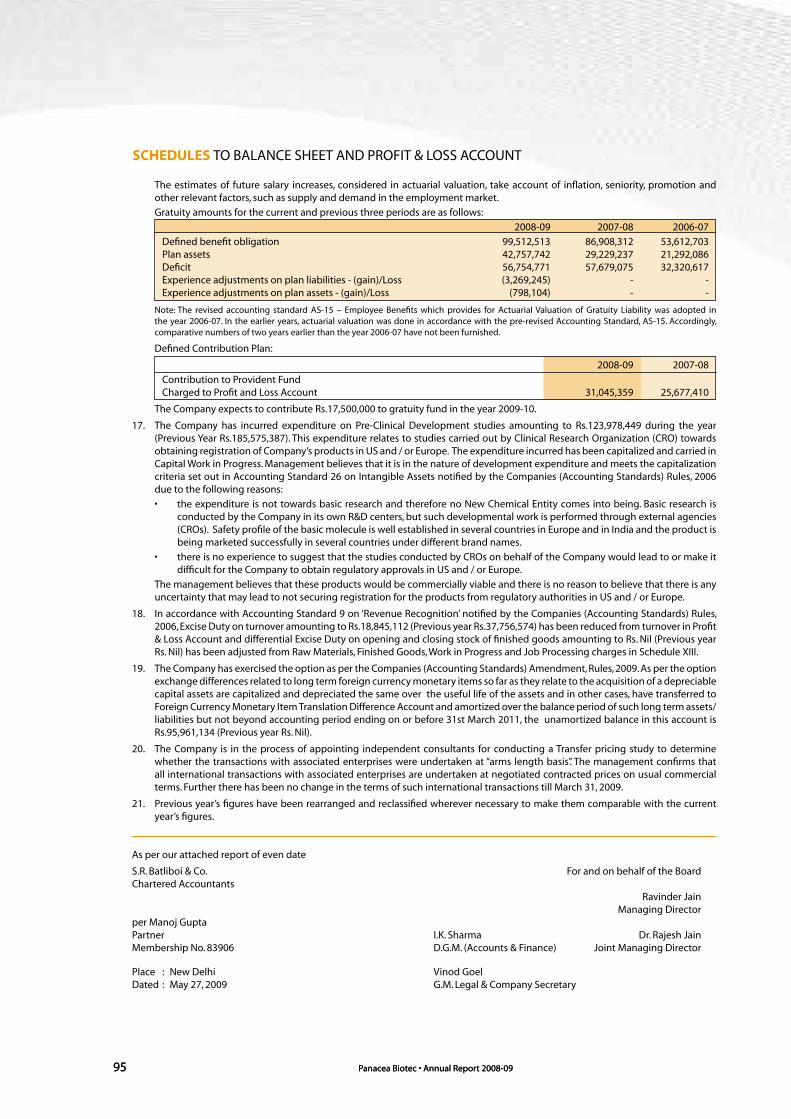
Panacea Biotec • Annual Report 2008-0995
The estimates of future salary increases, considered in actuarial valuation, take account of inflation, seniority, promotion and other relevant factors, such as supply and demand in the employment market.
Gratuity amounts for the current and previous three periods are as follows:
2008-09 2007-08 2006-07
Defined benefit obligation 99,512,513 86,908,312 53,612,703Plan assets 42,757,742 29,229,237 21,292,086Deficit 56,754,771 57,679,075 32,320,617Experience adjustments on plan liabilities - (gain)/Loss (3,269,245) - -Experience adjustments on plan assets - (gain)/Loss (798,104) - -
Note: The revised accounting standard AS-15 – Employee Benefits which provides for Actuarial Valuation of Gratuity Liability was adopted in the year 2006-07. In the earlier years, actuarial valuation was done in accordance with the pre-revised Accounting Standard, AS-15. Accordingly, comparative numbers of two years earlier than the year 2006-07 have not been furnished.
Defined Contribution Plan:
2008-09 2007-08
Contribution to Provident Fund Charged to Profit and Loss Account 31,045,359 25,677,410
The Company expects to contribute Rs.17,500,000 to gratuity fund in the year 2009-10.
17. The Company has incurred expenditure on Pre-Clinical Development studies amounting to Rs.123,978,449 during the year (Previous Year Rs.185,575,387). This expenditure relates to studies carried out by Clinical Research Organization (CRO) towards obtaining registration of Company’s products in US and / or Europe. The expenditure incurred has been capitalized and carried in Capital Work in Progress. Management believes that it is in the nature of development expenditure and meets the capitalization criteria set out in Accounting Standard 26 on Intangible Assets notified by the Companies (Accounting Standards) Rules, 2006 due to the following reasons:
• the expenditure is not towards basic research and therefore no New Chemical Entity comes into being. Basic research is conducted by the Company in its own R&D centers, but such developmental work is performed through external agencies (CROs). Safety profile of the basic molecule is well established in several countries in Europe and in India and the product is being marketed successfully in several countries under different brand names.
• there is no experience to suggest that the studies conducted by CROs on behalf of the Company would lead to or make it difficult for the Company to obtain regulatory approvals in US and / or Europe.
The management believes that these products would be commercially viable and there is no reason to believe that there is any uncertainty that may lead to not securing registration for the products from regulatory authorities in US and / or Europe.
18. In accordance with Accounting Standard 9 on ‘Revenue Recognition’ notified by the Companies (Accounting Standards) Rules, 2006, Excise Duty on turnover amounting to Rs.18,845,112 (Previous year Rs.37,756,574) has been reduced from turnover in Profit & Loss Account and differential Excise Duty on opening and closing stock of finished goods amounting to Rs. Nil (Previous year Rs. Nil) has been adjusted from Raw Materials, Finished Goods, Work in Progress and Job Processing charges in Schedule XIII.
19. The Company has exercised the option as per the Companies (Accounting Standards) Amendment, Rules, 2009. As per the option exchange differences related to long term foreign currency monetary items so far as they relate to the acquisition of a depreciable capital assets are capitalized and depreciated the same over the useful life of the assets and in other cases, have transferred to Foreign Currency Monetary Item Translation Difference Account and amortized over the balance period of such long term assets/liabilities but not beyond accounting period ending on or before 31st March 2011, the unamortized balance in this account is Rs.95,961,134 (Previous year Rs. Nil).
20. The Company is in the process of appointing independent consultants for conducting a Transfer pricing study to determine whether the transactions with associated enterprises were undertaken at “arms length basis”. The management confirms that all international transactions with associated enterprises are undertaken at negotiated contracted prices on usual commercial terms. Further there has been no change in the terms of such international transactions till March 31, 2009.
21. Previous year’s figures have been rearranged and reclassified wherever necessary to make them comparable with the current year’s figures.
As per our attached report of even date
S.R. Batliboi & Co. For and on behalf of the BoardChartered Accountants Ravinder Jain Managing Directorper Manoj GuptaPartner I.K. Sharma Dr. Rajesh JainMembership No. 83906 D.G.M. (Accounts & Finance) Joint Managing Director
Place : New Delhi Vinod GoelDated : May 27, 2009 G.M. Legal & Company Secretary
SCHEDULES TO BALANCE SHEET AND PROFIT & LOSS ACCOUNT
Panacea Biotec • Annual Report 2008-0995

Panacea Biotec • Annual Report 2008-0996
ADDITIONAL INFORMATION AS REQUIRED UNDER PART IV OF SCHEDULE VI TO THE COMPANIES ACT, 1956
1. Registration Details
Registration No. 22350 State Code 16
Balance Sheet Date 31/03/2009
2. Capital raised during the year (Amount in Rs. Thousand)
Public Issue Nil Right Issue Nil
Bonus Issue Nil Private Placement Nil
3. Position of mobilization and deployment of Funds (Amount in Rs. Thousand)
Total Liabilities 13,488,214 Total Assets 13,488,214
Source of Funds
Paid up Capital 66,786 Reserves & Surplus 6,084,707
Secured Loans 4,835,939 Unsecured Loans 2,166,996
Deferred Tax Liability 333,786
Application of Funds
Net Fixed Assets 6,938,703 Investments 2,165,698
Net Current Assets 4,284,200 Foreign Currency Monetary
Misc. Expenditure 3,652 Item Translation Difference Account 95,961
(to the extent not W/off )
Accumulated Losses Nil
4. Performance of Company (Amount in Rs. Thousand)
Turnover (Including Other Income) 7,993,849 Total Expenditure 8,917,590
Profit/Loss Before Tax 923,741 Profit/Loss after Tax 690,497
Earnings per share (Rs.) 10.35 Dividend @ Nil
5. Generic Name of Three Principal Products/ Services of Company
Item Code No. (ITC Code) 3002 20 14
Product Description Vaccine-Polio
Item Code No. (ITC Code) 3004 20 99
Product Description Gliclazide Tab
Item Code No. (ITC Code) 3004 90 67
Product Description Nimesulide Tab
For and on behalf of the Board
Ravinder Jain Managing Director
I.K. Sharma Dr. Rajesh Jain D.G.M. (Accounts & Finance) Joint Managing Director
Place : New Delhi Vinod GoelDated : May 27, 2009 G.M. Legal & Company Secretary
Panacea Biotec • Annual Report 2008-0996

Panacea Biotec • Annual Report 2008-0997
Amount in Rs.
Current Year Previous Year
CASH FLOW STATEMENT ANNEXED TO BALANCE SHEET FOR THE YEAR ENDED 31ST MARCH, 2009
As per our attached report of even date
S.R. Batliboi & Co. For and on behalf of the BoardChartered Accountants Ravinder Jain Managing Directorper Manoj GuptaPartner I.K. Sharma Dr. Rajesh JainMembership No. 83906 D.G.M. (Accounts & Finance) Joint Managing Director
Place : New Delhi Vinod GoelDated : May 27, 2009 G.M. Legal & Company Secretary
A. Cash Flow from Operating Activities: Net Operating Profit/(Loss) before Tax & Extraordinary Items (923,740,873) 1,903,858,280 Adjustments for: Depreciation 705,099,242 430,008,915 Interest Expenses 321,070,800 116,324,021 Provision for Doubtful Debts & Advances 384,794 27,044,708 Interest Income (168,062,520) (46,007,840) Dividend Income (18,367,280) - (Profit)/ Loss on sale of Fixed Assets (Net) (7,171,144) (22,887,632) (Profit)/ Loss on sale of Investments (1,257,126) (8,062,060) Intangibles written off - 2,103,721 Unrealized foreign exchange loss/(gain) (net) 1,675,903,989 (102,855,667) Amortised exchange differences 47,980,567 - Deferred Revenue Expenditure written off during the year 1,682,400 1,682,400 Provision for Impairment & Doubtful Loan 284,178,318 2,841,442,040 - 397,350,566 Operating Profit before Working Capital changes 1,917,701,167 2,301,208,846 (Increase)/ Decrease in Trade and Other Receivables 221,686,892 (489,944,478) (Increase)/ Decrease in Inventories (2,361,589,208) (34,819,396) Increase/ (Decrease) in Current Liabilities & Provisions 507,284,405 (1,632,617,911) (287,252,490) (812,016,364) Cash generated from Operations 285,083,256 1,489,192,482 Net Income Taxes Paid 235,177,426 336,539,746 Net cash from Operating Activities 49,905,830 1,152,652,736B. Cash flow from Investing Activities: Purchase of Fixed Assets (1,614,772,785) (1,647,516,871) Proceeds of deposits matured (with maturity 1,250,968,300 402,060,214 more than three months) Deposits (with maturity more than three months) (70,467,843) (1,250,968,300) Trade Investment in Shares of Joint Venture/ Subsidiary Companies (283,200,650) (1,791,200,000) Non-trade Investment in Shares of Associate (41,257,126) (40,000,000) Loan to Joint Venture & Subsidiary Companies (747,317,829) (39,778,050) Sale of Non-trade Investments in Partnership Firm 41,257,126 19,428,500 Sale of Fixed Assets 42,514,714 30,654,398 Interest Received 142,045,313 46,499,370 Dividends received 18,367,280 - Net cash used in investing activities (1,261,863,500) (4,270,820,739) Net cash from Operating and Investing Activities (1,211,957,670) (3,118,168,003)C. Cash flow from Financing Activities: Net increase / (Decrease) in Working Capital Borrowings 1,265,036,897 251,094,912 Long Term Borrowings raised 840,998,055 1,787,500,000 Fixed Deposits received 300,500,000 436,110,000 Fixed Deposits repaid (436,110,000) (169,390,000) Interest paid (321,130,220) (119,446,466) Dividend paid (66,693,746) (65,706,192) Tax paid on Dividend Distribution (11,334,602) (11,166,767) Net Cash from Financing activities 1,571,266,384 2,108,995,487 Net Cash from Operating, Investing & Financing Activities 359,308,714 (1,009,172,516) Net increase in Cash & Cash equivalent 359,308,714 (1,009,172,516) Opening balance of Cash & Cash equivalent 160,834,507 1,169,181,050 Closing balance of Cash & Cash equivalent 520,143,221 160,008,534 Components of cash and cash equivalents: i) Cash Balance on Hand 579,589 1,449,297 ii) Balance with Scheduled Banks : a) In Current Accounts 25,557,539 33,723,242 b) In Unpaid Dividend Accounts* 1,583,956 1,536,608 c) On Fixed Deposits 70,467,843 1,250,968,300 d) In Exchange Earner Foreign Currency Current Accounts 496,620,469 124,125,360Cash & Bank Balances as per Schedule VII 594,809,396 1,411,802,807Less: Fixed deposits for maturity period more than 3 months (70,467,843) (1,250,968,300) 524,341,553 160,834,507Less: Effect of Exchange Differences on Cash & Cash Equivalents held in foreign currency (4,198,332) (825,973)Cash & Cash Equivalents in Cash Flow Statement 520,143,221 160,008,534
* These balances are not available for use by the Company as they represent corresponding unpaid dividend liabilities.
Panacea Biotec • Annual Report 2008-0997

Panacea Biotec • Annual Report 2008-0998
STATEMENT U/S 212 OF THE COMPANIES ACT, 1956 RELATING TO SUBSIDIARY COMPANIES
For and on behalf of the Board
Ravinder Jain
Managing Director
I.K. Sharma Dr. Rajesh Jain
D.G.M. (Accounts & Finance) Joint Managing Director
Place : New Delhi Vinod Goel
Dated : May 27, 2009 G.M. Legal & Company Secretary
Name of the Company Best On Radicura & Panacea Panacea Sunanda Umkal Panacea Panacea Panacea Rees Kelisia Kelisia Panacea Health Ltd. Co. Ltd.* Hospitality Educational Steel Medical Biotec Biotec, Biotec Investments Holdings investment Biotec Pvt. Ltd.* Institute Co. Ltd.* Institute GmbH# Inc. FZE Ltd. Ltd.† Holdings (International) Pvt. Ltd.* Pvt. Ltd. AG† †$ SA† † †$
As on 31st March, 2009Capital 8,538,826 1,982,500 100,000 100,000 500,000 16,984,817 1,688,503 5,072 6,947,930 507 67,525 4,450,198 4,450,197Reserves & Surplus 2,029,644,520 8,481,818 (95,257) (94,101) (172,808) 50,184,267 61548 (542,704) (92,209) (1,906,108) (42,574,383) (854,903) (332,354)Total Assets 2,068,018,228 324,467,400 299,018,440 319,630,000 213,235,206 67,169,084 1,817,591 532,741 7,007,767 738,063,847 716,433,985 5,540,015 4,804,013Total Liabilities 2,068,018,228 324,467,400 299,018,440 319,630,000 213,235,206 67,169,084 1,817,591 532,741 7,007,767 738,063,847 716,433,985 5,540,015 4,804,013Details of Investment - 100,000 - - - 76,354 - 649,777,352 - (except in case of Investment in Subsidiary)For the year/ period ended 31st March, 2009Turnover (including other 43,159,027 86,061 13,653 13,160 3,144 1,516,249 198,969 - 25,020,017 - - 9,306 income)Profit/ (Loss) before tax 36,917,373 (373,217) (91,038) (90,034) (40,345) 1,293,940 59,639 (485,926) (82,560) (1,706,647) (41,380,725) (810,538) (314,915)Provision for Tax 13,660,268 (367) 4,219 4,067 6,023 481,247 - - 0 6,807 (1,939)Profit after Tax 23,257,105 (373,584) (95,257) (94,101) (46,368) 812,693 59,639 (485,926) (82,560) (1,706,647) (41,380,725) (817,345) (312,976)Proposed Dividend - - - -
* Wholly owned subsidiary till 24.01.08 and became indirect subsidiary through Best On Health Ltd. from 25.01.08.† Indirect Subsidiary through Rees Investments Ltd.† † Indirect Subsidiary through Kelisia Holdings Ltd.† † † Indirect Subsidiary through Kelisia Investment Holdings AG.# Unaudited.$ The first financial year shall and on 31st March, 2010. For consolidation purposes the unaudited management accounts for the period upto 31st March, 2009 has been taken into account.Note: In terms of approval granted by the Central Government under section 212(8) of the Companies Act,1956, a copy of the Balance Sheet, Profit & Loss Account , Report of the Board of Directors and the report of the Auditors of the subsidiary companies have not been attached with the annual report of the Company. The Company will make available these documents and the related details upon request by any investor of the Company and of its subsidiary. These documents will also be available for inspection by any investor at the Head office of the Company and subsidiary company concerned.
FINANCIAL DETAILS OF SUBSIDIARY COMPANIES:
Panacea Biotec • Annual Report 2008-0998
1. Name of the Company Best On Radicura & Panacea Panacea Sunanda Umkal Panacea Panacea Panacea Rees Kelisia Kelisia Panacea Health Ltd. Co. Ltd.* Hospitality Educational Steel Medical Biotec Biotec, Biotec Investments Holdings investment Biotec Pvt. Ltd.* Institute Co. Ltd.* Institute GmbH# Inc. FZE Ltd. Ltd.† Holdings (International) Pvt. Ltd.* Pvt. Ltd. AG† †$ SA† † †$
2. Date from which they became subsidiary company 15th March, 16th July, 23rd Aug, 23rd Aug, 5th Sep, 30 June, 11th June, 15th July, 16th March, 16th Sep., 18th Sep., 22nd Oct., 19th Feb., 2000 1999 2007 2007 2007 2008 2008 2008 2008 2008 2008 2008 20093. Financial Year of the subsidiary ended on 31st March, 31st March, 31st March, 31st March, 31st March, 31st March, 31st March, 31st March, 31st March, 31st March, 31st March, - - 2009 2009 2009 2009 2009 2009 2009 2009 2009 2009 2009 4. Shares of the subsidiary held by Panacea Biotec Ltd. on the above dates i) Number & 1,902,160 1,98,250 100,000 100,000 500,000 3,765,701 Nil Nil 5 1,000 1000 1000 1000 Face Value Re.1 Rs.10 Re.1 Re.1 Re.1 Rs.10 - - AED 100000 US $ 0.01 € 1 CHF 100 CHF 100 ii) Extent of holding 100% 100% 100% 100% 100% 75.2% 100% 100% 100% 100% 100% 100% 100%5. Net aggregate Profit or (Loss) for the current year (in Rs.) 23,257,105 (373,584) (95,257) (94,101) (46,368) 812,693 59,639 (485,926) (82,560) (1,706,647) (41,380,725) (817,345) (312,976)6. Net aggregate amounts of the Profits or (Losses) of the subsidiary so far as it concerns the members of the holding company and is dealt with in the accounts of holding company: a. for the financial year of the subsidiary - - - - - - - - - - - - - b. for the previous financial years of the subsidiary since it became its subsidiary - - - - - - - - - - - - -7. Net aggregate amounts of the Profits or (Losses) of the subsidiary so far as it concerns the members of the holding company and is not dealt with in the accounts of holding company a. for the financial year of the subsidiary 23,257,105 (373,584) (95,257) (94,101) (46,368) 812,693 59,639 (485,926) (82,560) (1,706,647) (41,380,725) (817,345) (312,976) b. for the previous financial years of the subsidiary since it became its subsidiary 11,613,577 222,031 - - (126,440) - - - - - - - -
* Wholly owned subsidiary till 24.01.08 and became indirect subsidiary through Best On Health Ltd. from 25.01.08.† Indirect Subsidiary through Rees Investments Ltd.† † Indirect Subsidiary through Kelisia Holdings Ltd.† † † Indirect Subsidiary through Kelisia Investment Holdings AG.# Unaudited.$ The first financial year shall and on 31st March, 2010. For consolidation purposes the unaudited management accounts for the period upto 31st March, 2009 has been taken into account.
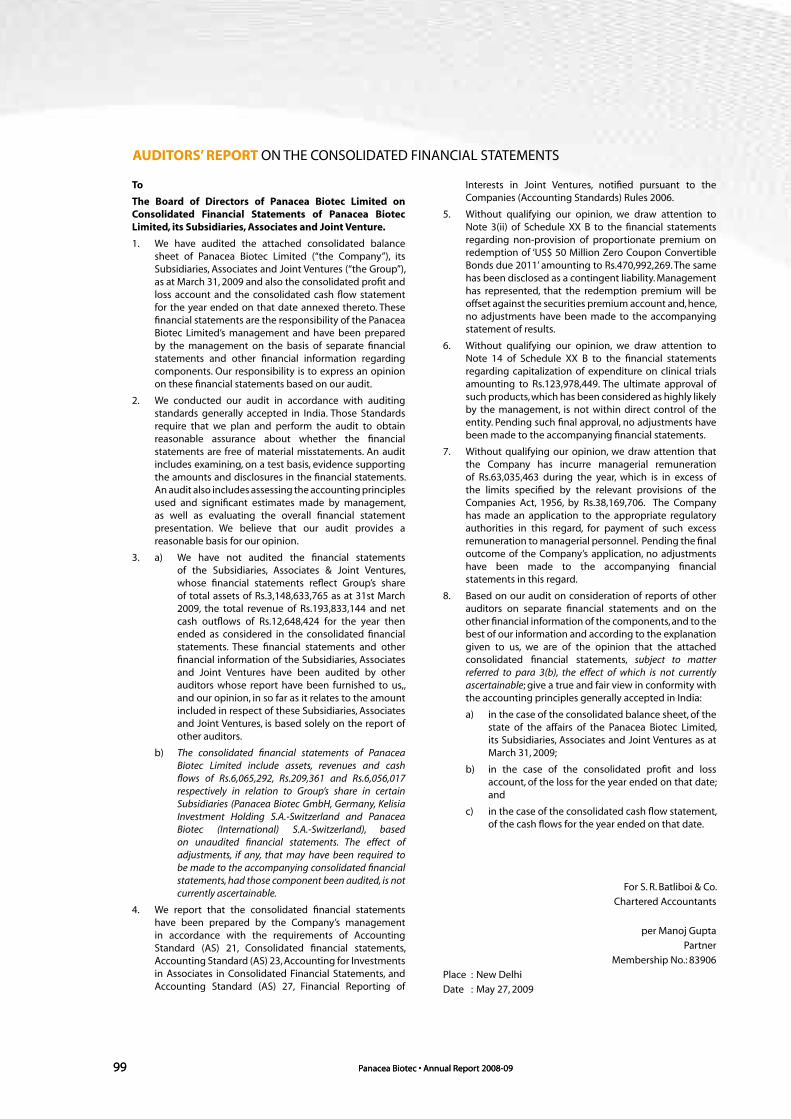
Panacea Biotec • Annual Report 2008-0999
AUDITORS’ REPORT ON THE CONSOLIDATED FINANCIAL STATEMENTS
To
The Board of Directors of Panacea Biotec Limited on Consolidated Financial Statements of Panacea Biotec Limited, its Subsidiaries, Associates and Joint Venture.
1. We have audited the attached consolidated balance sheet of Panacea Biotec Limited (“the Company”), its Subsidiaries, Associates and Joint Ventures (“the Group”), as at March 31, 2009 and also the consolidated profit and loss account and the consolidated cash flow statement for the year ended on that date annexed thereto. These financial statements are the responsibility of the Panacea Biotec Limited’s management and have been prepared by the management on the basis of separate financial statements and other financial information regarding components. Our responsibility is to express an opinion on these financial statements based on our audit.
2. We conducted our audit in accordance with auditing standards generally accepted in India. Those Standards require that we plan and perform the audit to obtain reasonable assurance about whether the financial statements are free of material misstatements. An audit includes examining, on a test basis, evidence supporting the amounts and disclosures in the financial statements. An audit also includes assessing the accounting principles used and significant estimates made by management, as well as evaluating the overall financial statement presentation. We believe that our audit provides a reasonable basis for our opinion.
3. a) We have not audited the financial statements of the Subsidiaries, Associates & Joint Ventures, whose financial statements reflect Group’s share of total assets of Rs.3,148,633,765 as at 31st March 2009, the total revenue of Rs.193,833,144 and net cash outflows of Rs.12,648,424 for the year then ended as considered in the consolidated financial statements. These financial statements and other financial information of the Subsidiaries, Associates and Joint Ventures have been audited by other auditors whose report have been furnished to us,, and our opinion, in so far as it relates to the amount included in respect of these Subsidiaries, Associates and Joint Ventures, is based solely on the report of other auditors.
b) The consolidated financial statements of Panacea Biotec Limited include assets, revenues and cash flows of Rs.6,065,292, Rs.209,361 and Rs.6,056,017 respectively in relation to Group’s share in certain Subsidiaries (Panacea Biotec GmbH, Germany, Kelisia Investment Holding S.A.-Switzerland and Panacea Biotec (International) S.A.-Switzerland), based on unaudited financial statements. The effect of adjustments, if any, that may have been required to be made to the accompanying consolidated financial statements, had those component been audited, is not currently ascertainable.
4. We report that the consolidated financial statements have been prepared by the Company’s management in accordance with the requirements of Accounting Standard (AS) 21, Consolidated financial statements, Accounting Standard (AS) 23, Accounting for Investments in Associates in Consolidated Financial Statements, and Accounting Standard (AS) 27, Financial Reporting of
Interests in Joint Ventures, notified pursuant to the Companies (Accounting Standards) Rules 2006.
5. Without qualifying our opinion, we draw attention to Note 3(ii) of Schedule XX B to the financial statements regarding non-provision of proportionate premium on redemption of ‘US$ 50 Million Zero Coupon Convertible Bonds due 2011’ amounting to Rs.470,992,269. The same has been disclosed as a contingent liability. Management has represented, that the redemption premium will be offset against the securities premium account and, hence, no adjustments have been made to the accompanying statement of results.
6. Without qualifying our opinion, we draw attention to Note 14 of Schedule XX B to the financial statements regarding capitalization of expenditure on clinical trials amounting to Rs.123,978,449. The ultimate approval of such products, which has been considered as highly likely by the management, is not within direct control of the entity. Pending such final approval, no adjustments have been made to the accompanying financial statements.
7. Without qualifying our opinion, we draw attention that the Company has incurre managerial remuneration of Rs.63,035,463 during the year, which is in excess of the limits specified by the relevant provisions of the Companies Act, 1956, by Rs.38,169,706. The Company has made an application to the appropriate regulatory authorities in this regard, for payment of such excess remuneration to managerial personnel. Pending the final outcome of the Company’s application, no adjustments have been made to the accompanying financial statements in this regard.
8. Based on our audit on consideration of reports of other auditors on separate financial statements and on the other financial information of the components, and to the best of our information and according to the explanation given to us, we are of the opinion that the attached consolidated financial statements, subject to matter referred to para 3(b), the effect of which is not currently ascertainable; give a true and fair view in conformity with the accounting principles generally accepted in India:
a) in the case of the consolidated balance sheet, of the state of the affairs of the Panacea Biotec Limited, its Subsidiaries, Associates and Joint Ventures as at March 31, 2009;
b) in the case of the consolidated profit and loss account, of the loss for the year ended on that date; and
c) in the case of the consolidated cash flow statement, of the cash flows for the year ended on that date.
For S. R. Batliboi & Co.
Chartered Accountants
per Manoj Gupta
Partner
Membership No.: 83906
Place : New Delhi
Date : May 27, 2009
Panacea Biotec • Annual Report 2008-0999
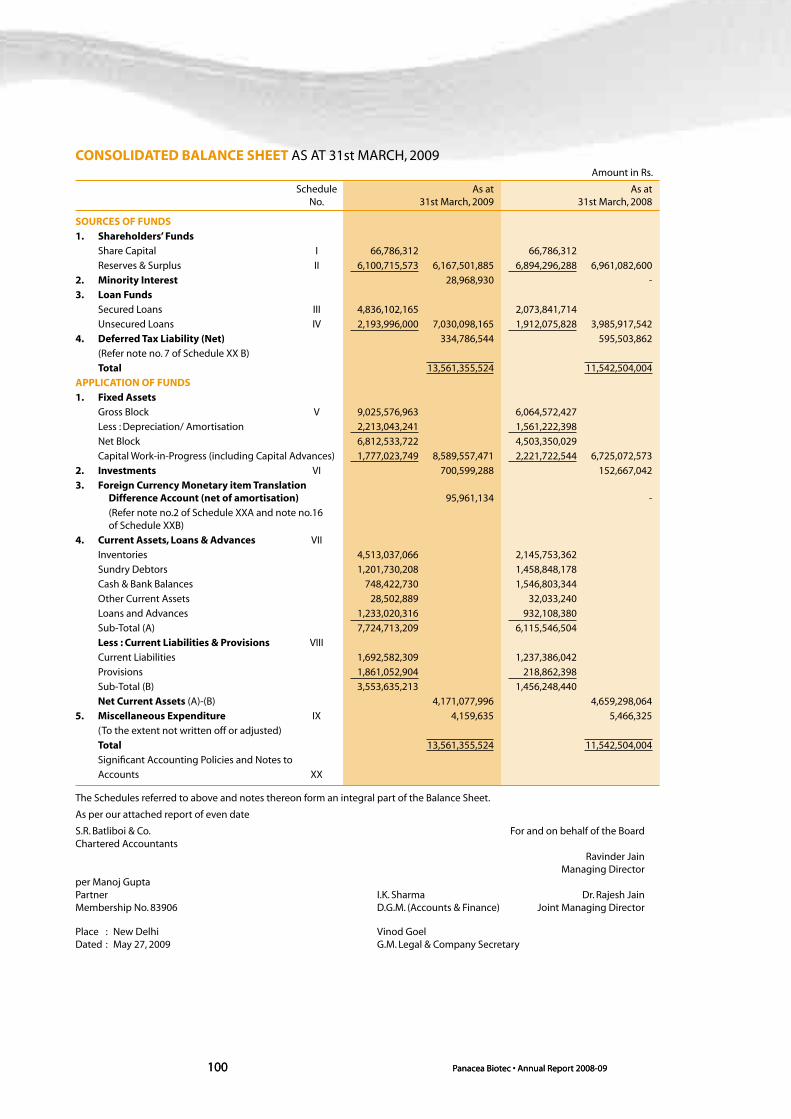
Panacea Biotec • Annual Report 2008-09100
CONSOLIDATED BALANCE SHEET AS AT 31st MARCH, 2009 Amount in Rs.
Schedule As at As at No. 31st March, 2009 31st March, 2008
The Schedules referred to above and notes thereon form an integral part of the Balance Sheet.
As per our attached report of even date
S.R. Batliboi & Co. For and on behalf of the BoardChartered Accountants Ravinder Jain Managing Directorper Manoj GuptaPartner I.K. Sharma Dr. Rajesh JainMembership No. 83906 D.G.M. (Accounts & Finance) Joint Managing Director
Place : New Delhi Vinod GoelDated : May 27, 2009 G.M. Legal & Company Secretary
SOURCES OF FUNDS
1. Shareholders’ Funds
Share Capital I 66,786,312 66,786,312
Reserves & Surplus II 6,100,715,573 6,167,501,885 6,894,296,288 6,961,082,600
2. Minority Interest 28,968,930 -
3. Loan Funds
Secured Loans III 4,836,102,165 2,073,841,714
Unsecured Loans IV 2,193,996,000 7,030,098,165 1,912,075,828 3,985,917,542
4. Deferred Tax Liability (Net) 334,786,544 595,503,862
(Refer note no. 7 of Schedule XX B)
Total 13,561,355,524 11,542,504,004
APPLICATION OF FUNDS
1. Fixed Assets
Gross Block V 9,025,576,963 6,064,572,427
Less : Depreciation/ Amortisation 2,213,043,241 1,561,222,398
Net Block 6,812,533,722 4,503,350,029
Capital Work-in-Progress (including Capital Advances) 1,777,023,749 8,589,557,471 2,221,722,544 6,725,072,573
2. Investments VI 700,599,288 152,667,042
3. Foreign Currency Monetary item Translation Difference Account (net of amortisation) 95,961,134 -
(Refer note no.2 of Schedule XXA and note no.16 of Schedule XXB)
4. Current Assets, Loans & Advances VII
Inventories 4,513,037,066 2,145,753,362
Sundry Debtors 1,201,730,208 1,458,848,178
Cash & Bank Balances 748,422,730 1,546,803,344
Other Current Assets 28,502,889 32,033,240
Loans and Advances 1,233,020,316 932,108,380
Sub-Total (A) 7,724,713,209 6,115,546,504
Less : Current Liabilities & Provisions VIII
Current Liabilities 1,692,582,309 1,237,386,042
Provisions 1,861,052,904 218,862,398
Sub-Total (B) 3,553,635,213 1,456,248,440
Net Current Assets (A)-(B) 4,171,077,996 4,659,298,064
5. Miscellaneous Expenditure IX 4,159,635 5,466,325
(To the extent not written off or adjusted)
Total 13,561,355,524 11,542,504,004
Significant Accounting Policies and Notes to
Accounts XX
Panacea Biotec • Annual Report 2008-09100

Panacea Biotec • Annual Report 2008-09101
CONSOLIDATED PROFIT & LOSS ACCOUNT FOR THE YEAR ENDED 31st MARCH, 2009 Amount in Rs.
Schedule For the Year Ended For the Year Ended No. 31st March, 2009 31st March, 2008
The Schedules referred to above and notes thereon form an integral part of the Profit & Loss Account.
As per our attached report of even date
S.R. Batliboi & Co. For and on behalf of the BoardChartered Accountants Ravinder Jain Managing Directorper Manoj GuptaPartner I.K. Sharma Dr. Rajesh JainMembership No. 83906 D.G.M. (Accounts & Finance) Joint Managing Director
Place : New Delhi Vinod GoelDated : May 27, 2009 G.M. Legal & Company Secretary
INCOME
Turnover (Gross) X 7,900,564,192 8,451,191,934
Less: Excise Duty 18,845,112 7,881,719,080 37,756,574 8,413,435,360
Other Income XI 311,956,924 382,935,788
Total Income 8,193,676,004 8,796,371,148
EXPENDITURE
Purchases of Finished Goods 186,401,696 183,130,827
Raw and packing material consumed XII 2,952,548,877 3,469,053,324
Operating and other expenses XIII 3,393,917,326 780,786,184
(Increase) in inventories XIV (452,622,474) (4,589,126)
Personnel Expenses XV 956,778,484 980,414,224
Selling & Distribution Expenses XVI 458,230,492 482,787,420
Research & Development Expenses XVII 669,944,045 541,856,123
Financial expenses XVIII 348,181,812 150,677,689
Depreciation/ Amortisation V 545,172,635 334,533,723
Miscellaneous Expenditure written off during the year IX 1,787,071 1,695,701
Total Expenditure 9,060,339,964 6,920,346,089
Profit Before Tax (866,663,960) 1,876,025,059
Provision for Income Tax 24,396,207 340,994,978
Provision for Income Tax for earlier years 89,323 -
Deferred Income Tax (Credit)/Charge (260,618,147) 212,707,641 (Refer note no.7 of Schedule XX B)
Provision for Fringe Benefit Tax 29,393,489 32,505,702
Profit After Tax (659,924,832) 1,289,816,738
Add: Balance brought forward from previous year 2,806,000,020 1,675,618,296
Add: Share of Profit in Partnership Firm - 699,983
Add: Share of Profit/ (Loss) in Associate 5,306,590 (939,432)
Add: Share of Minority Interests in (Profit)/ Losses (188,030) -
Add: (Profit)/ Losses on the date of closure of Joint Venture - 52,002,560
Profit available for Appropriations 2,151,193,748 3,017,198,145
APPROPRIATIONS
Dividend
- Equity Shares-Proposed (not liable to TDS) - 66,693,746
- Preference Shares - Interim (not liable to TDS) 33,184 -
Dividend Distribution Tax 3,127,240 11,334,602
Transfer to General Reserve 2,300,000 133,169,777
Balance carried to Balance Sheet 2,145,733,324 2,806,000,020
Basic Earnings per Share XIX (9.90) 19.51
Diluted Earnings per Share XIX (9.90) 18.25
Face value per Share 1.00 1.00
Significant Accounting Policies and Notes to
Accounts XX
Panacea Biotec • Annual Report 2008-09101

Panacea Biotec • Annual Report 2008-09102
Amount in Rs.
As at As at 31st March, 2009 31st March, 2008
SCHEDULES TO CONSOLIDATED BALANCE SHEET AND PROFIT & LOSS ACCOUNT
Schedule I - Share CapitalAuthorisedComprising of i . 125,000,000 Equity Shares of Re.1 each (Previous 125,000,000 125,000,000 Year 125,000,000 Equity Shares of Re. 1 each)ii. 110,000,000 (Previous year 110,000,000) Preference Shares of Rs.10 each 1,100,000,000 1,100,000,000 1,225,000,000 1,225,000,000Issued and Subscribed66,842,746 Equity Shares of Re.1 each (Previous Year 66,842,746 66,842,746 66,842,746 Equity Shares of Re.1 each) 66,842,746 66,842,746Paid up66,693,746 (Previous Year 66,693,746) Equity Shares 66,693,746 66,693,746 of Re.1 each fully paid-upAdd: Forfeited Shares (14,900 Shares @ Rs.10 each forfeited on May 15, 1999, which were later on sub-divided into 149,000 Equity Shares of Re.1 each on February 12, 2003) 92,566 66,786,312 92,566 66,786,312
(149,000 Forfeited Shares have been allotted on 24th August, 2005 in the name of
employees of the company for sale thereof at the prevailing market prices through
recognised Stock Exchanges on the terms & conditions as specified by Managing /
Joint Managing Directors or Director of the company and reimbursement
of net sales proceeds to the company account)
(Out of the above shares, 1,814,240 Equity Shares of Rs.10 each were issued as fully paid up
bonus shares by capitalisation of General Reserves in earlier years, which were later on
sub-divided into 18,142,400 Equity Shares of Re.1/- each on February 12, 2003)
66,786,312 66,786,312
Schedule II - Reserves and Surplus1) Capital Redemption Reserve Amount as per last Balance Sheet 1,016,849,140 1,016,849,1402) Securities Premium Amount as per Last Balance Sheet 2,785,103,626 2,456,358,602 Add : Credited Upon Issue of Equity Shares on - 326,481,758 conversion of FCCBs Add : Credited Upon Issue of Equity Shares - 2,785,103,626 2,263,266 2,785,103,6263) General Reserve Amount as per last Balance Sheet 279,334,119 146,164,342 Add : Transfer from Profit & Loss Account 2,300,000 133,169,777 Less: Exchange Differences of Earlier Years capitalised 37,586,515 - to Fixed Assets (Net of Depreciation Rs.1,609,882) (Refer note no.2 of Schedule XX A and note no.16 of Schedule XX B) Less: Exchange Differences of Earlier Years Transferred 92,470,318 151,577,286 - 279,334,119 to the “Foreign Currency Monetary item Translation Differences Account” (Refer note no.2 of Schedule XX A and note no.16 of Schedule XX B)4) Foreign Currency Translation Reserve Amount as per last Balance Sheet 7,009,383 1,394,060 Less : Transfer to P&L Account 7,009,383 - Add : Additions during the year 1,452,197 1,452,197 5,615,323 7,009,3835) Balance in Profit & Loss Account 2,145,733,324 2,806,000,020 6,100,715,573 6,894,296,288
Panacea Biotec • Annual Report 2008-09102

Panacea Biotec • Annual Report 2008-09103
SCHEDULES TO CONSOLIDATED BALANCE SHEET AND PROFIT & LOSS ACCOUNT Amount in Rs.
As at As at 31st March, 2009 31st March, 2008
Schedule III - Secured Loans1. Foreign currency term loans (from banks)
i) State Bank of India 2,028,800,000 802,100,000 (Due within one year Rs. nil (Previous year Rs. nil) Interest Accrued & Due 12,416,668 4,974,266
ii) State Bank of Travancore 1,272,932,614 1,006,525,285 (Due within one year Rs. nil (Previous year Rs. nil)
2. Working Capital Loans from Scheduled Banks 1,521,789,762 256,752,865
3. Finance Lease Obligation - 3,083,078
4. Loan against Hypothecation of Car 163,121 406,220
4,836,102,165 2,073,841,714
Notes:1. Foreign Currency Term Loans from State Bank of India and State Bank of Travancore are secured by way of first pari-passu charge by hypothecation
of the Company’s entire movables fixed assets, both present and future and mortgage of immovable properties of the Company being land admeasuring 96 bighas, 19 biswas & 93 bighas 12 biswas & 10 Biswasi situated at Village Samalheri, Tehsil Dera Bassi, District S.A.S. Nagar (Mohali) (formerly Tehsil Rajpura, District Patiala), Punjab. The process for creation of first pari-passu charge by way of mortgage of immovable properties situated at Baddi, Himachal Pradesh is in progress. Foreign Currency Term Loan from State Bank of India is also collaterally secured by personal guarantees of the Promoter-Directors of the Company, viz. Mr. Soshil Kumar Jain, Mr. Ravinder Jain, Dr Rajesh Jain and Mr. Sandeep Jain.
2. Working Capital Loans from Scheduled Banks are secured by way of first pari-passu charge by hypothecation of all current assets and also by way of 2nd pari-passu charge on all the movable fixed assets (including machinery and spares) of the company and existing immovable fixed assets of the Company being land admeasuring 96 bighas, 19 biswas & 93 bighas 12 biswas & 10 Biswasi situated at Village Samalheri, Tehsil Dera Bassi, District S.A.S. Nagar (Mohali), Punjab. The process for creation of second pari-passu charge by way of mortgage of immovable properties situated at Baddi, Himachal Pradesh is in progress. These are also collaterally secured by personal guarantees of the Promoter-Directors of the Company, viz. Mr. Soshil Kumar Jain, Mr. Ravinder Jain, Dr Rajesh Jain and Mr. Sandeep Jain.
Schedule IV - Unsecured LoansFixed Deposits* 300,500,000 436,110,000 (Due within one year Rs.55,000,000 (Previous year Rs.432,500,000)) Interest accrued & due - 101,828
Other Loans:
Foreign Currency Convertible Bonds**
US$ 36,800,000 (Previous Year US$ 36,800,000) 1,866,496,000 1,475,864,000 Zero Coupon Convertible Bonds due 2011
(Due within one year nil (Previous Year nil)
Loan from Lakshmi & Manager Holdings Ltd. 27,000,000 -
(Due within one year Rs. nil (Previous Year Rs. nil))
2,193,996,000 1,912,075,828
Note: * Includes Rs.300,000,000 (Previous Year Rs.432,500,000) from partnership firm in which some directors and their relatives are partners. ** Foreign Currency Convertible Bonds.- Unless previously converted, redeemed or repurchased & cancelled, the remaining FCCBs of US $ 36,800,000,which were issued on 13.02.2006, will
be redeemed on Feb 14, 2011 at 142.80% of their outstanding principal amount.
Panacea Biotec • Annual Report 2008-09103

Panacea Biotec • Annual Report 2008-09104
SCHEDULES TO CONSOLIDATED BALANCE SHEET AND PROFIT & LOSS ACCOUNT
Sche
dule
V -
Fix
ed A
sset
s
(Am
ount
in R
s.)
DESC
RIPT
ION
GROS
S BLO
CK
DEPR
ECIA
TION
/AM
ORTI
SATI
ON
NET B
LOCK
As
At
Addi
tions
Sa
le/A
dj.
Othe
r As
At
As A
t Pr
ovid
ed
Sale
/Adj
. Ot
her
As A
t As
At
As A
t
01/0
4/20
08
durin
g du
ring
Mov
emen
ts**
31
/03/
2009
01
/04/
2008
du
ring
durin
g M
ovem
ents
**
31/0
3/20
09
31/0
3/20
09
31/0
3/20
08
the Y
ear*
th
e Yea
r
the Y
ear
the Y
ear
A. Ta
ngib
le A
sset
s
Land
- Fr
eeho
ld
1,35
0,60
7,65
7 45
9,37
6,64
0 27
,529
,975
(4
5,33
9)
1,78
2,40
8,98
3 -
- -
- -
1,7
82,4
08,9
83
1,35
0,60
7,65
7
Land
- Le
aseh
old
16,3
95,6
90
38,4
36,5
40
- -
54,8
32,2
30
461,
198
371,
417
- -
832,
615
53,9
99,6
15
15,9
34,4
92
Build
ings
99
9,89
2,58
4 80
6,59
9,23
5 1,
299,
258
(1,5
52,9
44)
1,80
3,63
9,61
7 20
1,98
2,38
2 11
9,23
4,49
8 22
,185
(1
55,2
94)
321,
039,
401
1,48
2,60
0,21
6 79
7,91
0,20
2
Leas
ehol
d Im
prov
emen
t 79
,322
,055
1,
717,
923
- (5
56)
81,0
39,4
22
70,4
56,0
64
7,06
2,58
7 -
(56)
77
,518
,595
3,
520,
827
8,86
5,99
1
Plan
t & M
achi
nery
2,
568,
106,
165
1,69
2,95
3,10
3 12
,443
,034
(9
,674
,542
) 4,
238,
941,
692
789,
770,
773
459,
068,
853
6,92
1,70
1 (1
,345
,729
) 1,
240,
572,
196
2,99
8,36
9,49
6 1,
778,
335,
392
Furn
iture
& Fi
tting
s 22
8,88
8,54
0 60
,786
,271
76
,076
(1
79,8
70)
289,
418,
865
98,7
39,6
56
33,3
55,9
06
(60,
741)
(3
2,55
6)
132,
123,
747
157,
295,
118
130,
148,
884
Vehi
cles
121,
431,
089
32,1
53,0
01
8,93
3,73
3 (3
2,53
8)
144,
617,
819
59,7
95,7
17
20,2
11,6
62
5,80
7,34
9 (8
,424
) 74
,191
,606
70
,426
,213
61
,635
,372
Offic
e Equ
ipm
ents
18
5,48
2,52
2 25
,750
,990
1,
749,
903
(61,
083)
20
9,42
2,52
6 67
,595
,619
19
,747
,579
1,
527,
245
(8,4
97)
85,8
07,4
56
123,
615,
070
117,
886,
903
Com
pute
r Equ
ipm
ents
14
6,39
0,24
2 24
,453
,570
27
2,99
1 (1
48,3
14)
170,
422,
507
100,
331,
177
24,9
10,4
58
177,
162
(59,
326)
12
5,00
5,14
7 45
,417
,360
46
,059
,065
TOTA
L (A)
5,
696,
516,
544
3,14
2,22
7,27
3 52
,304
,970
(1
1,69
5,18
6)
8,77
4,74
3,66
1 1,
389,
132,
586
683,
962,
960
14,3
94,9
01
(1,6
09,8
82)
2,05
7,09
0,76
3 6,
717,
652,
898
4,30
7,38
3,95
8
Capi
tal W
ork i
n Pr
ogre
ss
1,12
9,30
4,82
3 1,
790,
508,
410
Prev
ious
Year
3,
728,
463,
680
1,98
4,55
6,36
8 16
,503
,504
-
5,69
6,51
6,54
4 98
8,28
3,57
0 40
8,88
2,72
1 8,
033,
705
- 1,
389,
132,
586
4,30
7,38
3,95
8 2,
740,
180,
110
B. In
tang
ible
Ass
ets
Good
will
17
6,75
5,03
0 26
,217
,370
16
6,72
3,42
2 -
36,2
48,9
78
64,4
82,1
26
3,33
6,92
5 44
,917
,772
-
22,9
01,2
79
13,3
47,6
99
112,
272,
904
Pate
nts, T
rade
mar
ks &
Des
igns
58
,763
,187
4,
584,
400
5,29
2,94
7 -
58,0
54,6
40
45,2
77,2
13
3,03
0,79
0 1,
442,
207
- 46
,865
,796
11
,188
,844
13
,485
,974
Softw
ares
78
,654
,895
8,
111,
565
19,9
87
- 86
,746
,473
41
,681
,169
13
,524
,682
12
,437
-
55,1
93,4
14
31,5
53,0
59
36,9
73,7
26
Web
site
9,20
2,69
5 -
- -
9,20
2,69
5 9,
202,
695
- -
- 9,
202,
695
- -
Prod
uct D
evel
opm
ent
44,6
80,0
76
15,9
00,4
40
- -
60,5
80,5
16
11,4
46,6
09
10,3
42,6
85
- -
21,7
89,2
94
38,7
91,2
22
33,2
33,4
67
TOTA
L (B)
36
8,05
5,88
3 54
,813
,775
17
2,03
6,35
6 -
250,
833,
302
172,
089,
812
30,2
35,0
82
46,3
72,4
16
- 15
5,95
2,47
8 94
,880
,824
19
5,96
6,07
1
Capi
tal W
ork i
n Pr
ogre
ss
647,
718,
926
431,
214,
135
Prev
ious
Year
32
4,14
6,92
2 43
,918
,761
9,
800
- 36
8,05
5,88
3 11
5,09
6,85
7 56
,999
,178
6,
223
- 17
2,08
9,81
2 19
5,96
6,07
1 20
9,05
0,06
5
TOTA
L (A+
B)
6,06
4,57
2,42
7 3,
197,
041,
048
224,
341,
326
(11,
695,
186)
9,
025,
576,
963
1,56
1,22
2,39
8 71
4,19
8,04
2 60
,767
,317
(1
,609
,882
) 2,
213,
043,
241
6,81
2,53
3,72
2 4,
503,
350,
029
Capi
tal W
ork i
n Pr
ogre
ss
1,77
7,02
3,74
9 2,
221,
722,
544
Prev
ious
Year
4,
052,
610,
602
2,02
8,47
5,12
9 16
,513
,304
-
6,06
4,57
2,42
7 1,
103,
380,
427
465,
881,
899
8,03
9,92
8 -
1,56
1,22
2,39
8 4,
503,
350,
029
2,94
9,23
0,17
5
Note
s:
1. Fr
eeho
ld La
nd in
clude
s Lan
d am
ount
ing
to R
s.17,
285,
690
(Pre
vious
Year
Rs.1
7,28
5,69
0) p
endi
ng re
gist
ratio
n in
the n
ame o
f the
Com
pany
.2.
Build
ing
inclu
des O
ffice
Pre
mise
s am
ount
ing
to R
s.155
,892
,400
(Pre
vious
Year
Rs.1
,429
,032
) pen
ding
regi
stra
tion
in th
e nam
e of t
he Co
mpa
ny.
3. Pl
ant &
Mac
hine
ry in
clude
s Pla
nt &
Mac
hine
ry a
mou
ntin
g to
Rs.4
,543
,083
(Pre
vious
Year
5,2
77,1
32 )
(Net
Blo
ck) l
ying
with
third
par
ties.
4. De
prec
iatio
n fo
r the
year
inclu
des D
epre
ciatio
n on
Res
earch
& D
evel
opm
ent A
sset
s am
ount
ing
to R
s.169
,025
,407
(Pre
vious
Year
Rs.1
31,3
48,1
76).
5. Ca
pita
l Wor
k in
Prog
ress
inclu
des p
re-o
pera
tive e
xpen
ditu
re. R
efer
Not
e No.
4 of
sche
dule
XX
B.6.
Addi
tion
to Fi
xed
Asse
ts in
clude
s for
eign
exch
ange
adju
stm
ent a
mou
ntin
g to
Rs.6
41,0
13 {P
revio
us Ye
ar (R
s.556
,105
)}.7.
All I
ntan
gibl
e ass
ets (
exce
pt So
ftwar
es) a
re in
tern
ally
gene
rate
d In
tang
ible
asse
ts.
* Inc
lude
s exc
hang
e diff
eren
ces c
apita
lized
dur
ing
the y
ear R
s.730
, 764
,477
(Pre
vious
year
Rs.
Nil).
** Ex
chan
ge d
iffer
ence
s Los
s / (G
ain)
of e
arlie
r yea
rs ca
pita
lized
dur
ing
the y
ear.
Panacea Biotec • Annual Report 2008-09104

Panacea Biotec • Annual Report 2008-09105
Amount in Rs.
As at As at 31st March, 2009 31st March, 2008
SCHEDULES TO CONSOLIDATED BALANCE SHEET AND PROFIT & LOSS ACCOUNT
Schedule VI - InvestmentsLong Term Investments (at cost)A. Non-Trade - Quoted a) 10,000 Equity Shares of Rs.10 each 100,000 100,000 fully paid of Medicamen Biotec Ltd. - Unquoted a) Investment in Capital of Partnership Firm - 40,000,000 “Lakshmi & The Manager” * Add: Profit for the year - - 699,983 40,699,983 b) 41,257,126 (Previous Year Nil) Equity Shares 41,957,109 - of Re.1 each fully paid up in Lakshmi & Manager Holdings Ltd. Add: Profit/ (Loss) for the year (2,103,929) 39,853,180 - -B. Trade - Quoted 3,733,334 (Previous Year Nil) Equity Shares of 649,777,351 - US $ 0.0001 each fully paid up in PharmAthene Inc. - Unquoted a) 419,767 (Previous Year 419,767) Equity Shares of 3,258,238 4,197,670 Rs.10 each fully paid in PanEra Biotec Pvt. Ltd. (formerly known as Panheber Biotec Pvt. Ltd.) Add : Profit / (Loss) for the year 7,410,519 10,668,757 (939,432) 3,258,238 b) Investment in Shivalik Solid Waste Management 200,000 200,000 Ltd. 20,000 (Previous year 20,000) Equity Shares of Rs.10 each c) 4,608,608 (Previous Year 4,608,608) Ordinary 168,068,998 - Shares of GBP.0.01 (Face Value) each fully paid of Cambridge Biostability Limited Less : Provision for Permanent Diminution in the 168,068,998 - value of Investments (Refer note no. 12(b) of Schedule XX B) - -Current Investment (at lower of cost or market value) a) Nil Units (Previous Year 6,202,072.225) of - 62,216,088 Rs.10.0315 NAV in HDFC CMF - Savings Plus Plan - Whole Sale - Daily Dividend b) Nil Units (Previous Year 45,885.50) of - 46,192,733 Rs.1,001.1364 NAV in Reliance Liquid Plus Fund - Inst - Daily Dividend 700,599,288 152,667,042Notes:
*The names of all the partners of the Partnership Firm,
‘Lakshmi & The Manager’, total capital of the firm and
the share of each partner was as under:
Partners Capital Sharing Ratio
Panacea Biotec Ltd. 40,000,000 40%
Mr. Ravinder Jain 19,000,000 19%
Mrs. Radhika Jain 20,000,000 20%
Mrs. Sunanda Jain 18,000,000 18%
Mrs. Meena Jain 2,000,000 2%
Mrs. Shilpy Jain 1,000,000 1%
Total 100,000,000 100%
Aggregate value of Unquoted Investments 50,721,937 152,567,042
(net of Provision for Permanent Diminution in the value
of Investments of Rs.168,068,998)
Aggregate value of Quoted Investments 649,877,351 100,000
(Market value of Quoted Investment) 466,069,086 161,500
Panacea Biotec • Annual Report 2008-09105

Panacea Biotec • Annual Report 2008-09106
SCHEDULES TO CONSOLIDATED BALANCE SHEET AND PROFIT & LOSS ACCOUNT Amount in Rs.
As at As at 31st March, 2009 31st March, 2008
Schedule VII - Current Assets, Loans & AdvancesInventoriesi) Raw & Packing Materials 3,206,936,066 1,321,160,291 (Including lying with third parties Rs.34,062,940 (Previous Year Rs.57,098,748))ii) Finished Goods 1,020,726,983 713,360,132 (Including goods in transit of Rs.1,192,568 (Previous Year Rs. Nil)) & lying with third parties Rs.844,654 (Previous Year Rs.187,528)iii) Work in Progress 202,833,537 57,577,914 (Including lying with third parties Rs.67,135,348 (Previous Year Rs.9,268,214))iv) Stores & Spare Parts 82,540,480 4,513,037,066 53,655,025 2,145,753,362Sundry Debtors(Unsecured, Considered good, unless otherwise stated)Over six months (including Rs.3,146,023 considered 83,446,581 9,640,735 doubtful of recovery (Previous year Rs.2,858,916))Others Debts 1,121,429,650 1,452,066,359 1,204,876,231 1,461,707,094Less : Provision for Bad & Doubtful Debts 3,146,023 1,201,730,208 2,858,916 1,458,848,178Cash and Bank Balancesi) Cash balance on hand 9,243,607 2,653,554ii) Balance with Scheduled Banks a) On Current Accounts 100,130,657 104,179,993 b) On Unpaid Dividend Accounts* 1,583,956 1,536,608 c) On Fixed Deposits** 140,844,041 1,314,307,829 d) On Exchange Earner Foreign Currency 496,620,469 748,422,730 124,125,360 1,546,803,344 Current Accounts*Not available for use by the company as they represent corresponding unpaid dividend liabilities**Fixed Deposits amounting to Rs.1,024,123 (previous year Rs.9,718,300) are pledged with Banks and various Government Authorities. Other Current AssetsExport Benefits Receivable 25,521,973 19,402,794Interest accrued but not due on Loans & Deposits 10,256,386 12,630,446Less: Provision for doubtful of recovery 7,275,470 28,502,889 - 32,033,240 (Refer note no. 12(b) of Schedule XX B)Loans and Advances (Unsecured, Considered good, unless otherwise stated) Advances recoverable in cash or in kind or for value to be 749,656,508 611,875,467 received (Including Rs.818,322 (Previous Year Rs.818,322 ) considered doubtfulDue from PanEra Biotec Pvt. Ltd. (Formerly known as 153,950,194 135,532,654 Panheber Biotec Private Ltd.)** (Including Rs.135,532,654 (Previous Year Rs.135,532,654) considered doubtful) Balance with Excise, Custom etc. 15,042,362 24,870,402Loan to Joint Venture Company 108,833,850 35,746,800Staff Loans & Advances (including Rs.4,191,959 16,357,286 18,245,508 (Previous Year Rs.4,191,959) considered doubtful) 1,043,840,200 826,270,831Less : Provision for Doubtful Loans & Advances 108,833,850 - (Refer note no. 12(b) of Schedule XX B)Less : Provision for Bad & Doubtful Advances 140,542,935 140,542,935 794,463,415 685,727,896Security Deposits 23,446,850 43,242,929Advance Income Tax (Net of Provision of Rs.1,180,600,195 415,110,051 1,233,020,316 203,137,555 932,108,380 (previous year Rs.1,166,163,348)) 7,724,713,209 6,115,546,504
**Company’s two Directors are also directors in PanEra Biotec Private Limited (Formerly known as Panheber Biotec Pvt. Ltd.).
Panacea Biotec • Annual Report 2008-09106

Panacea Biotec • Annual Report 2008-09107
Amount in Rs.
As at As at 31st March, 2009 31st March, 2008
SCHEDULES TO CONSOLIDATED BALANCE SHEET AND PROFIT & LOSS ACCOUNT
Amount in Rs.
For the year ended For the year ended 31st March, 2009 31st March, 2008
Schedule X - TurnoverSales 7,877,964,683 8,447,324,904
Services (R&D Income) 1,699,562 3,867,030
Income from Contract Manufacturing 20,899,947 -
7,900,564,192 8,451,191,934
Schedule VIII - Current Liabilities & ProvisionsA. Liabilities
i) Acceptances 1,140,108,339 345,202,563
ii) Sundry Creditors
a) Dues to Micro & Small Enterprises 1,274,843 1,177,455 (Refer note no.6 of Schedule XX B)
b) Dues to other than Micro & Small Enterprises 482,859,566 750,328,794
iii) Advances from Customers 7,060,675 8,155,762
iv) Deposits from C & F Agents 15,195,000 15,158,000
v) Unpaid Dividend on Equity Shares* 1,291,245 1,536,608
vi) Other Liabilities 44,401,611 115,478,633
vii) Book Overdraft - 345,960
vii) Interest accrued but not due on loans/ Deposits 391,030 1,692,582,309 2,267 1,237,386,042 * This amount does not include amount due/outstanding to be credited to Investor Education & Protection Fund,
same shall be credited as and when due.
B. Provisions
i) Provision for Wealth Tax 1,371,020 832,746
ii) Provision for Fringe Benefit Tax (Net of Advance 5,174,455 2,349,330 Payment of Rs.72,954,545 (Previous year Rs.75,650,670))
iii) Proposed Dividend on Preference Shares 33,184 -
iv) Proposed Dividend on Equity Shares - 66,693,746
v) Provision for Dividend Distribution Tax 5,640 11,334,602
vi) Provision for Gratuity 57,056,954 58,693,758
vii) Provision for Leave Encashment 54,307,651 38,458,216
viii) Provision for open Derivative Contracts 1,743,104,000 1,861,052,904 40,500,000 218,862,398
3,553,635,213 1,456,248,440
Schedule IX - Miscellaneous Expenditure(To the extent not written off or adjusted)
i) License Fees
As per last Balance Sheet 5,334,319 7,016,719
Less : Written off during the Year 1,682,400 3,651,919 1,682,400 5,334,319
ii) Preliminary Expenses
As per last Balance Sheet 132,006 5,960
Add : Addition during the year 480,381 126,046
Less : Written off during the year 104,671 507,716 - 132,006
4,159,635 5,466,325
Panacea Biotec • Annual Report 2008-09107

Panacea Biotec • Annual Report 2008-09108
SCHEDULES TO CONSOLIDATED BALANCE SHEET AND PROFIT & LOSS ACCOUNT Amount in Rs.
For the year ended For the year ended 31st March, 2009 31st March, 2008
Schedule XI - Other IncomeInterest Received -- from Banks (Tax deducted at source Rs.27,038,973 127,865,846 49,217,313 (Previous year Rs.9,029,244))- from Inter Company Loans/ Deposits (Tax deducted at source Rs. Nil (Previous year Rs. Nil)) 16,878,059 -- from Others (Tax deducted at source Rs.7,455,603 (Previous year Rs.2,323,740)) 35,037,872 7,268,691- on Income Tax Refund - 6,527,472Export Incentives 30,855,454 24,814,711Dividend on other than Trade Investments Long Term (Gross) 5,453,494 3,468,309Miscellaneous Balances/Provisions written back 123,707 123,151,118Sale of Scrap 1,779,942 1,769,296Lease Rent 17,823,031 180,133Profit on Sale of Fixed Assets {Net of loss Rs.2,039,733 (Previous year Rs.845,313)} 6,937,487 22,830,661Foreign Exchange Fluctuation Gain {Net of loss Rs. Nil (Previous year Rs.160,515,539} - 124,897,841Profit on Sale of Investment 1,257,126 -Insurance Claim Received 4,430,371 8,283,596Royalty Income 9,266,380 1,235,464Income from Derecognition of JV company 46,263,349 -Foreign Currency Translation Account 7,009,383 -Miscellaneous Income 975,422 9,291,183 311,956,924 382,935,788
Schedule XII - Raw & Packing Material ConsumedRaw Materials & Packing Materials Consumed Opening Stock 1,321,160,291 1,261,054,515 Add : Material purchased during the Year 4,857,945,771 3,562,049,427 6,179,106,062 4,823,103,942 Less : Closing Stock 3,206,936,066 1,321,160,291 2,972,169,996 3,501,943,651 Less: Material consumed for Research & Development 19,621,119 2,952,548,877 32,890,327 3,469,053,324
Schedule XIII - Operating and Other ExpensesProcessing Charges 35,289,443 5,843,974Analytical Testing & Trial Charges 6,995,652 11,135,528Ancillary Expenses - 7,473,173Stores & Spare Parts consumed (Refer note no.4 of Schedule XX B) 57,939,559 46,559,069Power & Fuel (Refer note no.4 of Schedule XX B) 112,861,694 100,327,742Repair & Maintenance (Refer note no.4 of Schedule XX B) Building 16,628,948 19,041,472 Plant & Machinery 22,609,114 23,646,625 Others 28,492,441 67,730,503 26,633,304 69,321,401Rent (Refer note no.4 of Schedule XX B) 53,624,943 50,223,655Royalty 14,742,764 4,385,550Directors’ Sitting Fees 345,000 350,000Printing & Stationery 40,222,731 31,487,310Postage & Communication Expenses 47,716,557 39,073,273Insurance 42,835,287 44,074,361Travelling & Conveyance expenses (Refer note no.4 of Schedule XX B) 116,933,775 114,284,121Books & Periodicals 2,240,467 3,448,613Legal & Professional charges (Refer note no.4 of Schedule XX B) 113,140,386 75,067,398Vehicle Running & Maintenance 17,155,503 14,853,710Auditors’ Remuneration: (Refer note no.5 of Schedule XX B) Statutory Audit Fee 4,093,231 3,972,119 Limited Review Fees 1,685,400 1,348,320 Others 136,332 376,394 Out of pocket expenses 251,124 6,166,087 78,074 5,774,907Rates & Taxes (Refer note no.4 of Schedule XX B) 15,615,884 11,260,858Donation 3,420,245 6,669,274Subscription 13,700,941 12,226,353Staff Training & Recruitment 31,477,974 29,976,294Miscellaneous expenses (Refer note no.4 of Schedule XX B) 33,473,390 28,592,166Bad Debts & Advances written off 115,891 -Provision for doubtful debts & doubtful advances 116,531,425 27,044,708Wealth Tax 1,393,909 832,746Foreign Exchange Fluctuation Loss (Net of Gain Rs.214,791,328 (Previous year Rs. Nil)) 571,574,318 -Provision for Loss on Open Derivative Contracts 1,702,604,000 40,500,000Provision for Permanent Diminution in the value of Investments (Refer note no.12(b) of Schedule XX B) 168,068,998 - 3,393,917,326 780,786,184
Panacea Biotec • Annual Report 2008-09108

Panacea Biotec • Annual Report 2008-09109
SCHEDULES TO CONSOLIDATED BALANCE SHEET AND PROFIT & LOSS ACCOUNT Amount in Rs.
For the year ended For the year ended 31st March, 2009 31st March, 2008
Schedule XIV - (Increase)/Decrease In StocksClosing Stock
Finished Goods 1,020,726,983 713,360,132
Work in Progress 202,833,537 1,223,560,520 57,577,914 770,938,046
Less: Opening Stock
Finished Goods 713,360,132 716,281,654
Work in Progress 57,577,914 770,938,046 50,067,266 766,348,920
(452,622,474) (4,589,126)
Schedule XV - Personnel ExpensesSalary, Wages and Bonus 874,951,893 884,576,690
Contribution to Provident and other Funds 27,589,020 23,749,623
Workmen Staff Welfare Expenses 42,098,929 38,990,698
Gratuity 12,138,642 33,097,213
956,778,484 980,414,224
Schedule XVI - Selling & Distribution ExpensesAdvertising & Sales Promotion 242,016,163 263,157,227
Meetings & Conferences 62,306,063 93,088,068
Freight & Cartage 67,411,807 63,494,250
Commission on Sales (Other than Sole Selling Agents) 86,496,459 63,047,875
458,230,492 482,787,420
Schedule XVII - Research & Development ExpensesRaw Material & Packing Material Consumed 19,621,119 32,890,327
Stores & Spare Parts Consumed 134,104,256 91,423,646
Salary, Wages & Bonus 182,045,564 155,895,586
Contribution to Provident & other Funds 4,096,340 3,607,381
Workmen/Staff Welfare expenses 9,504,657 7,046,234
Gratuity 1,062,491 3,287,690
Analytical Testing & Trial Charges 14,959,224 15,803,303
Rent 6,401,077 7,569,470
Printing & Stationery 2,212,425 2,591,736
Postage & Communication 3,151,204 2,794,844
Travelling Expenses 15,897,191 12,638,102
Books & Periodicals 6,317,043 3,966,683
Legal & Professional Expenses 12,052,167 9,158,686
Vehicle Running & Maintenance 2,424,344 2,044,023
Donation 30,251 1,880,651
Repair & Maintenance :
- Buildings 5,726,552 2,386,093
- Plant & Machinery 14,628,824 17,360,639
- Others 3,728,604 24,083,980 1,740,037 21,486,769
Rates, Fees & Taxes 622,995 335,366
Subscription 9,467,437 4,980,114
Electricity & Water Charges 33,714,494 22,390,252
Meeting & Conferences 2,460,794 4,191,618
Staff Training & Recruitment 765,564 815,807
Bank Charges - 65,407
Depreciation 169,025,407 131,348,176
Sundry Expenses 15,924,021 3,644,252
669,944,045 541,856,123
Panacea Biotec • Annual Report 2008-09109

Panacea Biotec • Annual Report 2008-09110
SCHEDULES TO CONSOLIDATED BALANCE SHEET AND PROFIT & LOSS ACCOUNT Amount in Rs.
For the year ended For the year ended 31st March, 2009 31st March, 2008
Schedule XVIII - Financial ExpensesInterest on:
a) Fixed Loans 206,260,720 88,760,734
b) Others (Including interest on working capital loans) 115,282,862 321,543,582 27,694,390 116,455,124
Bank Charges 26,638,230 34,222,565
348,181,812 150,677,689
Schedule XIX - Earning Per ShareCalculation of Profit for Basic EPS:
Net Profit/(Loss) before Tax (866,663,960) 1,876,025,059
Less: Adjustment for Tax Expense (206,739,128) 586,208,321
Less: Dividend on Redeemable Preference Shares 33,184 -
Less: Dividend Distribution Tax on Redeemable Preference Shares 5,640 -
Net Profit/(Loss) for calculation of Basic EPS (659,963,656) 1,289,816,738
Weighted average number of equity shares in calculating basic EPS 66,693,746 66,115,919
Calculation of Profit for Diluted EPS
Net Profit/(Loss) for calculation of basic EPS (659,963,656) 1,289,816,738
Adjusted Net Profit/(Loss) for calculating Diluted EPS (659,963,656) 1,289,816,738
No. of Weighted Equity Shares resulting from conversion of Foreign Currency Convertible Bonds
- ‘US$ 50 Million Zero Coupon Convertible Bonds due 2011’ 4,542,752 4,542,752 (outstanding US$36.8 million) at conversion price Rs.357.57
Add: Weighted average number of Equity Shares in 66,693,746 66,115,919 calculating basic EPS
Weighted average number of Equity Shares in calculating 71,236,498 70,658,671 diluted EPS
Basic Earnings per Share (9.90) 19.51
Diluted Earnings per Share (9.90) 18.25
Face/ Nominal Value Per Share 1.00 1.00
Schedule XX - Significant Accounting Policies and Notes on Accounts (Consolidated Financial Statements)
A. Significant Accounting Policies
1. i) Basis of Preparation
The Consolidated Financial Statements relate to Panacea Biotec Limited (Parent Company), its Subsidiary Companies, Joint Ventures and Associates (hereinafter collectively referred as the “Group”).
The Consolidated Financial Statements (CFS) have been prepared to comply in all material respects with the notified Accounting Standards by Companies (Accounting Standards) Rules, 2006 and the relevant provisions of the Companies Act, 1956. The financial statements have been prepared under the historical cost convention on an accrual basis except in case of assets for which provision for impairment is made and revaluation is carried out. The accounting policies have been consistently applied by the Company and except for the changes in accounting policies discussed more fully below, are consistent with those used in the previous year.
ii) Principles of Consolidation
The Consolidated Financial Statements have been prepared on the following basis:
a) The financial statements of the Parent Company and its Subsidiary Companies have been combined on a line by line basis by adding together the book values of like items of assets, liabilities, income and expenses after fully eliminating intra group balances and intra group transactions resulting in unrealized profits or losses, if any, as per Accounting Standard – 21, Consolidated Financial Statements.
b) Interest in assets, liabilities, income and expenses of the Joint Ventures have been consolidated using proportionate consolidation method. Intra group balances, transactions and unrealized profits/losses have been eliminated to the extent of Company’s proportionate shares as per Accounting Standard – 27, Financial reporting of interests in Joint Venture.
Panacea Biotec • Annual Report 2008-09110

Panacea Biotec • Annual Report 2008-09111
c) In case of Associates, where the company directly or indirectly through subsidiaries holds more than 20% of equity, investment in associate is accounted for by Equity Method in accordance with Accounting Standards 23, Accounting for Investment in Associates.
d) The financial statements of the Subsidiary Companies, Joint Ventures and Associates used in the consolidation are drawn for the same period as that of the Parent Company i.e. year ended March 31, 2009. Also, the Company’s Associate in earlier years, Lakshmi and the Manager, ceased to be an Associates w.e.f. June 30, 2008 the same has been accounted for as an Associates till the date of cessation.
e) Minorities’ interest in net profit/(loss) of consolidated Subsidiary Companies for the year has been identified and adjusted against the income in order to arrive at the net income attributable to the shareholders of the Parent Company. Minorities’ share of net assets has been identified and presented in Consolidated Balance Sheet separately. Where accumulated losses attributable to the minorities are in excess of their equity, in the absence of the contractual obligation on the minorities, the same is accounted for by the Parent Company.
f ) List of Subsidiaries, Joint Ventures and Associates considered for Consolidation:
S. No. Name of the Company Nature of Country of Extent of Holding/ relationship Incorporation Voting Power (%) as on March 31, 2009
1 Best On Health Ltd. Subsidiary India 100.0 2 Panacea Educational Institute Pvt. Ltd. Indirect Subsidiary* India 100.0 3 Radicura & Co. Ltd. Indirect Subsidiary* India 100.0 4 Panacea Hospitality Services Pvt. Ltd. Indirect Subsidiary* India 100.0 5 Sunanda Steel Company Ltd. Indirect Subsidiary* India 100.0 6 Umkal Medical Institute Pvt. Ltd. Subsidiary India 75.2 (w.e.f. June 30, 2008) 7 Panacea Biotec GmbH Subsidiary Germany 100.0 (w.e.f. June 11, 2008) 8 Panacea Biotec, Inc. (w.e.f. July 15, 2008) Subsidiary USA 100.0 9 Panacea Biotec FZE Subsidiary UAE 100.0 (w.e.f. March 16, 2008) 10 Rees Investments Ltd. Subsidiary Guernsey 100.0 (w.e.f. September 16, 2008) 11 Kelisia Holdings Ltd. Indirect Subsidiary† Cyprus 100.0 (w.e.f. September 18, 2008) 12 Kelisia Investment Holdings AG Indirect Subsidiary†† Switzerland 100.0 (w.e.f. October 22, 2008) 13 Panacea Biotec (International) SA Indirect Subsidiary††† Switzerland 100.0 (w.e.f. February 19, 2009) 14 Chiron Panacea Vaccines Pvt. Ltd. Joint Venture India 50.0 15 PanEra Biotec Pvt. Ltd. (Earlier Associate India 50.0 known as Panheber Biotec Pvt. Ltd.) 16 Lakshmi & the Manager Associate India 40.0 (up to June 30, 2008) 17 Lakshmi & Manager Holdings Ltd. Associate India 40.0 (w.e.f. July 1, 2008) 18 Best General Insurances Co. Ltd Indirect Associate** India 32.0 (w.e.f. September 19, 2008)
*Wholly Owned Subsidiary of Best on Health Ltd. **Subsidiary of Lakshmi & Manager Holdings Ltd. †Wholly Owned Subsidiary of Rees Investments Ltd. ††Wholly Owned Subsidiary of Kelisia Holdings Ltd. †††Wholly Owned Subsidiary of Kelisia Investment Holdings AG
g) Goodwill represents the difference between the Parent Company’s shares in the net worth of the Subsidiary / Joint Venture Company and the cost of acquisition at the time of making the investment in the Subsidiary / Joint Venture Companies. For this purpose, the Parent Company’s share of net worth of the Subsidiary/ Joint Venture Company is determined on the basis of the latest financial statements of the Subsidiary/ Joint Venture Company prior to acquisition, after making the necessary adjustments for material events between the date of such financial statements and the date of respective acquisition.
h) The Consolidated Financial Statements have been prepared using uniform accounting policies to the extent possible for like transactions and other events in similar circumstances and are presented in the same manner as the Parent Company’s separate financial statements.
2. Change in Accounting Policy
For the Financial Year ended 31st March, 2008, the Company was charging off exchange differences arising on foreign currency monetary assets and liabilities to profit and loss account. Pursuant to Companies (Accounting Standards) Amendments Rules, 2009, the Company has exercised the option of deferring the charge of exchange difference to the Profit and Loss Account, in respect of accounting periods commencing on or after 7th December, 2006, on long-term foreign currency monetary items (i.e.
SCHEDULES TO CONSOLIDATED BALANCE SHEET AND PROFIT & LOSS ACCOUNT
Panacea Biotec • Annual Report 2008-09111

Panacea Biotec • Annual Report 2008-09112
monetary assets or liabilities expressed in foreign currency and having a term of 12 months or more at the date of origination). As a result, such exchange differences so far as they relate to the acquisition of a depreciable capital asset have been adjusted with the cost of such asset and are being depreciated over the balance life of the asset, and in other cases, have been accumulated in Foreign Currency Monetary Item Translation Difference Account and are being amortized over the balance period of such long term asset/liability but not beyond, accounting period ending on or before 31st March 2011.
In the current year, such exchange differences, pertaining to accounting periods commencing on 1 April, 2007 and ending on 31 March, 2008 are transferred from General Reserve, to the extent they related to acquisition of depreciable capital assets are adjusted with the cost of such assets Rs.24,810,859 (net of depreciation of Rs.1,609,882) (net of tax of Rs.12,775,656) and in other cases, are transferred to the Foreign Currency Monetary Item Translation Difference Account Rs.61,039,657 (net of tax of Rs.31,430,661).
Had the Company continued to use the earlier basis of accounting for exchange differences arising on long-term foreign currency monetary items, the Loss after tax for the current period would have been higher by Rs.561,174,198 (net of tax of Rs.288,960,930), the net block of fixed assets would have been lower by Rs.624,117,162 (net of depreciation of Rs.94,952,131) and general reserve would have been higher by Rs.130,056,833.
3. Uses of Estimates
The presentation of financial statements in conformity with the Generally Accepted Accounting Principles requires estimates and assumptions to be made that affect the reported amount of assets and liabilities on the date of the financial statements and the reported amount of revenues and expenses during the reporting period. Difference between the actual result and estimates are recognized in the period in which the results are known/materialized.
4. Revenue Recognition
Revenue is recognized to the extent that it is probable that the economic benefits will flow to the Company and the revenue can be reliably measured.
Sale of Goods - Revenue is recognized when the significant risks and rewards of ownership of the goods have passed to the buyer and is stated net of trade discounts, free quantities, returns and sales tax but includes excise duty. Excise Duty deducted from turnover is the amount that is included in the amount of turnover (gross) and not the entire amount of liability arise during the year.
Research & Development - Income from Research & Development Services is accounted for as per the stage of completion.
Contract Manufacturing- Revenue is recognized on an accrual basis in accordance with the term of the relevant agreement.
Interest - Revenue is recognized on a time proportion basis taking into account the amount outstanding and the rate applicable.
Dividends - Revenue is recognized when the shareholders’ right to receive payment is established by the Balance sheet date.
Dividend from subsidiaries is recognized even if same are declared after the balance sheet date but pertains to the period on or before the date of balance sheet as per the requirements of schedule VI of the Companies Act, 1956.
Royalties - Revenue is recognized on an accrual basis in accordance with the term of the relevant agreement.
Export Benefits - Export entitlements under Duty Entitlement Pass Book Schemes and Advance Licenses are recognized in the Profit & Loss Account when the right to receive credit as per terms of scheme is established in respect of export made and where there is no significant uncertainty regarding the ultimate collection of the relevant export proceeds.
5. Fixed Assets
Fixed assets are stated at cost less accumulated depreciation and impairment losses, if any. Cost comprises the purchase price and any attributable cost of bringing the asset to its working condition for its intended use. Borrowing costs relating to acquisition of fixed assets which takes substantial period of time to get ready for its intended use are also included to the extent they relate to the period till such assets are ready to be put to use.
In respect of accounting periods commencing on or after 7th December, 2006, exchange differences arising on reporting of the long-term foreign currency monetary items at rates different from those at which they were initially recorded during the period, or reported in the previous financial statements are added to or deducted from the cost of the asset and are depreciated over the balance life of the asset, if these monetary items pertain to the acquisition of a depreciable fixed asset.
6. Impairment of Fixed Assets
The carrying amounts of assets are reviewed at each Balance Sheet date as to whether if there is any indication of impairment based on internal/external factors. An impairment loss is recognized wherever the carrying amount of an asset exceeds its recoverable amount. The recoverable amount is the greater of the assets net selling price and value in use. In assessing value in use, the estimated future cash flows are discounted to their present value at the weighted average cost of capital.
After impairment, depreciation is provided on the revised carrying amount of the assets over its remaining useful life.
7. Expenditure during Construction Period
Expenditure directly relating to construction activity is capitalized. Indirect expenditure incurred during construction period is capitalized as part of the indirect construction cost to the extent to which the expenditure is indirectly related to construction or is incidental thereto. Income earned during construction period is deducted from the total of the indirect expenditure.
8. Intangibles
Patents and Trademarks - Costs relating to patents and trademarks, which are acquired, are capitalized.
Research and Development Costs - Research costs are expensed as incurred. Development expenditure incurred on an individual project is carried forward when its future recoverability can reasonably be regarded as assured.
Product Development – Product Development is capitalized on successful completion of development activities and commercial
SCHEDULES TO CONSOLIDATED BALANCE SHEET AND PROFIT & LOSS ACCOUNT
Panacea Biotec • Annual Report 2008-09112

Panacea Biotec • Annual Report 2008-09113
launch of developed products.
Technical Know how - Technical Know how is being capitalized on successful transfer of technology when its future recoverability can reasonably be regarded as assured.
Software and Website - Software is stated at cost of acquisition and includes all attributable costs of bringing the software to its working condition for its intended use.
Goodwill – Goodwill on consolidation is amortized over a period of 5 years.
The carrying value of intangible assets is reviewed for impairment annually when the asset is not yet in use, and otherwise when events or changes in circumstances indicate that the carrying value may not be recoverable.
9. Depreciation/ Amortization
a) Depreciation on fixed assets is provided on written down value method as per the rates based on the estimated useful life or as per rates prescribed in Schedule XIV to the Companies Act, 1956 whichever is higher. Depreciation is provided on the following rates:
Tangibles Assets WDV %
Building – Factory 10.00 Building – Office Premises 5.00 Plant & Machinery 13.91 Furniture & Fittings 18.10 Vehicles 25.89 Office Equipments 13.91 Computer Equipments 40.00
b) Depreciation on intangibles is provided on the basis of the estimated useful lives as follows:-
Software - Depreciated on Straight Line basis over a period of 5 years.Websites - Depreciated on Straight Line basis over a period of 2 years.Patents, Trade Mark & Designs - Depreciated on Straight Line basis over a period of 7 years.Product Development - Depreciated on Straight Line basis over a period of 5 years.Technical Know-how - Amortized on straight line basis over a period of 5 years.
c) Leasehold Land is depreciated over the period of lease or useful life, whichever is shorter.
d) Leasehold Improvements are amortized over the initial period of lease or useful life, whichever is shorter.
10. Borrowing Costs
Borrowing costs attributable to the acquisition, construction or production of a qualifying asset are capitalized as part of the cost of that asset. Borrowing costs, which are not relatable to qualifying assets, are recognized as an expense in the period in which they are incurred.
11. Leases
Where the Company is the Lessee
Leases, where the lessor effectively retains substantially all the risks and benefits of ownership of the leased term, are classified as operating leases. Operating lease payments are recognized as an expense in the Profit and Loss account on a straight-line basis over the lease term.
Where the Company is the Lessor
Assets subject to operating leases are included in fixed assets. Lease income is recognized in the Profit and Loss Account on a straight-line basis over the lease term. Costs, including depreciation are recognized as an expense in the Profit and Loss Account. Initial direct costs such as legal costs, brokerage costs, etc. are recognized immediately in the Profit and Loss Account.
12. Deferred Revenue Expenditure
Expenditure incurred prior to April 1, 2003 towards procuring license for new products is written off over the period of agreement or ten years whichever is shorter. Expenditure of the similar nature incurred during the year is charged off to revenue.
13. Investments
Investments that are readily realizable and intended to be held for not more than a year are classified as current investments. All other investments are classified as long-term investments. Current investments are carried at lower of cost and fair value determined on an individual investment basis. Long-term investments are carried at cost. However, provision for diminution, if any, in value is made to recognize a decline other than temporary in the value of the investments.
14. Inventories
Finished Goods, Work in Progress, Goods held for Resale, Raw Materials, Packing Materials and Stores & Spares are stated at lower of cost and net realizable value. However, materials and other items held for use in the production of inventories are not written down below cost if the finished goods in which they will be incorporated are expected to be sold at or above cost.
‘Cost’ of Finished Goods, Work in progress, Raw Materials, Packing Materials and Stores & Spares is arrived at by using ‘Moving Average Price’ method.
Cost of Work in Progress and Finished Goods is determined by considering direct material cost and appropriate portion of manufacturing overheads based on normal operating capacity. Cost of traded goods is arrived at by using ‘Moving Average Price’ method and for one of the Joint Ventures as first in first out basis. Cost of finished goods includes Excise Duty.
Net realizable value is the estimated selling price in the ordinary course of business, less estimated costs of completion and to make the sale.
SCHEDULES TO CONSOLIDATED BALANCE SHEET AND PROFIT & LOSS ACCOUNT
Panacea Biotec • Annual Report 2008-09113

Panacea Biotec • Annual Report 2008-09114
15. Retirement and Other Employees Benefits
a) Retirement benefits in the form of Provident Fund and Pension Schemes are defined contribution schemes and the contributions are charged to the Profit and Loss Account of the year when the contributions to the respective funds are due. There are no other obligations other than the contribution payable to the respective funds.
b) The contribution to Gratuity Fund, which is a defined benefit plan, is expensed on the basis of funding claims of the fund manager, Life Insurance Corporation of India. At the end of the accounting year, actuarial valuation is done as per projected unit credit method by an independent Actuary and any shortfall in the fund balance is further provided for.
c) Short term compensated absences are provided for based on estimates. Long term compensated absences are provided for based on actuarial valuation done as per projected unit credit method.
d) Leave encashment payable/ adjustable during the year is provided on the basis of last salary drawn by employees.
e) Actuarial gains/losses are adjusted in Profit & Loss Account and are not deferred.
16. Foreign Currency Transaction
Initial Recognition
Foreign currency transactions are recorded in the reporting currency, by applying to the foreign currency amount, the exchange rate between the reporting currency and the foreign currency at the date of the transaction.
Conversion
Foreign currency monetary items are reported using the closing rate. Non-monetary items which are carried in terms of historical cost denominated in a foreign currency are reported using the exchange rate at the date of the transaction and non-monetary items which are carried at fair value or other similar valuation denominated in a foreign currency are reported using the exchange rates that existed when the values were determined.
Exchange Differences
Exchange differences arising on the settlement of monetary items or on reporting such monetary items at rates different from those at which they were initially recorded during the year, or reported in previous financial statements, are recognized as income or as expenses in the year in which they arise except those monetary items as mentioned below.
Exchange differences, in respect of accounting periods commencing on or after 7th December, 2006, arising on reporting of long-term foreign currency monetary items at rates different from those at which they were initially recorded during the period, or reported in previous financial statements, in so far as they relate to the acquisition of a depreciable capital asset, are added to or deducted from the cost of the asset and are depreciated over the balance life of the asset, and in other cases, are accumulated in a “Foreign Currency Monetary Item Translation Difference Account” in the financial statements and amortized over the balance period of such long-term asset/liability but not beyond accounting period ending on or before 31st March, 2011.
Exchange differences arising on a monetary item that, in substance, form part of company’s net investment in a non-integral foreign operation is accumulated in a foreign currency translation reserve in the financial statements until the disposal of the net investment, at which time they are recognized as income or as expenses.
Forward Exchange Contracts not intended for trading or speculation purposes
The premium or discount arising at the inception of forward exchange contracts is amortized as an expense or income over the life of the contract. Exchange differences on such contracts are recognized in the statement of Profit and Loss Account in the year in which the exchange rates change. Any profit or loss arising on cancellation or renewal of forward exchange contract is recognized as income or as expense for the year.
17. Income Taxes
Tax expense comprises of current, deferred and fringe benefit tax. Current Income Tax and Fringe Benefit Tax is measured at the amount expected to be paid to the tax authorities in accordance with the Income Tax Act, 1961, enacted in India. Deferred Income Taxes reflect the impact of current year timing differences between taxable income and accounting income for the year and reversal of timing differences of earlier years.
Deferred Income Tax is measured based on the tax rates and the tax laws enacted or substantively enacted at the balance sheet date. Deferred tax assets are recognized only to the extent that there is reasonable certainty that sufficient future taxable income will be available against which such deferred tax assets can be realized. If the Company has unabsorbed depreciation or carry forward tax losses, deferred tax assets are recognized only if there is virtual certainty supported by convincing evidence that such deferred tax assets can be realized against future taxable profits.
At each Balance Sheet date the Company re-assesses unrecognized deferred tax assets. It recognizes unrecognized deferred tax assets to the extent that it has become reasonably certain or virtually certain, as the case may be, that sufficient future taxable income will be available against which such deferred tax assets can be realized.
The carrying amount of deferred tax assets are reviewed at each balance sheet date. The Company writes down the carrying amount of a deferred tax assets to the extent that it is no longer reasonably certain or virtually certain, as the case may be, that sufficient future taxable income will be available against which deferred tax assets can be realized. Any such write-down is reversed to the extent that it becomes reasonably certain or virtually certain, as the case may be, that sufficient future taxable income will be available.
18. Earnings Per Share
Basic Earnings per Share are calculated by dividing the net profit or loss for the period attributable to equity shareholders (after deducting preference dividends and attributable taxes) by the weighted average number of equity shares outstanding during the period. Partly paid equity shares, if any, are treated as a fraction of an equity share to the extent that they were entitled to participate in dividends relative to a fully paid equity share during the reporting period. The weighted average number of
SCHEDULES TO CONSOLIDATED BALANCE SHEET AND PROFIT & LOSS ACCOUNT
Panacea Biotec • Annual Report 2008-09114

Panacea Biotec • Annual Report 2008-09115
SCHEDULES TO CONSOLIDATED BALANCE SHEET AND PROFIT & LOSS ACCOUNT
equity shares outstanding during the period is adjusted for events of bonus issue, bonus element in a rights issue to existing shareholders, share split and reverse share split (consolidation of shares), if any.
For the purpose of calculating diluted earnings per share, the net profit or loss for the period attributable to equity shareholders and the weighted average number of Shares outstanding during the period are adjusted for the effects of all dilutive potential equity shares.
19. Provisions
A provision is recognized when the Company has a present obligation as a result of past event and it is probable that an outflow of resources will be required to settle the obligation, in respect of which a reliable estimate can be made. Provisions are not discounted to its present value and are determined based on management’s best estimate required to settle the obligation at the balance sheet date. These are reviewed at each balance sheet date and adjusted to reflect the current best estimates.
20. Segment Reporting Policies
(a) Identification of Segments:
Primary Segment
Business Segment: The Company’s operating businesses are organized and managed separately according to the nature of products, with each segment representing a strategic business unit that offers different products. The identified segments are Vaccines, Formulations, Research & Development and Healthcare Activities.
Secondary Segment
Geographical Segment: The analysis of geographical segment is based on the geographical location of the customers.
The geographical segments considered for disclosure are as follows:
• Revenue from domestic market includes sales to customers located within India.
• Revenue from overseas market includes sales to customers located outside India.
(b) Allocation of Common Costs: Common allocable costs are allocated to each segment on a rational basis based on nature of each such common cost.
(c) Unallocated Items: Corporate income and expenses are considered as a part of unallocable income & expense, which are not identifiable to any business segment.
21. Derivative Instruments
As per announcement of Institute of Chartered Accountants of India, accounting for derivative contracts, other than those covered under AS-11, are marked to market on a portfolio basis and the net loss after considering the offsetting effect on the underlying hedge item is charged to the Profit and Loss Account. Net gains are ignored.
22. Cash & Cash Equivalent
Cash and cash equivalents in the balance sheet comprise cash at bank and in hand and short-term investments with an original maturity of three months or less.
23. Preliminary Expenses
Costs incurred are amortized equally over a period of 5 years after the commencement of commercial operations.
B. Notes To Accounts (All amounts are in Rs. unless otherwise stated)
1. Contingent Liabilities (to the extent not provided for)
Particulars Current Year Previous Year
Disputed demands/ show-cause notices under:-
a) Sales Tax Cases - 13,809
b) Income Tax Cases 110,557 2,863,251
c) Customs Duty Cases 3,999,923 3,999,923
d) Central Excise Duty Cases 6,596,620 6,596,620
e) Service Tax 29,789,842 -
Total 40,496,942 13,473,603
Labour cases (in view of large number of cases, it is impracticable to 2,803,586 4,143,107 disclose each of them)
Other claims against the Company not acknowledged as debts - 64,000
Premium on Redemption of ‘US$ 50 Million Zero Coupon 470,992,269 243,706,599 Convertible Bonds due 2011’ (Refer note 3(ii) below)
Notes:a) Sales Tax liability of Rs.13,809 was on account of non-receipt of C forms from customers for inter-state sales. No provision was required for the
same as the management was hopeful of receiving the forms before the due date of filing of Sales Tax Returns. b) In respect of Income Tax, in Assessment Year 2005-06 the department disallowed ‘Club Expenses’ of Rs.255,800 on the ground that the these
expenses were incurred in the personal names and not in the name of the company, hence not related to the business of the company in the order under section 143(3) of the Act. The company preferred appeal before the CIT (Appeals). The CIT (Appeals) restricted the disallowance to Rs.50,000 from Rs.255,800. In Assessment Year 2006-07 the department disallowed depreciation on LAN of Rs.60,557 on the ground that depreciation on the same is allowable @25% and not @60% in the order under section 143(3) of the Act. No provision is considered necessary in this regard since the Company believes it has a good case based on nature of the case and legal advice obtained by it.
c) In respect of Customs Duty demand of Rs.3,999,923 towards Customs Duty on certain items imported as exempted by the Company, the Company has deposited the entire amount under protest. The matter is pending before the Hon’ble Supreme Court of India. No provision is
Panacea Biotec • Annual Report 2008-09115

Panacea Biotec • Annual Report 2008-09116
SCHEDULES TO CONSOLIDATED BALANCE SHEET AND PROFIT & LOSS ACCOUNT
considered necessary in this regard since the Company believes it has a good case based on nature of the case and legal advice obtained by it.
d) In respect of Central Excise Duty demand of Rs.6,596,620 towards Excise Duty on common inputs used in manufacture of exempted and taxable products, the Company has deposited the entire amount under protest. The matter is pending before Central Excise and Customs Tribunal. No provision is considered necessary in this regard since the Company believes it has a good case based on nature of the case and legal advice obtained by it.
e) In respect of service tax demand of Rs.29,789,842 relating to foreign services rendered & delivered outside India & others services, which were brought in service tax net w.e.f. 18.04.06 and against which numerous decisions/ judgments have been pronounced by the competent courts/judicial authorities, the Company has sent suitable reply to the concerned authority. No provision is considered necessary in this regard since the Company believes it has a good case based on nature of the demand and legal advice obtained by it.
2. Estimated amount of contracts remaining to be executed on capital account, net of advances and not provided in the books are as follows:-
S. No. Particulars Current Year Previous Year
1. Tangibles Assets 529,633,712 306,726,108
2. Intangible Assets 21,946,833 90,701,180
Total 551,580,545 397,427,288
3. Foreign Currency Convertible Bonds
i) Conversion price of ‘US$ 50 Million Zero Coupon Convertible Bonds due 2011’ (FCCBs) has already been fixed at Rs.357.57 per Share. This Rate is used to determine dilutive Equity Shares against outstanding Bonds.
ii) ‘US$ 50 Million Zero Coupon Convertible Bonds due 2011’ amounting to US$ 36,800,000 are pending for redemption as on 31st March 2009. Unless these Bonds have been previously converted, redeemed, repurchased and cancelled, the Company will redeem these Bonds at a price equal to 142.80% of the outstanding principal amount on the maturity date i.e. February 14, 2011 (including premium amounting to Rs.798,860,288). Since the redemption of bonds is contingent upon its non-conversion into Equity Shares and the probability of redemption cannot presently be ascertained, the Company has not provided for the proportionate premium on redemption for the period upto 31st March, 2009 amounting to Rs.470,992,269 (Previous Year 243,706,599). Such premium has been disclosed as contingent liability. These Bonds are considered a monetary liability and are redeemable only if there is no conversion before maturity date.
iii) The Company has fully utilized the issue proceeds of ‘US$ 50 Million Zero Coupon Convertible Bonds due 2011’ in earlier years.
4. Details of pre-operative expenses (included in Capital Work in Progress) relating to Fixed Assets are as follows:
Note: Figures in brackets represent previous year figures (2007-08)
Particulars As at Additions Capitalised As at April 1, 2008 during the year during the year March 31, 2009
Legal & Professional 53,548,946 11,434,122 3,862,283 61,120,785 (2,941,783) (51,926,227) (13,190,164) (53,548,946)
Store & Spares consumed 22,419,030 50,376 22,469,406 - (2,325,569) (22,126,744) (2,033,283) (22,419,030)
Power and Fuel 31,254,050 357,323 31,529,249 82,124 (4,219,189) (27,922,199) (887,338) (31,254,050)
Rates & Taxes 9,860,525 4,872 9,575,517 289,880 (285,008) (9,575,517) (-) (9,860,525)
Repair & Maintenance:
Plant and Machinery 4,452,852 - 4,452,852 - (120,255) (43,627,41) (30,144) (4,452,852)
Others 6,222,930 7,73,882 6,545,065 451,747 (157,267) (60,74,541) (8,878) (6,222,930)
Salary and Wages 14,399,373 4,580,192 13,191,507 5,788,058 (2,335,791) (12,114,403) (50,821) 14,399,373
Office Expenses 2,733,205 73,934 2,807,139 - (-) (2,733,205) (-) (2,733,205)
Travel and Conveyance 3,855,848 1,857,383 3,731,531 1,981,700 (1,003,717) (2,852,131) (-) (3,855,848)
Rent 1,038,300 3,081,945 25,799 4,094,446 (-) (1,038,300) (-) (1,038,300)
Miscellaneous Expenses 4,595,999 7,215,152 8,802,924 3,008,227 (347,310) (4,463,177) (214,488) (4,595,999)
Total 154,381,058 29,429,181 106,993,272 76,816,967 (13,735,889) (145,189,185) (4,544,016) (154,381,058)
Panacea Biotec • Annual Report 2008-09116

Panacea Biotec • Annual Report 2008-09117
SCHEDULES TO CONSOLIDATED BALANCE SHEET AND PROFIT & LOSS ACCOUNT
5. Auditor’s Remuneration:
Particulars Year ended March 31, 2009 Year ended March 31, 2008
Parent Subsidiaries Joint Parent Subsidiaries Joint Company Ventures Company Venture
Statutory Auditors
- Statutory Audit 3,309,000 382,919 4,68,762 3,400,060 57,304 514,755
- Quarterly Limited Reviews 1,685,400 - - 1,348,320 - -
- Certificates 134,832 1,500 - 113,217 - -
- Other Advisory - 15,000 - - 15,000 248,177
- Out of Pocket Expenses 161,721 - 6,953 69,317 - 8,757
5,290,953 399,419 475,715 4,930,914 72,304 771,689
Tax Auditor* 140,450 - 93,038 140,450 - 84,270
Cost Auditor* 44,944 - 33,708 - -
* included in the Legal & Professional charges given in Schedule XIII
6. Disclosure of Micro & Small Enterprises
Details of dues to Micro, Small and Medium Enterprises as per Micro, Small and Medium Enterprise Development Act, 2006
(“MSMED Act”).
Current Year Previous Year
Principal Interest Principal Interest
Principal amount and interest due thereon 1,274,843 Nil 1,177,455 Nil
remaining unpaid to any supplier as at
31st March 2009.
Interest paid by the Company in terms of 3,552,413 68,868 4,703,195 78,680
section 16 of the MSMED Act along with
the amounts of the payment made to the
supplier beyond the appointed day during
accounting year
Interest due and payable for the period of Nil Nil Nil Nil
delay in making payment (which have been
paid but beyond the appointed day during
the year) but without adding the interest
specified under MSMED Act
Interest accrued and remaining unpaid at the Nil Nil Nil Nil
end of the year
Further interest remaining due and payable in Nil Nil Nil Nil
succeeding years, until such date when the
interest dues as above are actually paid to the
small enterprises for the purpose of
disallowance as a deductible expenditure
under section 23 of the MSMED Act
Panacea Biotec • Annual Report 2008-09117

Panacea Biotec • Annual Report 2008-09118
SCHEDULES TO CONSOLIDATED BALANCE SHEET AND PROFIT & LOSS ACCOUNT
8. Related Party DisclosuresA. Names of Related Parties
(a) Key Management Personnel: Mr. Soshil Kumar Jain - Chairman and Whole-time Director Mr. Ravinder Jain - Managing Director Dr. Rajesh Jain - Joint Managing Director Mr. Sandeep Jain - Joint Managing Director Mr. Sumit Jain - Whole-time Director
* Relatives/associates holding Equity Shares in the Company have been disclosed
(b) List of Persons having controlling interest together with their relatives*
Key Management Father Mother Wife Brother Sister Son Daughter Personnel
Soshil Kumar Jain - - Nirmala Jain - - Ravinder Jain, - Rajesh Jain, Sandeep Jain
Ravinder Jain Soshil Kumar Jain Nirmala Jain Sunanda Jain Rajesh Jain, - Sumit Jain, Radhika Jain Sandeep Jain Nipun Jain
Rajesh Jain Soshil Kumar Jain Nirmala Jain Meena Jain Ravinder Jain, - Ankesh Jain, - Sandeep Jain Harshet Jain
Sandeep Jain Soshil Kumar Jain Nirmala Jain Pamilla Jain Ravinder Jain, - - Priyanka Jain Rajesh Jain
Sumit Jain Ravinder Jain Sunanda Jain - Nipun Jain Radhika Jain - -
* Relatives holding Equity shares in the Company have been disclosed
(c) Relatives of Key Management personal having transactions with the Company
Mr. Ashwani Jain, Son-in-law of Mr. Soshil Kumar Jain
Mr. Shagun Jain, Son-in-law of Mr. Ravinder Jain
Mrs. Radhika Jain, Daughter of Mr. Ravinder Jain
Mrs. Shilpy Jain, Wife of Mr. Sumit Jain
(d) Enterprises over which person(s) having controlling interest in Company / Key management personnel(s) along with
their relatives are able to exercise significant influence;
(i) Neophar Alipro Limited, (ii) All India S. L. Jain Charitable Foundation, (iii) First Lucre Partnership Co.* , (iv) Second Lucre
Partnership Co.* , (v) Radhika Associates, (vi) Sumit Nipun & Co., (vii) Rattan Sons, (viii) Tahir & Co., (ix) Best On Health
Foods Ltd. , (x) Soshil Kumar Jain (HUF)*, (xi) Ravinder Jain (HUF)*, (xii) Rajesh Jain (HUF)*, (xiii) Sandeep Jain (HUF)*
* These enterprises are also holding Shares in the Company.
7. Deferred Tax Liabilities (Net): The break-up of deferred tax liability is as follows:-
Current Year Previous Year
Deferred Tax Liabilities:
Differences in depreciation and amortization in block of fixed assets as per tax books 501,434,945 375,059,972 and financial books
Deferred Revenue Expenditure 1,241,287 1,786,309
Capital expenditure on Research & Development 267,365,738 262,159,287
Forex Loss (revenue) deferred as per notification on AS-11 (Revised) 50,254,492 -
Gross Deferred Tax Liabilities 820,296,462 639,005,568
Deferred Tax Assets:
Effect of expenditure debited to Profit and Loss Account in the current year but 49,139,072 43,501,706 allowed for tax purposes in following years
Loss as per Income Tax Act carried forward 364,509,363 -
Unabsorbed Depreciation as per Income Tax Act carried forward 71,861,483 -
Gross Deferred Tax Assets 485,509,918 43,501,706
Net Deferred Tax Liability 334,786,544 595,503,862
Note: The Group has recorded a loss before tax of Rs.877,492,204 in year ended March 2009 which is mainly on account of foreign currency loss of Rs.1,702,604,000 on open derivative contracts. The group is otherwise earning good operating margin and based on orders on hand, it is virtually certain that it will earn sufficient margins to generate income to reverse book losses and will generate taxable profits to set-off the unabsorbed depreciation and carry-forward losses and other timing differences resulting into deferred tax assets. Hence, the group has recognised deferred tax asset as at March 31, 2009 on carry-forward losses component also.
Panacea Biotec • Annual Report 2008-09118

Panacea Biotec • Annual Report 2008-09119
SCHEDULES TO CONSOLIDATED BALANCE SHEET AND PROFIT & LOSS ACCOUNT
B. Details of Transactions with the Related Parties
Particulars Joint Ventures Associates Key Relatives and Total PanEra Biotec Chiron Panacea PanEra Biotec Lakshmi & Lakshmi & Management Associates of Key Pvt. Ltd. (Upto Vaccines Pvt. Ltd. (w.e.f. The Manager Manager Personal Management 20.11.2007) Pvt. Ltd. 21.11.2007) Holdings Ltd. PersonalA. During the yearPurchase of - - 63,092,690 - - - - 63,092,690 raw materials (7,797,679) (-) (12,824,361) (-) (-) (-) (-) (20,622,040)Sale - 121,638,985 20,568,527 - - - - 142,207,512 (-) (109,172,953) (-) (-) (-) (-) (-) (109,172,953)Processing Charges paid - - 12,578,568 - - - - 12,578,568 (-) (-) (-) (-) (-) (-) (-) (-)Recovery of dues on - - 33,481,411 - - - - 33,481,411 Account of Expenses (16,777,765) (-) (9,644,863) (-) (-) (-) (-) (26,422,628)Rent paid - - - - - - - - (3,539,340) (-) (-) (-) (-) (-) (-) (3,539,340)Rent received - - 8,886,016 - - - - 8,886,016 (28,000) (-) (541,473) (-) (-) (-) (-) (569,473)Investments made - - - - 24,754,276 - - 24,754,276 (-) (-) (-) (24,000,000) (-) (-) (-) (24,000,000)Sale of Investment - - - 24,754,276 - - - 24,754,276 (-) (-) (-) (-) (-) (-) (-) (-)Remuneration - - - - - 63,035,463 4,843,885 67,879,348 (-) (-) (-) (-) (-) (202,154,417) (4,842,137) (206,996,554)Loan/Fixed Deposits Received - - - - - - 300,000,000 300,000,000 (-) (-) (-) (-) (-) (-) (612,500,000) (612,500,000)Loan/Fixed Deposits Repaid - - - - - - 432,500,000 432,500,000 (-) (-) (-) (-) (-) (-) (348,390,000) (348,390,000)Interest Paid on Deposits/Loans - - - - - - 35,893,714 35,893,714 (-) (-) (-) (-) (-) (-) (25,935,713) (25,935,713)Dividend Paid- Equity Shares - - - - - 19,503,700 24,137,900 43,641,600 (-) (-) (-) (-) (-) (19,503,700) (24,137,900) (43,641,600)Purchase of Shares - - - - - - - - (-) (-) (-) (-) (-) (100,000) (590,000) (690,000)Donation made - - - - - - 300,000 300,000 (-) (-) (-) (-) (-) (-) (500,000) (500,000)B. Year end balancesInvestments - 11,479,550 2,098,835 - 24,754,276 - - 38,332,661 (-) (11,479,550) (2,098,835) (24,000,000) (-) (-) (-) (37,578,385)Outstanding receivable - 39,077,216 97,543,624 - - - - 136,620,840 (-) (27,558,846) (67,766,327) (-) (-) (-) (-) (95,325,173)Provision for bad and - - 67,766,327 - - - - 67,766,327 doubtful advances (-) (-) (67,766,327) (-) (-) (-) (-) (67,766,327)Outstanding Fixed - - - - - - 300,000,000 300,000,000 Deposits/Loan (-) (-) (-) (-) (-) (-) (432,500,000) (432,500,000)
Notes: 1. Figures in Brackets represent previous year figures. 2. In respect of personal guarantee given by Promoter-Directors refer Note no 2 of Schedule III. 3. In respect of Joint Venture & Associates figures represents other than Panacea Biotec Ltd.’s share. 4. Material related party transactions (More than 10% of aggregate) with individual parties are as follows:
Particulars Unsecured Loans/ Fixed Interest Managerial Remuneration Equity Dividend Deposits received/(repaid)
During the year Current Year Previous Year Current Year Previous Year Current Year Previous Year Current Year Previous Year
Key Management personnel
Mr. Soshil Kumar Jain - - - - 15,155,738 48,153,429 5,000,000 5,000,000
Mr. Ravinder Jain - - - - 19,321,956 59,771,725 4,646,200 4,646,200
Dr. Rajesh Jain - - - - 12,648,046 45,645,737 4,706,900 4,706,900
Mr. Sandeep Jain - - - - 12,648,046 45,645,737 4,792,100 4,792,100
Enterprises over which Person(s) having control or significant influence over the Company / Key management personnel(s), along with their relatives, are able to exercise significant influence
First Lucre Partnership Co. 300,000,000 612,500,000 35,893,714 25,405,853 - - - -
(432,500,000) (330,000,000) - - - - - -
All India S.L. Jain Charitable Foundation - - 415,993 - - - -
Year end Balances
First Lucre Partnership Co. 300,000,000 432,500,000 - - - - - -
Panacea Biotec • Annual Report 2008-09119

Panacea Biotec • Annual Report 2008-09120
SCHEDULES TO CONSOLIDATED BALANCE SHEET AND PROFIT & LOSS ACCOUNT
9. Derivative Instruments and Hedged/Unhedged Foreign Currency Exposure
i) Forward contract outstanding as at Balance Sheet date
Sell - Nil
Buy - Nil
ii) Particulars of Hedged Export Receivables at applicable exchange rates in respect of Options Contracts outstanding as at Balance Sheet date
Accordingly, exchange fluctuation loss on marking them to market as of year end amounting to Rs.1,702,604,000 (Previous Year Rs.40,500,000) has been accounted for and included in “Provision for Loss on Open Derivative Contracts” under Schedule XIII - Operating and Other Expenses
iii) Particulars of Hedged Foreign Currency Exposure as at the Balance Sheet date
Particulars Amount as at Currency Closing Amount as at Amount as at Currency Closing Amount as at 31st March’09 Exchange 31st Mar’09 31st March’08 Exchange 31st Mar’08 (in Foreign Currency) Rate* (INR) (in Foreign Currency) Rate* (INR)
Export Debtors 15,038,066 USD 50.71 762,580,345 28,387,626 USD 40.12 1,138,769,629
iv) Particulars of Unhedged Foreign Currency Exposure as at the Balance Sheet date
Particulars Amount as at Currency Closing Amount as at Amount as at Currency Closing Amount as at 31st March’09 Exchange 31st Mar’09 31st March’08 Exchange 31st Mar’08 (in Foreign Currency) Rate* (INR) (in Foreign Currency) Rate* (INR)
Import Creditors 6,035,469 USD 50.72 306,119,006 5,332,130 USD 40.11 213,845,059
- - - - 203850 USD 40.34 8,223,309
12,841,668 EURO 67.54 867,327,519 887,098 Euro 63.35 56,197,580
33,538 CHF 44.56 1,494,481 35,692 CHF 39.89 1,423,840
12,289 GBP 72.60 892,159 17,355 GBP 79.52 1,380,106
1,217,220 JPY/100 51.55 627,521 2,576,200 JPY/100 39.99 1,030,086
16,820 SEK 6.13 103,140 16,820 SEK 6.74 113,399
1,010 CAD 40.47 40,856 - - - -
Export Debtors 2,990,037 EURO 67.50 201,827,823 2,589,747 Euro 63.38 164,142,548
Foreign Currency Loans 65,097,252 USD 50.72 3,301,732,614 45,221,166 USD 40.11 1,813,595,469
Balance with Banks 9,652,566 USD 50.71 489,481,613 874,867 USD 40.12 35,095,289 10,5761 EURO 67.5 7,138,856 1,404,665 Euro 63.38 89,030,070
FCCBs 36,800,000 USD 50.72 1,866,496,000 36,800,000 USD 40.11 1,475,864,000
*The amount converted in INR is being round off to two decimal places.
Currency Exchange Amount in Amount in Amount in Amount in Purpose rates Foreign Currency Indian Rupees Foreign Currency Indian Rupees
Current Year Current Year Previous Year Previous Year
USD 41.00 - - 28,000,000 1,148,000,000 To
USD 40.55 - - 30,000,000 1,216,500,000 hedge
USD 40.00 58,000,000 2,320,000,000 84,000,000 3,360,000,000 Export
USD 39.00 48,000,000 1,872,000,000 48,000,000 1,872,000,000 Receivables
USD 39.60 36,000,000 1,425,600,000 36,000,000 1,425,600,000
142,000,000 5,617,600,000 226,000,000 9,022,100,000
Panacea Biotec • Annual Report 2008-09120

Panacea Biotec • Annual Report 2008-09121
10. Segmental Information
A. Information about Primary Segments
Particulars Vaccines Formulations Research & Development Healthcare Total
2008-09 2007-08 2008-09 2007-08 2008-09 2007-08 2008-09 2007-08 2008-09 2007-08
Revenue
Segment Revenue 5,617,717,120 6,432,222,552 2,262,302,398 1,976,017,495 1,699,562 5,195,312 - - 7,881,719,080 8,413,435,359
Other Income 5,952,196 40,218,416 24,950,226 32,517,814 - - - - 30,902,422 72,736,230
Total 5,623,669,316 6,472,440,968 2,287,252,624 2,008,535,309 1,699,562 5,195,312 - - 7,912,621,502 8,486,171,589
Segment Results 2,689,749,974 2,874,003,726 466,882,428 220,745,751 (668,244,483) (587,118,431) (5,658,514) - 2,482,729,405 2,507,631,046
Unallocated Corporate - 3,308,904,285 (744,741,593) Expenses
Operating Profit - (826,174,880) 1,762,889,453 /(Loss)
Interest & Finance - 321,543,582 (152,290,601) Charges
Other Income - 281,054,503 266,258,952
Income Taxes - (206,739,127) (587,041,067)
Net Profit/(Loss) - (659,924,832) 1,289,816,737
Other Information
Segment Assets 8,242,804,702 4,673,939,748 1,757,286,755 1,914,995,988 2,143,579,827 1,961,794,070 2,305,499,096 1,967,257,711 14,449,170,380 10,517,987,517
Unallocated Corporate 2,680,016,136 2,483,391,743 Assets
Total Assets 8,242,804,702 4,673,939,748 1,757,286,755 1,914,995,988 2,143,579,827 1,961,794,070 2,305,499,096 1,967,257,711 17,129,186,516 13,001,379,260
Segmental Liabilities 852,101,141 469,524,505 391,402,477 257,279,313 65,696,536 95,572,596 167,893,005 140,880,983 1,477,093,159 963,257,397
Unallocated Corporate 9,455,622,542 5,077,039,261 Liabilities
Total Liabilities 852,101,141 469,524,505 391,402,477 257,279,313 65,696,536 95,572,596 167,893,005 140,880,983 10,932,715,701 6,040,296,658
Capital Expenditure- 1,950,193,086 372,154,760 123,752,797 82,121,704 578,593,601 175,826,431 375,658,708 1,185,014,759 Additions
Non Cash Expenses
Depreciation 351,933,819 112,965,480 125,068,119 129,116,679 169,025,407 131,914,637 7,991,099 2,315,094
SCHEDULES TO CONSOLIDATED BALANCE SHEET AND PROFIT & LOSS ACCOUNT
B. Information about Secondary Segments
a) Revenue as per Geographical Markets
Segment Domestic* Overseas
Current Year Previous Year Current Year Previous Year
Vaccines 4,139,282,326 6,123,244,312 1,478,434,793 308,978,240Formulation 1,798,741,628 1,604,484,560 463,560,771 371,532,936Healthcare - - - -R&D - - 1,699,562 5,195,312Total 5,938,023,954 7,727,728,872 1,943,695,126 685,706,488
* Domestic revenue includes revenue from deemed exports of Rs.3,708,466,456 (Previous Year Rs.5,797,333,245)
b) Debtors as per Geographical Segment
Segment Domestic Overseas
Current Year Previous Year Current Year Previous Year
Vaccines 298,940,869 1,163,295,364 536,329,974 Formulation 140,405,116 109,309,365 226,054,249 179,883,788Healthcare - - - -R&D - 6,359,660Total 439,345,985 1,272,604,729 762,384,223 186,243,448
c) The Company has common fixed assets for producing goods for Domestic Market and Overseas Market. Hence, separate figures for fixed assets / additions to fixed assets cannot be furnished.
Panacea Biotec • Annual Report 2008-09121

Panacea Biotec • Annual Report 2008-09122
11. Leases
i) For assets given under Operating Lease agreements:
a) The Company has leased out the assets situated at Lalru, Punjab on operating lease to its Associate, PanEra Biotec Private Ltd.
Gross Block Accumulated Depreciation Depreciation charged to P&L Account
Particulars Current Previous Current Previous Current Previous Year Year Year Year Year Year
Building 89,955,066 18,352,562 33,159,226 6,605,854 5,327,263 1,305,186
Furniture and Fixture 10,659,476 6,750,149 5,639,670 3,861,199 1,151,292 638,461
Office Equipment 1,904,239 512,602 769,438 244,331 270,436 43,346
Plant & Machinery 663,486,845 316,043,799 247,986,666 146,532,544 66,307,911 27,388,797
Computer Equipment 5,950,080 671,976 1,549,742 557,752 688,492 76,149
Total 771,955,706 342,331,088 289,104,742 157,801,680 73,745,394 29,451,939
SCHEDULES TO CONSOLIDATED BALANCE SHEET AND PROFIT & LOSS ACCOUNT
The total of Minimum Future Lease Payments under non-cancelable operating lease for various periods for assets stated above is as follows:
As at March 31, 2009* As at March 31, 2008
a) Receivable within 1 year 67,600,000 9,600,000
b) Later than 1 year but not later than 5 years 67,600,000 -
c) Later than 5 years - -
* The Lease term for the assets given on lease vide Agreement for providing Manufacturing Facility, Utilities and Services of Employees and transfer of raw material with PanEra Biotec Pvt. Ltd. is valid till 31.03.2011. As per the said Agreement, during the period of usage, if any, Facility is used for manufacture of the Company’s Vaccines other than those mentioned therein or the facility remains idle due to insufficiency of orders from the Company, no lease rental shall be payable by PanEra Biotec Pvt. Ltd. during the relevant period.
The Company has also given an office space in its building situated at B-1 Extn./A-27, Mohan Co-operative Industrial Estate, New Delhi on operating lease to PanEra Biotec Pvt. Ltd.
b) Total of future minimum lease payments under operating lease mentioned above:
As at March 31, 2009 As at March 31, 2008
a) Receivable within 1 year 14,000 21,000
b) Later than 1 year but not later than 5 years - -
c) Later than 5 years - -
ii. For assets taken on Lease
a) The Company has taken various residential, office and godown premises under operating lease agreements. These are generally not non-cancelable and are renewable by mutual consent on mutually agreed terms. . There is no sublease payments expected to be received at the balance sheet date and no restrictions is imposed by lease arrangements.
b) Lease payments for the year are Rs.63,107,965 (Previous Year Rs.63,056,022).
c) Total of future minimum lease payments under Non Cancelable operating lease:
Particulars As at March 31, 2009 As at March 31, 2008
a) Payable within 1 year 9,714,882 9,357,368
b) Later than 1 year but not later than 5 years 12,721,625 28,116,760
Panacea Biotec • Annual Report 2008-09122

Panacea Biotec • Annual Report 2008-09123
SCHEDULES TO CONSOLIDATED BALANCE SHEET AND PROFIT & LOSS ACCOUNT
12. (a) Details of Company’s share in Joint Ventures included in the Consolidated Financial Statements are as follows:
As at As at March 31, 2009 March 31, 2008
Sources of Funds1. Shareholders’ Funds a) Share Capital b) Reserves & Surplus 46,571,024 53,137,5402. Loan Funds a) Secured Loans 163,121 7,813,063 b) Unsecured Loans - -
Application of Funds1. Fixed Assets a) Gross Block 11,000,281 20,522,254 Less : Depreciation 7,790,995 11,459,002 Net Block 3,209,287 90,63,252 b) Capital Work-in-Progress - 7,371,2972. Deferred Tax Assets 1,994,049 1,723,3713. Current Assets, Loans & Advances A. Current Assets 143,485,483 122,905,261 B. Current Liabilities & Provisions 78,995,574 53,485,062 Net Current Assets (A)-(B) 64,489,909 69,420,1994. Miscellaneous Expenditure - -
Year ended Year ended March 31, 2009 March 31, 2008
Income Turnover 269,186,069 238,787,974 Other Income 5,737,410 15,596,464 Total Income 274,923,479 254,384,438
Expenditure Manufacturing & Administrative Expenses 175,809,060 192,195,864 Personnel Expenses 40,530,528 48,998,905 Interest & Finance Expenses 289,382 878,015 Selling & Distribution Expenses 23,761,359 2,119,755 Total Expenditure 240,390,329 244,192,539
b) Subsequent Event: The Company’s Joint Venture Cambridge Biostability Limited (CBL), having regard to its financial position, has initiated steps to place it into creditors’ voluntary liquidation, subsequent to the balance sheet date. Due to the financial position of CBL, the Company considers its investments in CBL as well as loan given to it, doubtful of recovery. Accordingly, the following have been provided for in the books of accounts of current year:
Particulars Amount (INR) Investment made 168,068,998 Loan given 108,833,850 Interest accrued on above Loan 7,275,470 Total 284,178,318
In view of the above development and consequent inability of the Joint Venture Company with regard to transfer of funds to the Venturer, the Company has discontinued proportionate consolidation of the Joint Venture Company. Consequently, net assets and goodwill amounting to Rs.9,532,746 and Rs.157,190,676 respectively has been adjusted in the books of accounts in the current year. Also due to discontinuation of non-integral foreign operations, cumulative amount of gain on exchange differences (Foreign Currency Translation Reserve) on these operations amounting to Rs.7,009,383 have been recognized as income in the current year.
13. The Company has a defined benefit gratuity plan. Every employee who has completed five years or more of service gets a gratuity on departure at 15 days salary (last drawn salary) for each completed year of service subject to maximum of Rs.3,50,000. The scheme is funded with an insurance company in the form of a qualifying insurance policy.
The following tables summarize the components of net benefit expense recognized in the Profit & Loss Account and the funded status and amounts recognized in the Balance Sheet for the respective plans.
Panacea Biotec • Annual Report 2008-09123

Panacea Biotec • Annual Report 2008-09124
Balance sheet
Details of Provision for Gratuity:
Particulars 2008-09 2007-08
Defined benefit obligation 100,695,065 87,922,995
Fair value of plan assets 43,638,111 30,002,106 57,056,954 57,920,889 Less: Unrecognized past service cost Plan (liability) (57,056,954) (57,920,889)
Changes in the fair value of plan assets are as follows:
Particulars 2008-09 2007-08
Opening fair value of plan assets 30,002,106 21,981,664
Expected return 2,770,184 2,026,934Contributions by employer 14,109,975 11,054,570Benefits paid (4,025,152) (5,410,262)Actuarial Gain /(losses) 780,999 349,200Closing fair value of plan assets 43,638,111 30,002,106
The Company has since contributed Rs.14,809,973 to the gratuity fund.
Changes in the present value of the defined benefit obligation are as follows:
Particulars 2008-09 2007-08
Opening defined benefit obligation 87,922,995 54,165,505Interest cost 6,643,369 4,381,877Current service cost 13,648,636 9,196,529Actual return on plan assets Benefits paid (4,025,152) (5,410,262)Actuarial losses on obligation (3,494,783) 25,589,347Closing defined benefit obligation 100,695,065 87,922,996
The major categories of plan assets as a percentage of the fair value of total plan assets are as follows:
Particulars 2008-09 2007-08
Investments with insurer 100% 100%
The overall expected rate of return on assets is determined based on the market prices prevailing on that date, applicable to the period over which the obligation is to be settled. There has been significant change in expected rate of return on assets due to the improved debt market scenario.
The principal assumptions used in determining gratuity obligations for the Company’s plans are shown below:
Particulars 2008-09 2007-08
Discount rate 6.50% to 7.50% 8.00%Expected rate of return on plan assets 8.00% to 9.25% 8.00 to 9.25%Increase in compensation cost 5.00% to 12.00% 5.50 to 10.00%Employee turnover upto 30 years 10.00% 10.00%above 30 years but upto 44 years 5.00% 5.00%above 44 years 1.00% 1.00%
The estimates of future salary increases, considered in actuarial valuation, take account of inflation, seniority, promotion and other relevant factors, such as supply and demand in the employment market.
SCHEDULES TO CONSOLIDATED BALANCE SHEET AND PROFIT & LOSS ACCOUNT
Particulars 2008-09 2007-08
Current service cost 13,648,636 9,196,529Interest cost on benefit obligation 6,643,369 4,381,877Expected return on plan assets (2,770,184) (2,026,934)Net actuarial gain recognized in the year on account of return on plan assets (4,275,782) -Net actuarial loss recognized in the year - 25,240,147Net benefit expense* 13,246,040 36,791,619Actual return on plan assets (3,452,434) (2,265,802)
* Includes Gratuity expense of Rs.3,439,471 (Previous Year Rs.3,287,690) accounted under Research & Development Expenses.
Profit and Loss Account
Net employee benefit expense - Gratuity (recognized in Employee Cost)
Panacea Biotec • Annual Report 2008-09124

Panacea Biotec • Annual Report 2008-09125
14. The Company has incurred expenditure on Pre-Clinical Development studies amounting to Rs.123,978,449 during the year (Previous Year Rs.185,575,387). This expenditure relates to studies carried out by Clinical Research Organization (CRO) towards obtaining registration of Company’s products in US and / or Europe. The expenditure incurred has been capitalized and carried in Capital Work in Progress. Management believes that it is in the nature of development expenditure and meets the capitalization criteria set out in Accounting Standard 26 on Intangible Assets issued by the Institute of Chartered Accountants of India due to the following reasons:
• the expenditure is not towards basic research and therefore no New Chemical Entity comes into being. Basic research is conducted by the Company in its own R&D centers, but such developmental work is performed through external agencies (CROs). Safety profile of the basic molecule is well established in several countries in Europe and in India and the product is being marketed successfully in several countries under different brand names.
• there is no experience to suggest that the studies conducted by CROs on behalf of the Company would lead to or make it difficult for the Company to obtain regulatory approvals in US and / or Europe.
The management believes that these products would be commercially viable and there is no reason to believe that there is any uncertainty that may lead to not securing registration for the products from regulatory authorities in US and / or Europe.
15. In accordance with Accounting Standard 9 on ‘Revenue Recognition’ notified by the Companies (Accounting Standards) Rules, 2006, Excise Duty on turnover amounting to Rs.18,845,112 (Previous year Rs.37,756,574) has been reduced from turnover in Profit & Loss Account and differential Excise Duty on opening and closing stock of finished goods amounting to Rs.Nil (Previous year Rs.Nil) has been adjusted from Raw Materials, Finished Goods, Work in Progress and Job Processing charges in Schedule XII.
16. The Company has exercised the option as per the Companies (Accounting Standards) Rules, 2009. As per the option exchange differences related to long term foreign currency monetary items so far as they relate to the acquisition of a depreciable capital assets are capitalized and depreciated the same over the useful life of the assets and in other cases, have transferred to Foreign Currency Monetary Item Translation Difference Account and amortized over the balance period of such long term assets/liabilities but not beyond accounting period ending on or before 31st March 2011, the unamortized balance in this account is Rs. 95,961,134 (Previous year Rs. Nil).
17. The Company is in the process of appointing independent consultants for conducting a Transfer pricing study to determine whether the transactions with associated enterprises were undertaken at “arms length basis”. The management confirms that all international transactions with associated enterprises are undertaken at negotiated contracted prices on usual commercial terms. Further there has been no change in the terms of such international transactions till March 31, 2009.
18. Details of Loans and Advances to Associates and Parties in which directors are interested (as required by clause 32 of listing agreement) to the extent of the share of balances outside group:
SCHEDULES TO CONSOLIDATED BALANCE SHEET AND PROFIT & LOSS ACCOUNT
As per our attached report of even date
S.R. Batliboi & Co. For and on behalf of the BoardChartered Accountants Ravinder Jain Managing Directorper Manoj GuptaPartner I.K. Sharma Dr. Rajesh JainMembership No. 83906 D.G.M. (Accounts & Finance) Joint Managing Director
Place : New Delhi Vinod GoelDated : May 27, 2009 G.M. Legal & Company Secretary
2008-09 2007-08
Contribution to Provident FundCharged to Profit and Loss Account 31,045,359 25,677,410
The Company expects to contribute Rs.17,575,000 to gratuity fund in the year 2009-10.
Defined Contribution Plan:
Particulars Current Year Previous Year
Dues from Associates - PanEra Biotec Pvt. Ltd. (Previously known as Panheber Biotec Pvt. Ltd.) Balance Recoverable (including Rs. 20,568,527 on account of sale of raw material 97,543,624 67,766,327 grouped as sundry debtors under Schedule VII) Maximum amount due at any time during the year 97,543,624 67,766,327
19. Previous year’s figures have been rearranged and reclassified wherever necessary to make them comparable with the current year’s figures.
Particulars 2008-09 2007-08 2006-07
Defined benefit obligation 100,695,065 87,922,995 54,165,505Plan assets 43,638,111 30,002,106 21,981,664Deficit 5,705,6954 57,920,889 32,183,841Experience adjustments on plan liabilities (3,286,351) (236,689) (21,981)Experience adjustments on plan assets (743,588) (238,939) (7,984)
Gratuity amounts for the current and previous periods are as follows:
Panacea Biotec • Annual Report 2008-09125

Panacea Biotec • Annual Report 2008-09126
A. Cash Flow from Operating Activities: Net operating profit before tax (866,663,960) 1,876,025,059 Depreciation 714,198,042 465,881,899 Interest Expenses 321,543,582 116,455,124 Provison for Doubtful Debts & Advances 422,105 27,044,708 Interest Income (179,781,777) (56,486,004) (Profit)/Loss on sale of Fixed Assets (6,937,487) (22,830,661) Intangibles written off (46,263,349) 2,103,721 Provision for Impairment & doubtful Loans 284,178,318 - Unrealized Foreign Exchange (Gain)/Loss 1,689,589,699 (102,855,667) Amortised exchange differences 47,980,567 - Deferred Revenue Expenditure written off during the year 1,306,690 2,826,236,390 1,556,353 430,869,473 Operating profit before working capital changes 1,959,572,430 2,306,894,532 (Increase) / Decrease in Trade and Other Receivables 74,223,324 (1,052,606,073) (Increase)/Decrease in Inventories (2,367,283,704) (53,828,110) Increase / (Decrease) in Current Liabilities & Provisions 527,604,285 (1,765,456,095) (148,473,118) (1,254,907,301) Cash generated from operations 194,116,335 1,051,987,231 Net Direct Taxes paid (262,488,116) (349,052,477) Net cash from operating activities (68,371,781) 702,934,754B. Cash flow from investing activities: Purchase of Fixed Assets (2,025,133,881) (2,926,138,709) Proceeds of deposits matured (with maturity more than three months) 1,250,968,300 402,060,214 Deposits (with maturity more than three months) (70,376,198) (1,250,968,300) Sale of Fixed Assets 52,261,957 31,304,037 Interest Received 182,155,836 57,774,295 Invetsment made (691,734,460) (152,806,491) Invetsments sold 149,108,804 (1,152,749,642) - (3,838,774,954) Net cash used in investing activities (1,221,121,423) (3,135,840,200) Net cash from operating and investing activitiesC. Cash flow from financing activities: Net increase in Working Capital Borrowings 1,292,036,897 256,194,912 Long Term Borrowings raised 837,914,977 2,057,104,157 Fixed Deposits received 300,500,000 - Fixed Deposits repaid (436,110,000) - Long Term Borrowings repaid (243,100) - Movement in Securities Premium Account - 2,263,266 Portion of (profit)/ loss in Associates - 52,002,560 Interest paid (313,814,246) (114,515,280) Dividend & Tax on Dividend paid (81,149,949) (76,872,959) Net Cash from Financing activities 1,599,134,579 2,176,176,656 Net cash from operating, investing & financing activities 378,013,156 (959,663,544) Net increase/ (decrease) in Cash & Cash equivalent 378,013,156 (959,663,544) Opening balance of Cash & Cash equivalent 295,835,044 1,254,672,615 Closing balance of Cash & Cash equivalent 673,848,200 295,009,071
Note: Components of Cash and cash equivalent: i) Cash Balance on Hand 9,243,607 2,653,554 ii) Balance with Scheduled Banks : a) In Current Accounts 100,130,657 104,179,993 b) In Unpaid Dividend Accounts* 1,583,956 1,536,608 c) In Fixed Deposits 140,844,041 1,314,307,829 d) In Exchange Earner Foreign Currency Current Accounts 496,620,469 124,125,360 Cash & Bank Balances as per Schedule VI 748,422,730 1,546,803,344 Less: Fixed deposits for maturity period more than 3 months 70,376,198 1,250,968,300 678,046,532 295,835,044 Less: Effect of Exchange Differences on Cash and Cash 4,198,332 825,973 Equivalents held in foreign currency Cash & Bank Balances as per Cash Flow Statements 673,848,200 295,009,071
* These balances are not available for use by the Company as they represent corresponding unpaid dividend liabilities.
Amount in Rs.
Current Year Previous Year
CASH FLOW STATEMENT ANNEXED TO CONSOLIDATED BALANCE SHEET FOR THE YEAR ENDED 31ST MARCH, 2009
As per our attached report of even date
S.R. Batliboi & Co. For and on behalf of the BoardChartered Accountants Ravinder Jain Managing Directorper Manoj GuptaPartner I.K. Sharma Dr. Rajesh JainMembership No. 83906 D.G.M. (Accounts & Finance) Joint Managing Director
Place : New Delhi Vinod GoelDated : May 27, 2009 G.M. Legal & Company Secretary
Panacea Biotec • Annual Report 2008-09126


Panacea Biotec Ltd.Corporate OfficeB-1 Extn./G-3, Mohan Co-op. Indl. Estate,Mathura Road, New Delhi - 110 044, India