performance evaluation criteria for preparation and...
TRANSCRIPT
85
Pure Appl. Chem., Vol. 80, No. 1, pp. 85–104, 2008.doi:10.1351/pac200880010085© 2008 IUPAC
INTERNATIONAL UNION OF PURE AND APPLIED CHEMISTRY
ANALYTICAL CHEMISTRY DIVISION*
PERFORMANCE EVALUATION CRITERIA FORPREPARATION AND MEASUREMENT OF MACRO-
AND MICROFABRICATED ION-SELECTIVEELECTRODES
(IUPAC Technical Report)
Prepared for publication byERNO LINDNER1 AND YOSHIO UMEZAWA2,‡
1Department of Biomedical Engineering, Herff College of Engineering, Room 330, EngineeringTechnology, Memphis, TN 38152-6582, USA; 2Department of Chemistry, School of Science,
The University of Tokyo, 7-3-1 Hongo, Bunkyo-ku, Tokyo 113-0033, Japan
*Membership of the Analytical Chemistry Division during the final preparation of this report was as follows:
President: R. Lobinski (France); Titular Members: K. J. Powell (New Zealand); A. Fajgelj (Slovenia); R. M. Smith(UK); M. Bonardi (Italy); P. De Bièvre (Belgium); B. Hibbert (Australia); J.-Å. Jönsson (Sweden); J. Labuda(Slovakia); W. Lund (Norway); Associate Members: Z. Chai (China); H. Gamsjäger (Austria); U. Karst(Germany); D. W. Kutner (Poland); P. Minkkinen (Finland); K. Murray (USA); National Representatives:C. Balarew (Bulgaria); E. Dominguez (Spain); S. Kocaoba (Turkey); Z. Mester (Canada); B. Spivakov (Russia);W. Wang (China); E. Zagatto (Brazil); Provisional Member: N. Torto (Botswana).
‡Corresponding author: E-mail: [email protected]
Republication or reproduction of this report or its storage and/or dissemination by electronic means is permitted without theneed for formal IUPAC permission on condition that an acknowledgment, with full reference to the source, along with use of thecopyright symbol ©, the name IUPAC, and the year of publication, are prominently visible. Publication of a translation intoanother language is subject to the additional condition of prior approval from the relevant IUPAC National AdheringOrganization.
Performance evaluation criteria forpreparation and measurement of macro-and microfabricated ion-selectiveelectrodes
(IUPAC Technical Report)
Abstract: Over the last 30 years, IUPAC published several documents with the goalof achieving standardized nomenclature and methodology for potentiometric ion-selective electrodes (ISEs). The ISE vocabulary was formulated, measurementprotocols were suggested, and the selectivity coefficients were compiled.However, in light of new discoveries and experimental possibilities in the field ofISEs, some of the IUPAC recommendations have become outdated. The goal ofthis technical report is to direct attention to ISE practices and the striking need forupdated or refined IUPAC recommendations which are consistent with the state ofthe art of using macro- and microfabricated planar microelectrodes. Some of theseISE practices have never been addressed by IUPAC but have gained importancewith the technological and theoretical developments of recent years. In spite of itsrecognized importance, a generally acceptable revision of the current IUPAC rec-ommendations is far beyond the scope of this work.
Keywords: ISEs; microfabricated; ion-selective electrodes; potentiometry; pico-molar; nanomolar; IUPAC Analytical Chemistry Division.
CONTENTS
1. INTRODUCTION2. IONOPHORE-BASED SOLVENT POLYMERIC (LIQUID) MEMBRANE ION-SELECTIVE
ELECTRODES2.1. Charged sites in solvent polymeric membranes2.2. Determination of the concentration of charged sites in solvent polymeric membranes 2.3. Changes in the membrane composition through leaching and decomposition
2.3.1. Determination of the ionophore/site concentration in ion-selective membranes3. DETECTION LIMIT OF ION-SELECTIVE ELECTRODES 4. REEVALUATION OF THE PUBLISHED SELECTIVITY COEFFICIENT DATA 5. MEASUREMENT PROTOCOLS FOR OPTIMAL ION-SELECTIVE ELECTRODE PERFOR-
MANCE 5.1 Planar microfabricated electrodes5.2 Solid or liquid contact: A simple test protocol
6. ANALYTICAL CALIBRATION CURVES (CALIBRATION PLOTS) FOR pH AND OTHERION-SELECTIVE ELECTRODES
7. SYMBOLS AND ACRONYMS7.1 List of symbols7.2 List of acronyms
8. REFERENCES
E. LINDNER AND Y. UMEZAWA
© 2008 IUPAC, Pure and Applied Chemistry 80, 85–104
86
1. INTRODUCTION
In the last 30 years, IUPAC produced several documents with the purpose of achieving standardizednomenclature and methodology in the field of potentiometric ion-selective electrodes (ISEs) due to thebroad interest in ISEs and their practical importance. As a part of this work, the vocabulary for the mostcommon terms and methods has been formulated [1,2], the selectivity coefficients have been compiled[3–6], and suggestions for the definition and measurement of the dynamic response have been proposed[7]. Some of the IUPAC recommendations are widely accepted and used throughout the field for char-acterizing ISEs. Others remain at the level of recommendation without wide acceptance. Finally, someare considered controversial or have become outdated with new discoveries. In recent years, the detec-tion limits and selectivity coefficients of several known ISEs have been improved by several orders ofmagnitude (for review, see [8]) and novel, nonclassical response principles have been introduced [9]. Toachieve nano- and picomol/L detection limits, the ISEs were often used under nonequilibrium condi-tions in which engineered concentration gradients [10] or external current [11,12] were utilized to elim-inate minor ionic fluxes across the membrane which contaminated the sample solution in contact withthe sensing membrane. On the application side, planar, microfabricated ISEs gained ground both as re-search tools as well as detectors in commercial blood gas analyzers [13,14]. These novel experimentaland theoretical findings in potentiometry justify the critical evaluation of the existing IUPAC recom-mendations.
Besides the IUPAC-recommended protocols [15], there are common practices in the methodologyof using ISEs, which are accepted throughout the field although they have never been addressed by theIUPAC. Some of these have a well-established scientific background and are in accord with the IUPACsuggestions. Others are believed to provide practical advantages and are practiced without explanationor questioning of their origin. However, in light of the most recent findings, some of these commonpractices have certain negative consequences which were not recognized until recently. Consequently,some of these practices contribute to the generally accepted view that the detection limits of ISEs arein the concentration range between 10–5 and 10–7 mol/L, both for solid-state and liquid membrane elec-trodes, independent of the membrane matrix and its active ingredients. Some of these practices are listedin the following examples:
• Freshly prepared electrodes are generally conditioned in a relatively concentrated (c ≥ 10–3
mol/L) primary ion solution before testing. Most commonly, the analytical performance charac-teristics of ISEs are tested after conditioning them overnight. However, hardly any data are avail-able on the effect of this “required” conditioning on the performance characteristics of ISEs as afunction of conditioning time or composition of the conditioning solution. The drift and the stan-dard deviation of the measured cell voltage [1], in a solution of constant composition and at con-stant temperature, following the first solution contact and after extensive conditioning, are gener-ally not reported. Similarly, only a few papers are devoted to the analysis of structural andchemical changes in the phase boundary layers of the ion-selective membranes during condition-ing and their correlation with the analytical signal. Actually, in light of the most recent findings,conditioning the sensing membrane in concentrated primary ion solutions cannot be recom-mended and may be disadvantageous with respect to the attainable detection limit.
• In most conventional (macro) ISEs, a relatively concentrated solution of the primary ion is usedas inner filling solution (IFS) (10–2 to 10–3 mol/L). It was widely accepted that it is essential tohave well-defined phase boundary potentials on the IFS side of the ion-selective membrane.However, as it was proved recently [16], the use of concentrated IFS is rather disadvantageous asit may contribute to primary ion leaching across the membrane into the sample solution due tosalt co-extraction. This primary ion leaching is considered the major source of biased detectionlimits and selectivity coefficient values published throughout the literature. Based on this knowl-edge, the use of highly diluted IFSs with well-controlled ion activities (e.g., buffered) is recom-
© 2008 IUPAC, Pure and Applied Chemistry 80, 85–104
Macro- and microfabricated ion-selective electrodes 87
mended [10]. The concentration of the IFS should be somewhat lower or should match the con-centration of the most dilute analyte solution [17].
• Although the most common method for determining the selectivity coefficient of ISEs is the so-called separate solution method (SSM), in which the ISE membrane under test is exposed tosolutions of one or many interfering ions, hardly any information is available on the effect of theseexposures to solutions of interfering ions (time and concentration) on the electrode performancecharacteristics in solutions containing primary ions following the selectivity coefficient measure-ments (e.g., short time stability of the measured potential before and after evaluating the selec-tivity coefficients) [18]. Similarly, the effect of interfering substances in the sample (ionic or non-ionic) on the electrode performance is generally not explored in detail. The mechanism as to howthese substances (with parameters concentration level and exposure time) affect the membranecomposition and the electrode performance in most of the cases is unknown.
• Based on practical experience, it is widely accepted that the slope of the response function of ISEsremains fairly constant during extended use while the offset voltage may drift. Drifting offsetvoltage can indicate changes in the membrane composition as a consequence of (i) ion-exchangeprocesses in the presence of high concentration of interfering ions in the sample, (ii) anion co-ex-traction in highly concentrated samples or in the presence of highly lipophilic anions, (iii) de-composition of the ionophore and/or added charged sites in the membrane, and (iv) leachingmembrane ingredients. Although a drift in the offset voltage is most probably related to changesin the membrane composition, by characterizing short- and long-term stability of ISEs, an even-tual drift in the potential of the reference electrode is generally not considered. By and large, noinformation is provided on the stability of the reference electrodes when the performance char-acteristics of novel ISEs are reported. In summary, instead of addressing the origin of the drift ofISEs, they are frequently calibrated to achieve the required precision and accuracy of the deter-minations.
In the last decade, microfabricated, planar ISEs have been progressively gaining importance[14]. The driving force behind these developments is related to the need for simple, single-use devicesfor measurements in a medical context, such as in emergency situations, bed-side analysis, and in thedoctor’s office. These devices should be manufactured cost-effectively and work without calibration(or with minimal calibration) for the analysis of minute sample volumes (up to a few microliters). Inaddition, there is a continuous desire for short- or long-term in vivo monitoring of blood electrolytes,which would require sterilizable, biocompatible sensor structures with excellent stability (i.e., withnegligible potential drift in the time frame of the experiment). Unfortunately, there are no IUPAC rec-ommendations for evaluation of the performance characteristics of planar microfabricated electrodes.Consequently, the protocols used to evaluate the performance characteristics of macroelectrodes aregenerally adapted to characterize planar microfabricated electrodes. However, this is not always ap-propriate in view of the differences in the design of macro- and microfabricated planar micro-electrodes.
The goal of this technical report is to direct attention to ISE practices and the striking need forupdated or refined IUPAC recommendations, and to highlight critical areas which need new recom-mendations in accordance with the new state of the art of macro- and microfabricated planar micro-electrodes. Some of these ISE practices have never been addressed by IUPAC but have gained impor-tance with the technological and theoretical developments of recent years. Although the authorsrecognize the need for a new, generally acceptable revision of the current recommendations [1], this re-vision is far beyond the scope of the present work.
E. LINDNER AND Y. UMEZAWA
© 2008 IUPAC, Pure and Applied Chemistry 80, 85–104
88
2. IONOPHORE-BASED SOLVENT POLYMERIC (LIQUID) MEMBRANE ION-SELECTIVEELECTRODES
It was recognized quite early that the detection limit of ISEs can be extended to amount concentrationsin the submicromol/L range if the primary ion concentrations were set with appropriate ion buffers[19–21]. With precipitate-based electrodes, it was also found that the limited working range of ISEs isdue to primary ion contamination arising from the sensing membrane itself [22,23]. In the presence ofion buffers, this contamination is removed from the sensing surface. Under these conditions, the detec-tion limit could be extended to much lower concentrations [24,25], and the selectivity coefficients wereimproved [26]. Unfortunately, in the absence of the ion buffers (i.e., during the analysis of real sam-ples), the appealing selectivity coefficients and detection limits could not be reproduced. The knowl-edge that the source of the limited working range of neutral and charged carrier-based solvent polymericmembranes is related to minor ionic fluxes across the membrane came much later [10,16]. However,once the origin of the contamination (i.e., minor ionic fluxes across the membrane) had been eliminated(or minimized), spectacular improvements in the detection limit and selectivity coefficients of ISEswere achieved [27]. Ideal membranes do not contaminate their boundary layers, but real membranes,with less than perfect ion- and permselectivity, do. It is not always realized that highly selectiveionophores are not enough for detection at submicromol/L concentrations in complex matrices.Recognizing the role of the other membrane components, especially charged sites and lipophilic elec-trolytes, has been essential in membrane optimization. Unfortunately, the optimized membrane per-formance may change during use as membrane components decompose or leach out from the mem-brane into the sample, which limits the sensor’s lifetime [28–32].
2.1 Charged sites in solvent polymeric membranes
Membranes frequently contain built-in “fixed” ionic sites, e.g., negatively charged immobile –SO3–
groups in sulfonated cross-linked polystyrene membranes, or intentionally added hydrophobicallytrapped “mobile” ionic sites, e.g., tetraphenylborate derivatives in plasticized poly(vinyl chloride)(PVC). The response of ISEs, based on ionophore- or ion carrier-loaded solvent polymeric or liquidmembranes (i.e., membranes with an incorporated lipophilic complexing agent that reversibly bindsions) strongly depends on the charge sign and amount concentration of these fixed and mobile ionicsites. The importance of fixed and mobile sites in ionophore-based solvent polymeric membranes hasbeen advocated very early [33,34]. The presence of ionic sites is commonly used to explain the perm-selectivity of neutral carrier-based solvent polymeric membranes, which is a prerequisite for ISE re-sponses. A smaller fraction of ionic sites regularly originates from impurities of membrane components,such as the membrane plasticizer or the polymer matrix (e.g., PVC) [35]. The dominating fraction ofionic sites, however, is deliberately incorporated into the membrane in order to improve its performanceand characteristics. Deliberately added ionic sites are nowadays routinely used to decrease the electricresistance of the membrane [36] and the interference of lipophilic counterions related to salt co-extrac-tion into the membrane (Donnan exclusion failure) [37]. Added sites are also utilized to control thepotentiometric selectivity [38] and to shorten response time [39] of polymeric membrane electrodes.
Since the materials utilized in ion-selective membranes (e.g., polymers or plasticizers) almost al-ways contained some ionic impurities, it was not trivial to recognize the importance of charged sites inthe ion-selective membranes and very little is still known about the properties of membranes free ofionic sites. For understanding the role and to demonstrate the need for ionic sites in ion-selective mem-branes, the potentiometric properties of membranes free of ionic sites had to be compared to those with“regular” composition (containing only fixed ionic sites or both fixed and mobile ionic sites) [40]. Tobetter understand the influence of ionic sites on the potentiometric responses of solvent polymericmembrane ISEs, optical second-harmonic generation (SHG) at the liquid–liquid interfaces ofionophore-free and neutral ionophore-incorporated membranes has been measured simultaneously with
© 2008 IUPAC, Pure and Applied Chemistry 80, 85–104
Macro- and microfabricated ion-selective electrodes 89
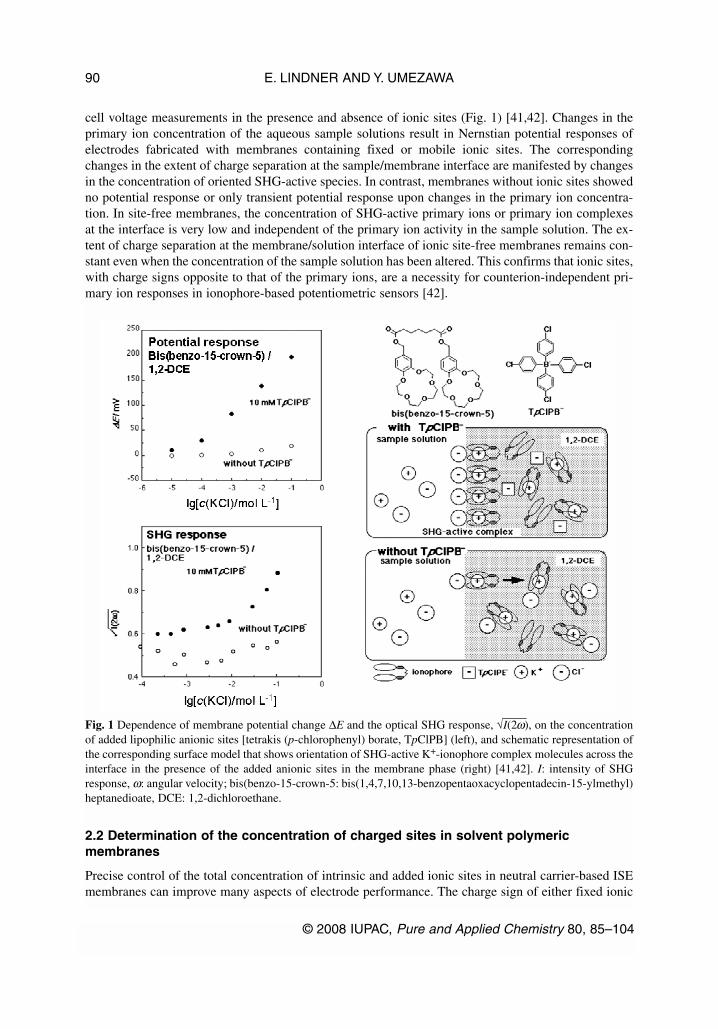
cell voltage measurements in the presence and absence of ionic sites (Fig. 1) [41,42]. Changes in theprimary ion concentration of the aqueous sample solutions result in Nernstian potential responses ofelectrodes fabricated with membranes containing fixed or mobile ionic sites. The correspondingchanges in the extent of charge separation at the sample/membrane interface are manifested by changesin the concentration of oriented SHG-active species. In contrast, membranes without ionic sites showedno potential response or only transient potential response upon changes in the primary ion concentra-tion. In site-free membranes, the concentration of SHG-active primary ions or primary ion complexesat the interface is very low and independent of the primary ion activity in the sample solution. The ex-tent of charge separation at the membrane/solution interface of ionic site-free membranes remains con-stant even when the concentration of the sample solution has been altered. This confirms that ionic sites,with charge signs opposite to that of the primary ions, are a necessity for counterion-independent pri-mary ion responses in ionophore-based potentiometric sensors [42].
2.2 Determination of the concentration of charged sites in solvent polymericmembranes
Precise control of the total concentration of intrinsic and added ionic sites in neutral carrier-based ISEmembranes can improve many aspects of electrode performance. The charge sign of either fixed ionic
E. LINDNER AND Y. UMEZAWA
© 2008 IUPAC, Pure and Applied Chemistry 80, 85–104
90
Fig. 1 Dependence of membrane potential change ∆E and the optical SHG response, √I(2—ω)
—, on the concentration
of added lipophilic anionic sites [tetrakis (p-chlorophenyl) borate, TpClPB] (left), and schematic representation ofthe corresponding surface model that shows orientation of SHG-active K+-ionophore complex molecules across theinterface in the presence of the added anionic sites in the membrane phase (right) [41,42]. I: intensity of SHGresponse, ω: angular velocity; bis(benzo-15-crown-5: bis(1,4,7,10,13-benzopentaoxacyclopentadecin-15-ylmethyl)heptanedioate, DCE: 1,2-dichloroethane.
sites or mobile hydrophobic ion sites determines whether a membrane is permselective for cations oranions of the sample. The mole ratio of the ionophore to the intrinsic or added ionic sites in an ion-se-lective membrane can significantly influence the selectivity of ionophore-based electrodes.Consequently, full knowledge of the ionic site “inventory” in an ion-selective membrane may be es-sential when new, uncharacterized polymers or plasticizers are used for ISE fabrication. Accurate ionicsite control, however, requires a simple method for the determination of ionic sites in solvent polymericmembranes and membrane components. Unfortunately, most of these methods are quite cumbersomeand cannot be easily adapted for screening the ionic site concentration in novel membrane matrices andplasticizers [43–48]. More recently, a simple spectrophotometric method was developed for the fast andaccurate determination of ionic site concentrations (covalently attached functionalized groups and/orionic impurities) in plasticized polymeric membranes and membrane plasticizers [49]. The method isbased on the determination of the degree of protonation of hydrogen ion-selective chromoionophoresincorporated into these membranes or dissolved in the membrane plasticizers. In electroneutral mem-branes, the positively charged protonated chromoionophore concentration is equal to the total concen-tration of negative sites [49], i.e., the quantitative measurement of the protonated chromoionophore con-centration in membranes and membrane plasticizers provides the concentration of negatively chargedions in the same matrices. The method was applied to the determination of ionic sites (both positivelyand negatively charged) in PVC materials (different purity grade, and bearing various functionalgroups), polyurethanes (aliphatic, aromatic, and polycarbonate-based), and selected plasticizers[2-nitrophenyl octyl ether and bis(2-ethylhexyl)decanedioate]. The simplicity of the method qualifies itfor fast quality control or fast screening of optically transparent existing and new membrane materials.However, if dyes susceptible to photochemically initiated decomposition are used as “indicator” mole-cules in these experiments, it is essential to know the influence of such decomposition on the precisionand accuracy of the determination of the ionic site concentrations.
2.3 Changes in the membrane composition through leaching and decomposition
In vivo measurements require small sensor sizes. Small ion sensors are delicate devices with fragile (afew µm thick) membranes which contain only a few nanograms of active components. Delamination orperforation of the membrane results in complete loss of the sensor functions. However, in addition tocatastrophic failure of an ion sensor, the gradual deteroriation of its analytical performance due to thedissolution of the membrane components into the sample as function of time is also a serious concern.Since the regular and precise calibration of implanted ion sensors is not feasible, evaluation of changesin the analytical performance of permanently implanted ion sensors (i.e., the determination of factorslimiting the lifetime of miniaturized ISEs) is a critical issue. The lifetime of a potentiometric sensor wasdefined as “the time interval between the conditioning of the membrane and the moment when at leastone parameter of the functionality characteristics of the device changes detrimentally” [50]. When plas-ticized polymeric membrane ISEs are exposed to aqueous samples, the equilibrium partitioning of ionsat the sample/membrane interface leads to a phase boundary potential. However, together with the sam-ple ions, all membrane components (ionophore, plasticizer, salt additives) partition between the mem-brane and solution phases. For neutral carrier-based membrane sensors, Oesch and Simon [32] showedthat the leaching of the ionophore from the membrane results in a loss of sensitivity and selectivity,thereby limiting the lifetime. The loss of selectivity is related to the change in the optimal ionophore-to-ionic site (fixed or mobile) ratio [51–53], but it is also accompanied by increased membrane resist-ance, worse detection limit, increased noise, and possibility of initiation of inflammatory responses invivo [54], etc.
Besides leaching, decomposition of the ionophore and the charged-site additives can change theoptimized composition of an ISE or optical sensor (optode) membrane [31,55–57]. Ratio changes in theconcentration of ionophores to that of charged sites have been documented as a consequence of the de-composition of certain tetraphenylborate derivatives [56,57], which are widely used as ionic additives
© 2008 IUPAC, Pure and Applied Chemistry 80, 85–104
Macro- and microfabricated ion-selective electrodes 91
in ion-selective membranes. Derivatives of phenoxazine dyes, e.g., 9-(diethylamino)-5-octa-decanoylimino-5H-benzo[a]phenoxazine) (ETH 5294), serve as pH-sensitive ionophores both inpotentiometric and optical sensors. The decay in the concentration of the protonated ionophore has beenlinked to the photochemically initiated, singlet oxygen-mediated decomposition of the ionophore [30].The rate of decomposition depends on the wavelength of the incident light and the structure of thephenoxazine derivative. No decomposition was detected with ETH 2439 {9-dimethylamino-5-[4-(16-butyl-2,14-dioxo-3,15-dioxaeicosyl)phenylimino]benzo[a]phenoxazine}, and the rate of decompositionwas negligible with ETH 5350 {9-diethylamino-5-[(2-octyldecyl)imino]benzo[a]phenoxazine}.However, the rate of decomposition of ETH 5294 was facilitated in the presence of tetraphenylborate(TPB–), and tetrakis(4-chlorophenyl) borate (TpClPB–) anions, but no photochemically initiated de-composition of ETH 5294 was detected in the membranes loaded with tetrakis[3,5-bis(trifluoromethyl)phenyl] borate (TFPB–) anion. Thus, the use of TFPB– salts is encouraged to control the ionic site con-centration in ISE membranes which are more stable and more lipophilic than TPB– or TpClPB–
[30,56,57].The decomposition rate of phenoxazine derivatives in the membrane is also facilitated by anions
in the sample solution (e.g., Br–, I–, and Cl–) as they partition into the membrane by salt co-extraction.Consequently, when ETH 5294 is used for the indirect determination of the site concentration of poly-meric membranes and membrane plasticizers [49], HNO3 or H2SO4 has to be used to protonate theionophore to avoid difficulties in interpreting the data due to the decomposition of the protonated formof the chromoionophore.
2.3.1 Determination of the ionophore/site concentration in ion-selective membranesChanges in the concentration of membrane “components” due to their leaching or decomposition areparticularly significant when microfabricated electrodes and microsphere optodes are exposed to largevolumes of sample or used in long-term in vivo applications, because the total amounts of componentsare extremely small in these sensing devices [14,28,58,59]. For example, the amount of ionophore in a5-µm thick, 50-µm diameter disc-shaped membrane cast over a planar sensor surface is only about0.2 ng. In case of an average molecular weight of 1000 Da, the amount of ionophore is about 0.1 to0.2 pmol. To identify electrode failures related to loss of membrane components and/or to estimate theresidual lifetime of a sensor in use, the ionophore concentration in the membrane should be followedas a function of time. A simple chronoamperometric method, based on a single transient measurement,provides both the free ionophore and the ionic site concentration in a solvent polymeric membrane withabout 8–10 % accuracy if the experimental conditions, such as the geometric parameters of the sensingmembrane, the diffusion coefficient of the ionophore, and the mobile ionic sites in membrane matrixare known [28,29]. The diffusion coefficients of the different ionophores and ionic sites in plasticizedmembranes of the common membrane composition with 2:1 plasticizer-to-PVC ratio are fairly similar(≈2 × 10⁻⁸ cm2/s [60] and ≈3 × 10⁻⁹ cm2/s [61]), which can provide an approximate value for the eval-uation. However, if the required parameters for the determination of absolute concentration are notknown, a relative measurement is still possible. It can provide fractional changes in the membrane com-position upon exposure to different samples.
3. DETECTION LIMIT OF ION-SELECTIVE ELECTRODES
In recent years, potentiometry has been extended to trace analysis and has become an alternative tech-nique for replacing stripping voltammetry, atomic absorption spectrometry, and even inductively cou-pled plasma/mass spectrometry (ICP/MS) [8]. Today, optimized ISEs can reach detection limits downto the low parts-per-trillion level in concentrations (10–12 mol L–1) for a number of analytes. The keyto these spectacular improvements has been the reduction of transmembrane ion fluxes contaminatingthe sample solution in the vicinity of the sensing membrane. Since ISEs have a wide dynamic range, inanalytical practice several orders of magnitude difference may exist between the two sides of the sens-
E. LINDNER AND Y. UMEZAWA
© 2008 IUPAC, Pure and Applied Chemistry 80, 85–104
92
ing membrane (sample and IFS). Most commonly, a relatively concentrated solution of the primary ionis used as the IFS (10–2–10–3 mol L–1). Under such conditions, minor ionic fluxes are established be-tween the two sides due to the non-ideal ion- and permselectivity of practical sensor membranes, whichgenerates an elevated primary ion concentration at the sample side of the sensor surface. The effect isnegligible down to 1 µmol L–1 sample concentration, however, it plays a decisive role at the submicro-mol/L concentration level and may cause a large bias in determinations of the detection limits and theselectivity coefficients toward highly discriminated ions.
Using an inner solution that exactly matches the concentration of the sample solution can elimi-nate ion fluxes across ISE membranes. Unfortunately, matching the concentration of the sample is nota realistic alternative for analysis of sample lots with high variability in analyte concentrations.However, for the analysis of highly dilute samples, using highly diluted IFSs is advisable in which theconcentration of interfering ions is also around the mean expected concentration value of the samplelot. Under such conditions, the ion-exchange processes are expected to be similar on both sides of themembrane. Creating a large flux of analyte across the membrane toward the IFS, by selecting exceed-ingly low primary ion activities in the IFS, is also disadvantageous. It depletes sample ions near themembrane and leads to a non-ideal, “super-Nernstian” responses.
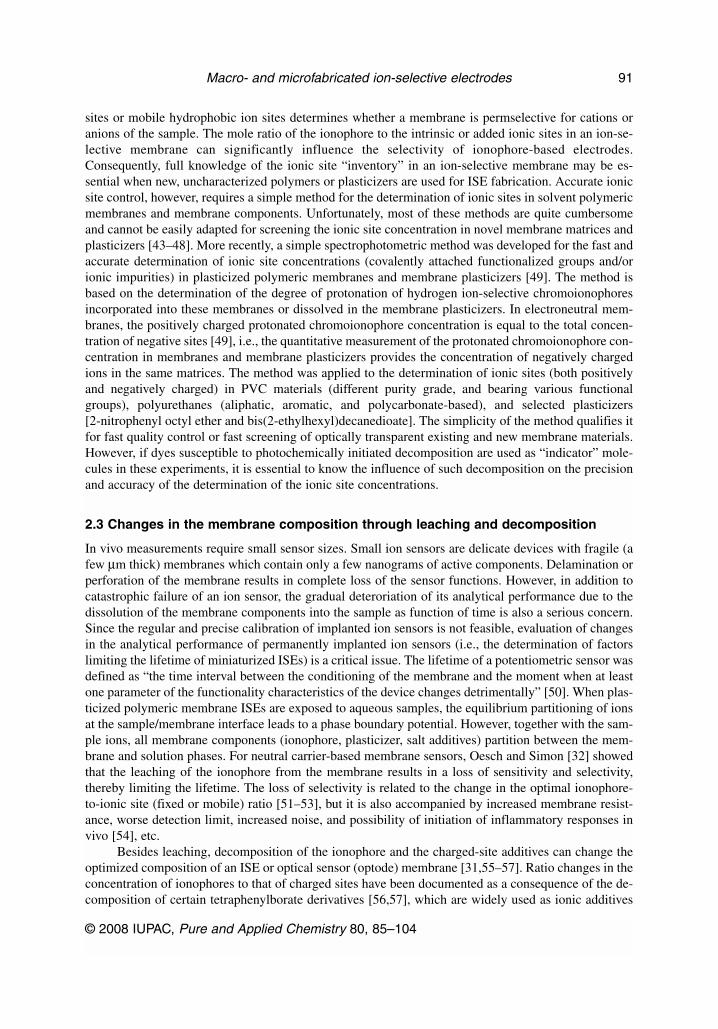
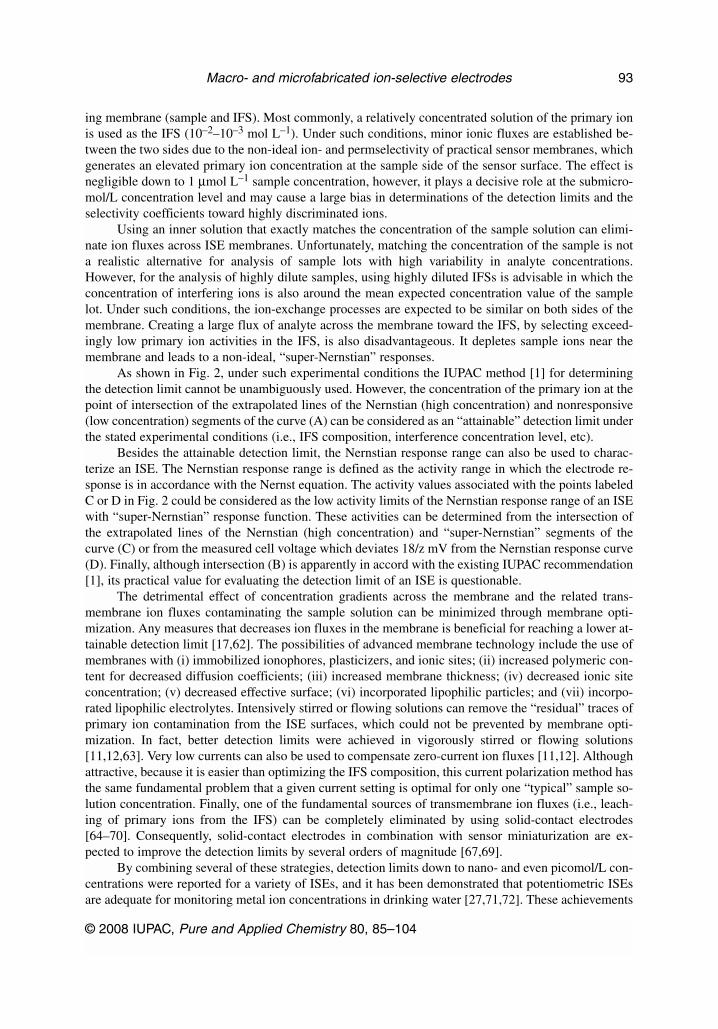
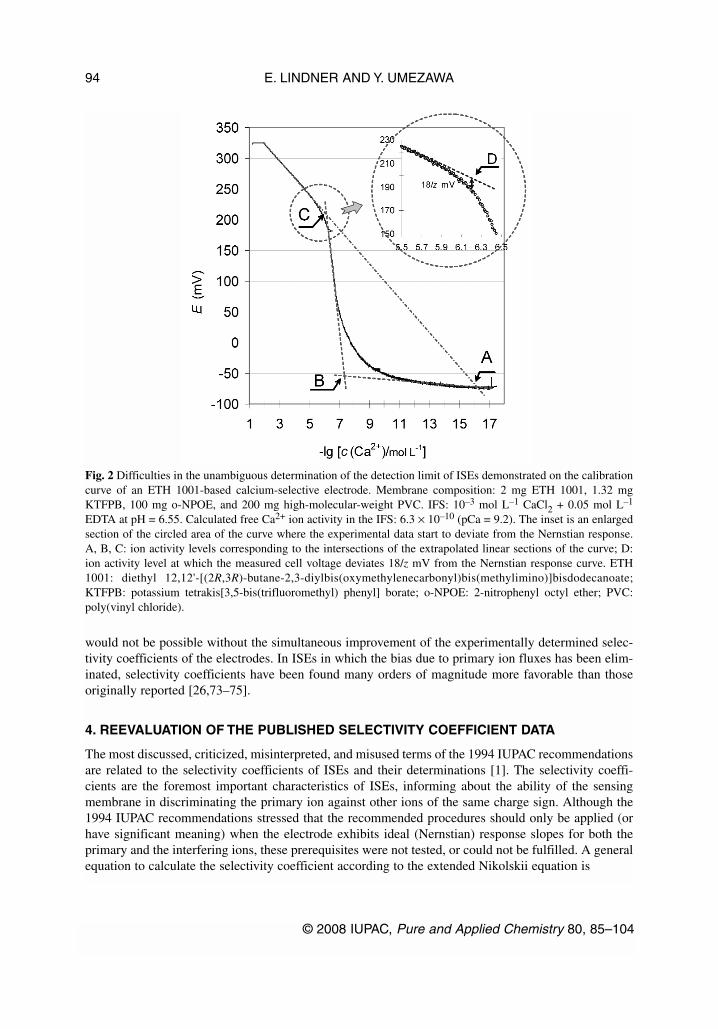
As shown in Fig. 2, under such experimental conditions the IUPAC method [1] for determiningthe detection limit cannot be unambiguously used. However, the concentration of the primary ion at thepoint of intersection of the extrapolated lines of the Nernstian (high concentration) and nonresponsive(low concentration) segments of the curve (A) can be considered as an “attainable” detection limit underthe stated experimental conditions (i.e., IFS composition, interference concentration level, etc).
Besides the attainable detection limit, the Nernstian response range can also be used to charac-terize an ISE. The Nernstian response range is defined as the activity range in which the electrode re-sponse is in accordance with the Nernst equation. The activity values associated with the points labeledC or D in Fig. 2 could be considered as the low activity limits of the Nernstian response range of an ISEwith “super-Nernstian” response function. These activities can be determined from the intersection ofthe extrapolated lines of the Nernstian (high concentration) and “super-Nernstian” segments of thecurve (C) or from the measured cell voltage which deviates 18/z mV from the Nernstian response curve(D). Finally, although intersection (B) is apparently in accord with the existing IUPAC recommendation[1], its practical value for evaluating the detection limit of an ISE is questionable.
The detrimental effect of concentration gradients across the membrane and the related trans-membrane ion fluxes contaminating the sample solution can be minimized through membrane opti-mization. Any measures that decreases ion fluxes in the membrane is beneficial for reaching a lower at-tainable detection limit [17,62]. The possibilities of advanced membrane technology include the use ofmembranes with (i) immobilized ionophores, plasticizers, and ionic sites; (ii) increased polymeric con-tent for decreased diffusion coefficients; (iii) increased membrane thickness; (iv) decreased ionic siteconcentration; (v) decreased effective surface; (vi) incorporated lipophilic particles; and (vii) incorpo-rated lipophilic electrolytes. Intensively stirred or flowing solutions can remove the “residual” traces ofprimary ion contamination from the ISE surfaces, which could not be prevented by membrane opti-mization. In fact, better detection limits were achieved in vigorously stirred or flowing solutions[11,12,63]. Very low currents can also be used to compensate zero-current ion fluxes [11,12]. Althoughattractive, because it is easier than optimizing the IFS composition, this current polarization method hasthe same fundamental problem that a given current setting is optimal for only one “typical” sample so-lution concentration. Finally, one of the fundamental sources of transmembrane ion fluxes (i.e., leach-ing of primary ions from the IFS) can be completely eliminated by using solid-contact electrodes[64–70]. Consequently, solid-contact electrodes in combination with sensor miniaturization are ex-pected to improve the detection limits by several orders of magnitude [67,69].
By combining several of these strategies, detection limits down to nano- and even picomol/L con-centrations were reported for a variety of ISEs, and it has been demonstrated that potentiometric ISEsare adequate for monitoring metal ion concentrations in drinking water [27,71,72]. These achievements
© 2008 IUPAC, Pure and Applied Chemistry 80, 85–104
Macro- and microfabricated ion-selective electrodes 93
would not be possible without the simultaneous improvement of the experimentally determined selec-tivity coefficients of the electrodes. In ISEs in which the bias due to primary ion fluxes has been elim-inated, selectivity coefficients have been found many orders of magnitude more favorable than thoseoriginally reported [26,73–75].
4. REEVALUATION OF THE PUBLISHED SELECTIVITY COEFFICIENT DATA
The most discussed, criticized, misinterpreted, and misused terms of the 1994 IUPAC recommendationsare related to the selectivity coefficients of ISEs and their determinations [1]. The selectivity coeffi-cients are the foremost important characteristics of ISEs, informing about the ability of the sensingmembrane in discriminating the primary ion against other ions of the same charge sign. Although the1994 IUPAC recommendations stressed that the recommended procedures should only be applied (orhave significant meaning) when the electrode exhibits ideal (Nernstian) response slopes for both theprimary and the interfering ions, these prerequisites were not tested, or could not be fulfilled. A generalequation to calculate the selectivity coefficient according to the extended Nikolskii equation is
E. LINDNER AND Y. UMEZAWA
© 2008 IUPAC, Pure and Applied Chemistry 80, 85–104
94
Fig. 2 Difficulties in the unambiguous determination of the detection limit of ISEs demonstrated on the calibrationcurve of an ETH 1001-based calcium-selective electrode. Membrane composition: 2 mg ETH 1001, 1.32 mgKTFPB, 100 mg o-NPOE, and 200 mg high-molecular-weight PVC. IFS: 10–3 mol L–1 CaCl2 + 0.05 mol L–1
EDTA at pH = 6.55. Calculated free Ca2+ ion activity in the IFS: 6.3 × 10⁻¹⁰ (pCa = 9.2). The inset is an enlargedsection of the circled area of the curve where the experimental data start to deviate from the Nernstian response.A, B, C: ion activity levels corresponding to the intersections of the extrapolated linear sections of the curve; D:ion activity level at which the measured cell voltage deviates 18/z mV from the Nernstian response curve. ETH1001: diethyl 12,12'-[(2R,3R)-butane-2,3-diylbis(oxymethylenecarbonyl)bis(methylimino)]bisdodecanoate;KTFPB: potassium tetrakis[3,5-bis(trifluoromethyl) phenyl] borate; o-NPOE: 2-nitrophenyl octyl ether; PVC:poly(vinyl chloride).
(1)
where EI and EJ are the measured membrane potentials for a solution containing only the salt of the pri-mary ion I
zI+ ion or the interfering ion JzJ+
with charges of zI and zJ, respectively. The symbols F, R, andT have their usual meaning.
The selectivity coefficient is a constant parameter for a given electrode if Nernstian responseslopes are observed for both the primary and the interfering ions. This can be illustrated by inserting theNernst equation for the primary and interfering ions (eqs. 2 and 3) into eq. 1
(2)
(3)
(4)
Apparently, the selectivity coefficient for ion-selective sensors with Nernstian slopes for both theprimary and interfering ions can be calculated from the respective Eo values. However, until recently,most ISEs did not show Nernstian response slopes for most of the interfering ions. Indeed, the electrodepotentials in the presence of highly discriminated ions generally did not show any concentration de-pendence because the primary ion concentration leaching out from the membrane controlled the re-sponse, i.e., the reliable determination of the Eo values for the interfering ions were not possible.
Similar to the detection limit, improved selectivity coefficient data could be determined in flow-ing solutions. The improvements could be attributed to the removal of primary ion traces leaching fromthe sensing membrane from the electrode surface. Consequently, these “dynamic” selectivity coefficientvalues were dependent on the experimental conditions (i.e., flow rate, cell geometry, etc.) used for theirdetermination.
Recently, it has been reported that Nernstian, or nearly Nernstian, response slopes can be ob-served even for highly discriminated ions if one of the following three procedures is used:
(1) Perform the measurement in the presence of a complexing agent, complexing only the primaryions but not interacting with the interfering ions [26].
(2) Use membranes for the selectivity coefficient determinations which have never been in contactwith primary ions. Obviously, the lipophilic salt additives incorporated into the membrane and theIFS on the backside of the membrane must also not contain primary ions [74]. The requirementto attain Nernstian response slope for the discriminated ions is that they can fully displace the ionsoriginally present in the membrane. Achieving complete displacement is often very difficult orhardly feasible if the membrane contains the primary ions. In addressing this difficulty the cali-bration procedure should be started in solutions of the most discriminated ion, if it is known,which generates the least interference. Conditioning the electrode membrane in the correspondingdiscriminated ion solutions before measurement is advisable.
(3) Perform the measurement under experimental conditions in which the flux of primary ions is di-rected toward the IFS and the composition of the IFS remains unchanged during the measurement[76]. It can be achieved by using strong chelating agents [77,78] or ion-exchangers [79] in theIFS, which set a very low primary ion concentration in the IFS and preclude the primary ionleaching toward the sample.
© 2008 IUPAC, Pure and Applied Chemistry 80, 85–104
Macro- and microfabricated ion-selective electrodes 95
lgln
lg/
Kz F E E
RT
a
az zI,Jpot I J I I
JI J
=−( )
+
10
E ERT
z FaI I
o
II= + ln
lg10
E ERT
z FaJ J
o
JJ= + ln
lg10
lgln
Kz F
RTE EI,J
pot IJo
Io= −( )10
To emphasize that the measured selectivity coefficients or detection limits are not corrupted byprimary ion contamination due to ion-exchange or co-extraction processes, the attributes “true” [26],“unbiased” [74], and “ultimate” [76,80] are frequently added in front of the selectivity coefficients. Theattribute “ultimate” intends to emphasize that experimental conditions that guarantee the least possibleinterference were used.
The three above-mentioned procedures provide very similar selectivity coefficient values that re-flect the ion-exchange selectivity of the membrane with a thermodynamic meaning. However, the firsttwo methods are somewhat cumbersome and thus not practical. In procedure (1), it is not always pos-sible to find an appropriate buffer system that can be used for a variety of interfering ions. On the otherhand, procedure (2) can be performed only once. After the membrane has been exposed to the most pre-ferred primary ion, the electrode will no longer respond in a Nernstian manner to extremely discrimi-nated ions. This method is therefore inapplicable to electrodes which have been previously used in realsamples or were conditioned overnight in concentrated primary ion solutions, as is often recommended.It is also inadequate for monitoring time-dependent changes in the selectivity coefficients of practicalmembranes. Among the three methods, the last one (3), in which primary ions are drained toward theIFS, appears to be the most generally applicable. However, it must be recognized that the IFSs sug-gested in the literature for probing the practical limits of ISEs are generally prepared with a high con-centration of complexing agent {e.g., 5 × 10⁻² mol L–1 Na2EDTA [disodium dihydrogen (ethane-1,2-diyldinitrilo)tetraacetate]} in a pH-controlled environment in which the interfering ion concentrationlevels may be as high as 0.12 mol L–1. The disadvantage of using high concentrations of interfering ionsin the IFS in experiments aimed for evaluating the “true”, “unbiased”, or “ultimate” selectivity coeffi-cients is related to the induced transport of the highly discriminated ions towards the sample.
Most recently, an original method has been proposed for the determination of the ultimate spanISEs [76,80]. The span of an ISE has been defined by IUPAC as the potential difference between theupper and lower detection limits of the electrode [1]. Once the span is known, the ultimately attainabledetection limit of the ISE can be calculated by using its theoretical response slope. If the concept ofspan measurement is extended to interfering ions, it is suitable for the determination of the ultimate se-lectivity coefficients. The span measurement in combination with subsequent exponential dilution pro-vides the response slopes for both the primary and the interfering ions, which can be utilized for calcu-lating the selectivity coefficients and to confirm the detection limit. Although this comprehensive “spanmethod” (the simultaneous measurement of the ultimate detection limit, the selectivity coefficients incombination with the response slopes for the different ions) is very promising for characterizing ISE re-sponses, the method must be tested for a variety of ionophores (e.g., with low ion-ionophore stabilityconstants and in the presence of ions with large hydration energies) before it can be recommended as ageneral procedure. Obviously, this note is related to the attainment of the Nernstian behavior [5,81].
5. MEASUREMENT PROTOCOLS FOR OPTIMAL ION-SELECTIVE ELECTRODEPERFORMANCE
In contrast to the latest IUPAC document on the “Measurement of pH” [82], the previous IUPAC rec-ommendations [1,2] on ISEs do not provide detailed protocols for the determination of the analyticalcharacteristics and performance of ISEs and do not contain information on the uncertainties of the de-terminations. In spite of these limitations, the recommendations were acceptable because small differ-ences in the widely accepted practices hardly modified the measured values. However, the advancementin the theory and practice of ISEs since the publication of the last IUPAC recommendations providesample evidence that changing the commonly used protocols and practices can lead to orders of magni-tude improvements in the selectivity coefficients and the detection limits of ISEs. Some of these newpractices were discussed in Sections 3 and 4. In addition, the protocols that proved to be adequate forconventional macroelectrodes with large volume of IFS are not always adequate in testing micro-fabricated planar sensors, due to differences in their construction.
E. LINDNER AND Y. UMEZAWA
© 2008 IUPAC, Pure and Applied Chemistry 80, 85–104
96

5.1 Planar microfabricated electrodes
Microfabricated potentiometric sensors are planar versions of the conventional macroelectrodes (i.e.,parallel to the dramatic reduction in size), the general three-dimensional electrode structures are com-pressed into two-dimensional, multilayered arrangements. The first flat-form, plastic membrane,potentiometric electrodes were manufactured in the early 1970s (Eastman Kodak [83]).Microfabrication technologies have entered the field of ion sensors with the implementation of ion-se-lective field effect transistors [84,85]. These planar, sensor structures can be manufactured cost-effec-tively in large numbers by thin- and thick-film microfabrication technologies through depositing (cast-ing, spin coating, electropolymerizing, printing, etc.) and patterning multiple membrane layers oversolid surfaces. The technology for these so-called “all solid-state” electrodes projected numerous ad-vantages in design (smaller sizes, thus smaller sample volumes), sensor handling (maintenance free),and applications (long-term in vivo monitoring) [14,86,87]. Due to their low cost and small size, micro-fabricated ISEs are often aimed for the measurements of a few microliters of samples (e.g., wholeblood, serum, plasma, urine, or saliva) in single-use cartridges [13]. They have also been tested forshort-term in vivo measurements or closed-loop monitoring of ion activities in biological samples[14,87,88].
Sensors aimed for in vivo or closed loop measurements should be sterilizable, biocompatible, andpresent excellent stability in the time frame of the measurements (e.g., up to several hours to monitorthe status of a patient during treatment). In addition, the sensors are expected to have optimal perform-ance characteristics without conditioning and to provide accurate and reproducible results without orwith minimal calibration. If microfabrication can provide identical sensors, the calibration of a limitednumber of sensors from a batch (wafer) should be adequate to characterize the response function of thewhole batch (wafer). These requirements are much more demanding than the requisites for ion sensorsincorporated into blood electrolyte analyzers, in which repeated multipoint calibration protocols arecommon.
Unfortunately, dramatic miniaturization may lead to undesirable consequences. Planar sensorsprepared like “coated wire” electrodes (with an ion-selective membrane cast directly over an electron-ically conducting metal/semiconductor surface, e.g., Pt, Au, a conductive polymer, or the gate area of afield effect transistor [89,90]), without IFS or with extremely small IFS volume, were very sensitive totransmembrane fluxes (e.g., H2O, CO2, O2, etc). They required longer equilibration (conditioning) time[67,88] and were characterized by drifting potentials and modest repeatibility. The majority of the prob-lems experienced with these “all solid-state” microelectrodes were related to the mismatch (“blocked”interfaces) between ion-conducting (IS membrane) and electronically conducting phases (substrateelectrode) in which the charge carriers cannot pass from one phase into the other [86].
To form reversible interfaces and to adapt the classical inner reference electrode to the planarISEs, the IFSs of large volume were replaced by small-volume chambers filled with layers of hydro-gel integrated into the planar structures. Although the incorporation of “liquid reservoirs” into a sen-sor structure using thin film microfabrication technologies is difficult, planar potassium and hydrogenISEs fabricated [14,88] with these hydrogel layers provided potential stabilities in the order of 0.1mV/h and were used successfully for in vivo monitoring of ion concentration changes [91].Unfortunately, the benefits of these hydrogel film-based sensors quickly faded away with decreasingsensor sizes (hydrogel volumes). Long-term drifts were experienced in solutions with high concentra-tion of interfering ions and when the concentrations of osmotically active species were fluctuating inthe sample solution [92].
To guarantee high potential stability at the interface of the membrane and its solid-contact, filmswith both ionic and electronic transduction are layered between the ion conducting membrane and theelectronically conducting metal [93]. Inherently conducting polymers (CPs), such as polypyrrole (PPy)[64,66,68,94], polyaniline [95,96], poly(3-octylthiophene) [97], and poly(3,4-ethylenedioxythiophene)[98,99] and redox-active self-assembled monolayers [100] have been tested. Although, ISEs without
© 2008 IUPAC, Pure and Applied Chemistry 80, 85–104
Macro- and microfabricated ion-selective electrodes 97
IFS have inherent advantages (e.g., to eliminate one major source of transmembrane ion fluxes), it isstill challenging to fabricate solid-contact planar microelectrodes, which meet the stability and repro-ducibility requirements of blood electrolyte analysis. The potential stability of CP-based planar sensorsis often determined by spontaneous changes in the composition of the CP film after preparation. An ad-ditional source of potential instabilities is the spontaneous formation of a water film between the CPfilm and the IS membrane [101]. If this happens, the solid-contact electrodes behave similarly to planarelectrodes fabricated with IFS of extremely small volume (hydrogel layer), i.e., the sensor becomes sen-sitive to transmembrane transport of water, CO2 or O2 [92].
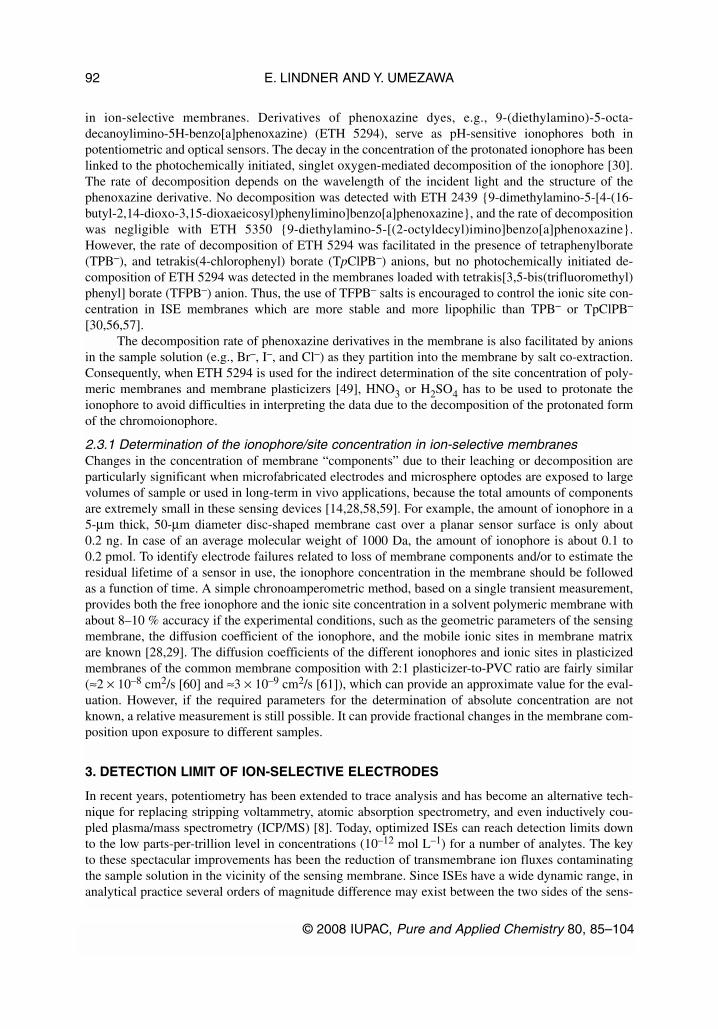
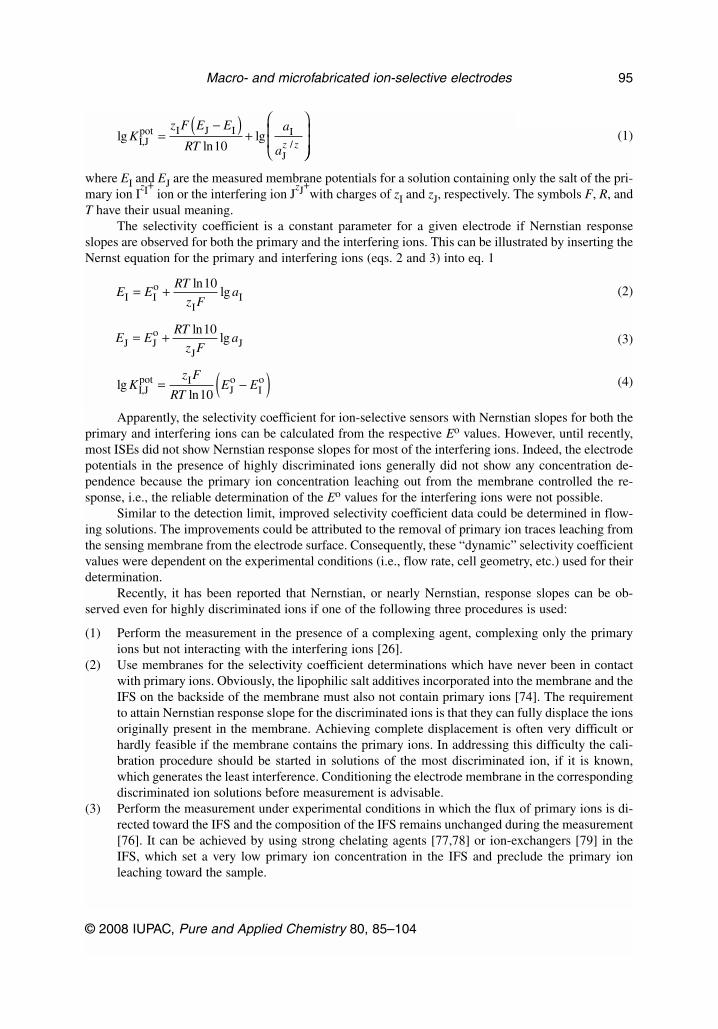
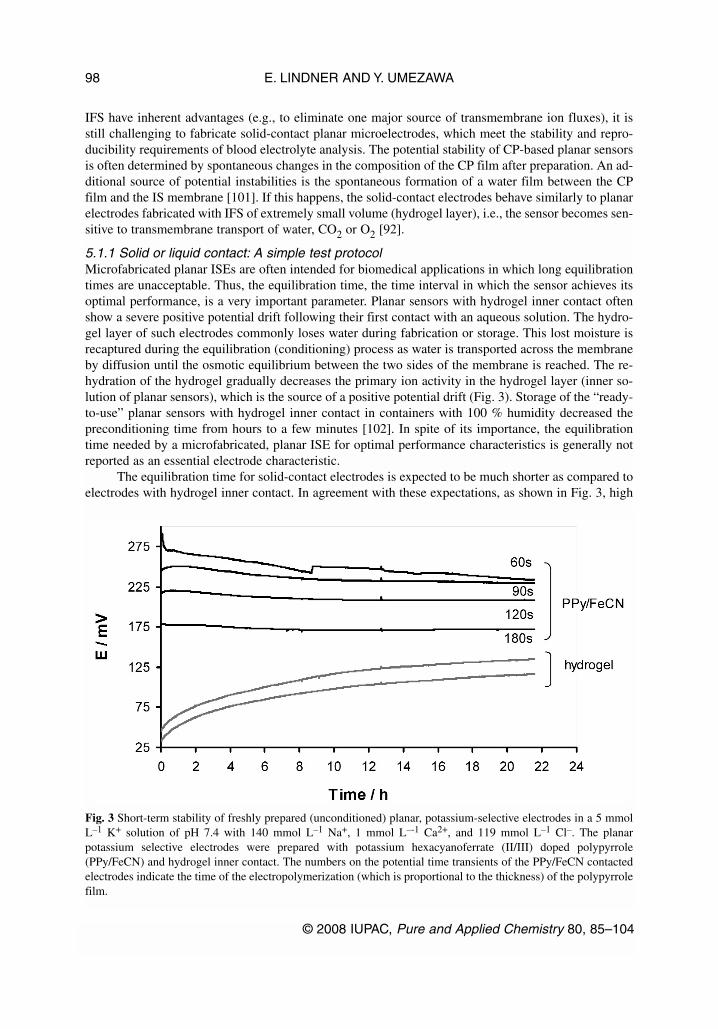
5.1.1 Solid or liquid contact: A simple test protocol Microfabricated planar ISEs are often intended for biomedical applications in which long equilibrationtimes are unacceptable. Thus, the equilibration time, the time interval in which the sensor achieves itsoptimal performance, is a very important parameter. Planar sensors with hydrogel inner contact oftenshow a severe positive potential drift following their first contact with an aqueous solution. The hydro-gel layer of such electrodes commonly loses water during fabrication or storage. This lost moisture isrecaptured during the equilibration (conditioning) process as water is transported across the membraneby diffusion until the osmotic equilibrium between the two sides of the membrane is reached. The re-hydration of the hydrogel gradually decreases the primary ion activity in the hydrogel layer (inner so-lution of planar sensors), which is the source of a positive potential drift (Fig. 3). Storage of the “ready-to-use” planar sensors with hydrogel inner contact in containers with 100 % humidity decreased thepreconditioning time from hours to a few minutes [102]. In spite of its importance, the equilibrationtime needed by a microfabricated, planar ISE for optimal performance characteristics is generally notreported as an essential electrode characteristic.
The equilibration time for solid-contact electrodes is expected to be much shorter as compared toelectrodes with hydrogel inner contact. In agreement with these expectations, as shown in Fig. 3, high
E. LINDNER AND Y. UMEZAWA
© 2008 IUPAC, Pure and Applied Chemistry 80, 85–104
98
Fig. 3 Short-term stability of freshly prepared (unconditioned) planar, potassium-selective electrodes in a 5 mmolL–1 K+ solution of pH 7.4 with 140 mmol L–1 Na+, 1 mmol L–-1 Ca2+, and 119 mmol L–1 Cl–. The planarpotassium selective electrodes were prepared with potassium hexacyanoferrate (II/III) doped polypyrrole(PPy/FeCN) and hydrogel inner contact. The numbers on the potential time transients of the PPy/FeCN contactedelectrodes indicate the time of the electropolymerization (which is proportional to the thickness) of the polypyrrolefilm.
potential stability (≤0.2 mV/h drift) has been achieved more quickly with microfabricated planar sen-sors using an appropriate solid contact [67]. But, apparently the equilibration time can be influenced bythe characteristics of the solid-contact film. Consequently, in reporting on novel planar sensors, it is rec-ommended that the electrode potential be continuously monitored during the first equilibration time.With cation-selective planar electrodes, a slow, asymptotic, positive drift during the conditioning periodindicates the water uptake of the inner layer on the back of the sensing membrane (i.e., the formationof a thin aqueous layer between the inner reference element and the polymeric membrane).Unfortunately, this can happen with any “solid-contact” device. If a thin aqueous layer is formed be-tween the “solid-contact” and the polymeric membrane, all or most of the claimed advantages of a“solid-contact” or “all solid-state” [64] design are lost and the sensor should not be considered to be a“solid-contact” device.
Since formation of a thin aqueous layer behind the sensing membrane could be the main sourceof potential instabilities, testing all new planar ISEs for the presence of such aqueous layers is consid-ered essential and recommended [101]. It is known that adhesion strength between the sensing mem-brane and its solid support deteriorates gradually over time after the membrane has been exposed toaqueous solutions. The adhesion strength of a fully hydrated membrane is only a fraction of that whichcan be determined in dry state [88]. Accordingly, the test providing information on aqueous layer for-mation between the sensing membrane and its solid support should be repeated periodically in the timeframe of the expected lifetime of the planar sensor.
The test is very simple. The protocol is basically the same as that used for evaluating the selec-tivity coefficient of an ISE for a particular ion with the SSM. The planar sensor is sequentially exposedto a concentrated solution of the primary ion (e.g., c = 0.1 mol L–1), the interfering ion, and again theprimary ion. Following each exposure, the electrode potential is continuously recorded. The only im-portant difference compared to a “common” selectivity coefficient determination is the time frame ofthe experiment. Depending on the thickness of the sensing membrane, the electrode potential has to berecorded for 6 to 24 h.
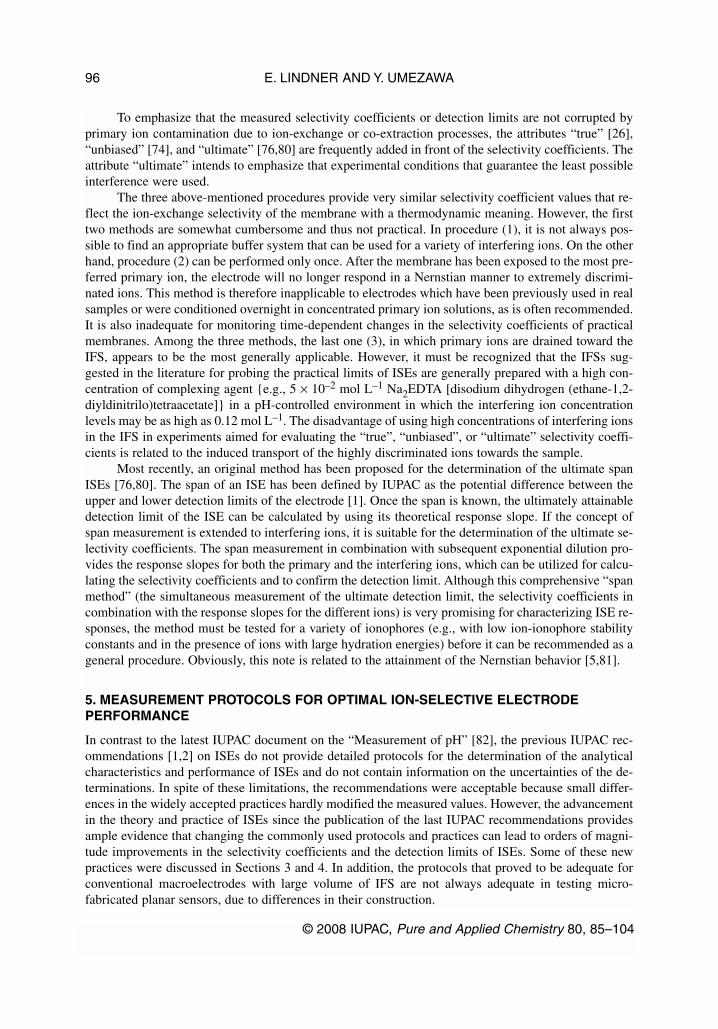
As shown in Fig. 4, planar sensors with solid (upper curve) or liquid (hydrogel layer) contact be-have completely differently in this test [101]. Replacement of the primary ion I+ by a less preferred in-terfering ion J+ provides a large positive drift after the expected instantaneous drop in the measured po-tential with planar sensors fabricated with a liquid contact. The magnitude of the instantaneous drop inpotential depends on the selectivity coefficient of the membrane. Similar transients are experienced with“solid-contact” sensors in which an undesirable water film formed between the solid internal contactand the sensing membrane. However, no such behavior is experienced with “real” solid-contact elec-trodes. The transient response of liquid contact planar sensors (i.e., the apparent loss of ion selectivityof the sensing membrane) can be unambiguously interpreted by the phase boundary potential model[101]. The transient response arises from minute transport of interfering ions into the aqueous film be-hind the membrane and to the related significant change in its composition. The subsequent replace-ment of the interfering ion (J+) by the primary ion (I+) generates a similar potential transient of oppo-site sign. However, the drift toward negative potentials is much smaller.
Efforts to provide high-stability “real” solid-contact or “all solid-state” electrodes (without aque-ous layer formation) were successful when redox-active, highly lipophilic self-assembling monolayers[103] or overoxidized polypyrrole films [66,69] were layered between potassium- or lead-selectivemembranes and gold or platinum inner contacts. However, with polypyrrole inner contacts, the quanti-tative removal of salts from the polypyrrole film by extensive washing was essential for success. Evensmall traces of water-soluble salt in an inherently conducting film can contribute to aqueous film for-mation as it drives water across the membrane to meet osmotic equilibrium on the two sides of the mem-brane.
© 2008 IUPAC, Pure and Applied Chemistry 80, 85–104
Macro- and microfabricated ion-selective electrodes 99

6. ANALYTICAL CALIBRATION CURVES (CALIBRATION PLOTS) FOR pH AND OTHERION-SELECTIVE ELECTRODES
In IUPAC’s Compendium of Analytical Nomenclature [15] (Section 10.3.3.2), the relation between ameasured quantity x and the concentration c is called the analytical function. A graphical plot of the an-alytical function, whatever the coordinate axes used, is called the analytical curve. The measured quan-tity expressed as function of c [i.e., x = g(c)] is termed as analytical calibration function while the graphscorresponding to these functions are called analytical calibration curves. In Section 8.3.2.1, the analyt-ical calibration curves of an ISE are denoted as calibration plots and the recommended procedure forpresenting an ISE calibration plot is given as: “For uniformity, it is recommended that the cell emf isascribed to the ordinate (vertical axis) with more positive potentials at the top of the graph and that paA(-log activity of the species measured, A) or pcA (-log amount concentration of the measured speciesmeasured, A) is ascribed on the abscissa (horizontal axis) with increasing activity to the right”.However, in Chapter 8.4. of the recently accepted IUPAC recommendation on the “Measurement of pH”[82], the calibration plot of a hydrogen ion-responsive electrode is plotted with decreasing H+ ion ac-tivity (increasing pH) to the right. To have different recommendations for the H+ ion-selective and allother ISEs cannot be justified although both recommendations are based on widely accepted practices.To have unified presentation of the calibration plots of all ISEs, it is recommended that the paA or pcAvalues be plotted on the horizontal axis with increasing paA or pcA values to the right.
7. SYMBOLS AND ACRONYMS
7.1 List of symbols
aI and aJ activity of the primary ion I and interfering ion J, respectivelyEo, Eo
I, and EoJ constant potential terms in the Nernst equation
E. LINDNER AND Y. UMEZAWA
© 2008 IUPAC, Pure and Applied Chemistry 80, 85–104
100
Fig. 4 Response of a solid-contacted K+-selective electrode with (top) and without (bottom) an aqueous filmbetween the sensing membrane and its solid contact. At time t = 0, the conditioning solution (0.1 mol L–1 KCl) wasexchanged for 0.1 mol L–1 NaCl. At t = 3.5 h, the sample was replaced by the conditioning solution [Reproducedwith permission from M. Fibbioli, W. E. Morf, M. Badertscher, N. F. de Rooij, E. Pretsch. Electroanalysis 12, 1286(2000)].
EI and EJ electrode potential in solution of the a primary ion I or interfering ion solution J∆E potential differenceF Faraday constantI intensity of SHG responseKpot
I, J potentiometric selectivity coefficientR universal gas constantT thermodynamic temperaturezI and zJ charge of the primary ion I and interfering ion Jω angular velocity
7.2 List of acronyms
DCE 1,2-dichloroethaneETH 1001 diethyl N,N'-[(4R,5R)-4,5-dimethyl-1,8-dioxo-3,6-dioxaoctamethylene]-bis(12-
methylamino-dodecanoate)ETH 2439 9-dimethylamino-5-[4-(16-butyl-2,14-dioxo-3,15-dioxaeicosyl)phenylimino-
[a]phenoxazineETH 5294 9-(diethylamino)-5-octadecanoylimino-5H-benzo[a]phenoxazine)ETH 5350 9-(diethylamino)-5-[(2-octyldecyl)imino]benzo[a]phenoxazineFeCN potassium hexacyanoferrate II/IIIICP/MS inductively coupled plasma/mass spectrometryISE ion-selective electrodeIUPAC International Union of Pure and Applied ChemistryKTFPB potassium tetrakis[3,5-bis(trifluoromethyl) phenyl] borateNa2EDTA disodium ethylenediaminetetraacetatePPy polypyrroleo-NPOE 2-nitrophenyl octyl etherPVC poly(vinyl chloride)SHG second harmonic generationSSM separate solution methodTPB– tetraphenylborate anionTpClPB– tetrakis(4-chlorophenyl) borate anion TFPB– tetrakis[3,5-bis(trifluoromethyl) phenyl] borate anion
8. REFERENCES
1. R. P. Buck, E. Lindner. Pure Appl. Chem. 66, 2527 (1994).2. G. G. Guilbault, R. A. Durst, M. S. Frant, H. Freiser, E. H. Hansen, T. S. Light, E. Pungor,
G. Rechnitz, N. M. Rice, T. J. Rohm, W. Simon, J. D. R. Thomas. Pure Appl. Chem. 48, 127(1976).
3. E. Pungor, K. Tóth, A. Hrabeczy-Pall. Pure Appl. Chem. 51, 1913 (1979).4. Y. Umezawa, P. Buhlman, K. Umezawa, N. Hamada. Pure Appl. Chem. 74, 995 (2002).5. Y. Umezawa, P. Buhlmann, K. Umezawa, K. Tohda, S. Amemiya. Pure Appl. Chem. 72, 1851
(2000).6. Y. Umezawa, K. Umezawa, P. Buhlman, N. Hamada, H. Aoki, J. Nakanishi, M. Sato, K. P. Xiao,
Y. Nishimura. Pure Appl. Chem. 74, 923 (2002).7. E. Lindner, K. Tóth, E. Pungor. Pure Appl. Chem. 58, 469 (1986).8. E. Bakker, E. Pretsch. Anal. Chem. 74, 420A (2002).9. E. Bakker, P. Buhlmann, E. Pretsch. Talanta 63, 3 (2004).
10. T. Sokalski, A. Ceresa, T. Zwickl, E. Pretsch. J. Am. Chem. Soc. 119, 11347 (1997).
© 2008 IUPAC, Pure and Applied Chemistry 80, 85–104
Macro- and microfabricated ion-selective electrodes 101
11. E. Lindner, R. E. Gyurcsanyi, R. P. Buck. Electroanalysis 11, 695 (1999).12. E. Pergel, R. E. Gyurcsányi, K. Tóth, E. Lindner. Anal. Chem. 73, 4249 (2001).13. I. R. Lauks. Acc. Chem. Res. 37, 317 (1998).14. E. Lindner, R. P. Buck. Anal. Chem. 72, 336A (2000).15. J. Inczedy, T. Lengyel, A. M. Ure. Compendium of Analytical Nomenclature (Definitive Rules
1997), 3rd ed., Blackwell Science, Oxford (1998).16. S. Mathison, E. Bakker. Anal. Chem. 70, 303 (1998).17. A. Ceresa, T. Sokalski, E. Pretsch. J. Electroanal. Chem. 501, 70 (2001).18. K. N. Mikhelson, J. Bobacka, A. Lewenstam, A. Ivaska. Electroanalysis 13, 876 (2001).19. E. H. Hansen, J. Ruzicka. Anal. Chim. Acta 72, 365 (1974).20. A. Craggs, G. J. Moody, J. D. R. Thomas. Analyst 104, 961 (1979).21. J. Ruzicka, E. H. Hansen, J. C. Tjell. Anal. Chim. Acta 67, 155 (1973).22. E. G. Harsanyi, K. Tóth, E. Pungor. Anal. Chim. Acta 161, 333 (1984).23. E. G. Harsányi, K. Tóth, E. Pungor, Y. Umezawa, S. Fujiwara. Talanta 31, 579 (1984).24. J. R. Ruzicka, E. H. Hansen, J. C. Tjell. Anal. Chim. Acta 67, 155 (1973).25. U. Schefer, D. Ammann, E. Pretsch, U. Oesch, W. Simon. Anal. Chem. 58, 2282 (1986).26. T. Sokalski, M. Maj-Zurawska, A. Hulanicki. Microchim. Acta 1, 285 (1991).27. E. Bakker, P. Buhlmann, E. Pretsch. Electroanalysis 11, 915 (1999).28. B. D. Pendley, R. E. Gyurcsányi, R. P. Buck, E. Lindner. Anal. Chem. 73, 4599 (2001).29. B. D. Pendley, E. Lindner. Anal. Chem. 71, 3673 (1999).30. J. Langmaier, E. Lindner. Anal. Chim. Acta 543, 156 (2005).31. M. Telting-Diaz, E. Bakker. Anal. Chem. 73, 5582 (2001).32. U. Oesch, W. Simon. Anal. Chem. 52, 692 (1980).33. W. E. Morf, G. Kahr, W. Simon. Anal. Lett. 7, 9 (1974).34. M. Perrey, E. Löbel, R. Bloch. J. Membr. Sci. 1, 223 (1976).35. A. van den Berg, P. van der Wal, D. Ptasinski, E. J. R. Sudhölter, P. Bergveld, D. N. Reinhoudt.
Anal. Chem. 59, 2827 (1987).36. D. Ammann, E. Pretsch, W. Simon, E. Lindner, A. Bezegh, E. Pungor. Anal. Chim. Acta 171, 119
(1985).37. J. H. Boles, R. P. Buck. Anal. Chem. 45, 2057 (1973).38. W. E. Morf. The Principles of Ion-selective Electrodes and of Membrane Transport, Akademiai
Kiado, Budapest (1981).39. M. Huser, P. M. Gehrig, W. E. Morf, W. Simon, E. Lindner, J. Jeney, K. Tóth, E. Pungor. Anal.
Chem. 63, 1380 (1991).40. P. Bühlmann, S. Yajima, K. Tohda, K. Umezawa, S. Nishizawa, Y. Umezawa. Electroanalysis 7,
811 (1995).41. K. Tohda, Y. Umezawa, S. Yoshiyagawa, S. Hashimoto, M. Kawasaki. Anal. Chem. 67, 570
(1995).42. S. Yajima, K. Tohda, P. Buhlmann, Y. Umezawa. Anal. Chem. 69, 1919 (1997).43. R. P. Buck, K. Tóth, E. Graf, G. Horvai, E. Pungor. J. Electroanal. Chem. 223, 51 (1987).44. V. V. Cosofret, M. Erdosy, J. S. Raleigh, T. A. Johnson, M. R. Neuman, R. P. Buck. Talanta 43,
143 (1996).45. G. Horvai, E. Graf, K. Toth, E. Pungor, R. P. Buck. Anal. Chem. 58, 2735 (1986).46. E. Lindner, E. Gráf, Z. Niegreisz, K. Tóth, E. Pungor, R. P. Buck. Anal. Chem. 60, 295 (1988).47. S. C. Ma, N. A. Chaniotakis, M. E. Meyerhoff. Anal. Chem. 2293 (1988).48. M. Nägele, E. Pretsch. Microchim. Acta 121, 269 (1995).49. R. E. Gyurcsanyi, E. Lindner. Anal. Chem. 74, 4060 (2002).50. O. Dinten, U. E. Spichiger, N. Chaniotakis, P. Gehrig, B. Rusterholz, M. W. E. Simon. Anal.
Chem. 63, 596 (1991).51. E. Bakker, A. Xu, E. Pretsch. Anal. Chim. Acta 295, 253 (1994).
E. LINDNER AND Y. UMEZAWA
© 2008 IUPAC, Pure and Applied Chemistry 80, 85–104
102
52. R. Eugster, P. M. Gehrig, W. E. Morf, U. E. Spichiger, W. Simon. Anal. Chem. 63, 2285 (1991).53. P. C. Meier, W. E. Morf, M. Läubli, W. Simon. Anal. Chim. Acta 156, 1 (1984).54. E. Lindner, V. V. Cosofret, S. Ufer, R. P. Buck, W. J. Kao, M. R. Neuman, J. M. Anderson. J.
Biomed. Mater. Res. 28, 591 (1994).55. E. Bakker, M. Lerchi, T. Rosatzin, B. Rusterholz, W. Simon. Anal. Chim. Acta 278, 211 (1993).56. S. Peper, M. Telting-Diaz, P. Almond, T. Albrecht-Schmitt, E. Bakker. Anal. Chem. 74, 1327
(2002).57. T. Rosatzin, E. Bakker, K. Suzuki, W. Simon. Anal. Chim. Acta 280, 197 (1993).58. M. Telting-Diaz, E. Bakker. Anal. Chem. 74, 5251 (2002).59. I. Tsagkatakis, S. Peper, R. Retter, M. Bell, E. Bakker. Anal. Chem. 73, 6083 (2001).60. I. Moczar, R. E. Gyurcsanyi, P. Huszthy, G. Jagerszki, K. Tóth, E. Lindner. Electroanalysis 18,
1396 (2006).61. R. D. Armstrong, G. Horvai. Electrochim. Acta 35, 1 (1990).62. T. Zwickl, T. Sokalski, E. Pretsch. Electroanalysis 11, 673 (1999).63. K. Toth, K. Stulik, W. Kutner, Z. Feher, E. Lindner. Pure Appl. Chem. 76, 1119 (2004).64. A. Cadogan, Z. Q. Gao, A. Lewenstam, A. Ivaska, D. Diamond. Anal. Chem. 64, 2496 (1992).65. K. Y. Chumbimuni-Torres, N. Rubinova, A. Radu, L. T. Kubota, E. Bakker. Anal. Chem. 78, 1318
(2006).66. R. E. Gyurcsanyi, A. S. Nyback, K. Toth, G. Nagy, A. Ivaska. Analyst 123, 1339 (1998).67. R. E. Gyurcsanyi, N. Rangisetty, S. Clifton, B. D. Pendley, E. Lindner. Talanta 63, 89 (2004).68. A. Michalska, A. Hulanicki, A. Lewenstam. Microchem. J. 57, 59 (1997).69. J. Sutter, E. Lindner, R. Gyurcsanyi, E. Pretsch. Anal. Bioanal. Chem. 380, 7 (2004).70. R. Zielinska, E. Mulik, A. Michalska, S. Achmatowick, M. Maj-Zurawska. Anal. Chim. Acta 451,
243 (2002).71. A. C. Ion, E. Bakker, E. Pretsch. Anal. Chim. Acta 440, 71 (2001).72. A. Ceresa, E. Bakker, B. Hattendorf, D. Gunther, E. Pretsch. Anal. Chem. 73, 343 (2001).73. E. Bakker. J. Electrochem. Soc. 143, L83 (1996).74. E. Bakker. Anal. Chem. 69, 1061 (1997).75. E. Bakker, E. Pretsh, P. Buhlmann. Anal. Chem. 72, 1127 (2000).76. R. Bereczki, B. Takacs, J. Langmaier, M. Neely, R. E. Gyurcsanyi, K. Toth, G. Nagy, E. Lindner.
Anal. Chem. 78, 942 (2006).77. T. Sokalski, A. Ceresa, M. Fibbioli, T. Zwickl, E. Bakker, E. Pretsch. Anal. Chem. 71, 1210
(1999).78. T. Sokalski, T. Zwickl, E. Bakker, E. Pretsch. Anal. Chem. 71, 1204 (1999).79. W. Qin, T. Zwickl, E. Pretsch. Anal. Chem. 72, 3236 (2000).80. R. Bereczki, B. Takacs, J. Langmaier, R. E. Gyurcsanyi, K. Tóth, G. Nagy, E. Lindner.
Electroanalysis 18, 1245 (2006).81. Y. Umezawa, K. Umezawa, H. Sato. Pure Appl. Chem. 67, 507 (1995).82. R. P. Buck, S. Rondinini, A. K. Covington, F. G. K. Baucke, C. M. A. Brett, M. F. Camões, M. J.
T. Milton, T. Mussini, R. Nauman, K. W. Pratt, P. Spitzer, G. S. Wilson. Pure Appl. Chem. 74,2169 (2002).
83. H. Curme, R. N. Rand. Clin. Chem. 43, 1647 (1997).84. P. Bergveld. IEEE Trans. Biomed. Eng. 17, 70 (1970).85. P. Bergveld. IEEE Trans. Biomed. Eng. 19, 342 (1972).86. J. Janata. Chem. Rev. 90, 691 (1990).87. E. Lindner, V. V. Cosofret, S. Ufer, T. A. Johnson, R. B. Ash, H. T. Nagle, M. R. Neuman, R. P.
Buck. Fresnius’ J. Anal. Chem. 346, 584 (1993).88. E. Lindner, V. V. Cosofret, S. Ufer, R. P. Kusy, R. P. Buck, R. B. Ash, H. T. Nagle. J. Chem. Soc.,
Faraday. Trans. 89, 361 (1993).89. R. W. Cattrall, H. Freiser. Anal. Chem. 43, 1905 (1971).
© 2008 IUPAC, Pure and Applied Chemistry 80, 85–104
Macro- and microfabricated ion-selective electrodes 103
90. R. W. Cattrall, I. C. Hamilton. Ion Sel. Electrode R 6, 125 (1984).91. V. V. Cosofret, M. Erdösy, T. A. Johnson, R. P. Buck, R. B. Ash, M. R. Neuman. Anal. Chem. 67,
1647 (1995).92. E. J. Fogt, D. F. Untereker, M. S. Norenberg, M. E. Meyerhoff. Anal. Chem. 57, 1998 (1985).93. A. Michalska. Anal. Bioanal. Chem. 384, 391 (2006).94. T. Momma, M. Yamamoto, S. Komaba, T. Osaka. J. Electroanal. Chem. 407, 91 (1996).95. J. Bobacka, T. Lindfors, M. McCarrick, A. Ivaska, A. Lewenstam. Anal. Chem. 67, 3819 (1995).96. G. Cui, J. S. Lee, S. J. Kim, H. Nam, G. S. Cha, H. D. Kim. Analyst 123, 1855 (1998).97. J. Bobacka, M. McCarrick, A. Lewenstam, A. Ivaska. Analyst 119, 1985 (1994).98. J. Bobacka, A. Ivaska, A. Lewenstam. Anal. Chim. Acta 385, 195 (1999).99. M. Vazquez, J. Bobacka, A. Ivaska, A. Lewenstam. Sens. Actuators, B 82, 7 (2002).
100. M. Fibbioli, K. Bandyopadhyay, S. G. Liu, L. Echegoyen, O. Enger, F. Diederich, D. Gingery,P. Buhlmann, H. Persson, U. W. Suter, E. Pretsch. Chem. Mater. 14, 1721 (2002).
101. M. Fibbioli, W. E. Morf, M. Badertscher, N. F. de Rooij, E. Pretsch. Electroanalysis 12, 1286(2000).
102. V. V. Cosofret, M. Erdösy, E. Lindner, T. A. Johnson, R. P. Buck, W. J. Kao, M. R. Neuman,J. M. Anderson. Anal. Lett. 27, 3039 (1994).
103. M. Fibbioli, K. Bandyopadhyay, S. G. Liu, L. Echegoyen, O. Enger, F. Diederich, P. Buhlmann,E. Pretsch. Chem. Commun. 339 (2000).
E. LINDNER AND Y. UMEZAWA
© 2008 IUPAC, Pure and Applied Chemistry 80, 85–104
104