performance, durability and sustainability - iea shc · task 27 solar building facade components...
TRANSCRIPT
Task 27 Solar Building Facade Components Subtask B: Durability
Task27-Final report –B3 page 1 of 92
Performance, durability and sustainability of advanced windows and solar components for building envelopes
Final Report
Subtask B: Durability PROJECT B3: Durability and reliability assessment of static solar materials October 2007
Operating Agent: Michael Köhl
Fraunhofer Institute for Solar Energy Systems
for PTJ Jülich, Germany
TASK 27
Performance of Solar Facade Components

Task 27 Solar Building Facade Components Subtask B: Durability
Task27-Final report –B3 page 2 of 92
Table of content 1. General introduction ........................................................................................................5
1. General methodology for durability assessment .......................................................5 2. Initial risk analysis ....................................................................................................5 3. Screening testing/analysis for service life prediction.................................................9
3.1 Test methods.....................................................................................................9 3.2 Results...............................................................................................................9 3.3 Microclimate characterization ..........................................................................11
4. Service life prediction from results of accelerated testing .........................................12 5. Validation ..................................................................................................................13 6. Conclusions ..............................................................................................................14 7. References................................................................................................................14
Case study 1: Glazing .......................................................................................................15 1.1 Anti-reflective coatings for glazing ...........................................................................15
1.1.1 Introduction ..................................................................................................15 1.1.2 Performance degradation due to filling of the pores.....................................16 1.1.3 Accelerated testing.......................................................................................18 1.1.4 Outdoor testing.............................................................................................19 1.1.5 Conclusions..................................................................................................20 1.1.6 References...................................................................................................20
1. 2. Durability of polymeric glazing materials ................................................................21 1.2.1 Introduction ..................................................................................................21 1.2.2 Durability exposure testing...........................................................................22 1.2.3 Outdoor Exposure Testing ...........................................................................23 1.2.4 Accelerated Laboratory Exposure Testing ...................................................24 1.2.5 Analysis of durability results from accelerated ageing..................................27 1.2.6. Validation of methodology............................................................................28 1.2.7 Conclusions..................................................................................................29 1.2.8 References...................................................................................................30
Case study 2: Reflectors ................................................................................................31 2.1 Structural Analysis ........................................................................................31 2.2 Specification of end-user and product requirements.....................................32 2.3 Specification of functional properties and requirements on component and its
material .........................................................................................................32 2.5 Risk assessment and service reliability for commercial Al reflectors .............34 2.6 Risk assessment and service reliability for reflectors.....................................35 2.7 Programme for screening testing of reflectors ...............................................36 2.9 Techniques used for measurement of degradation factors at reflectors ........40 2.10 Sample selection ...........................................................................................40 2.11 Fault tree analysis of reflectors ......................................................................41 2.12 Some results from outdoor exposure.............................................................44 2.13 Conclusions ...................................................................................................47
Case study 3: Absorber..................................................................................................48 3.1 Initial risk analysis of potential failure modes organic absorber coatings.......48 3.2 Specification of functional properties and requirements ................................49

Task 27 Solar Building Facade Components Subtask B: Durability
Task27-Final report –B3 page 3 of 92
3.3 Risk assessment of potential failure modes by use of FMEA applied to polymeric façade absorbers...........................................................................49
3.4 Risk assessment and service reliability for polymeric façade absorbers .......50 3.5 Programme for screening testing of polymeric facade absorbers ..................50 3.6 Techniques for analysis of material change upon durability testing of
polymeric façade absorber ............................................................................51 3.7 Techniques used for measurement of degradation factors at polymeric façade
absorbers.......................................................................................................52 3.8 Constant Load Indoor Tests ..........................................................................52 3.9 Corrosion Tests .............................................................................................53 3.10 Condensation and high temperature tests .....................................................60
Case study 4: Service life prediction tools for complete Solar Collectors.......................61 4.1 FMEA Methodology Brief Review ..................................................................62 4.2 Structural analysis ..........................................................................................65 4.3 Requirements / Failure Modes........................................................................66 4.4 Stresses..........................................................................................................68 4.5 Functional analysis .........................................................................................68 4.6 FMEA worksheet ............................................................................................69 4.7 Weak points from visual inspection.................................................................71 4.8 Discussion ......................................................................................................74 4.9 References .....................................................................................................77
Case study 5: Window/Wall interface.............................................................................88 5.1 Introduction......................................................................................................88 5.2 The detection system ......................................................................................88 5.3 The subject ......................................................................................................89 5.4 Results ............................................................................................................90 5.5 Conclusions.....................................................................................................92

Task 27 Solar Building Facade Components Subtask B: Durability
Task27-Final report –B3 page 4 of 92
PROJECT B3: “Durability and reliability assessment of static solar materials” Prepared by: Michael Köhl Fraunhofer Institute for Solar Energy Systems ISE, Heidenhofstraße 2, D-79110 Freiburg, Germany, e-mail: [email protected] Partners in the project: COUNTRY PARTICIPANT NAME CH ..................EMPA ................................Heinrich Manz CH ..................SPF-HSR...........................Stefan Brunold DE ..................ISE.....................................Andreas Gombert DE ..................ISE.....................................Markus Heck DE ..................ISE.....................................Michael Köhl DE ..................ISE.....................................Volker Kübler DK ..................DTU...................................Ole Holck DK ..................DTU...................................Svend Svendson FR...................CSTB.................................Jean-Luc Chevalier FR...................CSTB.................................Francois Olive FR...................St. Gobain .........................Xavier Fanton IT ....................ENEA.................................Augusto Maccari IT ....................ENEA.................................Michele Zinsi NL...................TNO...................................Dick van Dijk NOR ...............E & H .................................Ida Bryn POR ...............INETI .................................Maria Joao Carvalho POR................INETI .................................Manuel Lopes Prates SWE ...............SP .....................................Bo Carlsson SWE ...............SP......................................Kenneth Möller SWE ...............UU ....................................Arne Roos SWE ...............UU .....................................Anna Werner USA ................NREL.................................Gary Jorgensen
Task 27 Solar Building Facade Components Subtask B: Durability
Task27-Final report –B3 page 5 of 92
1. General introduction The methodology of durability assessment is based on the work of Project B1 and is described in the respective final report. A brief description is given below. 1. General methodology for durability assessment The methodology adopted by Task 27 includes three steps: • initial risk analysis of potential failure modes, • screening testing/analysis for service life prediction and microclimate
characterisation, and • service life prediction involving mathematical modelling and life testing. 2. Initial risk analysis The initial risk analysis is performed with the aim of obtaining • a checklist of potential failure modes of the component and associated with those
risks and critical component and material properties, degradation processes and stress factors,
• a framework for the selection of test methods to verify performance and service life requirements,
• a framework for describing previous test results for a specific component and its materials or a similar component and materials used in the component and classifying their relevance to the actual application, and
• a framework for compiling and integrating all data on available component and material properties.
The programme of work in the initial step of service life assessment is structured into the following activities: • Specify from an end-user point of view the expected function of the component and
its materials, its performance and its service life requirement, and the intended in-use environments;
• Identify important functional properties defining the performance of the component and its materials, relevant test methods and requirements for qualification of the component with respect to performance;
• Identify potential failure modes and degradation mechanisms, relevant durability or life tests and requirements for qualification of the component and its materials as regards durability.

Task 27 Solar Building Facade Components Subtask B: Durability
Task27-Final report –B3 page 6 of 92
Table 1 Specification of end-user and product requirements for the booster reflectors
Table 2 Specification of critical functional properties of booster reflectors and requirements
The first activity specifies in general terms the function of the component and service life requirement from an end-user and product point of view, and from that identifies the most important functional properties of the component and its materials. In Table 1 and Table 2 results are shown from the analysis made on booster reflectors. How important the function of the component is from an end-user and product point of view needs to be taken into consideration when formulating the performance requirements in terms of those functional properties. If the performance requirements are not fulfilled, the particular component is regarded as having failed. Performance requirements can be formulated on the basis of optical properties, mechanical strength, aesthetic values or other criteria related to the performance of the component and its materials. Potential failure modes and important degradation processes should be identified after failures have been defined in terms of minimum performance levels. In general, there exist many kind of failure modes for a particular component and even the different parts of the component and the different damage mechanisms, which may lead to the same kind of failure, may sometimes be quite numerous. In Table 3 an example on booster reflectors is presented.

Task 27 Solar Building Facade Components Subtask B: Durability
Task27-Final report –B3 page 7 of 92
Table 3 Potential failure modes and associated degradation mechanisms, degradation indicators and critical factors of environmental stress for booster reflectors identified
Fault tree analysis is a tool, which provides a logical structure relating failure to various damage modes and underlying chemical or physical changes. It has been used for the static solar materials studied in Task 27 to better understand observed loss in performance and associated degradations mechanisms of the different materials studied. In Figure 1 and Figure 2 examples on how the different failure modes and associated degradation mechanisms can be represented for booster reflectors and antireflective glazing materials, are shown.

Task 27 Solar Building Facade Components Subtask B: Durability
Task27-Final report –B3 page 8 of 92
Figure 1: Representation of failure modes and associated degradation mechanisms for booster reflectors
Figure 2: Representation of failure modes and associated degradation mechanisms for antireflective glazing Table 4: Risk assessment on different damage modes of booster reflectors made by using the methodology of FMEA
The risk associated with each potential failure/damage is taken as the point of departure to judge whether a particular failure mode needs to be further evaluated or not. Risks may be
Task 27 Solar Building Facade Components Subtask B: Durability
Task27-Final report –B3 page 9 of 92
estimated jointly by an expert group adopting the methodology of FMEA (Failure Modes and Efffect Analysis). In Table 4 the result of a risk analysis made on booster reflectors is presented. 3. Screening testing/analysis for service life prediction Screening testing is thereafter conducted with the purpose of qualitatively assessing the importance of the different degradation mechanisms and degradation factors identified in the initial risk analysis of potential life-limiting processes.
3.1 Test methods When selecting the most suitable test methods for screening testing, it is important to select those with test conditions representing the most critical combination of degradation factors. Using artificially aged samples from the screening testing, changes in the key functional properties or the selected degradation indicators are analysed with respect to associated material changes. This is made in order to identify the predominant degradation mechanisms of the materials in the component. When the predominant degradation mechanisms have been identified also the predominant degradation factors and the critical service conditions determining the service life will be known. Screening testing and analysis of material change associated with deterioration in performance during ageing should therefore be performed in parallel. Suitable techniques for analysis of material changes due to ageing may vary considerably. On the static solar materials of Task 27, a number of accelerated screening have been performed including simulation of possible degradation in performance under the influence of high temperature, high humidity/condensation, UV, and corrosion loads; either single or combined loads; see Table 5.
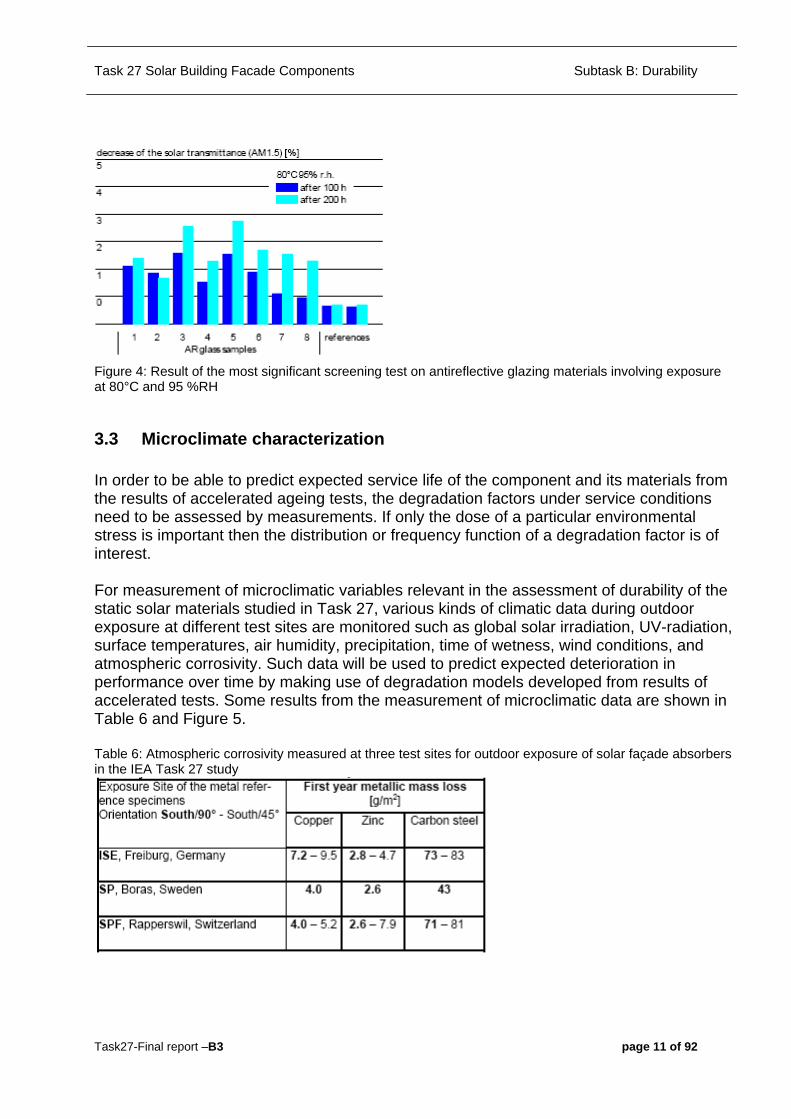
3.2 Results In Figure 3 the results from a series of screening tests on pure aluminium, used as reference reflector material, are shown as an example of result. Degradation in optical performance is observed mainly, as expected, in the corrosion tests. In Figure 4 the result from the testing of a number of antireflective glazing materials at 80 °C and 95 %RH is given. The cause of degradation in optical performance is in this case not understood and the degradation therefore needs to further analysed. To identify degradation mechanisms for the tested materials various analytical techniques are presently employed.

Task 27 Solar Building Facade Components Subtask B: Durability
Task27-Final report –B3 page 10 of 92
Table 5: Examples of screening tests performed on the reflector materials, antireflective glazing materials, and solar façade absorbers studied by the IEA SHCP Task 27 group
Figure 3: Results from screening tests on pure Aluminium
Task 27 Solar Building Facade Components Subtask B: Durability
Task27-Final report –B3 page 11 of 92
Figure 4: Result of the most significant screening test on antireflective glazing materials involving exposure at 80°C and 95 %RH
3.3 Microclimate characterization In order to be able to predict expected service life of the component and its materials from the results of accelerated ageing tests, the degradation factors under service conditions need to be assessed by measurements. If only the dose of a particular environmental stress is important then the distribution or frequency function of a degradation factor is of interest. For measurement of microclimatic variables relevant in the assessment of durability of the static solar materials studied in Task 27, various kinds of climatic data during outdoor exposure at different test sites are monitored such as global solar irradiation, UV-radiation, surface temperatures, air humidity, precipitation, time of wetness, wind conditions, and atmospheric corrosivity. Such data will be used to predict expected deterioration in performance over time by making use of degradation models developed from results of accelerated tests. Some results from the measurement of microclimatic data are shown in Table 6 and Figure 5. Table 6: Atmospheric corrosivity measured at three test sites for outdoor exposure of solar façade absorbers in the IEA Task 27 study

Task 27 Solar Building Facade Components Subtask B: Durability
Task27-Final report –B3 page 12 of 92
Figure 5: Microclimatic data measured during outdoor exposure of solar façade absorbers at ISE. Left diagram: Surface temperature frequency histograms for a black painted and a black chrome absorber; Right diagram: UVA and UVB light doses versus exposure time. 4. Service life prediction from results of accelerated testing Accelerated life testing means to quantitatively assess the sensitivity to the various degradation factors on the overall deterioration of the performance of the component and its materials.
Figure 6: Change in thermal emittance observed for some reference solar façade absorber materials during outdoor testing and during accelerated corrosion testing. The corrosivity dose in terms of metallic mass loss of copper at an exposure time is also given for the different tests to illustrate that outdoor performance of those absorbers can be predicted by making use of the equiva-lent corrosivity dose approach. Mathematical models are then set up to characterize the different degradation mechanisms identified and from the accelerated life test results the parameters of the assumed model for degradation are determined and the service life then estimated.
Task 27 Solar Building Facade Components Subtask B: Durability
Task27-Final report –B3 page 13 of 92
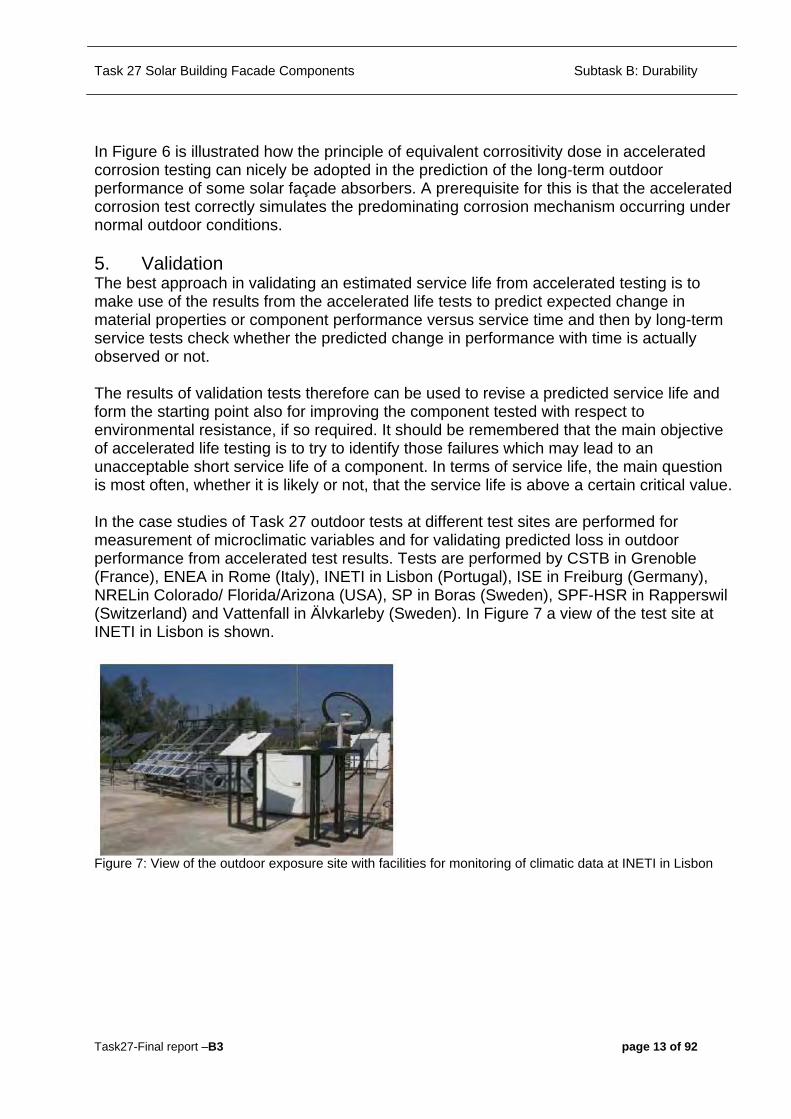
In Figure 6 is illustrated how the principle of equivalent corrositivity dose in accelerated corrosion testing can nicely be adopted in the prediction of the long-term outdoor performance of some solar façade absorbers. A prerequisite for this is that the accelerated corrosion test correctly simulates the predominating corrosion mechanism occurring under normal outdoor conditions. 5. Validation The best approach in validating an estimated service life from accelerated testing is to make use of the results from the accelerated life tests to predict expected change in material properties or component performance versus service time and then by long-term service tests check whether the predicted change in performance with time is actually observed or not. The results of validation tests therefore can be used to revise a predicted service life and form the starting point also for improving the component tested with respect to environmental resistance, if so required. It should be remembered that the main objective of accelerated life testing is to try to identify those failures which may lead to an unacceptable short service life of a component. In terms of service life, the main question is most often, whether it is likely or not, that the service life is above a certain critical value. In the case studies of Task 27 outdoor tests at different test sites are performed for measurement of microclimatic variables and for validating predicted loss in outdoor performance from accelerated test results. Tests are performed by CSTB in Grenoble (France), ENEA in Rome (Italy), INETI in Lisbon (Portugal), ISE in Freiburg (Germany), NRELin Colorado/ Florida/Arizona (USA), SP in Boras (Sweden), SPF-HSR in Rapperswil (Switzerland) and Vattenfall in Älvkarleby (Sweden). In Figure 7 a view of the test site at INETI in Lisbon is shown.
Figure 7: View of the outdoor exposure site with facilities for monitoring of climatic data at INETI in Lisbon

Task 27 Solar Building Facade Components Subtask B: Durability
Task27-Final report –B3 page 14 of 92
6. Conclusions The work in IEA Task 27 on durability assessment of static solar energy materials has shown that it is possible to employ a systematic approach in the evaluation of the expected service life of the materials studied. Based on the work performed recommended test procedures will be worked out for qualification of new materials with respect to durability.
Figure 7: Results from outdoor exposure of antireflective glazing materials performed at SPF-HSR Rapperswil, Switzerland. The decrease in the solar transmittance with time is due to soiling effects, which vary very much with exposure site. For recommended durability test procedures to be accepted as international standards, it is of utmost importance to demonstrate their relevance for predicting real in-service long-term performance. 7. References [1] M. Köhl ; New IEA-SHC Task: Performance of Solar Façade Components – Performance, durability and sustainability of advanced windows and solar components for building envelopes, Proceedings Eurosun 2000 Conference, Copenhagen 19-22 June 2000 [2] B. Carlsson, K. Möller, M. Köhl, M. Heck, S. Brunold, U. Frei , J.- C. Marechal, G. Jorgensen; The applicability of accelerated life testing for assessment of service life of solar thermal components, Solar Energy Materials and Solar Cells (in press) [3] R.E. Mc Dermott, R.J. Mikulak, M.R. Beauregard, R. Mikylak, The basics of FMEA, Productivity Inc. 1996, ISBN: 0527763209

Task 27 Solar Building Facade Components Subtask B: Durability
Task27-Final report –B3 page 15 of 92
Case study 1: Glazing Case study leader: Andreas Gombert Fraunhofer Institute for Solar Energy Systems ISE, Heidenhofstrasse 2, D-79110 Freiburg, Germany, e-mail: [email protected] 1.1 Anti-reflective coatings for glazing
1.1.1 Introduction Over the past decades, different attempts have been made to enhance the solar transmittance of glazing. The potential for improving solar facade components is rather high. Many of them are covered with a glazing on which the losses per surface due to reflection are typically between 4% for normal incidence and 9% for an angle of incidence of 60°. For a double glazing these losses can sum up to 15% for normal incidence and 31% for 60°. The main difficulty in developing efficient broadband antireflection (AR) layers is the need for layers with a refractive index lower than 1.3. Conventional multilayers with alternating high and low refractive indices are very effective in the visible region but cannot be used for the solar spectrum because their effect is to increase reflection at double the design wavelength. In publications concerning solar anti-reflective surfaces [1 - 4], the principle to achieve the necessary low refractive indices is always the same: substrate material is mixed with air on a subwavelength scale. This results in layers with sufficiently low effective refractive indices. On the market available are now two different technological approaches to make inorganic glasses antireflective: • Porous surfaces produced by etching the substrate material • Porous SiO2 sol-gel coatings • Further developments which use similar processes are ongoing. Porous sol-gel coatings are produced by dipping a glass pane into a sol containing very small SiO2 particles. After withdrawal of the glass pane and drying of the wet film the coating has to be heated at high temperature: a process which is done normally done by using the glass strengthening process. Thus, no extra energy is required. The etching technology using HF und H2SiF6•SiF4 as described for example in [3] includes in reality not only etching but also re-deposition of SiO2. Thus, the morphologies of the etched glazing and sol-gel coated glazing which are available on the market are similar. In both cases, a single layer with a porosity of around 50% is formed. Slight differences concern the homogeneity of the porosity over the depth of the layer. A cross section of a porous sol-gel coating on glass is shown in Fig. 1. Such layers are

Task 27 Solar Building Facade Components Subtask B: Durability
Task27-Final report –B3 page 16 of 92
applied in thicknesses from 120 – 140nm and contain almost only SiO2 and air. The solar transmittance (AM1.5) of a glass pane AR treated on both surfaces is typically increased by around 5% under near-normal incidence.
Fig. 1: SEM picture of a cross section of a porous sol-gel coating on glass. The goal of this work was to analyse potential failure modes and to develop suitable qualification testing in order to enable us to predict service life based on the test results. We did not reach this goal because we were not able to find a really suitable accelerated test method which degrades the material in a sufficiently short time and is relevant for the practical use of such glazing. What we found is that the AR glazing performance is significantly determined by processes which cannot be allocated to material degradation but more to a reversible modification of the pores. Additionally, natural soiling of glass panes cannot be neglected.
1.1.2 Performance degradation due to filling of the pores The low effective refractive index requires that the pores of the porous AR layer are filled with air. If the pores are filled with a material which has a refractive index close to that of the SiO2 network surrounding the pores the AR effect vanishes. We found that water vapour and vapours of organic compounds can condense in the pores. This happens for water only at very high humidity. Therefore the condensation of water in the pores is almost negligible in practise according to our experience so far. Organic compounds can originate from materials used at elevated temperatures in the neighbourhood of such glazing. Such organic compounds can be removed from the pores just by rinsing with water. Therefore the AR layers facing outwards are always cleaned by rain if there is some filling of the pores but AR layers on inward glass surfaces can be affected. A solar thermal collector may serve as an example. A sketch of such a collector is shown in Fig. 2. Inside the collector the thermal insulation material and the seals may contain organic materials. Our tests showed that the AR effect of the inner layer can be totally removed when mineral

Task 27 Solar Building Facade Components Subtask B: Durability
Task27-Final report –B3 page 17 of 92
wool with high content of a phenolic resin as binder are used as soon as the absorber reaches typical stagnation temperatures (Fig. 3). A variety of thermal insulation materials do not show the outgasing effect. For example, a mineral wool with a gradient of the phenolic resin (low concentration close to the absorber, higher concentration with larger distance to the absorber) performed very well in combination with AR glazing. This is possible due to the high temperature gradient within the thermal insulation. This temperature gradient can be made visible by the brownish colour of degraded phenolic resin which is shown in Fig. 4. So-called binder-free mineral wool is not in general better than mineral wool containing binders. Some of the binder-free mineral wool which we tested did not contain phenolic resin but contained large amounts of other organic materials. As a result, the materials used in combination with porous AR layers should be selected carefully.
40mm
Abdeckscheibe
Absorber
Isolation
Gehäuse
45 m
m45
mm
glazing
absorber
insulation
housing
Fig. 2: Sketch of a solar thermal collector
0.4 0.6 0.8 1.0 1.2 1.4 1.6 1.8 2.0 2.2 2.4
2
4
6
8
10
Wellenlänge [μm]
Reflexion [%]reflectance [%]
wavelength [μm]
Fig. 3: Reflectance spectrum of an AR glazing before (squares) and after (dots) 170°C absorber temperature for 24 h on a small test solar collector equipped with a thermal insulation containing a high amount of phenolic resin as binder.

Task 27 Solar Building Facade Components Subtask B: Durability
Task27-Final report –B3 page 18 of 92
Fig. 4: Photo of different insulation materials based on mineral wool after treatment in a small test solar collector at stagnation temperatures for 24 hours (left and middle: top view and cross section of a mineral wool containing phenolic resin; right: binder-free wool)
1.1.3 Accelerated testing As potential failure modes of the porous AR layers we identified: loss of adhesion, degradation of the SiO2 network and irreversible filling of the pores. All these potential failure modes are based on chemical reactions which can be accelerated by using elevated temperatures, high humidity and condensation. Neither the porous network nor the substrate will significantly be affected by solar radiation. Therefore, the search for suitable screening tests concentrated on the following tests which were performed in laboratories in France, Switzerland, Sweden and Germany:
Test name Test conditions High temperature, high humidity 58°C, 95% r.h. High temperature, high humidity 80°C, 95% r.h. Condensation 58°C (sample at 53°C), 95% r.h. Cyclic temperature, high humidity -18°C - +80°C, 95% r.h. when possible Pollutants SOx
The good news is that no significant loss of adhesion or destruction of the AR layers was observed in any of the tests. Only traces of water droplets running down the glass panes have been seen partly as slight colour changes. The bad news is that in none of the tests the AR layers degraded with a sufficient speed in order to use that test as suitable accelerated test. For example in Fig. 5, results from the high humidity / high temperature test are shown. This was the only test which resulted in significant changes of the AR treated glasses. One can see that even after 200 hours of testing the maximum decrease of the solar transmittance of the samples is below 3%. The variation of the results between the two samples of each of the different types of AR layers is in the range of the variation between

Task 27 Solar Building Facade Components Subtask B: Durability
Task27-Final report –B3 page 19 of 92
different types. Additionally, it is questionable whether with such a test real outdoor conditions are accelerated. As a result, one can say that a careful decision for the most suitable testing method still cannot be made.
0
1
2
3
4
5
80°C 95% r.h. after 100 h after 200 h
decrease of the solar transmittance (AM1.5) [%]
1 2 3 4 5 6 7 8 referencesAR glass samples
Fig. 5: Decrease of the solar transmittance of the samples from the initial values after testing 100h and 200 h at 80°C/ 95% r.h. The variation of the reference values is probably due to measurement errors
1.1.4 Outdoor testing At six different places around Europe 15 x 15 cm² large samples were exposed outdoors and their transmittance and reflectance was measured in defined intervals and some of the samples were never cleaned others before the measurement. Unfortunately, due to difficulties in funding or personal resources not all data are completely available. The important results are: in the first 3-4 months of outdoor exposure the solar transmittance of inorganic glass with an without AR layers is reduced by typically 1% in one case even by 3%. This natural soiling can not fully be removed by washing the glass and there is no significant difference between AR treated and untreated glass. This means that the initial improvement of the solar transmittance by using the AR layers remains for the period of investigation almost unchanged at those places at which also a glass reference is measured. An example is shown in Fig. 6. For reference, also an organic glazing which is known for quick degradation was tested. For the locations at which no reference was measured it is impossible to decide whether a measured slight degradation is due to natural soiling or not. In all locations, a slight degradation of the transmittance of all inorganic glass samples (with and without AR layers) could be

Task 27 Solar Building Facade Components Subtask B: Durability
Task27-Final report –B3 page 20 of 92
observed. No significant difference was found for the different types of AR layers. The testing period is definitely too short to give final recommendations now.
0 3 6 9 12 15 18
60
70
80
90
100
time [months]
AM 1,5
solar transmittance (AM1.5) [%]
AR treated inorganic glasses
inorganic glass reference
organic glass reference
Fig. 7: Measured values of the solar transmittance (AM1.5) for the samples exposed at Freiburg, Germany, during the first 18 months.
1.1.5 Conclusions So far, the goal to determine real failure modes and to develop a method for service life prediction could not be reached. Performance degradation due to processes which are not directly related to the used materials such as filling the pores with organics or natural soiling was identified. The samples under investigation are very stable in all the accelerated tests which were applied. For the outdoor testing a longer observation period is required in order to identify real use degradation modes.
1.1.6 References [1] Cathro, K. J., Constable, D. C. and Solaga, T. (1981). "Durability of porous silica antireflection coatings for solar collector cover plates", Solar Energy, Vol. 27, No. 6, 491 - 496. [2] Cathro, K. J., Constable, D. C. and Solaga, T. (1984). "Silica low-reflection coatings for collector covers, by a dip-coating process", Solar Energy, Vol. 32, No. 5, 573 - 579. [3] Chinyama, G. K., Roos, A. and Karlsson, B. (1993). "Stability of antireflection coatings for large area glazings", Solar Energy, Vol. 50, No. 2, 105 - 111. [4] Gombert, A. et al. (1998). "Glazing with high solar transmittance ", Solar Energy Vol. 62, No. 3, 177 – 188.
Task 27 Solar Building Facade Components Subtask B: Durability
Task27-Final report –B3 page 21 of 92
1. 2. Durability of polymeric glazing materials Main contributions from Gary Jorgensen, NREL, USA The economic viability of solar collector systems for domestic hot water (DHW) generation is strongly linked to the cost of such systems. Installation and hardware costs must be reduced by 50% to allow significant market penetration. An attractive approach to cost reduction is to replace glass and metal parts with less expensive, lighter weight polymeric components. Weight reduction decreases the cost of shipping, handling, and installation. The use of polymeric materials also allows the benefits and cost savings associated with well established manufacturing processes, along with savings associated with improved fastening, reduced part count, and overall assembly refinements. A key challenge is to maintain adequate system performance and assure requisite durability for extended lifetimes. Results of preliminary and ongoing screening tests for a large number of candidate polymeric glazing materials are presented. Based on these results, two specific glazings are selected to demonstrate how a service lifetime methodology can be applied to accurately predict the optical performance of these materials during in-service use. A summary is given for data obtained by outdoor exposure and indoor testing of polyvinyl chloride (PVC) and polycarbonate (PC) materials, and an initial risk analysis is given for the two materials. Screening tests and analyses for service lifetime prediction are discussed. A methodology that provides a way to derive correlations between degradation experienced by materials exposed to controlled accelerated laboratory exposure conditions and materials exposed to in-service conditions is given, and a validation is presented for the methodology based upon durability test results for PVC and PC.
1.2.1 Introduction Polymeric glazings offer significant potential for cost savings both as direct substitutes for glass cover plates in traditional solar collector systems and as an integral part of all-polymeric systems. A review of polymeric solar collector systems development efforts is provided in [1]. Cost savings result from lower base material costs and lower costs associated with shipping, handling and installation. Glazings must have high transmittance across the solar spectrum and must be able to survive 10 to 20 y exposure to service conditions including operating at temperatures of 55 to 90�C and in solar ultraviolet (UV) light. They must also retain mechanical integrity e.g., impact resistance and flexural rigidity, under these harsh environmental stresses. The emphasis of current efforts is to identify new or improved candidate glazings and to evaluate their optical and mechanical durability during exposure to actual and simulated in-service conditions. Recently, several reviews of candidate polymeric glazing materials have been undertaken [2-4]. These were guided by the expectation that advances in the polymer manufacturing and materials industry would allow identification of potential new and improved collector glazing candidates. An international collaborative effort surveyed commercial producers of advanced polymer materials in the U. S., Europe, and Japan [2].

Task 27 Solar Building Facade Components Subtask B: Durability
Task27-Final report –B3 page 22 of 92
The most promising class of polymers were fluoropolymers. These have excellent thermal and optical durability but are expensive and are limited to use with thin film collector designs. Film products such as Tefzel® (ethylene-tetrafluoroethylene copolymer; ETFE), Duralar® (also an ETFE), Halar®, Teflon®, and Kynar® exhibit very high spectral transmittance and many have sufficient tear resistance to be considered as collector glazings [3]. Suitably UV-stabilized polyetherimide (PEI), polyimide (PI), and polycarbonate (PC) were also suggested for consideration, although PI is quite expensive. Preliminary exposure test data for several dozen polymeric glazing materials being screened was reported in [3]; most materials identified by [2] were included. These exposures have continued and further results are discussed herein. Another complementary review also surveyed potential polymeric glazing materials [4]. In addition to twin walled PC, fluoropolymer films, and multilayered polyethylene (PE) films under test, consideration of polyurethane films, silicones, enhanced acrylics, clay-filled thermoplastics, and polycyclohexylethylene (PeCHE) were also recommended. Screening tests have revealed the more promising candidates, along with glazing materials that have failed. The most common mode of failure has been yellowing of the glazing material. These have generally included non-fluoropolymer thin film materials (PET and PE, including UV-stabilized versions), and non-UV stabilized PC constructions. Additional (less common) modes of failure include materials developing a cloudy white opaque appearance, temperature-related deformation and/or discoloration, and physical damage caused by hail and other natural weathering events. Materials that have maintained high solar-weighted hemispherical transmittance values (>90%) after more than 2 years outdoor and accelerated exposure include: Kynar®, Duralar®, Tefzel®, and Halar® and PC with UV-screening layers. Polycarbonate has high optical clarity and excellent impact strength. However, it will yellow during UV exposure and become brittle. Recently, stabilized versions of PC have been developed. For example, Bayer has two products designated APEC 5391 and APEC 5393. The first is a thermally stabilized formulation, which is offered for a maximum continuous use temperature of up to 180oC, and the second is stabilized for UV exposure and elevated temperatures. General Electric has incorporated an integral UV-screening coating into a number of their Lexan products. Because PC has excellent initial properties and is available in a variety of forms, e.g., sheet or channeled, suitable for use with solar collectors, is has been extensively studied as a promising glazing candidate. Parallel test results for PVC serve as a control, because it is known to weather poorly.
1.2.2 Durability exposure testing From 1993-2002, numerous samples of PVC and PC materials were exposed to accelerated life testing in laboratories and to the outdoor environment at test sites located in Europe and in the USA by colleagues participating in the Working Group “Materials in Solar Thermal Collectors” (MSTC) of the IEA Solar Heating and Cooling Programme. The details of these test results are provided in [5]. Samples of PC and PVC, along with other candidate polymeric glazing materials, were subjected to in-service outdoor and accelerated laboratory exposure conditions. Outdoor testing was carried out in Switzerland at the Institut für Solartechnik (SPF), Germany at the ISE in Freiburg, and at three sites in the United States, namely, Golden, CO; Phoenix, AZ; and Miami, FL. A precise and

Task 27 Solar Building Facade Components Subtask B: Durability
Task27-Final report –B3 page 23 of 92
detailed knowledge of the specific environmental stress conditions experienced by weathered samples is needed to allow understanding of site-specific performance losses and to permit service lifetime prediction of candidate glazings. Consequently, each operational exposure site is fully equipped with the appropriate meteorological and radiometric instrumentation and data-logging capability.
1.2.3 Outdoor Exposure Testing The materials tested are for the intended use in solar thermal flat plate collectors. Thus, the samples for outdoor exposure were attached to mini-collector boxes, as illustrated in Figure 1. To simulate the elevated temperature collector covers are exposed to, the “mini-collectors” are made of solar selective coated stainless steel. A thermocouple is affixed to the glazing material to monitor sample temperature, and a reflective light shield hood is used to prevent direct heating of the thermocouple. The samples prepared in this way were exposed to the ambient climate at locations in Europe and in the USA, facing south at an inclination angle equal to the lattitude of the site. The spectral transmittance of all samples was measured prior to exposure. After some time, some of the samples were remeasured and exposed again without any cleaning. Other samples were measured before and after cleaning and then exposed again. Solar-weighted transmittance values integrated over the solar spectrum (τsol) and between 400-600 nm (τ400-600) are computed as degradation indicators. The bandwidth 400-600 nm is useful because degradation of optical transmittance of many polymeric glazing materials is most pronounced in that spectral range. Representative τ (400-600) data are plotted in Figures 2 and 3 for APEC 9353 PC and Duraglas PVC, respectively. Figure 2 shows a loss in τ (400-600) of about 5% per year for samples of APEC 9353 exposed outdoors in Europe and the US. Duroglas, a PVC glazing material, degrades very rapidly when exposed to UV light. Figure 3 presents outdoor test results for Duroglas exposed in the United States and Europe. Samples of Duroglas exhibited between 25-40% loss in τ (400-600) after only one year exposure, depending upon the outdoor site.
Mini-Collector Box
Glazing
Thermocouple
Reflective Light Shield Hood
140 mm Silicone Rubber Seal
Figure 1: "Mini-collectors" used for outdoor exposure of transparent cover materials

Task 27 Solar Building Facade Components Subtask B: Durability
Task27-Final report –B3 page 24 of 92
0.0
0.1
0.2
0.3
0.4
0.5
0.6
0.7
0.8
0.9
0 0.5 1 1.5 2 2.5 3
Time of Exposure (months)
τ (40
0-60
0)
PhoenixGoldenRapperswilFreiburg
Figure 2: Outdoor exposure test results for APEC 9353 PV
0.0
0.1
0.2
0.3
0.4
0.5
0.6
0.7
0.8
0.9
0 0.5 1 1.5 2 2.5 3
Time of Exposure (months)
τ (40
0-60
0)
PhoenixGoldenRapperswilFreiburg
Figure 3: Outdoor exposure test results for Duroglas PVC
1.2.4 Accelerated Laboratory Exposure Testing Accelerated indoor testing was carried out with different types of test equipment available at the participating laboratories. Several test protocols were performed using corresponding types of exposure chambers. In the first type, UV exposure was combined with various combinations of elevated temperature and a defined level of relative humidity (RH), i.e., 60°C / 80% RH, 80°C / 40% RH, and 50°C / 95% RH. These tests were performed in climatic cabinets at SPF and ISE with an unfiltered metal halide (HMI) lamp as a light source. The intensity of the irradiation compared to an air-mass (AM) 1.5 solar spectrum is about 3 times as much UVA and 7 times as much UVB.
Task 27 Solar Building Facade Components Subtask B: Durability
Task27-Final report –B3 page 25 of 92
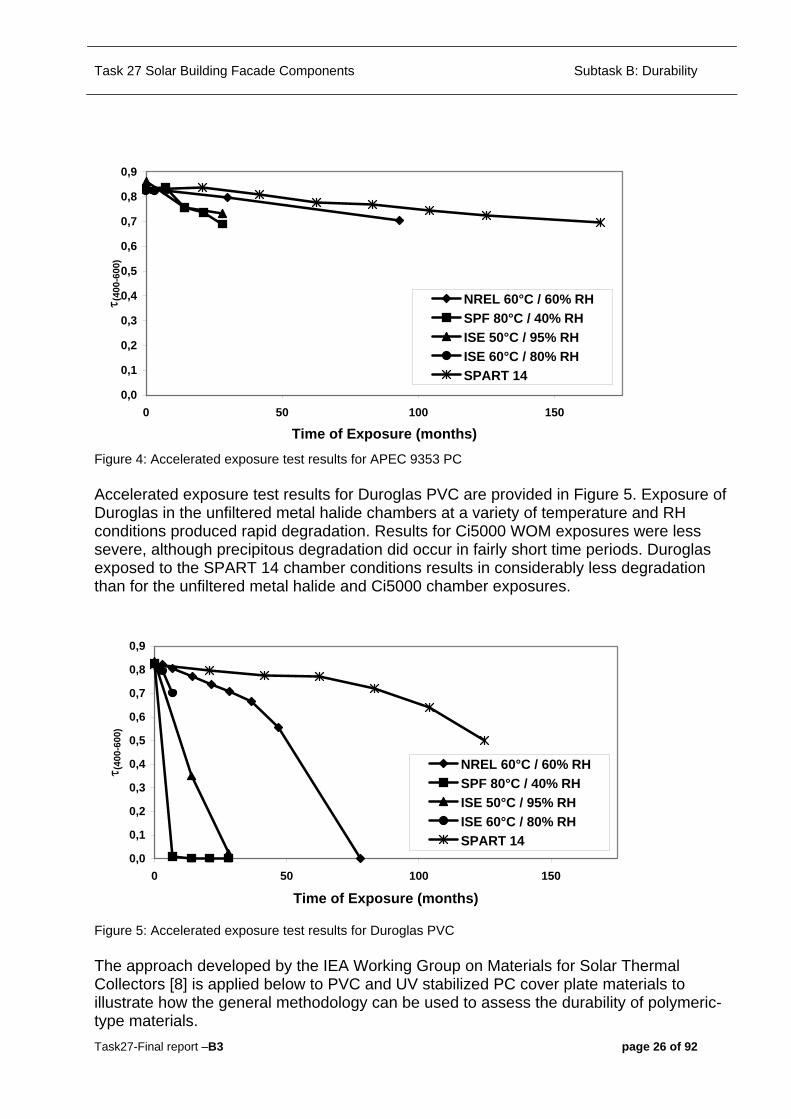
In the second type of exposure test, an Atlas Ci5000 Weather-Ometer® (WOM) was operated at 60ºC and 60% RH, and an irradiation level of about twice an AM 1.5 solar spectrum throughout the UV and visible portion of the spectrum. In the final test protocol, an Atlas XR35 WOM – SPART 14 test was used. The SPART 14 test procedure was originally developed for clear coats in automotive paint systems. The test is a weatherability test that includes acidic rain spraying. In test method SPART 14, which is a modification of SAE J1960 [6], the Xenon arc light source is filtered through borosilicate filters and has an irradiance level of 0.5 W/m2 at 340 nm; this corresponds to an intensity of roughly 1.4 times an AM 1.5 spectrum. The test cycle is comprised of a) 40 min of light only; b) 20 min of light with water sprayed on the front surface of the sample; c) 60 min of light only; and d) 60 min of no light with water sprayed on the back surface of the sample. Every fourteenth cycle, the water used to spray the front of the samples is acidic, with a pH of 3.2. The black standard temperature and relative humidity during light periods are 70°C and 75%, respectively. The chamber temperature and relative humidity during the dark periods are 38°C and 95%. An exposure time of 1000 h (~6 weeks) in the SPART 14 test is estimated to correspond to about 1.3 years of outdoor testing in Miami, Florida for automotive paints. Thus, 4000 h of SPART 14 testing corresponds to about 5 years outdoors in Florida. However, one can assume that the temperature of an automotive coating will be at least 10 K higher than for transparent low light absorbing glazing materials. Consequently, the acceleration factor for the glazing can be estimated to be a factor of 2 higher. Accordingly, 1000 h of artificial weathering corresponds to 2.5 y outdoors. Highly accelerated exposure testing of selected samples using natural sunlight was also performed at NREL [7]. Parallel testing with the relevant stress factors of UV, temperature, RH, and acid spray at different levels was intended to allow the sensitivity of materials degradation to these factors to be quantified, and allow damage function models to be evaluated. These in turn can be used to compare the time-dependent performance of these materials with measured results from in-service outdoor exposure. The values obtained for τ (400-600) are plotted in Figures 4 and 5 for APEC 9353, and Duroglas after the different types of exposure. Figure 4 shows that results for APEC 9353 exposed in the SPART 14 chamber are in good agreement with Ci5000 data. However, exposure of APEC 9353 in the unfiltered metal halide chambers is much more severe than in the Ci5000 and SPART 14. With the unfiltered metal halide light source, a ~15% loss in τ (400-600) occurs after only 25 days, whereas it took roughly 100 days for an equivalent loss to occur in the Ci5000 and SPART 14.
Task 27 Solar Building Facade Components Subtask B: Durability
Task27-Final report –B3 page 26 of 92
0,0
0,1
0,2
0,3
0,4
0,5
0,6
0,7
0,8
0,9
0 50 100 150
Time of Exposure (months)
τ (40
0-60
0)
NREL 60°C / 60% RHSPF 80°C / 40% RHISE 50°C / 95% RHISE 60°C / 80% RHSPART 14
Figure 4: Accelerated exposure test results for APEC 9353 PC Accelerated exposure test results for Duroglas PVC are provided in Figure 5. Exposure of Duroglas in the unfiltered metal halide chambers at a variety of temperature and RH conditions produced rapid degradation. Results for Ci5000 WOM exposures were less severe, although precipitous degradation did occur in fairly short time periods. Duroglas exposed to the SPART 14 chamber conditions results in considerably less degradation than for the unfiltered metal halide and Ci5000 chamber exposures.
0,0
0,1
0,2
0,3
0,4
0,5
0,6
0,7
0,8
0,9
0 50 100 150
Time of Exposure (months)
τ (40
0-60
0)
NREL 60°C / 60% RHSPF 80°C / 40% RHISE 50°C / 95% RHISE 60°C / 80% RHSPART 14
Figure 5: Accelerated exposure test results for Duroglas PVC The approach developed by the IEA Working Group on Materials for Solar Thermal Collectors [8] is applied below to PVC and UV stabilized PC cover plate materials to illustrate how the general methodology can be used to assess the durability of polymeric-type materials.

Task 27 Solar Building Facade Components Subtask B: Durability
Task27-Final report –B3 page 27 of 92
1.2.5 Analysis of durability results from accelerated ageing Using artificially aged samples from screening tests, changes in the key functional properties or the selected degradation indicators are analyzed with respect to the associated changes in the materials. The analyses were made to identify the predominant degradation mechanisms of the materials. Possible mechanisms of degradation of the PC glazing were assumed to be (a) photooxidation (PO), (b) thermal oxidation, and (c) combined photooxidation and hydrolysis. From the screening tests, it was concluded that only photooxidation contributes significantly to the service life of the glazing. A suitable time-transformation function is:
( )( )refeI
eIa kT/Ep
acckT/Ep
PO −
−
⋅
⋅= (1)
where I is the intensity of photoreactive light, T is temperature, E is an activation energy, p is a material dependent constant, “acc” is accelerated test conditions, and “ref” is some set of reference conditions, e.g., use conditions. For the PVC glazing, degradation mechanisms that could reduce the service life were assumed to be (a) dehydrochlorinization, (b) photooxidation and (c) physical aging. For (a), the mechanism is a chain reaction type because hydrogen chloride formed from the dehydrogenation reaction acts also as a catalyst for this reaction. The reaction is consequently difficult to model mathematically in a simple way and thus, it is also difficult to express the rate of degradation in terms of a time-transformation function. The best time-transformation function for the PVC degradation was the same general photooxidation time-transformation function used to model the degradation of the PC glazing (Equ. 1). During life-testing, PC and PVC glazing materials were exposed to the various accelerated conditions discussed above. Hemispherical transmittance measurements were made to characterize the loss in optical performance of the glazing materials during these exposures. Performance-versus-time data were thereafter used to determine the parameters of the time-transformation function (Equ. 1). The results, obtained from a subset of the data accumulated, are shown in Table 1. Values of the activation energies, E, derived are reasonable for photo-thermal degradation mechanisms. The value of p ~ 2/3 for PVC indicates that some shielding or rate limiting reactions occur and do not allow all photons to participate in degradation. For the UV-stabilized PC sample, the value of p = 1 indicates that exposure of this material follows strict reciprocity. Thus, all incident photons fully contribute to the degradation reactions, even at elevated levels of irradiation.
Task 27 Solar Building Facade Components Subtask B: Durability
Task27-Final report –B3 page 28 of 92
Table 1: coefficients derived from accelerated exposure for the tested polymeric glazing materials Polymer Glazing p E (kJ/mole) PVC 0.669 35.3 UV-Stabilized PC 1.093 28.0
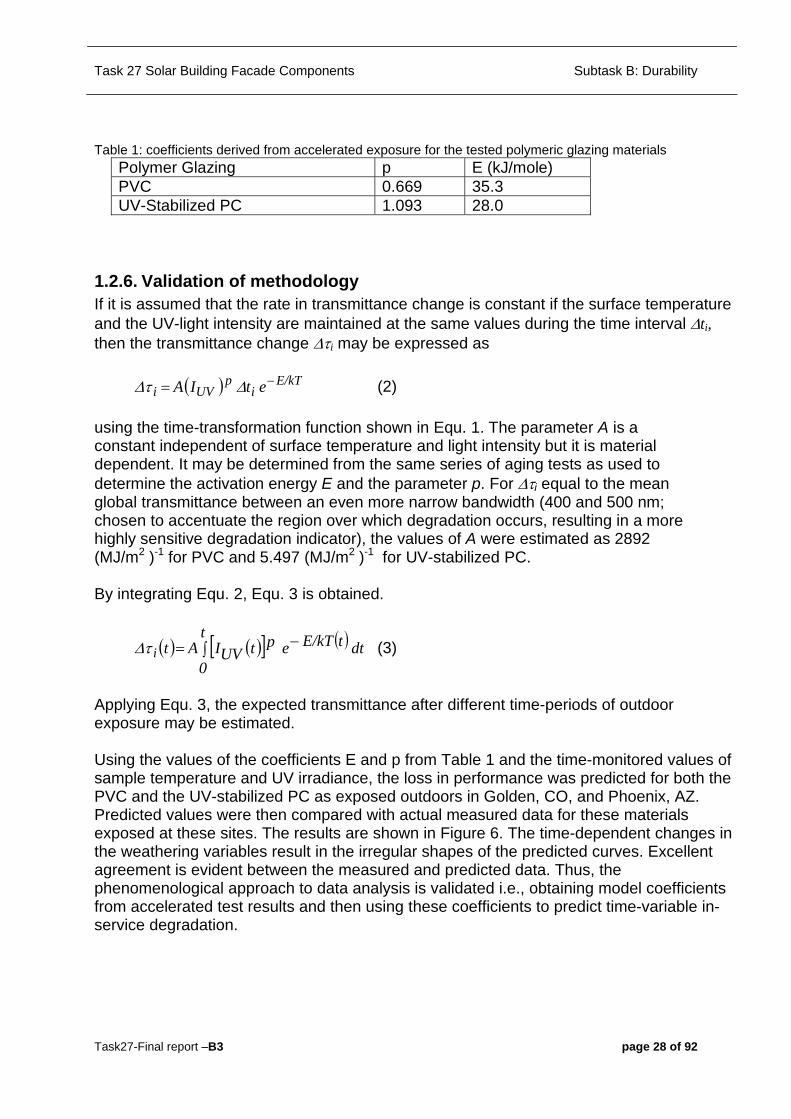
1.2.6. Validation of methodology If it is assumed that the rate in transmittance change is constant if the surface temperature and the UV-light intensity are maintained at the same values during the time interval Δti, then the transmittance change Δτi may be expressed as ( ) E/kT
ip
UVi etIA −= ΔτΔ (2) using the time-transformation function shown in Equ. 1. The parameter A is a constant independent of surface temperature and light intensity but it is material dependent. It may be determined from the same series of aging tests as used to determine the activation energy E and the parameter p. For Δτi equal to the mean global transmittance between an even more narrow bandwidth (400 and 500 nm; chosen to accentuate the region over which degradation occurs, resulting in a more highly sensitive degradation indicator), the values of A were estimated as 2892 (MJ/m2 )-1 for PVC and 5.497 (MJ/m2 )-1 for UV-stabilized PC. By integrating Equ. 2, Equ. 3 is obtained.
( ) ( )[ ] ( )∫ −=t
0dttE/kTeptUVIAtiτΔ (3)
Applying Equ. 3, the expected transmittance after different time-periods of outdoor exposure may be estimated. Using the values of the coefficients E and p from Table 1 and the time-monitored values of sample temperature and UV irradiance, the loss in performance was predicted for both the PVC and the UV-stabilized PC as exposed outdoors in Golden, CO, and Phoenix, AZ. Predicted values were then compared with actual measured data for these materials exposed at these sites. The results are shown in Figure 6. The time-dependent changes in the weathering variables result in the irregular shapes of the predicted curves. Excellent agreement is evident between the measured and predicted data. Thus, the phenomenological approach to data analysis is validated i.e., obtaining model coefficients from accelerated test results and then using these coefficients to predict time-variable in-service degradation.

Task 27 Solar Building Facade Components Subtask B: Durability
Task27-Final report –B3 page 29 of 92
1.2.7 Conclusions Durability test data for both accelerated laboratory conditions and outdoor in-service conditions have been presented for PC and PVC glazing materials. Some of the accelerated exposure data were used to demonstrate how to derive damage functions that allow prediction of performance degradation. This methodology also allows the effect of multiple stress factors to be modelled. The usefulness and validity of this approach has then been confirmed by comparing predicted results with actual measured data for samples exposed to variable outdoor conditions. Consequently, highly abbreviated testing times at elevated stress conditions can be substituted for long-time exposures at lower stress levels. The procedure developed allows much shorter development cycle times for
0
0.05
0.1
0.15
0.2
0.25
0.3
0.35
0 50 100 150 200 250 300 350 400
Time of Exposure (days)
Cha
nge
in T
rans
mitt
ance
Measured; PC; COPredicted; PC; COMeasured; PVC; COPredicted; PVC; COMeasured; PC; AZPredicted; PC; AZMeasured; PVC; AZPredicted; PVC; AZ
Predicted; PC; CO
Predicted; PC; AZ
Predicted; PVC; CO
Predicted; PVC; AZ
Figure 6: Comparison of the actual and predicted changes (loss) in hemispherical transmittance between 400-500 nm of PVC and PC for exposures of up to 380 days at Golden, CO and Phoenix, AZ.

Task 27 Solar Building Facade Components Subtask B: Durability
Task27-Final report –B3 page 30 of 92
new materials and allows improvements to be identified and readily incorporated into new products.
1.2.8 References [1] Davidson, J. H., Mantell, S. C., and Jorgensen, G. J., “Status of Development of Polymeric Solar Water Heating Systems”, Advances in Solar Energy, An Annual Review of Research and Development, Vol. 15, D. Y. Goswami, Ed., American Solar Energy Society, Inc., Boulder, CO, 2003, pp. 149-186. [2] Möller, K., “Identification of New Types of Transparent Polymeric Materials”, IEA Task 10 Working Group on Materials in Solar Thermal Collectors Report, November 8, 1996. [3] Raman, R. et al, “A Review of Polymer Materials for Solar Water Heating Systems”, Journal of Solar Energy Engineering, Vol. 122, No. 2, May 2000, pp. 92-100. [4] “Solar Hot Water Heating Systems Identification of Plastic Materials for Low Cost Glazings”, NREL Subcontract No. TAR-9-29449-02 final report, PolyNEW Inc., Golden, CO, 2000. [5] Jorgensen, G. J., et al, “Case Study on Polymeric Glazings”, Performance and Durability Assessment of Optical Materials for Solar Thermal Systems, A. W. Czamderna, Ed., Elsevier Science, in press. [6] SAE J1960, Accelerated Exposure of Automotive Exterior Materials Using a Controlled Irradiance Water-Cooled Xenon Arc Apparatus. Society of Automotive Engineers, 400 Commonwealth Drive, Warrendale, PA 15096. [7] Jorgensen G., et al, “Use of Uniformly Distributed Concentrated Sunlight for Highly Accelerated Testing of Coatings”, Service Life Prediction Methodology and Metrologies, ACS Symposium Series 805, J. W. Martin and D. R. Bauer, Eds., American Chemical Society, Oxford University Press, Washington, DC, 2002, 100-118. [8] Carlsson, B., et al, “Weathering of Polymer Products: Assessment of Service Life of Solar Thermal Components by Accelerated Life Testing”, Proceedings of the 1st European Weathering Symposium EWS (XXIIIrd Colloquium of Danubian Countries on Natural and Artificial Ageing of Polymers), Gesellschaft für Umweltsimulation e.V., Prague, Czech Republic, September 25-26, 2003.

Task 27 Solar Building Facade Components Subtask B: Durability
Task27-Final report –B3 page 31 of 92
Case study 2: Reflectors Case study leader: Markus Heck Fraunhofer Institute for Solar Energy Systems ISE, Heidenhofstrasse 2, D-79110 Freiburg, Germany, e-mail: [email protected] The general methodology of project B1 and the contributions from CSTB and SP were used to perform an initial risk analysis for reflectors. The contributions can be found in the annex of the preceeding document (r-b3-ISE-MH-Failure mode analysis reflectors-meeting-1-2001) of this working document.
2.1 Structural Analysis This component is generally made of a multi-layer system on substrates like polymers or aluminium with protective/functional coatings on top. Possible is also silvered glass. The reflector could be in contact with insulation material or/and the material of the box (polyester, steel, aluminium) using glue, screws or rivets. Environment UV T°C high (170°C) T°C Low Thermal shocks Pollutants (atmospheric: acid) Air (oxygen, ozone, …) Humidity (Rain and condensation) Shocks (hail, users) Fluid (Water + antifreeze)

Task 27 Solar Building Facade Components Subtask B: Durability
Task27-Final report –B3 page 32 of 92
2.2 Specification of end-user and product requirements Function and general requirements
General requrements for long-term performance during design service time
In-use conditions and severity of environmental stress
Efficiently reflect solar radiation Protect the reflector substrate against the outdoor environment
Loss in material perfor-mance should not result in reduction of the solar system performance with more than 5%, in relative sense, during the material service life. No delamination of reflector from substrate Material service life should exceed 25 years
Unprotected reflector UV lowest ambient <T<170°C Air pollutants Humidity/Wetness Acid rain Mechanical loads (hail,wind, birds, stress from mechanical fixing and due to the own weight) Icing Cleaning as required to maintain system-performance
2.3 Specification of functional properties and requirements on component and its material Critical functional properties
Test method for determining functional properties
Requirement for functional capability and long-term performance
Reflectance (specular, diffus)
UV-VIS-IR reflectance spectroscopy
ASTM E903-96 „Standard test method for solar Absorptance, Reflectance, and Transmittance of Materials Using Integrating Spheres“ PC=0.35*delta-rho-specular+0.1/C*delta-rho-diffuse
Adhesion between coating and substrate
Adhesion testing ASTM tape test Gitterschnitt
No blistering ISO 4624:2002 „Pull-off test for adhesion“ Adhesion > 1 MPa ISO 2409:1992 „Paints and varnishes - Cross cut test“ Degree 0 or 1
Task 27 Solar Building Facade Components Subtask B: Durability
Task27-Final report –B3 page 33 of 92
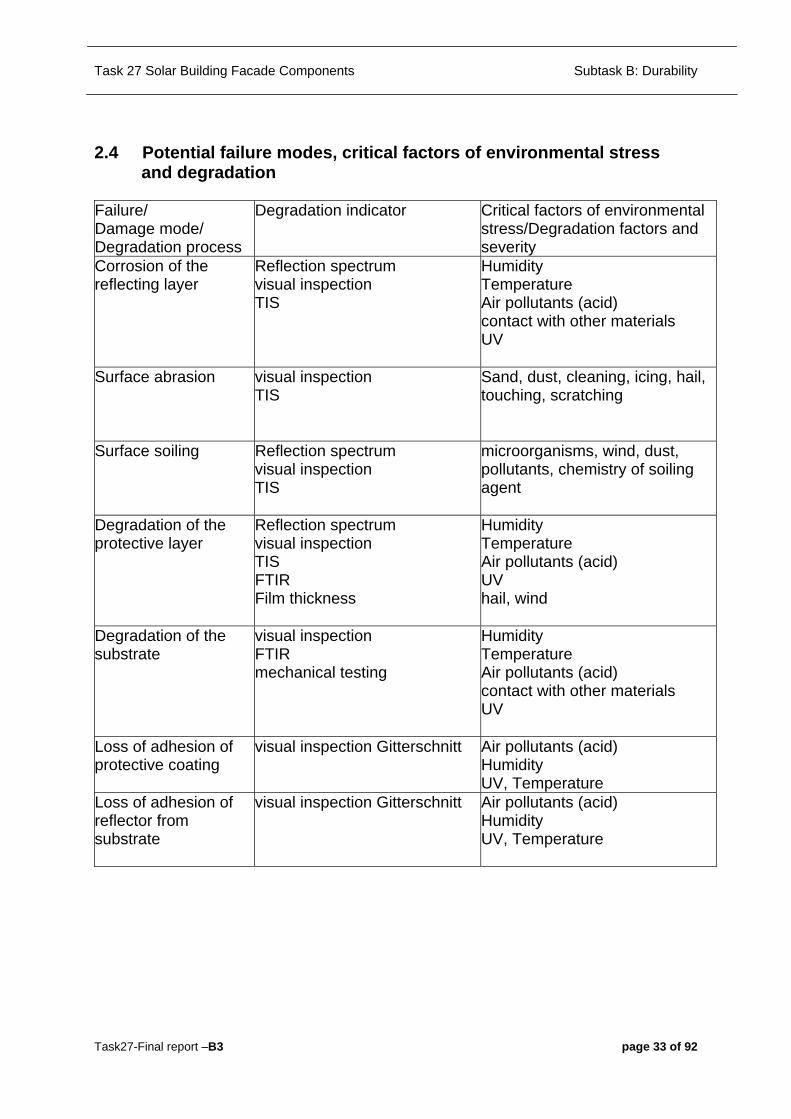
2.4 Potential failure modes, critical factors of environmental stress and degradation
Failure/ Damage mode/ Degradation process
Degradation indicator Critical factors of environmental stress/Degradation factors and severity
Corrosion of the reflecting layer
Reflection spectrum visual inspection TIS
Humidity Temperature Air pollutants (acid) contact with other materials UV
Surface abrasion visual inspection TIS
Sand, dust, cleaning, icing, hail, touching, scratching
Surface soiling Reflection spectrum visual inspection TIS
microorganisms, wind, dust, pollutants, chemistry of soiling agent
Degradation of the protective layer
Reflection spectrum visual inspection TIS FTIR Film thickness
Humidity Temperature Air pollutants (acid) UV hail, wind
Degradation of the substrate
visual inspection FTIR mechanical testing
Humidity Temperature Air pollutants (acid) contact with other materials UV
Loss of adhesion of protective coating
visual inspection Gitterschnitt
Air pollutants (acid) Humidity UV, Temperature
Loss of adhesion of reflector from substrate
visual inspection Gitterschnitt Air pollutants (acid) Humidity UV, Temperature

Task 27 Solar Building Facade Components Subtask B: Durability
Task27-Final report –B3 page 34 of 92
2.5 Risk assessment and service reliability for commercial Al reflectors Failure mode / Degradation process
Severity (S) (rating number)
Probability of occurrence(PO) (rating number)
Probability of discovery(PD) (rating number)
Rating-number for risk (RPN = S⋅ PO ⋅ PD)
Severity Rating number
Probability of detection
Rating number
Probability of occurance
Rating number
No effect on product 1 Failure which always is noted. Probability for detection > 99.99%
1 Unlikely that failure will occur
1
Minor effect on product but no effect on product function
2-3 Normal probability of detection 99.7%
2-4 Very low probability for failure to occur
2-3
Risk of failure in product function
4-6 Certain probability of detection >95%
5-7 Low probability for failure
4-5
Certain failure in product functioning
7-9 Low probability of detection >90%
8-9 Moderate probability for failure to occur
6-7
Failure which may affect personal safety
10 Failures will not be found - cannot be tested
10 High probability for failure to occur
8-9
Very high probability for failure to occur
10

Task 27 Solar Building Facade Components Subtask B: Durability
Task27-Final report –B3 page 35 of 92
2.6 Risk assessment and service reliability for reflectors Failure/Damage mode / Degradation process
Degradation indicator
Critical factors of environmental stress/ Degradation factors and severity
Estimated risk of failure/damage mode from FMEA
S PO PD Risk RPN
Degradation of the protective layer
Reflectance spectrum visual inspection TIS FTIR Film thickness
Humidity Temperature Air pollutants (acid) UV hail, wind
5 5 2 50
Corrosion of the reflecting layer
Reflectance spectrum visual inspection TIS
Humidity Temperature Air pollutants (acid) contact with other materials UV
8 5 4 160
Surface abrasion
visual inspection TIS
Sand, dust, cleaning, icing, hail, touching, scratching
5 5 2 50
Surface soiling Reflectance spectrum visual inspection TIS
microorganisms, wind, dust, pollutants, chemistry of soiling agent
4 7 2 56
Degradation of the substrate
visual inspection FTIR mechanical testing
Humidity Temperature Air pollutants (acid) contact with other materials UV
8 2 2 32
Loss of adhesion of protective coating
visual inspection Cross cut
Air pollutants (acid) Humidity UV, Temperature
7 5 2 70
Loss of adhesion of reflector from substrate
visual inspection Cross cut
Air pollutants (acid) Humidity UV, Temperature
7 5 2 70
*In many high temperature applications the limitation in durability is caused by physical loss of stabilisers e.g.antioxidants, UV-absorbers, HALS, etc **If photoxidation is not important (as for most inorganic coatings) than PO = 1 and RPN is very low
Task 27 Solar Building Facade Components Subtask B: Durability
Task27-Final report –B3 page 36 of 92
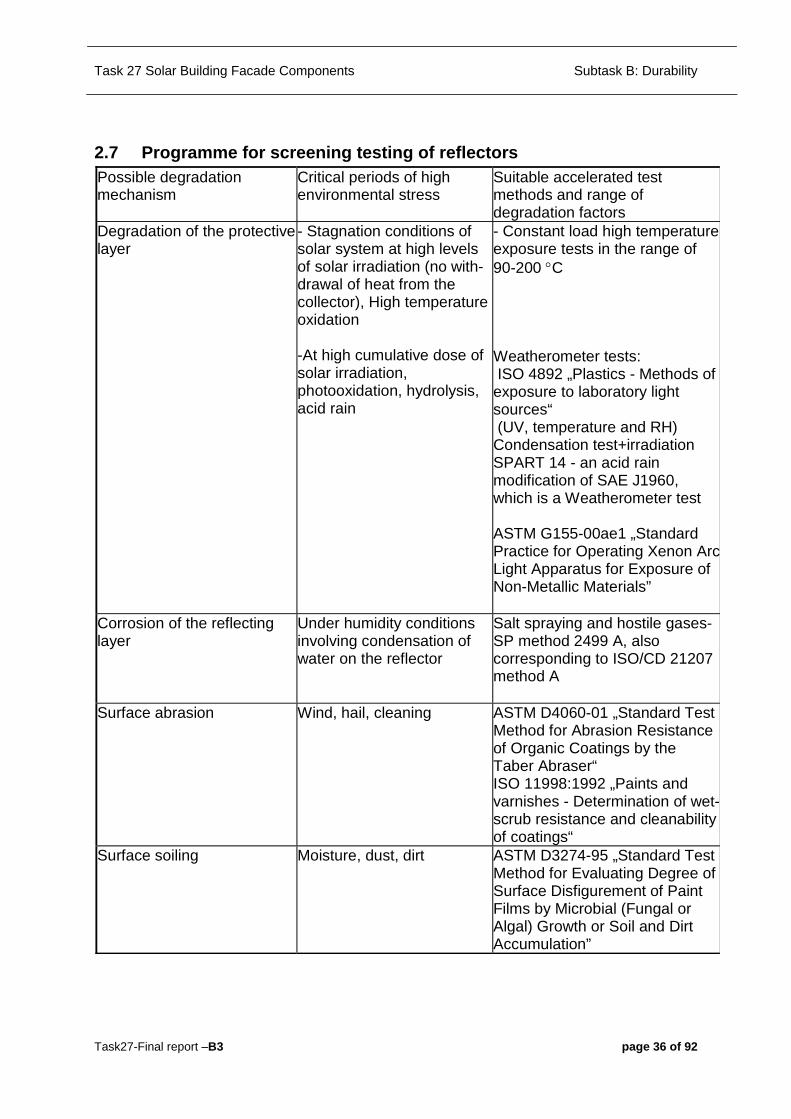
2.7 Programme for screening testing of reflectors Possible degradation mechanism
Critical periods of high environmental stress
Suitable accelerated test methods and range of degradation factors
Degradation of the protective layer
- Stagnation conditions of solar system at high levels of solar irradiation (no with-drawal of heat from the collector), High temperature oxidation -At high cumulative dose of solar irradiation, photooxidation, hydrolysis, acid rain
- Constant load high temperature exposure tests in the range of 90-200 °C Weatherometer tests: ISO 4892 „Plastics - Methods of exposure to laboratory light sources“ (UV, temperature and RH) Condensation test+irradiation SPART 14 - an acid rain modification of SAE J1960, which is a Weatherometer test ASTM G155-00ae1 „Standard Practice for Operating Xenon Arc Light Apparatus for Exposure of Non-Metallic Materials”
Corrosion of the reflecting layer
Under humidity conditions involving condensation of water on the reflector
Salt spraying and hostile gases-SP method 2499 A, also corresponding to ISO/CD 21207 method A
Surface abrasion
Wind, hail, cleaning
ASTM D4060-01 „Standard Test Method for Abrasion Resistance of Organic Coatings by the Taber Abraser“ ISO 11998:1992 „Paints and varnishes - Determination of wet-scrub resistance and cleanability of coatings“
Surface soiling Moisture, dust, dirt ASTM D3274-95 „Standard Test Method for Evaluating Degree of Surface Disfigurement of Paint Films by Microbial (Fungal or Algal) Growth or Soil and Dirt Accumulation”

Task 27 Solar Building Facade Components Subtask B: Durability
Task27-Final report –B3 page 37 of 92
Degradation of the substrate Moisture, pollutants, acid rain, hail
Hail: ASTM E822-92(1996) „Standard Practice for Determining Resistance of Solar Collector Covers to Hail by Impact With Propelled Ice Balls” ASTM E1038-98 „Standard Test Method for Determining Resistance of Photovoltaic Modules to Hail by Impact with Propelled Ice Balls”
Loss of adhesion of protective coating
Moisture, pollutants, acid rain, hail, icing, UV, Thermal expansion
Hail: ASTM E822-92(1996) „Standard Practice for Determining Resistance of Solar Collector Covers to Hail by Impact With Propelled Ice Balls” ASTM E1038-98 „Standard Test Method for Determining Resistance of Photovoltaic Modules to Hail by Impact with Propelled Ice Balls” EN 12975-2 Kap 5.10 „Impact resistance test“ Icing: Build up of ice layers MIL-STD 810 E, Method 521 ”Icing /Freezing rain” ISO 2653, Ice formation, Test C Frost appearance IEC 60068-2-39,Z/AMD, Combined sequential cold, low air pressure and damp heat test Thermal expansion: IEC 60068-2-14, Test N, Change of temperature MIL-STD 810 E, Method 503.3, "Temperature shock" ISO 10545 - Part 9 Ceramic tiles - Determination of resistance to thermal shock
*During outdoor exposure it is, of course, impossible to distinguish between high temperature and photo induced oxidation.

Task 27 Solar Building Facade Components Subtask B: Durability
Task27-Final report –B3 page 38 of 92
2.8 Suitable accelerated test methods and range of degradation factors Degradation mechanism Techniques for analysis of
material changes Expected results
Degradation of the protective layer (High temperature oxidation, Photooxidation, Hydrolysis)
UV-VIS-NIR spectroscopy IR- spectroscopy DSC (OIT) SEM TOF-SIMS/ESCA Mechanical testing AES, GDOS Adhesion testing (
Reduction of reflectance in solar range Changes in colour Chemical changes, e.g. formation of OH- groups could be observed Changes in stabilisation Small changes in surface morphology Chemical changes Changes in mechanical properties- adhesion between coating and superstrate
Corrosion of the reflecting layer (High temperature oxidation, Hydrolysis)
UV-VIS-NIR spectroscopy IR- spectroscopy DSC (OIT) SEM TOF-SIMS/ESCA Mechanical testing AES, GDOS Adhesion testing (
Reduction of reflectance in solar range Changes in colour Chemical changes, e.g. formation of OH- groups could be observed Changes in stabilisation Small changes in surface morphology Chemical changes Changes in mechanical properties- adhesion between coating and substrate
Surface abrasion
UV-VIS-NIR spectroscopy visual inspection optical microscopy gloss measurement
Reduction in direct reflectance, Changes in gloss
Surface soiling UV-VIS-NIR spectroscopy IR- spectroscopy visual inspection optical microscopy gloss measurement DSC (OIT) SEM TOF-SIMS/ESCA AES, GDOS
Changes of reflectance in solar/IR range Changes in surface topology Changes in gloss

Task 27 Solar Building Facade Components Subtask B: Durability
Task27-Final report –B3 page 39 of 92
Degradation of the substrate (High temperature oxidation, Photooxidation, Hydrolysis)
UV-VIS-NIR spectroscopy IR- spectroscopy DSC (OIT) SEM TOF-SIMS/ESCA Mechanical testing AES, GDOS Adhesion testing (
Reduction of reflectance in solar range Changes in colour Chemical changes, e.g. formation of OH- groups could be observed Changes in stabilisation Small changes in surface morphology Chemical changes Changes in mechanical properties- adhesion between coating and substrate
Loss of adhesion of protective coating
visual inspection, Gitterschnitt, adhesion testing
Loss of adhesion of protective coating Blistering
Loss of adhesion of reflector from substrate
visual inspection, Cross cut, adhesion testing
Loss of adhesion of reflector from substrate

Task 27 Solar Building Facade Components Subtask B: Durability
Task27-Final report –B3 page 40 of 92
2.9 Techniques used for measurement of degradation factors at reflectors Degradation mechanism
Degradation factors/ Measurement variables
Sensors
High temperature degradation
Temperature: Surface temperature of reflector
RTD sensors (Pt-Sensors, Thermocouples)
Photooxidation Solar irradiation: Outdoor Rasdiation sensors (Pyranometer, UV-sensors)
Hydrolysis in combination with photooxidation
Humidity: Measurement of air humidity close to the reflector
Capacitance humidity sensors carefully shielded from solar radiation and thermal radiation of the ambient
Effects of acid rain Atmospheric corrosivity: Measurement of corrosion mass loss rate of standard metal specimens/coupons. Coupons are exposed close to reflector Air pollutants: Measurement of sulphur dioxide concentra-tion close to reflector.
Metal coupons of carbon steel, zinc and copper and evaluation of corrosion mass loss according to ISO 9226 Exposed metal coupons analysed in respect of the sulphate content of the corrosion products by EDX UV-fluorescence instrument for direct measurement of sulphur dioxide concentration close to reflector.
2.10 Sample selection Pure Al: The pure Aluminium sample is manufactured by Alanod. It is an aluminium alloy with an content of 99.85% Al and the only fabrication step is degreasing. Anodized Al: This sample is also manufactured by Alanod. Fabrication steps are degreasing, polishing, anodizing with a thickness of the coating on the front side of 1 to 1.2 µm and on the backside of 0.7 µm. Miro 4: same as Anodized Al plus e-beam coated Al (99.99%), about 60nm thick, plus SiO2 (99.9%) reactive with Oxygen, about 80nm, plus TiO2 (99.8%) reactive with Oxygen, about 50nm thick Miro 27KK: same as Miro 4, plus Cl/F-protection laquer (about 10-12µm) on Frontside, standard transparent protection laquer on backside SO790 (Solaroberfläche790): sample from Alcan (Alusuisse), Al-substrate(Al99,85), anodized (about 200 nm) plus ceramic laquer (Si-based) of about 3-4 µm. Glass samples: This sample comes from Naugatuck Glass (US), silvered glass sample, thickness is 1.2 mm.

Task 27 Solar Building Facade Components Subtask B: Durability
Task27-Final report –B3 page 41 of 92
Laminate sample: This experimental material is not yet commercially available in the U.S. and was distributed by NREL. Samples are a laminate construction (UV-screening acrylic film laminated to a silvered polyester film) bonded on an aluminium substrate. Skultuna #5 (more specular): 250µm Polyester-substrate with 9µm Al-Reflector, protected with 60µm PMMA Skultuna #6 (more diffuse): 250µm Polyester-substrate with 9µm Al-Reflector, protected with an acrylic varnish Steel substrate samples: the reflector consist of a foil laminated on steel. The steel grade is in Swedish: "Aluzink B500 A AZ 150" from the steel factory SSAB. The foil comes from Skultuna Flexible, Västerås, Sweden: It consists of from the bottom: PET 15 µm /Al foil 9 µm/metalized Al 200 Å/ PET 59 µm UV-stabilized.
2.11 Fault tree analysis of reflectors
A. Degradation of protective coating on reflector
B1 Insufficient coating of reflective layer at production
A4 Soiling
A5 Erosion
A1 Ageing with material decomposition and loss in barrier properties
A2 Loss in protective capability due to mechanical damage
A3 Loss in adhesion to reflective layer
D1 Loss in adhesion of reflective layer to substrate
D2 Degradation substrate
Increase
of absorp-tion and scattering
Increase of surface roughness
C1 Corrosion of reflective layer
Loss of reflector
performance

Task 27 Solar Building Facade Components Subtask B: Durability
Task27-Final report –B3 page 42 of 92
Failure/Damage mode / Degradation process
Degradation indicator
Critical factors of environmental stress
Estimated risk of failure/damage mode from FMEA
S PO PD RPNUnacceptable loss in reflector-performance
PC = -0.35·�ρs - 0.1/(1.5·�ρd)
A. Degradation of protective coating on reflector
A1. Ageing with material decomposition (may result in A3) and loss in barrier properties resulting in C1
Visual inspection Change in IR characteristics (FTIR, TIS)
Humidity, Temperature, Air pollutants (acid) UV irradiation
5 5 2 50
A2. Loss of protective capability due to mechanical damage resulting in C1
Visual inspection Mechanical impact
A3.Surface erosion
Visual inspection Surface morphology (SEM) Film thickness
Sand, dust, cleaning, icing, hail, touching, scratching
5 5 2 50
A4. Surface soiling Visual inspection, Surface morphology (SEM), Change in VIS IR characteristics (FTIR, TIS), Surface composition (EDX, AES, TOF-SIMS)
microorganisms, wind, dust, pollutants, chemistry of soiling agent
4 7 2 56
A5. Loss of adhesion of protective coating to reflecting layer
Visual inspection, Adhesion
Air pollutants (acid), Humidity, UV, Temperature
7 5 2 70
B1 Insufficient coating of the reflector at production resulting in C1
Film thickness Human impact
C1 Corrosion of the reflecting layer
Visual inspection, Surface morphology and composition (SEM and EDX, AES, TIS)
Coating with insufficient protective capability (A1-A3,B1), Humidity, Temperature,Air pollutants (acid) contact with other materials
8 5 4 160
D1. Loss of adhesion of reflector from
Visual inspection,Adhesion
Corroded reflective layer,Degraded substrate
7 5 2 70

Task 27 Solar Building Facade Components Subtask B: Durability
Task27-Final report –B3 page 43 of 92
For the case-study reflectors samples are exposed in different participating labs: Indoor Outdoor CSTB ENEA ISE INETI SP Vattenfall SPF NREL UU Samples exposed are: pure Al, anodized Al, Miro4, Miro27KK from Alanod, SO 790 from Alusuisse, two different Aluminium foils from Skultuna Flexible AB (Vattenfall, Sweden), thin silvered glass from Naugatuck and an experimental laminated material (NREL). Pure Aluminium and anodized Aluminium are used as reference materials. Indoor tests performed in the different labs are:
Lab Test method CSTB WOM test according to ISO 4892: 55°C/50%/UV
with 0.5W/m²@340nm, water spray 18min in 2hours
ISE condensation at 40°C sample temperature with and without UV and at 60°C sample temperature with UV
SP pollutants tests according to SP method 2499 A and modified A without salt spray (ISO/CD 21207 -pollutants test in artificial atmosphere-)
SPF Temperature test at 80°C/UV NREL WOM test 60°C/60% relative humidity at a one-
sun light intensity UU Cycling test 80°C/85% and 40°C/50%

Task 27 Solar Building Facade Components Subtask B: Durability
Task27-Final report –B3 page 44 of 92
2.12 Some results from outdoor exposure Performance criterion vs. exposure time
0 200 400 600 800 1000 1200 1400 1600-0.01
0.00
0.01
0.02
0.03
0.04
0.05
0.06
0.07
0.08
0.09
0.10
0.11
0.12
miro4pfc
Per
form
ance
crit
erio
n [-]
Time of exposure [days]
F (CSTB) never cleaned D (ISE) cleaned S (SP) cleaned CH (SPF) cleaned S (VAT) cleaned
0 200 400 600 800 1000 1200 1400 1600-0.01
0.00
0.01
0.02
0.03
0.04
0.05
0.06
0.07
0.08
0.09
0.10
0.11
0.12
so790pfc
Per
form
ance
crit
erio
n [-]
Time of exposure [days]
F (CSTB) never cleaned D (ISE) cleaned S (SP) cleaned CH (SPF) cleaned S (VAT) cleaned

Task 27 Solar Building Facade Components Subtask B: Durability
Task27-Final report –B3 page 45 of 92
0 200 400 600 800 1000 1200 1400 1600-0.01
0.00
0.01
0.02
0.03
0.04
0.05
0.06
0.07
0.08
0.09
0.10
0.11
0.12
naugatuckpfc
Per
form
ance
crit
erio
n [-]
Time of exposure [days]
F (CSTB) never cleaned D (ISE) cleaned S (SP) cleaned CH (SPF) cleaned S (VAT) cleaned
0 200 400 600 800 1000 1200 1400 1600-0.01
0.00
0.01
0.02
0.03
0.04
0.05
0.06
0.07
0.08
0.09
0.10
0.11
0.12
alupfc
Per
form
ance
crit
erio
n [-]
Time of exposure [days]
F (CSTB) never cleaned D (ISE) cleaned S (SP) cleaned CH (SPF) cleaned S (VAT) cleaned

Task 27 Solar Building Facade Components Subtask B: Durability
Task27-Final report –B3 page 46 of 92
The same samples, also performance criterion, but results from indoor tests
0 100 1000 10000
0.00
0.02
0.04
0.06
0.08
0.10
0.12
0.14
0.16
0.18
0.20
0.22
0.24
miro4pfc
Per
form
ance
crit
erio
n
time [hours]
Temperature test@80°C + UV Condensation test@60°C + UV SP method 2499 A-ISO/CD 21207A salt spray modified SP method 2499 A without salt spray WOM 55°C/50% UV Cyclic Test 80°C/85% - 40°C/50%
0 100 1000 10000
0.00
0.02
0.04
0.06
0.08
0.10
0.12
0.14
0.16
0.18
0.20
0.22
0.24
so790pfc
Per
form
ance
crit
erio
n
time [hours]
Temperature test@80°C + UV Condensation test@60°C + UV SP method 2499 A-ISO/CD 21207A salt spray modified SP method 2499 A without salt spray WOM 55°C/50% UV Cyclic Test 80°C/85% - 40°C/50%
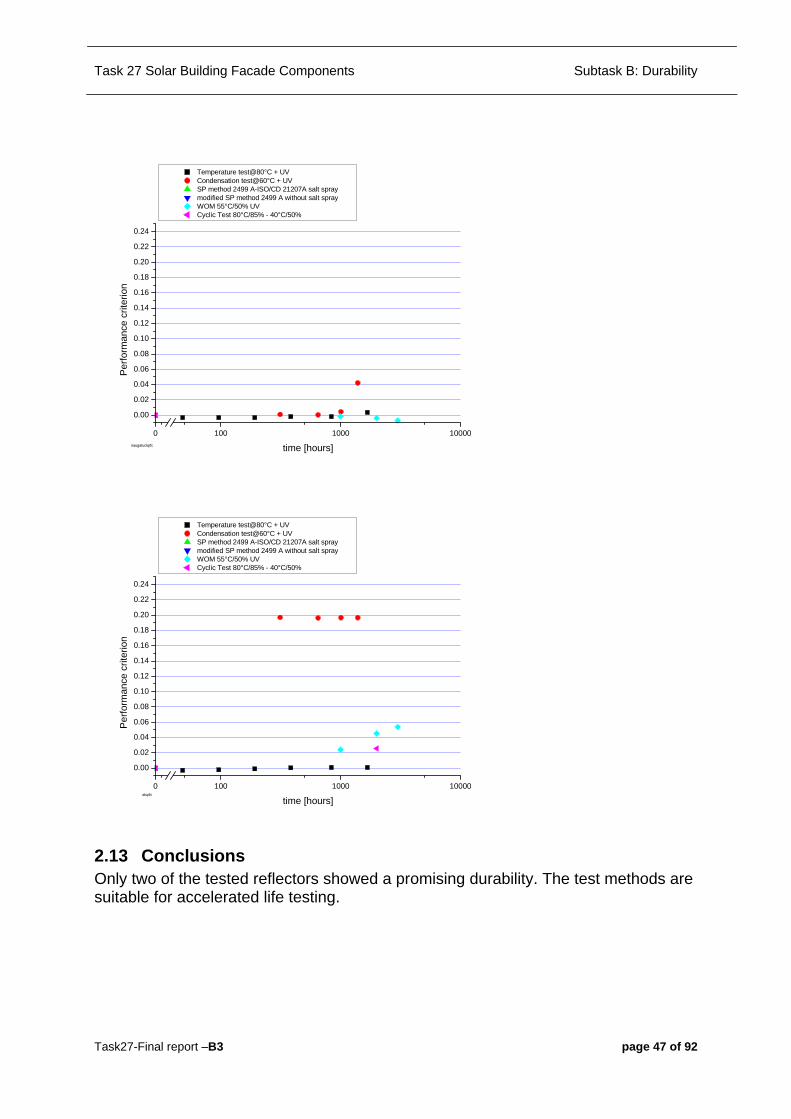
Task 27 Solar Building Facade Components Subtask B: Durability
Task27-Final report –B3 page 47 of 92
0 100 1000 10000
0.00
0.02
0.04
0.06
0.08
0.10
0.12
0.14
0.16
0.18
0.20
0.22
0.24
naugatuckpfc
Per
form
ance
crit
erio
n
time [hours]
Temperature test@80°C + UV Condensation test@60°C + UV SP method 2499 A-ISO/CD 21207A salt spray modified SP method 2499 A without salt spray WOM 55°C/50% UV Cyclic Test 80°C/85% - 40°C/50%
0 100 1000 10000
0.00
0.02
0.04
0.06
0.08
0.10
0.12
0.14
0.16
0.18
0.20
0.22
0.24
alupfc
Per
form
ance
crit
erio
n
time [hours]
Temperature test@80°C + UV Condensation test@60°C + UV SP method 2499 A-ISO/CD 21207A salt spray modified SP method 2499 A without salt spray WOM 55°C/50% UV Cyclic Test 80°C/85% - 40°C/50%
2.13 Conclusions Only two of the tested reflectors showed a promising durability. The test methods are suitable for accelerated life testing.
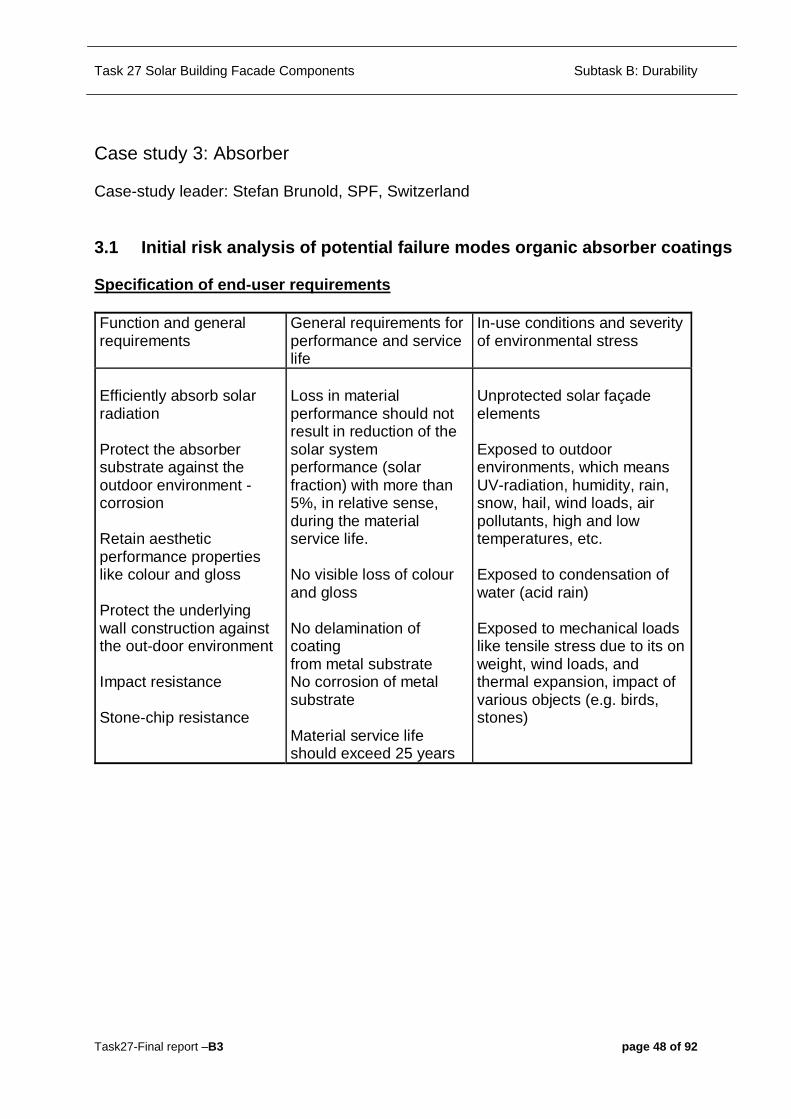
Task 27 Solar Building Facade Components Subtask B: Durability
Task27-Final report –B3 page 48 of 92
Case study 3: Absorber Case-study leader: Stefan Brunold, SPF, Switzerland 3.1 Initial risk analysis of potential failure modes organic absorber coatings Specification of end-user requirements Function and general requirements
General requirements for performance and service life
In-use conditions and severity of environmental stress
Efficiently absorb solar radiation Protect the absorber substrate against the outdoor environment - corrosion Retain aesthetic performance properties like colour and gloss Protect the underlying wall construction against the out-door environment Impact resistance Stone-chip resistance
Loss in material performance should not result in reduction of the solar system performance (solar fraction) with more than 5%, in relative sense, during the material service life. No visible loss of colour and gloss No delamination of coating from metal substrate No corrosion of metal substrate Material service life should exceed 25 years
Unprotected solar façade elements Exposed to outdoor environments, which means UV-radiation, humidity, rain, snow, hail, wind loads, air pollutants, high and low temperatures, etc. Exposed to condensation of water (acid rain) Exposed to mechanical loads like tensile stress due to its on weight, wind loads, and thermal expansion, impact of various objects (e.g. birds, stones)

Task 27 Solar Building Facade Components Subtask B: Durability
Task27-Final report –B3 page 49 of 92
3.2 Specification of functional properties and requirements Critical functional property Test method for functional
property Requirement for functional capability or performance
Solar absorptance, �s Emittance, � Colour Gloss Adhesion between coating and metal substrate Corrosion of metal substrate
UV-VIS-IR-reflectance spectroscopy As above or CIE, ISO 7724 As above or glossmeter Tensile testing
PC=-� �s + 0.25� ≤0.05 �E ≤5 ≤20% ≥0.05 MPa No corrosion
3.3 Risk assessment of potential failure modes by use of FMEA applied to polymeric façade absorbers
Failure mode / Degradation process
Severity (S) (rating number)
Probability of occurrence(PO)(rating number)
Probability of discovery(PD) (rating number)
Rating-number for risk (RPN = S⋅ PO ⋅ PD)
Severity Rating number
Probability of detection
Rating number
Probability of occurance
Rating number
No effect on product 1 Failure which always is noted. Probability for detection > 99.99%
1 Unlikely that failure will occur
1
Minor effect on product but no effect on product function
2-3 Normal probability of detection 99.7%
2-4 Very low probability for failure to occur
2-3
Risk of failure in product function
4-6 Certain probability of detection >95%
5-7 Low probability for failure
4-5
Certain failure in product functioning
7-9 Low probability of detection >90%
8-9 Moderate probability for failure to occur
6-7
Failure which may affect personal safety
10 Failures will not be found - cannot be tested
10 High probability for failure to occur
8-9
Very high probability for failure to occur
10

Task 27 Solar Building Facade Components Subtask B: Durability
Task27-Final report –B3 page 50 of 92
3.4 Risk assessment and service reliability for polymeric façade absorbers Failure/Damage mode / Degradation process
Degradation indicator Critical factors of environmental stress/ Degradation factors and severity
Estimated risk of failure/damage mode from FMEA
Unacceptable loss in optical performance Adhesion/delamination
PC = - ��s Changes in colour and gloss Adhesion>0.15 MPa
S PO PD Risk RPN
High temperature oxidation
Reflectance spectra UV-VIS-IR Changes in colour and gloss Adhesion testing
High temperature* 6 8 8
5 7 3
7 2 7
210 112 168
Photooxidation Reflectance spectra UV-VIS-IR Changes in colour and gloss Adhesion testing
UV-radiation, high temperature*.
6 8 8
5 7 3
7 2 7
210 112 168
Hydrolysis in combination with photooxidation
Reflectance spectra UV-VIS-IR Changes in colour and gloss Adhesion testing
Humidity, condensa-tion, air pollutants
6 8 8
3 5 3
7 2 7
210 80 168
*In many high temperature applications the limitation in durability is caused by physical loss of stabilisers e. g. antioxidants, UV-absorbers, HALS, etc
3.5 Programme for screening testing of polymeric facade absorbers
Possible degradation mechanism
Critical periods of high environmental stress
Suitable accelerated test methods and range of degradation factors
High temperature oxidation*
Stagnation conditions of solar façade absorber at high levels of solar irradiation (no withdrawal of heat from the collector)
Constant load high temperature exposure tests in the range of 90-150 °C.
Photooxidation* At high levels of solar irradiation
Weatherometer tests - ISO 4892(UV, temperature and RH)
Hydrolysis in combination with photo-oxidation
Under humidity conditions involving condensation of water on the absorber
SPART 14 - an acid rain modification of SAE J1960, which is a Weatherometer test
Corrosion of metal substrate after mechanical damage of coating
Under humidity conditions involving condensation of water on the absorber
Salt spraying and hostile gases-SP method 2499 A, also corresponding to ISO/CD 21207 method A
*During outdoor exposure it is, of course, impossible to distinguish between high temperature and photo induced oxidation.
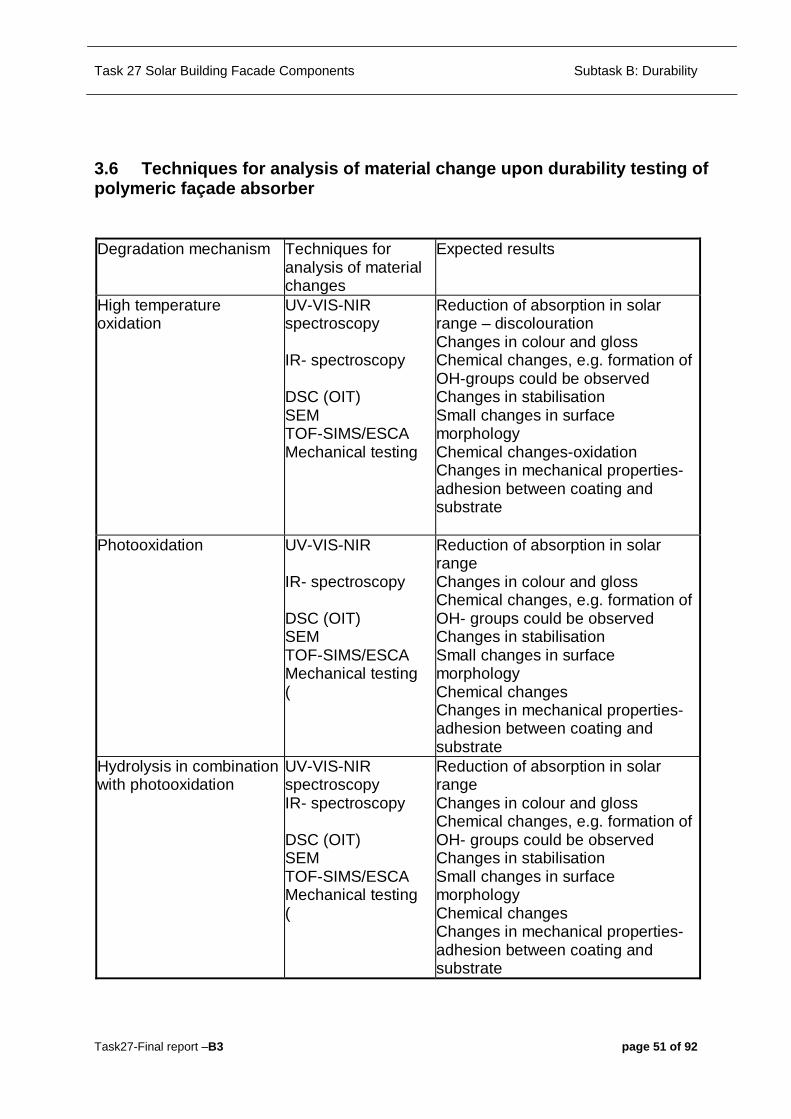
Task 27 Solar Building Facade Components Subtask B: Durability
Task27-Final report –B3 page 51 of 92
3.6 Techniques for analysis of material change upon durability testing of polymeric façade absorber
Degradation mechanism Techniques for
analysis of material changes
Expected results
High temperature oxidation
UV-VIS-NIR spectroscopy IR- spectroscopy DSC (OIT) SEM TOF-SIMS/ESCA Mechanical testing
Reduction of absorption in solar range – discolouration Changes in colour and gloss Chemical changes, e.g. formation of OH-groups could be observed Changes in stabilisation Small changes in surface morphology Chemical changes-oxidation Changes in mechanical properties- adhesion between coating and substrate
Photooxidation UV-VIS-NIR IR- spectroscopy DSC (OIT) SEM TOF-SIMS/ESCA Mechanical testing (
Reduction of absorption in solar range Changes in colour and gloss Chemical changes, e.g. formation of OH- groups could be observed Changes in stabilisation Small changes in surface morphology Chemical changes Changes in mechanical properties- adhesion between coating and substrate
Hydrolysis in combination with photooxidation
UV-VIS-NIR spectroscopy IR- spectroscopy DSC (OIT) SEM TOF-SIMS/ESCA Mechanical testing (
Reduction of absorption in solar range Changes in colour and gloss Chemical changes, e.g. formation of OH- groups could be observed Changes in stabilisation Small changes in surface morphology Chemical changes Changes in mechanical properties- adhesion between coating and substrate
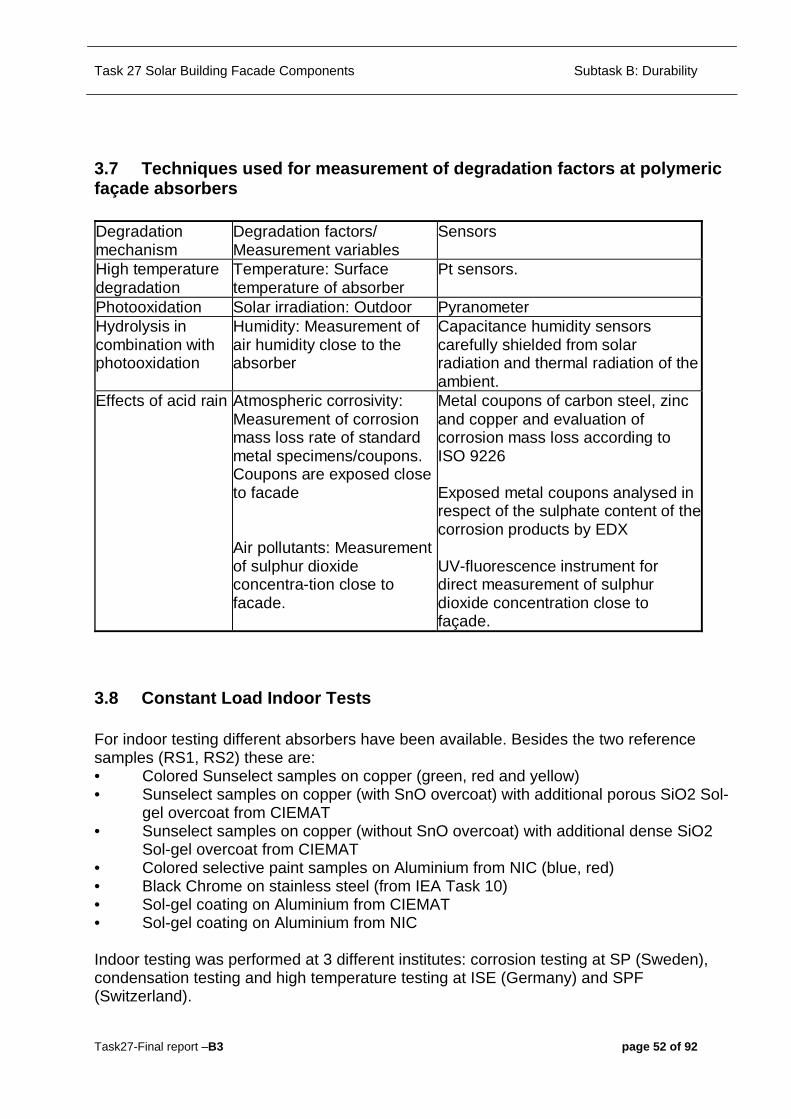
Task 27 Solar Building Facade Components Subtask B: Durability
Task27-Final report –B3 page 52 of 92
3.7 Techniques used for measurement of degradation factors at polymeric façade absorbers Degradation mechanism
Degradation factors/ Measurement variables
Sensors
High temperature degradation
Temperature: Surface temperature of absorber
Pt sensors.
Photooxidation Solar irradiation: Outdoor Pyranometer Hydrolysis in combination with photooxidation
Humidity: Measurement of air humidity close to the absorber
Capacitance humidity sensors carefully shielded from solar radiation and thermal radiation of the ambient.
Effects of acid rain Atmospheric corrosivity: Measurement of corrosion mass loss rate of standard metal specimens/coupons. Coupons are exposed close to facade Air pollutants: Measurement of sulphur dioxide concentra-tion close to facade.
Metal coupons of carbon steel, zinc and copper and evaluation of corrosion mass loss according to ISO 9226 Exposed metal coupons analysed in respect of the sulphate content of thecorrosion products by EDX UV-fluorescence instrument for direct measurement of sulphur dioxide concentration close to façade.
3.8 Constant Load Indoor Tests For indoor testing different absorbers have been available. Besides the two reference samples (RS1, RS2) these are: • Colored Sunselect samples on copper (green, red and yellow) • Sunselect samples on copper (with SnO overcoat) with additional porous SiO2 Sol-
gel overcoat from CIEMAT • Sunselect samples on copper (without SnO overcoat) with additional dense SiO2
Sol-gel overcoat from CIEMAT • Colored selective paint samples on Aluminium from NIC (blue, red) • Black Chrome on stainless steel (from IEA Task 10) • Sol-gel coating on Aluminium from CIEMAT • Sol-gel coating on Aluminium from NIC Indoor testing was performed at 3 different institutes: corrosion testing at SP (Sweden), condensation testing and high temperature testing at ISE (Germany) and SPF (Switzerland).

Task 27 Solar Building Facade Components Subtask B: Durability
Task27-Final report –B3 page 53 of 92
3.9 Corrosion Tests For corrosion testing two different cyclic tests were used: Corrosion test cycle I The first was SP method 2499 A, also corresponding to ISO/CD 21207 method A, which defines the following one week test cycle: • Traditional salt spray testing (ISO 9227) for 2 h in a mist of a salt solution containing
a mass fraction of 5 % of sodium chloride at 35 *C, • followed by drying for 22 h in standard laboratory climate, and • exposure for 120 h in a test atmosphere containing a mixture of corrosion pro-
moting gases, volume fraction of NO2 equal to 1,5⋅10-6 and of SO2 equal to 0,5⋅10-6, at a relative humidity of 95% and at a temperature of 25 *C, followed by drying for 24 h in standard laboratory climate.
Corrosion test cycle II The second was a less corrosive method. It can be described as a slightly modified SP method 2499. A cycle differing from the former in that no salt spray exposure is performed in step a) only drying for 24 h in standard laboratory climate. Reference metal specimens In both tests reference metal specimens of copper and zinc were used to deter-mine the corrosivity of the tests. The reference metal specimens were also utilised in converting the corrosion resistance obtained in test to expected service performance as regards corrosion resistance. Test results The test results obtained with the corrosion test cycles II are shown in Figures 1. In Figure 2 the test results with the corrosion test cycle I are shown. Failure times in corrosion test cycle I for the absorber materials, i.e. when the performance requirement PC < - Δα + 0.25⋅Δε <0.05 is not longer met, were also assessed. The results are shown in Table 1. In Table 2 the metallic mass losses of the copper and zinc reference specimens determined after four cycles of testing according to the two corrosion test cycles are given.

Task 27 Solar Building Facade Components Subtask B: Durability
Task27-Final report –B3 page 54 of 92
0,86
0,88
0,9
0,92
0,94
0,96
0,98
1
0 1 2 3Test cycles
Abs
orpt
ance
Sol-gel covered absorbers from CIEMAT
Sol-gel covered absorbers from Interpane withSnO2*Sol-gel covered absorbers from Interpane withSnO2*Sol-gel covered absorbers from Interpane withoutSnO2
0
0,1
0,2
0,3
0,4
0,5
0 1 2 3Test cycles
Emitt
ance
Sol-gel covered absorbers from CIEMAT
Sol-gel covered absorbers from Interpane withSnO2* Sol-gel covered absorbers from Interpane withSnO2* Sol-gel covered absorbers from Interpanewithout SnO2

Task 27 Solar Building Facade Components Subtask B: Durability
Task27-Final report –B3 page 55 of 92
0,85
0,86
0,87
0,88
0,89
0,9
0,91
0,92
0 1 2 3Test cycles
Abs
orpt
ance
Sunselect redSunselect greenSunselect yellow
0
0,1
0,2
0,3
0,4
0,5
0,6
0,7
0,8
0,9
0 1 2 3Test cycles
Emitt
ance
Sunselect redSunselect greenSunselect yellow
0,9 0,91 0,92 0,93 0,94 0,95 0,96 0,97 0,98 0,99
1
0 1 2 3 4Test cycles
Aso
rpta
nce
Black Chrome (Task 10) RS1 RS2

Task 27 Solar Building Facade Components Subtask B: Durability
Task27-Final report –B3 page 56 of 92
0 0,05
0,1 0,15
0,2 0,25
0,3 0,35
0,4 0,45
0,5
0 1 2 3 4Test cycles
Emitt
ance
RS1 RS2 Black Chrome (Task 10)
0,7
0,72
0,74
0,76
0,78
0,8
0,82
0,84
0 1 2 3Test cycles
Aso
rpta
nce
Selective paint NIC-blue
Selective paint NIC-red
0,5
0,55
0,6
0,65
0,7
0,75
0,8
0,85
0,9
0 1 2 3Test cycles
Emitt
ance
Selective paint NIC-blue
Selective paint NIC-red
Fig. 1: Solar absorptance and thermal emittance of the absorber materials after corrosion testing according to corrosion test cycle II. As can be seen in Figure 1, it is only the red and green coloured Sunselect absorber materials that exhibit significant degradation in optical performance upon corrosion testing according to corrosion test cycle II after two weeks. It is mainly the emittance of coatings that is affected. On those samples degradation due to corrosion of the underlying metal substrate can be observed.
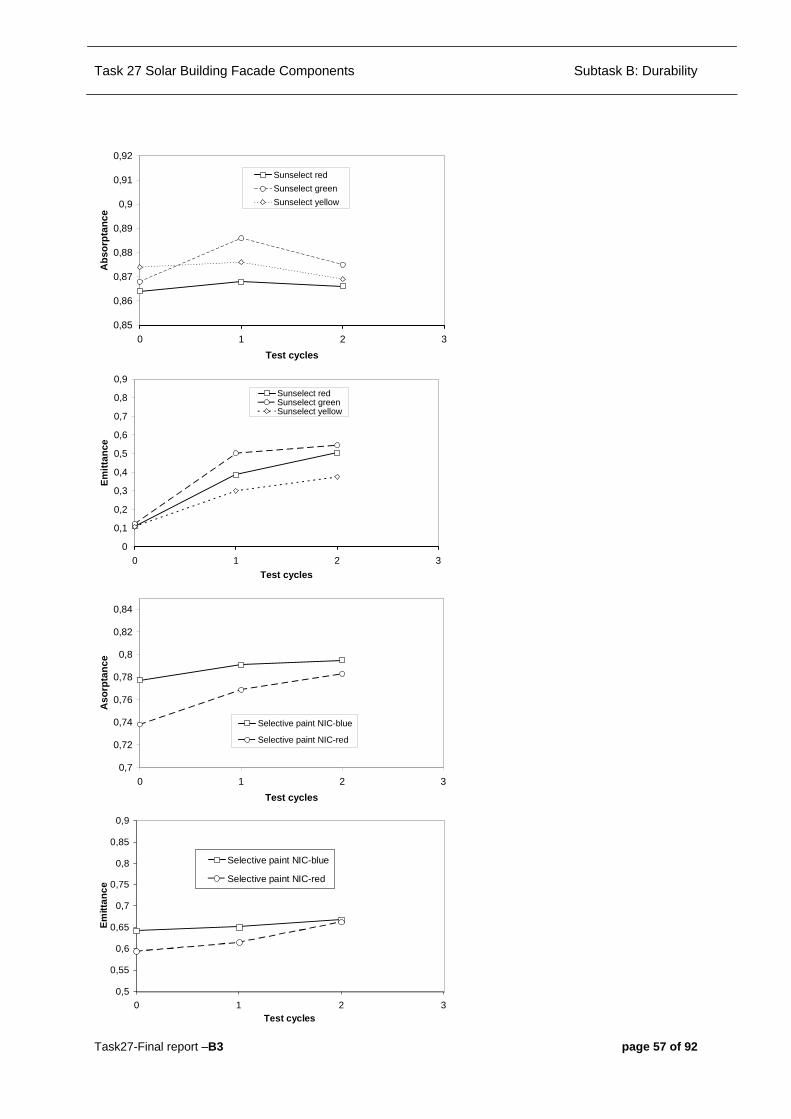
Task 27 Solar Building Facade Components Subtask B: Durability
Task27-Final report –B3 page 57 of 92
0,85
0,86
0,87
0,88
0,89
0,9
0,91
0,92
0 1 2 3Test cycles
Abs
orpt
ance
Sunselect redSunselect greenSunselect yellow
0
0,1
0,2
0,3
0,4
0,5
0,6
0,7
0,8
0,9
0 1 2 3Test cycles
Emitt
ance
Sunselect redSunselect greenSunselect yellow
0,7
0,72
0,74
0,76
0,78
0,8
0,82
0,84
0 1 2 3Test cycles
Aso
rpta
nce
Selective paint NIC-blue
Selective paint NIC-red
0,5 0,55
0,6 0,65
0,7 0,75
0,8 0,85
0,9
0 1 2 3Test cycles
Emitt
ance
Selective paint NIC-blue
Selective paint NIC-red

Task 27 Solar Building Facade Components Subtask B: Durability
Task27-Final report –B3 page 58 of 92
0,91
0,92
0,93
0,94
0,95
0,96
0 1 2 3Test cycles
Abs
orpt
ance
RS1 RS2 Black Chrome (Task 10)
0 0,1 0,2 0,3 0,4 0,5 0,6
0 1 2 3Test cycles
Emitt
ance
RS1 RS2 Black Chrome (Task 10)
0,8
0,82
0,84
0,86
0,88
0,9
0,92
0,94
0,96
0,98
1
0 1 2 3 4Test cycles
Abs
orpt
ance
Sol-gel covered absorbers from CIEMAT
Sol-gel covered absorbers from Interpane withSnO2*Sol-gel covered absorbers from Interpane withSnO2*Sol-gel covered absorbers from Interpanewithout SnO2
0
0,1
0,2
0,3
0,4
0,5
0,6
0,7
0,8
0 1 2 3Test cycles
Emitt
ance
Sol-gel covered absorbers from CIEMAT
Sol-gel covered absorbers from Interpane withSnO2*Sol-gel covered absorbers from Interpane withSnO2*Sol-gel covered absorbers from Interpane withoutSnO2
Fig. 2: Solar absorptance and thermal emittance of the absorber materials after corrosion testing according to corrosion test cycle I.

Task 27 Solar Building Facade Components Subtask B: Durability
Task27-Final report –B3 page 59 of 92
When also salt is added as a corrosion promoting factor as in corrosion test cycle I, see Figure 2, the degradation in optical performance is much more pronounced with the exceptions of the selective paints and the Black Chrome (Task 10) absorber material. For the rest of the absorber materials you can observe that corrosion has taken place of the underlying metal, which most probably may be due to lost ability of the barrier coatings to protect the underlying metal from corrosion attack by salt and corrosion promoting gases. Tab. 1: Failure times of the absorber materials in corrosion test cycle I
Absorber material Failure time (PC =0.05) in corrosion test I (Test cycles)
Corresponding metallic mass loss of copper* (g/m2)
Sol-gel covered absorbers from CIEMAT
0.74 4.1
Sol-gel covered absorbers from Interpane with SnO
0.82 4.5
Sol-gel covered absorbers from Interpane with SnO
0.74 4.1
Sol-gel covered absorbers from Interpane without SnO
0.71 3.9
Sunselect red 0.90 4.8 Sunselect green 0.83 4.5 Sunselect yellow 1.24 6.4 Selective paint NIC-blue - - Selective paint NIC-red - - RS1 0.57 3.2 RS2 0.47 2.7 Black Chrome (IEA Task 10) - -
* When calculating the metal mass loss rate of copper it is assumed that the following relation is valid: M = M1 ⋅ tx where M = mass loss, M1 = constant at a given corrosivity, t = time, and x = constant at a given corrosivity, equal to 0.88 for the present test (Design of accelerated corrosion tests for electronic components in automotive applications; P. Eriksson, B. Carlsson, I. Odnevall- Wallinder, IEEE Transaction Components and Packaging Technologies, Vol. 24, No 1, March 2001) Tab. 2: Corrosivity of corrosion test cycles
After four cycles of testing according to
Metallic mass loss of copper (g/m2)
Metallic mass loss of zinc (g/m2)
Corrosion test cycle I 18,0 39.0 Corrosion test cycle II 10,6 10,7
By use of results from corrosivity measurements in outdoor environments, the failure times in the corrosion test may be used in roughly estimating the ex-pected service life for solar façade elements with the absorber materials tested.

Task 27 Solar Building Facade Components Subtask B: Durability
Task27-Final report –B3 page 60 of 92
3.10 Condensation and high temperature tests The condensation tests are performed in a climatic cabinet equipped with liquid cooled sample holders. The temperature of the samples is 5K below the cabinet temperature and the relative humidity is 95% to assure condensation on the samples. Sample temperature is 65°C and 40°C, respectively. In case of the 70/95/65/UV test additional UV-load is performed by a light source above the samples (about factor of 7 compared with natural sunlight). The change of the optical properties solar absorption αAM1.5, thermal emission ε373K and pc = -Δα + 0.5Δε as well as the spectral reflectance is given as a function of testing time in figures 4 - 15 for all samples tested. Test conditions for temperature testing were derived from transformation of one-year data from outdoor monitoring results from the south 45° installed Black Chrome samples which were assumed to be the worst case for temperature load.
50 100 150 200 250 3001
10
100
1000
10000
100000
130 °C 150 °C 170 °C
Activation energy [kJ/mol]
log
test
ing
time
[h]
Fig. 3: Testing times for high temperature test. As a starting point the tests were performed at a sample temperature of 170°C and 150°C, respectively. For the tests without artificial irradiation a circulating air furnace was used. For the high temperature tests combined with irradiation the samples were fixed with a thermal heat sink compound onto a precision hotplate. The temperature of the hotplate was controlled by a selective coated Pt100 foil sensor pasted onto the surface of the plate. In this way, both, the sensor and the absorber samples are irradiated by the light source in order to measure a temperature as close as possible to the real sample temperature. As light source a “Dr. Hönle Sol 1200” solar simulator was used. The source was installed 70 cm above the samples (measured from the exit window of the simulator). The spectral distribution of the lamp is in the order of the solar terrestrial irradiation. However, it has to be re-measured for this specific set-up.
Task 27 Solar Building Facade Components Subtask B: Durability
Task27-Final report –B3 page 61 of 92
Case study 4: Service life prediction tools for complete Solar Collectors Case study leader: Manuel Lopes-Prates, INETI, Portugal The goal of the FMEA methodology is to identify and to prevent problems before they occur in products and processes. So, it is a methodology to analyse and to find out • all potential failure modes of a proposed or existing product or • process, • the effects of these failure modes in the same product or process, and • the way to correct and/or to mitigate these failures or their effects. The FMEA methodology was firstly applied about 40 years ago to assure the safety and reliability of products in the aerospace industry, and afterwards in the products of the automotive and chemical processes industries, as a key tool to safety improvement (McDermott, 1996). Meanwhile, the FMEA methodology be-comes a key quality tool in the development of new products, to satisfy the needs of a customer in terms of reliability, maintainability, availability and safety (Prates, 2003). Hence, in our days we can distinguish several types of FMEA (Cow, 2002): • System - focuses on global system functions • Design - focuses on components and subsystems • Process - focuses on manufacturing and assembly processes • Service - focuses on service functions • Software - focuses on software functions In terms of standards the first one was adopted in 1974 for ships as a military standard (MIL-STD-1629), expanded in 1980 for all Departments and Agencies of the USA Department of Defense (MIL-STD-1629A), which standard was can-celled in 1998. Meanwhile, were published the standards SAE – J – 1739 and ECSS-Q-30-02A. Within the IEA-SHC Task 27 the FMEA methodology was firstly applied by CSTB for building products, namely for a flat plate solar collector (Lair, 2002), and after by Aspen Research Corporation in the framework of the project “An Insulating Glass Knowledge Base”, supported by the USA Department of Energy (Hage, 2002; Lair, 2003). In the framework of the Subproject BC - Service life prediction tools for complete systems - Solar Collectors of the IEA-SHC Task 27 – Performance, durability and sustainability of advanced windows and solar components for building enve-lopes, INETI is the responsible for applying the FMEA methodology to a low concentrating CPC collector. The present report presents the work done until now.
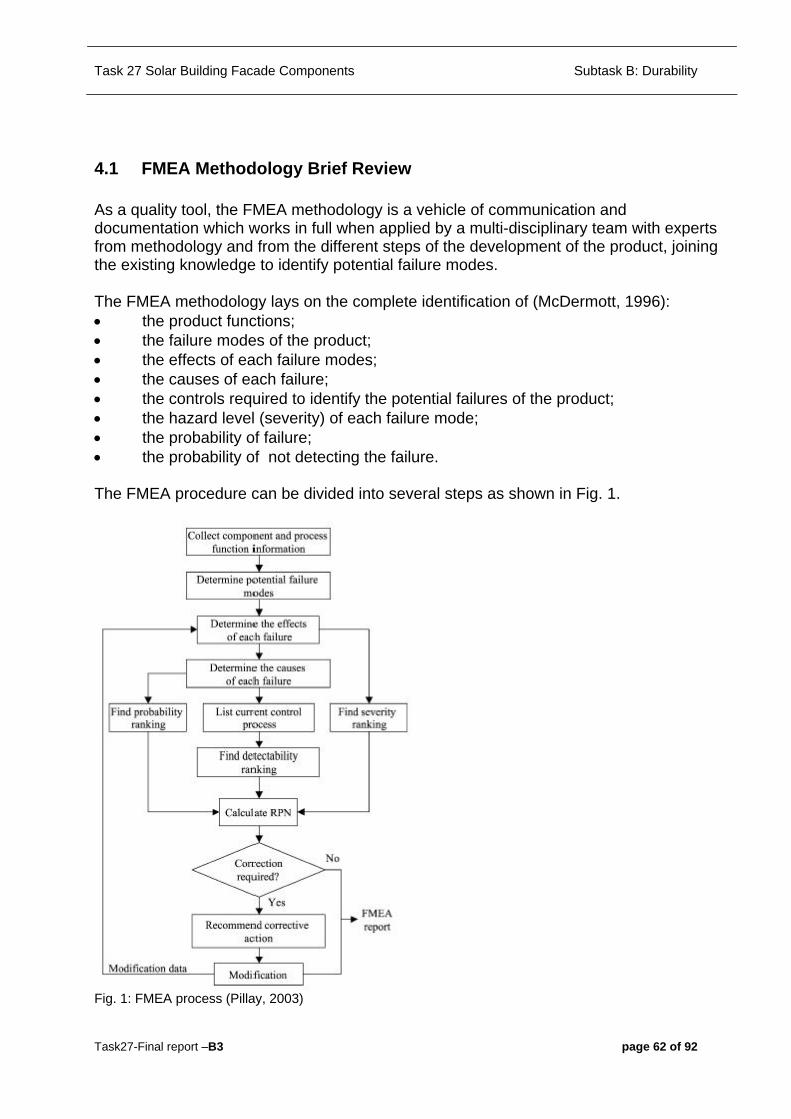
Task 27 Solar Building Facade Components Subtask B: Durability
Task27-Final report –B3 page 62 of 92
4.1 FMEA Methodology Brief Review As a quality tool, the FMEA methodology is a vehicle of communication and documentation which works in full when applied by a multi-disciplinary team with experts from methodology and from the different steps of the development of the product, joining the existing knowledge to identify potential failure modes. The FMEA methodology lays on the complete identification of (McDermott, 1996): • the product functions; • the failure modes of the product; • the effects of each failure modes; • the causes of each failure; • the controls required to identify the potential failures of the product; • the hazard level (severity) of each failure mode; • the probability of failure; • the probability of not detecting the failure. The FMEA procedure can be divided into several steps as shown in Fig. 1.
Fig. 1: FMEA process (Pillay, 2003)

Task 27 Solar Building Facade Components Subtask B: Durability
Task27-Final report –B3 page 63 of 92
For the last three entries scales were established, remembered in Tables 1 to 3 (Pillay, 2003) of Annex A, which permit to calculate a risk priority number (RPN) given by multiplication of the index representing the probability, severity and detectability: RPN (risk priority number) = Sf (probability of failure)x S (severity of the failure) x Sd (probability of not detecting the failure) But, as the three factors of RPN have the same five scales and scores of 1-10, the traditional FMEA have the disadvantage of different sets of Sf, S and Sd may produce the same RPN with an obviously risk implication totally different (Pillay, 2003). Going around this difficulty, the standard ECSS-Q-30-02A define design FMEA/ FMECA requirements and a process risk analysis. The design FMEA/FMECA requirements establish the criticality number (CN) for a specific failure mode as a product of the severity of the failure effects (SN) by the probability of the failure mode occurrence (PN): CN = SN ×PN For the severity and probability numbers were established scores 1-4, remembered in Tables 1 to 3 (ECSS-Q-30-02A, 2001) of Annex B. In accordance with the requirements of standard ECSS-Q-30-02A, an item of a check-list shall be considered a critical item if the failure mode is classified as • from FMEA: severity categories 1S (catastrophic with safety impacts),
1 (catastrophic), 2S (critical with safety impacts), and 2 (critical); • from FMECA: CN ≥ 8. The FMEA/FMECA methodology is implemented with the support of worksheets and their results shall be documented, as required by standard ECSS-Q-30-02A. The process risk analysis (process FMECA) is the application of the FMECA methodology to processes, such as manufacturing, assembly or integration, ground operations, tests, and in-orbit operations, and has as purpose to identify potential weak points and to determine their effects on the product operation and the process itself. As we can read in ECSS-Q-30-02A. Generally, this method is applied to the mission or safety critical processes as well as to processes which are critical from the programmatic point of view. The inputs required to start the work depend strongly on the process to be analysed. Typical inputs are: • working and control plan; • assembly procedure; • integration procedure; • test procedure; • handling procedure (manual). With the support of a “customer-approved worksheet”, remembered in Annex C, “a small team including a member involved in the process to be analysed”, with “an odd number of

Task 27 Solar Building Facade Components Subtask B: Durability
Task27-Final report –B3 page 64 of 92
members to facilitate the decision process in the case of different opinion”, the potential weak points shall be evaluated, filling out for each one: 1. Identification number Identify all process steps. 2. Item Number the individual process steps. 3. Description Describe the process step. 4. Failure mode/failure cause Describe the assumed process step failure mode together with its causes. 5. Failure effects 5.1 the process, and 5.2 the product involved. Describe all possible effects of the assumed failure modes on: the process, and the product involved. 6. Detection means Describe the existing means and methods by which the effects can be detected. 7. Existing preventive or compensatory provisions Describe the existing preventive or compensatory provisions to prevent the fail-ure mode, to reduce its effects, or to reduce its probability of occurrence. 8. Severity Identify the severity of a failure effect by assigning a severity number (SN) ac-cording to Table 6. 9. Occurence Identify the probability of occurrence of the failure mode by assigning a probabil-ity number (PN) according to the Table 7. 10. Detection Identify the probability of detection of the failure mode by assigning a detection number (DN) according to the Table 8. 11. Criticality Enter the criticality number (CN) by multiplying SN ×PN ×DN. 12. Recommendations and remarks Describe recommended preventive or compensatory provisions to eliminate the failure mode, to reduce its effects, to reduce its probability of occurrence, or to improve its detectability, as well as any additional information being useful.

Task 27 Solar Building Facade Components Subtask B: Durability
Task27-Final report –B3 page 65 of 92
The referred tables of standard ECSS-Q-30-02A for the determination of the criticality number (CN) are remembered in Annex D. The same standard establishes that The criticality number (CN) shall be defined as the product of the numbers assigned to failure mode severity, probability of occurrence, and prob-ability of detection according to: CN = SN ×PN ×DN The value of SN, PN, and DN are gained by votes of the team members (engineering judgement). The CN value is in the range from 1 to 64, whereby the meaning of the extremes is: • negligible, i.e. there is no risk - if CN = 1; • extremely critical, i.e. there is an extremely high risk - if CN = 64. Meanwhile, we have assisted to a theorisation of the traditional empirical model with introduction of new approaches: • a new technique, based on fuzzy logic, for prioritizing failures for corrective actions
in a FMECA (Bowles, 1995); • a technique of weighted score criticality system applied together with fuzzy logic
prioritization of failures (Moss, 1999); • a fuzzy TOPSIS approach - an alternative multi-attibute decision-making approach
for prioritizing failures in FMECA, based on a fuzzy version of the technique for order preference by similarity to ideal solution (Braglia, 2003); and
• a modified failure FMEA using approximate reasoning, which util-ises the fuzzy rules base and grey relation theory (Pillay, 2003).
But, on other hand, to understand better the behaviour of our mechanical equipment we have to considerer their five basic failure modes, categorized ac-cording to the type of equipment and energy: • fluid flow equipment (leaqkage and distorted flow); • structural system (fracture and excessive deflection); • thermodynamic systems (overheating and reduction of efficiency); • kinematic systems (bearing seizure and reduced accuracy of relative move-ment); • material properties (incorrect material or geometry).” (Hawkins&Woollons, 1998).
4.2 Structural analysis Before identifying the product functions, we must start by the structural analysis, identifying each part of the collector and corresponding material used in each of the parts. In our case, this identification is shown in Fig. 2, which can be considered equivalent to a structural diagram too.

Task 27 Solar Building Facade Components Subtask B: Durability
Task27-Final report –B3 page 66 of 92
Figure 2: CPC Solar collector cross-section
4.3 Requirements / Failure Modes The failure modes of the product are related directly with the strength capacity of each one of their components to stresses they are submitted. These stresses can be of environmental or of in-service nature as listed in Fig. 3.
Environmental stresses In-service stresses Solar radiation, UV radiation, temperature, high humidity, wind, rain, snow, hail, pollutants (gaseous (sulfur dioxide) and dust), animals (birds), and hazards
Circulating fluid temperature, stagnation temperature, circulating fluid velocity, chemical composition of the circulating fluid
Figure 3: environmental and in-service stresses For solar collectors, the standard EN 12975-1 identifies the tests to be performed and establishes in clause 5.3.1 the following general pass-criteria (in red actual change proposal):

Task 27 Solar Building Facade Components Subtask B: Durability
Task27-Final report –B3 page 67 of 92
The term "no major failure", denotes that none of the following occurs: • Absorber leakage or such deformation that permanent contact between absorber
and cover is established; • Breaking or permanent deformation of cover or cover fixing; • Breaking or permanent deformation of collector fixing points or collector box; • Vacuum loss, such that vacuum or subatmospheric collectors may no more be
classified as such, according to the definition in EN ISO 9488 (only applicable for vacuum and subatmospheric collectors);
• Accumulation of humidity inside the collector exceeding 5% of the aperture area. The clause 5.3.4 of EN 12975-1 establishes for the exposure test that when tested in accordance with 5.4 of EN 12975-2:2000, the collector shall not show any major failure according to 5.3.1 and none of the problems constituting major failure shall be graded 2 on the scale given in B.5.5 of EN 12975-2:2000. The scale given in B.5.5 of EN 12975-2:2000 is remembered in Table 1:
Table 1: Inspection results (EN 12975-2, B.5.5) Evaluate each potential problem according to the following scale: 0 - No problem 1 - Minor problem 2 - Severe problem • - Inspection to establish the condition was not possible Collector component Potential problem Evaluation a) Collector box/fasteners Cracking/warping/corrosion/rain penetration b) Mountings/structure Strength/safety c) Seals/gaskets Cracking/adhesion/elasticity d) Cover/reflector Cracking/crazing/buckling/delamination/
warping/outgassing e) Absorber coating
Absorber tubes and headers Absorber mountings
Cracking/crazing/blistering Deformation/corrosion/leakage/loss of bonding Deformation/corrosion
f) Insulation Water retention/outgassing/degradation
The maximum fluid temperature to be considered in the design of a solar collector or solar plant is the collector stagnation temperature. Materials to be used in the manufacture of collectors or installations incorporating the collector (expansion tanks, safety valves, etc.) shall be chosen taking into account this temperature. The stagnation temperature shall be calculated in accordance with C.3 of EN 12975-2:2000 (Approach 2) under the following climate parameters: • Global irradiance on collector plane 1000 W/m²; • Surrounding air temperature 30 ºC.

Task 27 Solar Building Facade Components Subtask B: Durability
Task27-Final report –B3 page 68 of 92
The collector shall provide for safe installation and mounting. Sharp edges, loose connections and other potentially dangerous features shall be avoided. If the weight of the empty collector exceeds 60 kg, an anchorage for a lifting device shall be included, except for the collectors that are assembled on the roof. Collectors filled with a heat transfer fluid (irritant to human skin or eyes, or toxic) shall carry a warning label.
4.4 Stresses The Annex B of EN 12975-1 gives us the main criteria for the correct choice of materi-als and of design solutions, for guarantee of operational capacity and of long lifetime of a solar collector. From this Annex B of EN 12975-1, remembered in Annex E, we can extract the major causes driving, first, to degradation and, after, to failure: • UV radiation, • environmental temperature (thermal shocks, airborne fire, radiant heat, thermal
fatigue) • internal temperature (stagnation, freezing), • rain, snow, hail, wind, humidity, • pollutants (gaseous and dust), bird excrements, • aggressiveness of heat transfer fluid, and • internal stresses from manufacturing processes like cutting, brazing, and soldering. From the Annex C of EN 12975-1, remembered in Annex F, we can extract same precautions for environmental protection, namely that of insulation materials must not have CFC or outgas at the stagnation temperature.
4.5 Functional analysis The main function (production of heat) of a solar collector can be considered as composed by three distinct functions: energy collection, by the absorber, heat transfer, from the absorber to the circulating fluid, and heat transfer, by the circulating fluid through the pipes. As secondary functions we can distinguish confinement and structural resistance to physical, chemical or mechanical degradation. The role played by each component is indicated in Fig. 4

Task 27 Solar Building Facade Components Subtask B: Durability
Task27-Final report –B3 page 69 of 92
Function Component N.º Designation Material E
nerg
y co
llect
ion
Hea
t tra
nsfe
r
Hea
t tra
nspo
rt
Con
finem
ent
Res
ista
nce
to
envi
ronm
ent
1 Transparent cover Low iron tempered glass X X X 2 Absorber - coating selective coating (both sides) X X X Absorber - substrate Aluminium X X Absorber - pipe Cooper X X X 3 Reflector High specular aluminium X X 4 Glass spacer PTFE White X X 5 Rubber seal EPDM rubber X X 6 Pipe Cooper X X 7 Frame Extruded anodized Al X X 8 Back panel Polystyrene X X 9 Insulation CFC free expanded
polyurethane foam X X
10 Rubber seal EPDM rubber X X
Figure 4: Functional analysis
4.6 FMEA worksheet
Function Item Components Materials Failure mode Failure cause Failure effects Severity Failure detection method / observable symptoms
Compensation provisions Correction actions Remarks
Straching Cleaning Decreasing of transmission Visual inspection / testing Operactor action Use of clean water
Schocks Decreasing of transmission Visual inspection Testing Use of certified material
Internal stresses Decreasing of transmission Visual inspection / testing Testing Use of certified material
External: dust Decreasing of transmission Visual inspection / testing Operator action Use of clean water
pollutants Decreasing of transmission Visual inspection / testing Operator action Use of clean water
Internal: condensation Decreasing of transmission Visual inspection Design correction Installer correction
binder/insulation Decreasing of transmission Visual inspection Assembling correction Installer correction
Corrosion (humidity+ pollutants)
Excessive heating
3 Reflector High specular aluminion Pitting Corrosion (humidity + pollutants) Loss of efficiency Visual inspection / testing Testing Use of certified material
4 Glass spacer PTFE white Ageing Thermal fatigue Loss of efficiency Visual inspection / testing Testing Use of certified material
9 Insulation CFC free expanded polyurethane foam
Confinement Water absorption Loss of efficiency Visual inspection / testing Testing Use of certified material
2 Absorber - substrate Aluminium Pitting Corrosion (humidity + pollutants) Loss of efficiency Visual inspection / testing Testing Use of certified material
Breaking Damage due to freeze Ruin Visual inspection Maintenance action new collector
Obstruction Sludge due to corrosion (active agents/chemical incompatibility of fluid)
Decreasing of flow Visual inspection operating action Use of adequate circulating fluid
Breaking Damage due to freeze Ruin Visual inspection Maintenance action new collector
Obstruction Sludge due to corrosion (active agents/chemical incompatibility of fluid)
Decreasing of flow Visual inspection operating action Use of adequate circulating fluid
Flow problems Air trapping, bad control Loss of efficiency Visual inspection operating action Correct Control system
Visual inspection / testing
Owner:
Installer:
Designer:
Prepared by:
Approved by:
Date:
Loss of efficiency
Dirt
Low iron tempered glassTransparent cover
Cracking
Testing Use of certified material
Energy collection
CooperAbsorber - pipe
1
2 Absorber - coating selective coating Blistering, unstricking, ageing
CooperPipe
Heat transfer
Heat transport
2
6
FAILURE MODES AND EFFECTS ANALYSIS (FMEA)Project:
Product:
System / Equipment:
Document reference:
Issue:
Page of
Function Item Components Materials Failure mode Failure cause Failure effects Severity Failure detection method / observable symptoms
Compensation pro Correction actions Remarks
7 Frame Extruded anodized Al
Pitting Corrosion (humidity+ pollutants)
Visual impact Visual inspection / Testing Use of certified material
8 Back panel Polystyrene Ageing (cracking, creep)
Thermal fatigue Visual impact Visual inspection Testing Use of certified material
5, 10 Rubber seal EPDM rubber Ageing (cracking, creep)
Thermal fatigue Loss of efficiency Visual inspection / Testing Use of certified material
Confinement
Installer: Date: Page of
FAILURE MODES AND EFFECTS ANALYSIS (FMEA)Project:
Product:
System / Equipment:
Designer: Approved by: Issue:
Owner: Prepared by: Document reference:
Note: The secondary function action is considered together with others.

Task 27 Solar Building Facade Components Subtask B: Durability
Task27-Final report –B3 page 70 of 92
FMECA worksheet
Document reference:Issue:
Page of
em Components Materials Failure mode Failure cause Failure effects Severity Failure detection method / observable symptoms
Compensation provisions
Severity Number SN
Probality number PN
Critically number CN
Correction actions
Remarks
Straching Cleaning Decreasing of transmission
Visual inspection / testing
Operactor action Use of clean water
Schocks Decreasing of transmission
Visual inspection Testing Use of certified material
Internal stresses Decreasing of transmission
Visual inspection / testing
Testing Use of certified material
External: dust Decreasing of transmission
Visual inspection / testing
Operator action Use of clean water
pollutants
Decreasing of transmission
Visual inspection / testing
Operator action Use of clean water
Internal: condensation
Decreasing of transmission
Visual inspection Design correction Installer correction
binder/insulation
Decreasing of transmission
Visual inspection Assembling correction
Installer correction
Corrosion (humidity+ pollutants)Excessive heating
3 Reflector High specular aluminion
Pitting Corrosion (humidity + pollutants)
Loss of efficiency Visual inspection / testing
Testing Use of certified material
4 Glass spacer PTFE white Ageing Thermal fatigue Loss of efficiency Visual inspection / testing
Testing Use of certified material
9 Insulation CFC free expanded polyurethane foam
Confinement Water absorption Loss of efficiency Visual inspection / testing
Testing Use of certified material
2 Absorber - substraAluminium Pitting Corrosion (humidity + pollutants)
Loss of efficiency Visual inspection / Testing Use of certified material
Breaking Damage due to freRuin Visual inspection Maintenance action new collector
Obstruction Sludge due to corrosion (active agents/chemical incompatibility of fluid)
Decreasing of flow Visual inspection operating action Use of adequate circulating fluid
Breaking Damage due to freRuin Visual inspection Maintenance action new collector
Obstruction Sludge due to corrosion (active agents/chemical incompatibility of fluid)
Decreasing of flow Visual inspection operating action Use of adequate circulating fluid
Flow problems Air trapping, bad c Loss of efficiency Visual inspection operating action Correct Control system
6 Pipe Cooper
2 Absorber - pipe Cooper
Loss of efficiency Visual inspection / testing
Testing Use of certified material
Cracking
Dirt
2 Absorber - coating
selective coating Blistering, unstricking, ageing
1 Transparent cover
Low iron tempered glass
: Installer: Date:
Designer: Approved by:
Owner:
FAILURE MODES EFFECTS AND CRITICALLY ANALYSIS (FMECA)Prepared by:
Function Item Components Materials Failure mode Failure cause Failure effects Severity Failure detection method / observable symptoms
Compensation provisions
Severity Number SN
Probality number PN
Critically number CN
Correction actions
Remarks
7 Frame Extruded anodized Al
Pitting Corrosion (humidity+ pollutants)
Visual impact Visual inspection / Testing Use of certified material
8 Back panel Polystyrene Ageing (cracking, creep)
Thermal fatigue Visual impact Visual inspection Testing Use of certified material
5, 10 Rubber seal EPDM rubber Ageing (cracking, creep)
Thermal fatigue Loss of efficiency Visual inspection / Testing Use of certified material
Page of
Approved by:
Prepared by:
Date:
FAILURE MODES EFFECTS AND CRITICALLY ANALYSIS (FMECA)Document reference:
Confinement
Project: Owner:
Product: Designer:
System / Equipment: Installer:
Issue:

Task 27 Solar Building Facade Components Subtask B: Durability
Task27-Final report –B3 page 71 of 92
4.7 Weak points from visual inspection 4.7.1 In service solar installations In the framework of the Portuguese Public Initiative Solar Heat Water to Portugal they were visited 23 solar installations in different locations of Portugal, from which 8 with CPC solar collectors, similar with that in study. The CPC solar collectors of 6 of these installations were submitted to visual inspec-tion. However the known results were treated all together. As the problems are similar, we present here all the results in Table 2. Table 2 – Visual Inspection Results of 23 solar installations
Number of solar systems with or without problems
Type of problem
With Without Not conclusive
Associated type of failure mode
Wrong position for the control sensor 13 8 2 (3) thermodynamic systems
Galvanic corrosion 13 8 2 (5) material properties
Inexistent mechanical protection for insulation
14 7 2 (3) thermodynamic systems
Permanent liaison of primary circuit to network
14 8 1 (3) thermodynamic systems
Defective welding 3 18 2 (2) structural system
Fogginess 12 8 3 (5) material properties
Precoce ageing 12 9 2 (5) material properties
Seal rupture 1 20 2 (5) material properties
Corrosion flakes 5 16 2 (5) material properties
Circuit with non-equilibrium 10 12 1 (3) thermodynamic systems
Control system misfunction 10 13 (3) thermodynamic systems
Air-vent misfunction 20 3 (5) material properties

Task 27 Solar Building Facade Components Subtask B: Durability
Task27-Final report –B3 page 72 of 92
4.7.2 In tested solar collectors To understand better both the results obtained from the solar installations visual inspection and the score numbers used by the Task 27 to fulfil the FMEA/FMECA sheets, it seems to be useful to use the summarized results obtained by the INETI Solar Collector Testing Laboratory (LECS/INETI) along the final inspection of the qualification testing procedure (EN 12975-2, Clause 5.11 and Annex B13. These results are presented in the following Tables 3 and 4. Table 3 – Final Inspection Results of 26 solar collectors qualification testing (EN 12975-2, 5.11, B.13)
Observed problem Evaluation Collector component
Potential problem Evaluation 0 1 2 *
a) Collector box / fasteners
Cracking / warping / corrosion / rain penetration
23 2 1
b) Mountings/structure
Strength/safety 24 0 2
c) Seals / gaskets Cracking / adhesion / elasticity
25 0 1
d) Cover / reflector
Cracking / crazing / buckling / delamination / warping / outgassing
20 0 6
e) Absorber coating
Cracking / crazing / blistering
25 1 0
Absorber tubes and headers
Deformation / corrosion / leakage / loss of bonding
25 1 0
Absorber mountings Deformation / corrosion 26 0 0 f) Insulation Water retention /
outgassing / degradation
26 0 0
(0 - No problem; 1 - Requirement apart from testing not fulfilled; 2 - Requirements for testing not fulfilled; • - Inspection to establish the condition was not possible)
Table 4 – Final Inspection Results of 26 solar collectors qualification testing (EN 12975-2, 5.11, B.13)

Task 27 Solar Building Facade Components Subtask B: Durability
Task27-Final report –B3 page 73 of 92
Qualification Test (EN 12975-2) Number of collectors with scale 2 evaluation (Requirements for testing not fulfilled)
Internal pressure (1st test) 0 High-temperature resistance 0 Exposure 1 External thermal shock (1st test) 0 Internal thermal shock (1st test) 0 Internal pressure (2nd test) 0 External thermal shock (2nd test) 0 Internal thermal shock (2nd test) 0 Rain penetration 4 Freeze resistance N.A. Mechanical load 1 Impact resistance (optional test) 2 Thermal performance 0 Final inspection 0
So, using the following criteria for risk assessment of potential failure modes by use of FMEA applied to solar collectors:
Failure mode / Degradation process
Severity (S) (rating number)
Probability of occurrence(PO) (rating number)
Probability of discovery(PD) (rating number)
Rating-number for risk (RPN = S⋅ PO ⋅ PD)
Severity Rating number
Probability of detection
Rating number
Probability of occurance
Rating number
No effect on product 1 Failure which always is noted. Probability for detection > 99.99%
1 Unlikely that failure will occur
1
Minor effect on product but no effect on product function
2-3 Normal probability of detection 99.7%
2-4 Very low probability for failure to occur
2-3
Risk of failure in product function
4-6 Certain probability of detection >95%
5-7 Low probability for failure
4-5
Certain failure in product functioning
7-9 Low probability of detection >90%
8-9 Moderate probability for failure to occur
6-7
Failure which may affect personal safety
10 Failures will not be found - cannot be tested
10 High probability for failure to occur
8-9
Very high probability for failure to occur
10
we have to obtain the results shown in Table 5: Table 5 – Risk Assessment of Potential Failure Modes versus Final Inspection Results of 26 solar collectors qualification testing (EN 12975-2, 5.11, B.13)
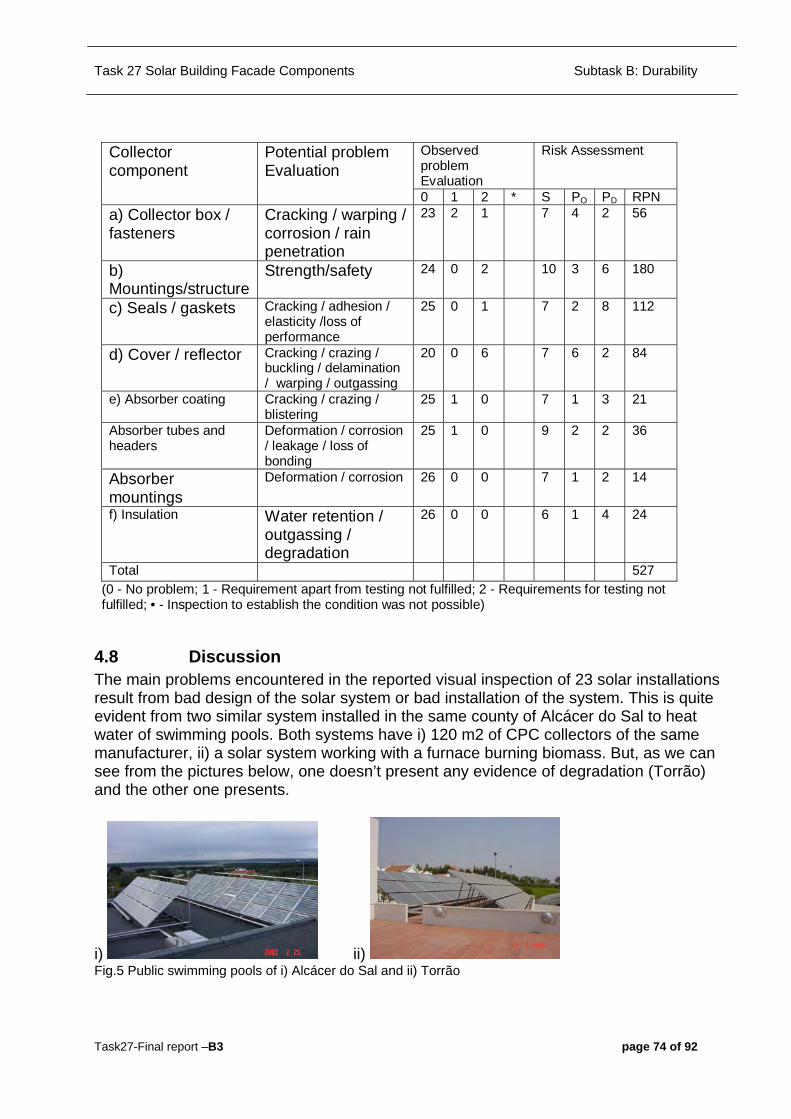
Task 27 Solar Building Facade Components Subtask B: Durability
Task27-Final report –B3 page 74 of 92
Observed problem Evaluation
Risk Assessment Collector component
Potential problem Evaluation
0 1 2 * S PO PD RPN a) Collector box / fasteners
Cracking / warping / corrosion / rain penetration
23 2 1 7 4 2 56
b) Mountings/structure
Strength/safety 24 0 2 10 3 6 180
c) Seals / gaskets Cracking / adhesion / elasticity /loss of performance
25 0 1 7 2 8 112
d) Cover / reflector
Cracking / crazing / buckling / delamination / warping / outgassing
20 0 6 7 6 2 84
e) Absorber coating Cracking / crazing / blistering
25 1 0 7 1 3 21
Absorber tubes and headers
Deformation / corrosion / leakage / loss of bonding
25 1 0 9 2 2 36
Absorber mountings
Deformation / corrosion 26 0 0 7 1 2 14
f) Insulation Water retention / outgassing / degradation
26 0 0 6 1 4 24
Total 527 (0 - No problem; 1 - Requirement apart from testing not fulfilled; 2 - Requirements for testing not fulfilled; • - Inspection to establish the condition was not possible)
4.8 Discussion The main problems encountered in the reported visual inspection of 23 solar installations result from bad design of the solar system or bad installation of the system. This is quite evident from two similar system installed in the same county of Alcácer do Sal to heat water of swimming pools. Both systems have i) 120 m2 of CPC collectors of the same manufacturer, ii) a solar system working with a furnace burning biomass. But, as we can see from the pictures below, one doesn’t present any evidence of degradation (Torrão) and the other one presents.
i) ii) Fig.5 Public swimming pools of i) Alcácer do Sal and ii) Torrão

Task 27 Solar Building Facade Components Subtask B: Durability
Task27-Final report –B3 page 75 of 92
However it is interesting to take a look over the detected problems, showing some evidences from the visual inspection and, when justified, establishing the correspondent fault tree (NUREG-0492, 1981). a) Wrong position for the control sensor It’s a simple problem of bad design and/or of bad installation. It can be easily identified by visual inspection. So it seems to be necessary a specific form, with a checking list of items to be verified, and to be signed by both the installation designer, and the installer, and by an external auditor. b) Galvanic corrosion It results from bad design and/or of bad installation of the solar system. It can be identified by a procedure similar of that proposed in a), using the guide ISO/TR 10217:1989. It is also necessary to implement the training of the installers.
c) Inexistent mechanical protection for insulation It results from bad design and/or of bad installation. It can be avoided by a procedure similar to that of proposed in a).
d) Permanent liaison of primary circuit to network It results from bad design and/or from bad installation. It can be avoided by a procedure similar to that of proposed in a). e) Defective welding It results from bad design and/or from bad installation. It can be avoided by a procedure similar to that of proposed in a).

Task 27 Solar Building Facade Components Subtask B: Durability
Task27-Final report –B3 page 76 of 92
f) Fogginess It can result mainly from • bad design and/or bad manufacture of the ventilation system of the collector box
(see l); • bad design and/or bad manufacture of the confinement system of the solar collector
(see h). g) Precede ageing The main causes are the same of that indicated in f). h) Seal rupture It can result mainly from • bad design and/or bad manufacture of the collector; • inappropriate materials.
The result of the bad design and/or the bad manufacture is detected through the rain penetration test. But, to avoid the use of inappropriate material it is necessary to include in the qualification tests procedure, after the visual inspection, and the dismounting of the solar collector, the specific tests de-scribed in ISO 9553:1997 and ISO 9808:1990, or to include the requirement of the use of certified materials. i) Corrosion flakes The main causes are the same of that indicated in f) j) Circuit with non-equilibrium It can be avoided by a procedure similar to that of proposed in a). k) Control system malfunction It can be avoided by a procedure similar to that of proposed in a). j) Air-vent malfunction By comparison of Tables 2, 3 and 4 we can conclude that the actual set of qualification tests doesn’t include an appropriated test to evaluate the behaviour of the ventilation system of the collector box.

Task 27 Solar Building Facade Components Subtask B: Durability
Task27-Final report –B3 page 77 of 92
It can be avoided by a procedure similar to that of proposed in a).
The work done shows that it is necessary to add to the qualification tests of the collector • the qualification tests of some important components, namely the qualification tests
for absorbers proposed by IEA-SHC Task 27 to CEN, as well those of ISO for rubber seals and sealing compounds (ISO 9553:1997), and for elastomeric materials for absorbers, connecting pipes and fittings (ISO 9808:1990);
• new test procedures for evaluation of the ventilation system of the collector box. The same data shows that it is necessary to walk towards the certification of medium and large installations to avoid the reported bad design of the system installations as well the bad installation of the systems.
4.9 References [1] Bowles J. B. e Enrique C. (1995), Fuzzy logic prioritization of failures in a system failure mode, ef-fects and criticality analysis, Reliability Eng. and System Safe, Vol. 50, pg. 203-213. [2] Braglia M., Frosolini M. e Montanari R. (2003), Fuzzy TOPSIS Approacch for Failure Mode, Effects and Criticality Analysis, Qual. and Rel. Eng. Int., Vol. 19, pg 425-443 [3] Carvalho M. J., Collares-Pereira M., Oliveira J. C., Mendes J. F., Haberle A. e Wittwer V. (1995), Optical and thermal testing of a new 1.12X CPC solar collector, Solar Energy Materials and Solar Cells, Vol. 37, pg. 175-190. [4] Cow K. (2002), FAILURE MODES AND EFFECTS ANALYSIS (FMEA), available, in September 2004, in http://www.npd-solutions.com/fmea.html. [5] ECSS-Q-30-02A:2001 - Failure modes, effects and criticality analysis (FMECA), European Coopera-tion for Space Standardization. [6] Hage R. (2002), Capturing Insulated Glass Failure Events Using Failure Modes and Effects Analysis and Event Trees, available, in September 2004, in http://www.igdurability.org/secure/papers.html [7] Hawkins P.G. and Woolons D.J. (1998), Failure modes and effects analysis of complex engineering systems using functional models, Artificial Intelligence in Engineering, 12, 375-397. [8] Lair J. and Hage R. (2003), Failure Mode Effect and Criticality Analysis - Application to windows and solar components, available, in June de 2004, in http://www.iea-shc-task27.org/ [9] Lair J. (2002), r-c2-CSTB-JL-FMEA solar collector (draft3)-2-2002.doc.doc

Task 27 Solar Building Facade Components Subtask B: Durability
Task27-Final report –B3 page 78 of 92
McDermott R. E., Raymond J. M. and Michael R. B. (1996), The basics of FMEA, ISBN 0-527-76320-9, Productivity Press. [10] Moss T.R. and Woodhouse J. (1999), Criticality analysis revisited, Qual. and Rel. Eng. Int., Vol. 15, pg. 117-121. [11] NUREG-0492 (1981), Fault Tree Handbook. U. S. Nuclear Regulatory Commission, available, in Sep-tember 2005, in http.nrc.gov/reading-rm/doc-collections/nuregs/staff/sr0492/sr0492.pdf. [12] Pillay A. and Wang J. (2003), Modified failure mode and effects analysis using approximate reason-ing, Reliability Engineering and System Safety, Vol. 79, pg. 69–85. [13] Prates M. L. and Duarte C. M. (2003), Identity, Quality and Industrial Design, 1st International Meeting of Science and Technology of Design, Senses and Sensibility in Technol-ogy – Linking Tradition to Innovation Through Design, Proceedings Book, Paper 03-039, September 25-26, Lisbon, IADE/ESD. [14] SAE - J1739:2002 - Potential Failure Mode and Effects Analysis in Design (Design FMEA) and Potential Failure Mode and Effects Analysis in Manufacturing and Assembly Processes (Process FMEA) and Effects Analysis for Machinery (Machinery FMEA), Society of Automo-tive Engineers.

Task 27 Solar Building Facade Components Subtask B: Durability
Task27-Final report –B3 page 79 of 92
ANNEX A: Traditional FMEA scales (Pillay, 2003) Table 1: Traditional FMEA scale for probability of occurrence (Sf)
Probability of occurrence Rating Possible failure rate (operating days) Remote 1 <1:20,000 Low 2 1:20,000 3 1:10,000 Moderate 4 1:2,000 5 1:1,000 6 1:200 High 7 1:100 8 1:20 Very high 9 1:10 10 1:2
Table 2: Severity
Severity Rating
Remote 1 Low 2 3 Moderate 4 5 6 High 7 8 Very high 9 10
Table 3: Detectability
Detectability Rating Probability of detection (%) Remote 1 86–100 Low 2 76–85 3 66–75 Moderate 4 56–65 5 46–55 6 36–45 High 7 26–35 8 16–25 Very high 9 6–15 10 0–5

Task 27 Solar Building Facade Components Subtask B: Durability
Task27-Final report –B3 page 80 of 92
ANNEX B: Criticality ranking (ECSS-Q-30-02A, 2001) Table 1: Severity categories applied at the different levels of analysis
SYSTEM LEVEL FMEA/FMECA Severity category Failure effect Catastrophic 1S Loss of life, life threatening or permanently disabling injury or
occupational illness, loss of an element of an interfacing manned flight system. Loss of launch site facilities. Long-term detrimental environmental effects.
Catastrophic 1 Loss of system. Critical 2S Temporary disabling but not life threatening injury, or temporary
occupational illness. Loss of, or major damage to other flight systems, major flight elements, or ground facilities. Loss of, or major damage to public or private property. Short-term detrimental environmental effects.
Critical 2 Loss of mission. Major 3 Mission degradation. Negligible 4 Any other effect.
SUBSYSTEM/ASSEMBLY/ EQUIPMENT LEVEL FMEA/FMECA
Severity category Failure effect Catastrophic 1S Loss of life, life threatening or permanently disabling injury or
occupational illness, loss of an element of an interfacing manned flight system. Loss of launch site facilities. Long-term detrimental environmental effects.
Catastrophic 1 Propagation of failure to other subsystems/assemblies/equipment. Critical 2S Temporary disabling but not life threatening injury, or temporary
occupational illness. Loss of, or major damage to other flight systems, major flight elements, or ground facilities. Loss of, or major damage to public or private property. • Short-term detrimental environmental effects.
Critical 2 Loss of functionality. Major 3 Degradation of functionality. Negligible 4 Any other effect.
Note: A severity category shall be followed by a suffix – S, for safety impacts, and R, for redundancy. Table 2: Severity numbers applied at the different severity categories
Severity category
1S, 1 catastrophic 4 2S, 2 critical 3 3 major 2 4 negligible 1
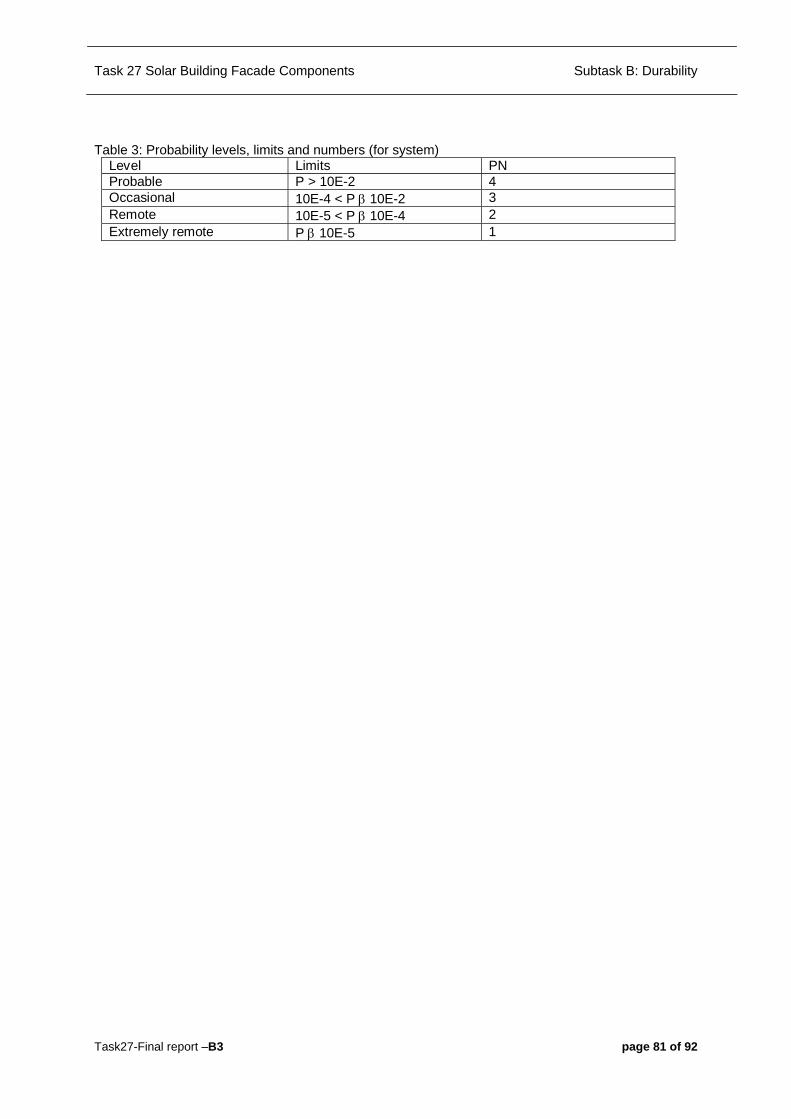
Task 27 Solar Building Facade Components Subtask B: Durability
Task27-Final report –B3 page 81 of 92
Table 3: Probability levels, limits and numbers (for system) Level Limits PN Probable P > 10E-2 4 Occasional 10E-4 < P β 10E-2 3 Remote 10E-5 < P β 10E-4 2 Extremely remote P β 10E-5 1

Task 27 Solar Building Facade Components Subtask B: Durability
Task27-Final report –B3 page 82 of 92
ANNEX C: Process FMECA worksheet (ECSS-Q-30-02A)
Figure 1: Process FMECA worksheet
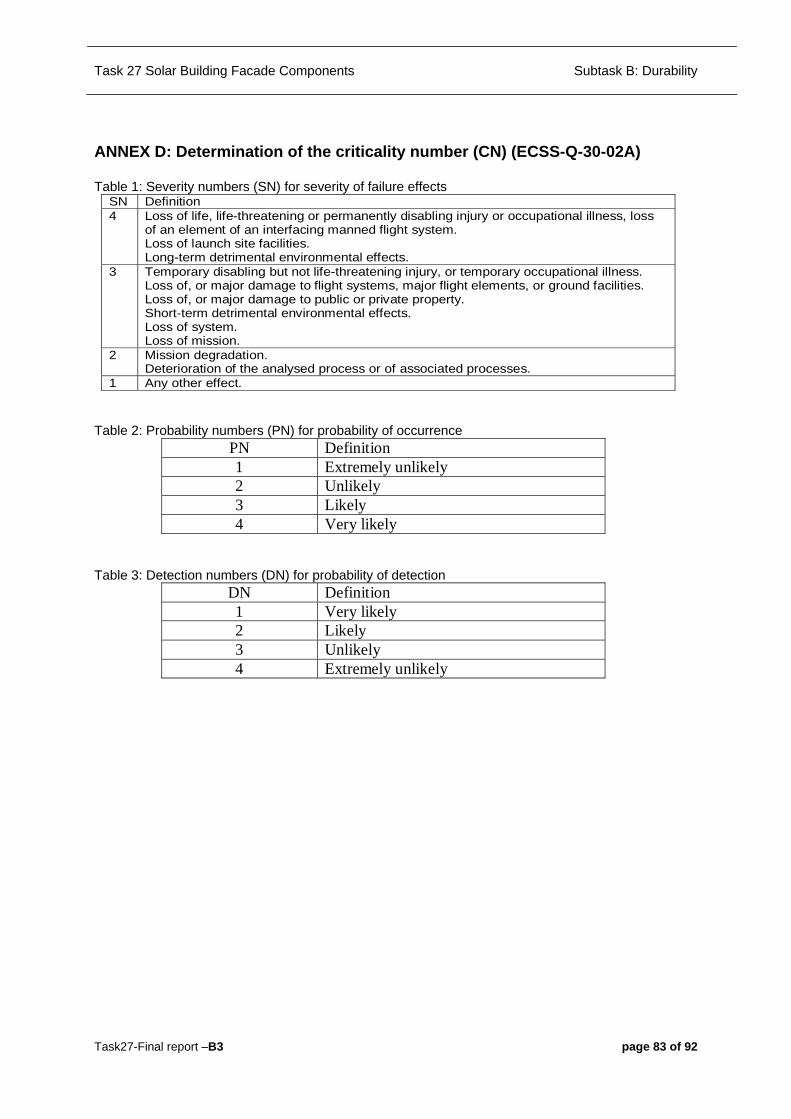
Task 27 Solar Building Facade Components Subtask B: Durability
Task27-Final report –B3 page 83 of 92
ANNEX D: Determination of the criticality number (CN) (ECSS-Q-30-02A) Table 1: Severity numbers (SN) for severity of failure effects
SN Definition 4 Loss of life, life-threatening or permanently disabling injury or occupational illness, loss
of an element of an interfacing manned flight system. Loss of launch site facilities. Long-term detrimental environmental effects.
3 Temporary disabling but not life-threatening injury, or temporary occupational illness. Loss of, or major damage to flight systems, major flight elements, or ground facilities. Loss of, or major damage to public or private property. Short-term detrimental environmental effects. Loss of system. Loss of mission.
2 Mission degradation. Deterioration of the analysed process or of associated processes.
1 Any other effect.
Table 2: Probability numbers (PN) for probability of occurrence
PN Definition 1 Extremely unlikely 2 Unlikely 3 Likely 4 Very likely
Table 3: Detection numbers (DN) for probability of detection
DN Definition 1 Very likely 2 Likely 3 Unlikely 4 Extremely unlikely

Task 27 Solar Building Facade Components Subtask B: Durability
Task27-Final report –B3 page 84 of 92
ANNEX E: Description of solar collectors materials and manufacture (EN 12975-1, Annex B)
AE.1 General The operational ability and long lifetime of solar collectors depend on the correct choice of appropriate materials. Testing of the materials, including accelerated life testing, is very important for the development of new collectors and the prediction of service life. Respective literature is referred to in Annex E. Solar collectors may be affected by airborne fire or radiant heat. The use of non-combustible materials should be preferred. Collectors should comply with the European regulations to fire classification. The collector box should be water-tight to prevent penetration of rain water. The collector box should be constructed in such a way, that condensed water does not accumulate in the collector, as this might impair its functional capability and durability. For that purpose the collector should be properly designed to enable ventilation of air through the collector box. The construction of the collector should ensure that no undue stress is built up in the cover, even at the maximum stagnation temperature of the collector. The materials of collector components should be selected and constructed so, that they can withstand the maximum temperature which may occur at stagnation conditions and the thermal shocks they may exposed to during the summer period. The materials of the collector should preferably be resistant to exposure to UV radiation, and in cases where materials selected are not so, they should be protected against, incident and reflected UV-radiation. Bushings and ducts, leading through the box, should be constructed so that no leakage can occur caused by thermal expansion. The collector box bushings should withstand any damage, if they have to be soldered for assembly. The design of collector should be such, that heat bridges between the collector box and the absorber are avoided. The components and the materials of the collector should be able to withstand the mechanical loads resulting from the heating up and cooling down of the collector. They should also be resistant to environmental stress from outdoor climate caused by factors such as rain, snow, hail, wind, high humidity and air pollutants. AE.2 Absorbers Absorbers should be made from suitable materials to cope with mechanical, thermal and chemical requirements of the application. The effect of the manufacturing processes like cutting, brazing, soldering etc., on the properties of the absorber, should be considered.

Task 27 Solar Building Facade Components Subtask B: Durability
Task27-Final report –B3 page 85 of 92
The absorber ducts which guide the flow of the heat transfer fluid, including the connection lines, should be designed and constructed in such a way that venting can be effected in the installed condition, thus ensuring the functional capability of the collector. Absorbers should be dimensioned on the basis of a calculation pressure corresponding to the permissible working overpressure specified by the manufacturer taking into consideration a safety factor of 1,5. The properties of the heat transfer medium should be considered as well. The effect of the maximum temperature (stagnation temperature) of the absorber should be considered in the selection of material. In the case of materials with strength characteristics, which vary appreciably with the temperature and/or UV-exposure, the evaluation criteria should be determined individually in each case. The wetted side of the absorber should withstand corrosion under normal operating conditions and taking into account the admixture of possible additives to the heat transfer fluid. The walls of swimming pool collectors which are wetted by the swimming pool water should be resistant to the additives used for the treatment of the swimming pool water. Absorber coatings should retain their optical properties under high temperature, high humidity and condensation, and sulfur dioxide at high humidity. AE.3 Transparent covers Solar collectors are generally covered with glass or transparent plastic glazings. The durability of glass and tempered glass under the service conditions found in solar collectors is good, but the resistance of plastics and glass treated with a special coating to the combined effects of UV radiation and temperature may be poor. There may be significant degradation with time, and in the case of a reduced transmission in the solar wavelengths, this will lead to degradation in collector performance. A reduction in the tensile strength or impact strength of a cover material may lead to a failure of the collector cover. The transparency of the covers should not deteriorate appreciably during the service life of the collector, the covers should be resistant to ultraviolet (UV) radiation, air pollution, high humidity and condensate as well as high temperatures depending on the collector design. AE.4 Insulation materials Insulation materials should withstand the local temperature arising during stagnation temperature conditions of the collector. At this temperature no melting, shrinkage or outgasing of the insulation with consequent condensation inside the collector cover, or

Task 27 Solar Building Facade Components Subtask B: Durability
Task27-Final report –B3 page 86 of 92
absorber performance reduction or corrosion of metallic surfaces should occur to the extent of seriously reducing the collector performance. Water or humidity absorption by the insulation material may shortly or permanently reduce the insulation performance of the material. Thermal expansion of the material used in the collector due to the wide range of temperatures should be taken into consideration because of different thermal expansion coefficients. Furthermore transparent insulation materials or teflon layers used, should not deteriorate appreciably, both mechanically and optically, during the service life of the collector due to ultraviolet (UV) radiation, high temperature and humidity. AE.5 Reflectors Reflectors, diffuse or specular, are reflecting surfaces used to increase the radiation, incident on the absorber. The reflecting surface should be resistant to environmental influences such as air pollution and to corrosion through humidity or rain. Outside the collector box reflectors should resist also mechanical loads through wind, snow and hail, whereas inside reflectors should withstand high temperatures. AE.6 Diffusion barriers Diffusion barriers are materials used between absorbers and insulation material to prevent diffusion into or out of the insulation material. They should be able to withstand the absorber high temperatures and the incident UV radiation without shrinking and the high humidity or condensate accumulated remaining tight.
Task 27 Solar Building Facade Components Subtask B: Durability
Task27-Final report –B3 page 87 of 92
11. ANNEX F: Environmental protection (EN 12975-1, Annex B (informative))
AF.1 Heat transfer fluid The heat transfer fluid used should not be toxic, seriously irritant to the human skin or eyes, or water polluting and it should be fully biodegradable. AF.2 Insulation materials For the collector insulation no materials should be used, which have been manufactured using or containing CFCs. Furthermore, the insulation materials should not contain components, which outgas at the stagnation temperature, specified in clause 6, which are toxic and seriously irritant to the human skin or eyes. AF.3 Recycling of the collector materials Solar collectors are mainly used to save energy and reduce pollution. Therefore the design of the collectors should take into consideration the possibility to recycle the materials used. Materials which are not to be recycled should be avoided or used to the lowest possible extent.
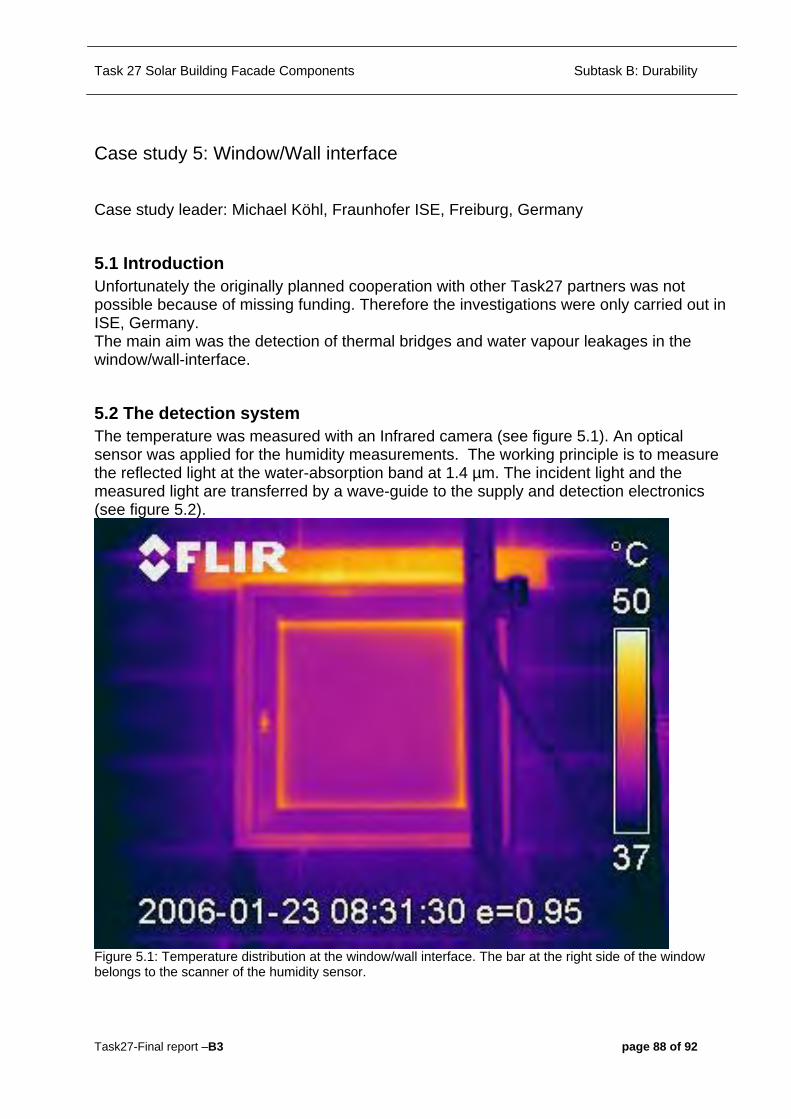
Task 27 Solar Building Facade Components Subtask B: Durability
Task27-Final report –B3 page 88 of 92
Case study 5: Window/Wall interface Case study leader: Michael Köhl, Fraunhofer ISE, Freiburg, Germany
5.1 Introduction Unfortunately the originally planned cooperation with other Task27 partners was not possible because of missing funding. Therefore the investigations were only carried out in ISE, Germany. The main aim was the detection of thermal bridges and water vapour leakages in the window/wall-interface.
5.2 The detection system The temperature was measured with an Infrared camera (see figure 5.1). An optical sensor was applied for the humidity measurements. The working principle is to measure the reflected light at the water-absorption band at 1.4 µm. The incident light and the measured light are transferred by a wave-guide to the supply and detection electronics (see figure 5.2).
Figure 5.1: Temperature distribution at the window/wall interface. The bar at the right side of the window belongs to the scanner of the humidity sensor.

Task 27 Solar Building Facade Components Subtask B: Durability
Task27-Final report –B3 page 89 of 92
Figure 5.2: The humidity sensor mounted on the scanner The waveguide was fixed on the arm of a 2-dimensional scanner which was constructed for scanning an area of 2 m times 2 m in usually in steps of 1 cm. One scan around the window needed about 20 min.
5.3 The subject A commercially available window was mounted in a wall (Dimension 165cm x 215cm x 15cm), as shown in figure 5.3, which was placed between the two parts of the double climatic chamber of the ISE (see figure 5.4).
Figure 5.3: Window in the wall to be tested
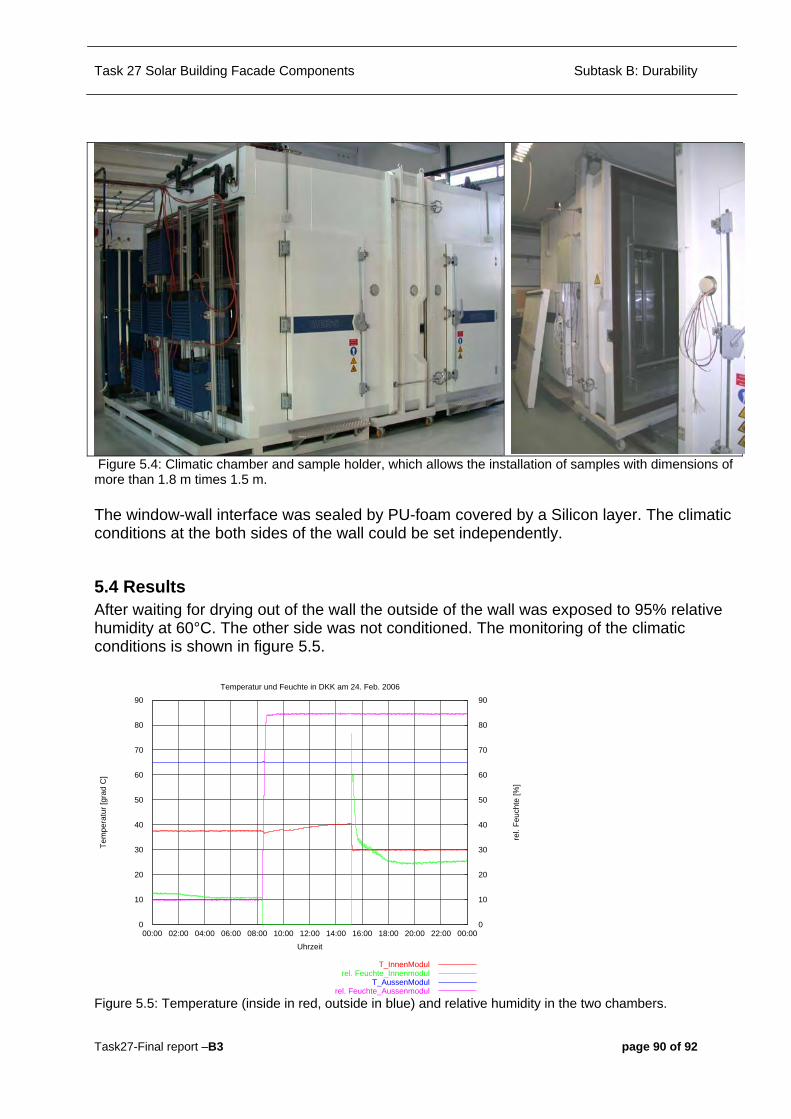
Task 27 Solar Building Facade Components Subtask B: Durability
Task27-Final report –B3 page 90 of 92
Figure 5.4: Climatic chamber and sample holder, which allows the installation of samples with dimensions of more than 1.8 m times 1.5 m. The window-wall interface was sealed by PU-foam covered by a Silicon layer. The climatic conditions at the both sides of the wall could be set independently.
5.4 Results After waiting for drying out of the wall the outside of the wall was exposed to 95% relative humidity at 60°C. The other side was not conditioned. The monitoring of the climatic conditions is shown in figure 5.5.
0
10
20
30
40
50
60
70
80
90
00:00 02:00 04:00 06:00 08:00 10:00 12:00 14:00 16:00 18:00 20:00 22:00 00:00 0
10
20
30
40
50
60
70
80
90
Tem
pera
tur [
grad
C]
rel.
Feuc
hte
[%]
Uhrzeit
Temperatur und Feuchte in DKK am 24. Feb. 2006
T_InnenModulrel. Feuchte_Innenmodul
T_AussenModulrel. Feuchte_Aussenmodul
Figure 5.5: Temperature (inside in red, outside in blue) and relative humidity in the two chambers.

Task 27 Solar Building Facade Components Subtask B: Durability
Task27-Final report –B3 page 91 of 92
The measurements with scanner and IR camera are shown in figure 5.6 and 5.1.
Messwert der Feuchtemessung am 24. Feb. 2006
"20060124.dkk" us ($7*15/20000):($8*14/20000):6
0 20 40 60 80 100 0 10 20 30 40 50 60 70 80
-4-3-2-1 0 1 2 3 4 5 6
Figure 5.6: Signal of the humidity sensor by scanning the window-wall interface frequently. The upper lines come from the top part. Four leaks became visible after some time. The 3 smaller leaks at the low part came from water droplets which penetrated through the frame sealant and were sucked by the wall (see figure 5.7). The leakage at the top-side resulted from a ventilation opening. This opening can be identified in the infrared picture (figure 5.1) as well.
Figure 5.7: Condensation in the window frame and wetting of the wall at the bottom side.

Task 27 Solar Building Facade Components Subtask B: Durability
Task27-Final report –B3 page 92 of 92
Figure 5.8: Condensation in the window frame, ventilation opening and wetting of the wall at the top side.
5.5 Conclusions The optical humidity sensor combined with a xy-scanner allows the detection of water leaks. Further investigations should assess the potential for using the scanner in-situ during long-term durability tests for the detection of growing leaks.