performance-based seismic evaluation of vertically
TRANSCRIPT
SSRG International Journal of Civil Engineering Volume 8 Issue 6, 8-19, June 2021 ISSN: 2348 – 8352 /doi:10.14445/23488352/IJCE-V8I6P102 ©2021 Seventh Sense Research Group®
This is an open access article under the CC BY-NC-ND license (http://creativecommons.org/licenses/by-nc-nd/4.0/)
Performance-based Seismic Evaluation of
Vertically Irregular Moment Resisting Reinforced
Concrete Frames using Nonlinear Statics Analysis Abdul Mabood1*, Mohd.Zameerruddin2, P.M. Shimpale3
1PG Student, Department of Civil Engineering, MGM’s College of Engineering Nanded, Maharashtra, India.,
2Associate Professor, Department of Civil Engineering, MGM’s college of Engineering, Nanded Maharashtra,
India.
3Associate Professor, Department of Civil Engineering, MGM’s college of Engineering, Nanded, Maharashtra,
India.
Received Date: 02 May 2021 Revised Date: 04 June 2021
Accepted Date: 15 June 2021
Abstract
Nonlinear static procedures are used mainly for evaluation
of the capacity of structures subjected to the seismic loads.
During the seismic events reinforced concrete structures
get damaged or collapsed. These damages happen due to
the improper distribution of structural mass, structural
stiffness and structural strength. In the structural irregular
frames damages appears along the section which are
geometrically unstable. This vulnerability of the irregular frame has caused discomfort among the stakeholders,
especially for the multi-storeyed structures. In this study,
we had performed nonlinear static analysis of the irregular
frames, typically representing the vertical irregularities.
The engineering demand parameters such as base shear,
displacement, ductility, stiffness and inter-storey
displacement were used to evaluate the performance of
these frames. In addition an attempt has been made to
correlate the damage state of frames with the identified
performance level described in the performance-based
seismic design documents.
Keywords - Structural Irregularities, Nonlinear Static Procedures, Example MRFs, Engineering Demand
Parameters
INTRODUCTION
The seismic events which happened all over the world had
destructive effects on the structures, which has forced the
professional structural designers to implement the
earthquake resistant design of the structures for safety of
life and usage of structures [Ghobarah A, 2001;
Zameeruddin and Sangle, 2016]. The scarcity of the
availability of residential land and increase in the cost of
the construction, especially in the urban areas has led
towards the development of the multi-storeyed structures. The behaviour of multi-storeyed structure under the
seismic loads depends on structural configurations.
Irregular structural configurations either in plan or
elevation are the major causes of failures during seismic
events [Siva et al., 2019].
The earthquake resistant design methodologies
described in the present seismic codes are not capable
to address the inelastic behaviour of reinforced concrete
sections subjected to inelastic incursion. These codes
provide the indirect approach of applying modification
factor to the strength and displacements to take care of
inelastic incursion [Mondal et al., 2013]. The predictive
method of design available in the Performance-based
Seismic Design (PBSD) documents proved to be the best alternative towards this code based procedures
[FEMA 445, 2005; Zameeruddin and Sangle, 2021].
Performance evaluation procedure defined in PBSD
documents are based on the nonlinear static or
nonlinear dynamic analysis procedures. Due to ease in
its procedure, the nonlinear static methods have become
more common among the practicing engineers. The
performance evaluation procedures based on the
nonlinear static method include; (a) Capacity Spectrum
Method (CSM) and Displacement Coefficient Method
(DCM). [ATC 40, 1996; FEMA 273, 1996; FEMA 356,
2000; ASCE/SEI 41, 2007; Zameeruddin and Sangle,2021; Boroujeni ARK 2013].
In PBSD the performance of the structure is evaluated
on the basis of the damages sustained by structural and
non-structural component. These performance levels
are identified as operational levels, immediate
occupancy, life safety range and collapse prevention.
The performance analysis results into the collapse
mechanisms which show the yielding of structural
components, but are not capable to provide any damage
value.
In this study, an attempt has been made to assess the performance of example moment resisting frames
(MRFs) with different irregular configurations
subjected to the lateral load patterns as described in the
IS 1893 [2002]. The performance assessment includes
parametric studies on fundamental period, roof
displacement, inter-story drift ratio, and base shear. In
addition, we had attempted to find the global damage

Abdul Mabood et al. / IJCE, 8(6), 8-19, 2021
9
Elastic demand spectrum
Performance point
Reduced demand spectrum
Capacity
spectrum
value by using the results obtained from PBSD and
integrate it with the performance levels.
STRUCTURAL IRREGULARITIES
Modernization in the housing and infrastructure sector has
raised the demand of multi- storeyed structures. To meet the minimum standards of the floor space ratio of multi-
storeyed structures, irregular structural configuration has
become a common practice. This had resulted in the
construction of buildings with irregular distributions of
mass, stiffness and strength along the height of the building
[Bhosale et al., 2017; Soni and Mistry, 2006].
In IS 1893:2002 various irregularities have been
mentioned. There are two categories of irregularities:
vertical and horizontal. Table 1 summarizes all such
classifications. The present study considers vertical
irregularities in multi-storeyed structures. In general three
forms of the vertical irregularities are being in practice for the construction of multi-storeyed structures. These include
(a) set-back buildings, (b) buildings with floating columns,
(c) in plan discontinuity and (d) open ground storey. Figure
1 shows the vertical geometric irregularity as per IS
1893:2002.
When such multi-storeyed structures are located in a high
seismic zone, the seismic performance evaluation becomes
more challenging. The methods of quantitative
performance evaluation given in present codes of practice
for the irregular multi-storeyed structures listed in Table 1
are not always supported by the structural characteristics. Most seismic codes suggest the use of dynamic analysis for
estimation of the lateral load distribution over the structure
(may use the elastic time history or elastic response
spectrum analysis). To understand the nonlinear response
of the structure using a dynamic analysis is a complex job,
hence it is not preferred in the common design practice.
Comparatively non-linear static procedures (NLSP) are
simplest one, hence found to be common in the design
practice. The present study aims to have a parametric study
of engineering demand parameters using results obtained
NLSPs. Also a damage indicator is being proposed, to
assess the damage state of structure at various performance levels stated in PBSD.
NONLINEAR STATIC PROCEDURES
Contribution of research and experimental studies done in
the field of seismic engineering has improved the seismic
design and assessment procedures. With the intention to
communicate the safety-related decisions to the
stakeholders, the design engineers have shifted their focus
towards the predictive methods of the seismic design. This
resulted into the development of PBSD [Zameeruddin and
Sangle 2017a].
The developments in the PBSD can be traced through the publication of the documents; The first generation
documents (ATC 40 and FEMA 273), Second generation
document (FEMA 356), and Next-generation document
(FEMA 440 and FEMA 445). The PBSD document
recommends various analysis methods for estimation of the
seismic response of reinforced concrete structures, as
presented in the Table 2 [Zameeruddin and Sangle, 2021;
Boroujeni ARK 2013].
Table 2: Various analysis procedures to estimate
seismic responses recommended by PBSD
These documents provided two approaches of performance-
based seismic (PBSE) evaluation: (a) capacity spectrum
method and (b) displacement coefficient method. PBSE
procedures use NLSP procedure to evaluate the capacity of structure subjected to seismic loads. In the capacity
spectrum method the capacity curve is obtained by using
NLSP and is overlapped with the inelastic demand curve to
obtain the performance point. Displacement coefficient
method is a simple method for estimating the target
displacement. Target displacement refers to the
displacement of a characteristic node, specifically on the top
of a structure. Fig. 2 and 3 presents the PBSE procedures.
Fig. 2: Determination of performance point as per CSM
procedures
The accuracy of NLSP depends on the inelastic modelling
of reinforced concrete members. The inelastic
characteristics of the reinforced concrete members are
introduced by assigning the plastic hinges. PBSE put forth
two actions of plastic hinges viz. deformation-controlled
(ductile action) or force-controlled (brittle action). In the
present study the effects of axial force on beams were
disregarded, considering the presence of rigid diaphragms.
However, these effects were considered for the columns. Fig. 4 and Table 3-4 gives details of plastic rotation limits
for reinforced concrete beams and columns described in
PBSE documents.
In this study, we performed displacement-controlled NLSP
Type of
Analysis
Usual
Name
Dynamic
Effect
Material
Nonlinearity
Linear Statics Equivalent
static
NO NO
Linear
Dynamic
Response
spectrum
YES NO
Nonlinear
Statics
Pushover NO YES
Nonlinear
Dynamic
Time
history
YES YES

Abdul Mabood et al. / IJCE, 8(6), 8-19, 2021
10
on the example MRFs by using SAP 2000 V 20.0 (Wilson
and Habibullah, 2000). The target displacement used for
each MRF was 4% of the height of the frame (ATC 40,
1996). The analysis was conducted in two stages for the
following: (i) gravity loads and (ii) predominant lateral
loads.
Table 1: Structural irregularities defined in IS 1893: 2002
Sr, No. Types of Irregularity Classification Limits
1 Torsion irregularity Plan irregularity emax=1.2∆avg
2 Diaphragms irregularity Plan irregularity Di =0.50 Gross diaphragms area
3 Stiffness irregularity
A) Soft storey
B) Extreme soft storey
Vertical Irregularity Si<0.70 Sa or
Si<0.80 S3avg
Si<0.60 Sa or
Si<0.70 S3avg
4 Mass irregularity Vertical Irregularity Mi<2.0 Ma
5 Vertically geometric irregularity Vertical Irregularity Vg < 1.5 Vga
6 Discontinuity in capacity weak
storey
Vertical Irregularity Strength <0.80 times
the Strength of the above floor
Where ‘a’ states the adjacent storey number, ∆avg is average displacement of adjacent stories and 3avg implies average of
three storeys
Fig.1: Vertical geometric irregularity as per IS 1893:2002
In Stage I, gravity loads were applied as the distributed
element loads on the basis of the yield line theory and
concentrated loads from secondary beams. Gravity
analysis was performed for full gravity load in a single
step (i.e., force-control). The state of the structure in this
analysis was saved and was subsequently recalled in Stage
II. In Stage II, lateral loads were applied monotonically in
a step by-step nonlinear static analysis. Because the lateral
force profile in pushover analysis influences the structural
response. IS1893:2002 trivial lateral load patterns were
applied.
EXAMPLE MRFs
The example MRFs considered for this study represents
regular and irregular frames along vertical profile. The
vertical irregularities is introduced in the MRFs in
accordance to the guidelines of IS 1893:2002. Table 5
provides the details of example MRFs. These MRFs are
considered to be bare frames located in the zone V (zone
factor, 0.36) which is the severest zone as per IS 1893 and
soil type is medium. The structure importance factor used
is 1.0. The modification factor of 5 was used to account for
the ductility in MRFs.
Fig. 5: shows the typical layout of the example MRFs.
Three different types of vertically irregularities have been
considered in the present work which, are commonly
found in urban constructions. Vertical irregularity
introduced represents set-back of 20 and 40 percent of the plan width of the structure. Similar regular building having
no unusual irregularity in spatial form have been studied
for benchmark the results of the parametric studies.
For the analysis, the dead loads, live (imposed) loads, and

Abdul Mabood et al. / IJCE, 8(6), 8-19, 2021
11
seismic loads on example MRFs were considered as per IS
875 (Part 1 and 2) (1987) and IS 1893 (2002), respectively.
These MRFs carries a mean dead load of40 kN/m,
inclusive of the finishes loads and a mean live load of 9
kN/m, for all floors. The design of reinforced concrete
sections is done following the guidelines of IS 456 and
their detailing is done as per IS 13920 specifications. Table
6 provides the material properties and design constants
used in the design. Table 7-8 shows the design details of
the reinforced concrete sections.
Fig. 4: Idealized inelastic force–deformation relationship
Table 3: Plastic rotation limits for RC beams controlled by flexure (FEMA 356)
CONDITIONS
Modelling Parameters Acceptance Criteria
Plastic rotation
angle
(radians)
Residual
strength
ratio
Plastic rotation angle (radians)
Performance level
𝑃
𝐴𝑔𝑓′𝑐
Trans.
Reinf.
𝑉
𝑏𝑤𝑑√𝑓′𝑐 IO
Component type
Primary Secondary
a b c LS CP LS CP
≤ 0.5 C ≤ 3 0.02 0.03 0.2 0.005 0.010 0.02 0.02 0.03
C indicates the transverse reinforcement meets the criteria for ductile detailing
Table 4: Plastic rotation limits for RC columns controlled by flexure (FEMA 356)
CONDITIONS
Modelling Parameters Acceptance Criteria
Plastic
rotation
angle
(radians)
Residual
strength
ratio
Plastic rotation angle (radians)
Performance level
𝑃
𝐴𝑔𝑓′𝑐
Trans.
Reinf.
𝑉
𝑏𝑤𝑑√𝑓′𝑐 IO
Component type
Primary Secondary
a b c LS CP LS CP
≥ 0.1 C ≤ 3 0.02 0.03 0.2 0.005 0.015 0.02 0.02 0.03
C indicates the transverse reinforcement meets the criteria for ductile detailing

Abdul Mabood et al. / IJCE, 8(6), 8-19, 2021
12
Table 5: Details of example MRFs used in the study
Frames Height (m) Td (s) Wi (kN) Ah = Vd/W Vd (kN)
S10B5VG0 30 0.961 7064.08 0.05 359.78
S10B5VG20 30 0.961 4864.12 0.05 247.73
S10B5VG40S 30 0.961 6334.06 0.05 322.60
S10B5VG40T 30 0.961 6469.37 0.05 329.49
S represents No. of storey, B says the number of bays and VG shows vertical irregularities of different type and
percentages
Table 6: Material properties considered in the design of example MRF [IS456, IS1786]
Material property Concrete Steel
M 25 Grade Fe 415 grade
Weight per unit volume (kN/m3) 25 76.97
Mass per unit volume (kN/m3) 2.548 7.849
Modulus of elasticity (kN/m2) 25E+06 2E+08
Characteristic strength (kN/m2) 25000 (for 28 days) 415000 (yield)
Minimum tensile strength (kN/m2) - 485800
Expected yield strength (kN/m2) - 456500
Expected tensile strength(kN/m2) - 533500
The structural design of the example MRFs is not a unique
solution available for the calculated demand. Based on the
same demand, different designers may select different
solutions. The RC member sizes were selected by
following a common practice adopted by engineers. All the
columns and beams in a selected story are identical in
cross section. The column remained uniform in cross section up to two or three stories, depending on the height
of the building. Table 9 describes the modal analysis
results of example MRFs.
5 @ 3 m c/c
S10B5VG0
5 @ 3 m c/c
S10B5VG20
S10B5VG40S
5 @ 3 m c/c
10@
3 m
c/c
A/L = 0.20
3m 3m
3m
3m
A/L = 0.40
10
@ 3
m c
/c

Abdul Mabood et al. / IJCE, 8(6), 8-19, 2021
13
S10B5VG40T
Fig. 5: Selected vertical irregular buildings
PARAMETRIC STUDIES
The performance-based seismic design has two primary
concerns: (a) appropriate quantification of the uncertainties
associated with the performance evaluation process, and (b) satisfactory characterization of the associated structural
damage for direct incorporation into the design or
performance evaluation methodology [Zameeruddin and
Sangle, 2021]. The performance of example MRFs is
evaluated on the basis of the parametric studies done on
the fundamental period of vibration, base shear, roof
displacement, story displacement, and inter-story drift
ratio.
Table 7: Summary of designed column section for example MRF
Example MRFs Storey
No
External /Internal column Beams
size (mm) Rebar’s
(mm2)
size (mm) Rebar’s (mm2)
For all MRFs 1-3 300 x 600 4910 300 x 450 Default values
4-6 300 x 530 3920 300 x 450 provided by
7-10 300 x 450 2946 300 x 380 SAP 2000 V 20.0
Table 8: Modal Analysis results of studied example MRFs
Storey
Level
S10B5VG0 S10B5VG20
Modal
time
Modal
Frequency
Stiffness
(kN/mm)
Lateral
Loads
Modal
time
Modal
Frequency
Stiffness
(kN/mm)
Lateral
Loads
Period
(Tm)
cycles/sec (kN) Period
(Tm)
cycles/sec (kN)
1 1.428 0.699 361.35 1.10 1.345 0.743 361.35 1.24
2 0.504 1.980 361.35 4.43 0.483 2.068 361.35 4.89
3 0.287 3.474 361.35 9.90 0.282 3.534 240.81 6.76
4 0.192 5.197 249.48 17.49 0.194 5.144 166.23 11.94
5 0.140 7.101 249.48 27.34 0.141 7.087 166.23 18.66
6 0.126 7.913 249.08 39.08 0.121 8.244 165.99 26.66
7 0.115 8.649 152.82 52.81 0.109 9.157 101.82 36.00
8 0.111 9.000 152.82 68.13 0.101 9.893 101.82 46.45
9 0.102 9.764 152.82 86.23 0.086 11.60 101.82 58.79
10 0.090 10.975 152.82 53.23 0.083 12.04 101.82 36.29
Table 9: Modal Analysis results of studied example MRFs
Storey
Level
S10B5VG40S S10B5VG40T
Modal
time
Modal
Frequency
Stiffness
(kN/mm)
Lateral
Loads
Modal
time
Modal
Frequency
Stiffness
(kN/mm)
Lateral
Loads
Period
(Tm)
cycles/sec (kN) Period
(Tm)
cycles/sec (kN)
1 1.284 0.778 361.35 1.275 1.288 0.776 361.35 1.296
2 0.497 2.00 361.35 5.10 0.451 2.215 361.35 5.182
3 0.287 3.481 361.35 11.40 0.271 3.681 361.35 11.58
4 0.196 5.084 249.48 20.14 0189 5.282 249.48 20.47
3m 3m
3m 3m
A/L = 0.40
5 @ 3 m c/c

Abdul Mabood et al. / IJCE, 8(6), 8-19, 2021
14
5 0.142 7.033 249.48 31.48 0.140 7.106 249.48 31.98
6 0.122 8.138 249.08 44.69 0.121 8.264 249.08 45.72
7 0.110 9.030 127.32 48.81 0.115 8.692 152.82 61.78
8 0.105 9.460 127.32 62.43 0.104 9.556 152.82 78.61
9 0.092 10.758 101.82 60.12 0.097 10.24 101.82 59.69
10 0.089 11.145 101.82 37.11 0.095 10.50 50.81 13.14
The natural period of vibration, of example MRFs
evaluated from the empirical equation given in IS 1893 for
the buildings without infills, is presented in Table 5. Also,
modal analysis of the example MRFs has been performed
to determine a fundamental period of vibration by using
Eigen values; the results are reported in Table 8-9. The fundamental period is the first-mode longest modal time
period of vibration. The fundamental period obtained from
the Eigen value analysis is found to be higher than the
values derived using the code empirical relation. The
difference in the time period of vibration (reported in
Table 10) can be attributed towards the changes in the
cross-sectional areas of RC members and the span of
member of a building which is not taken in to account by
the IS code empirical relationship. A modal participating
mass ratio shown in Table 11 describes the correlation
between higher mode participation and irregularity.
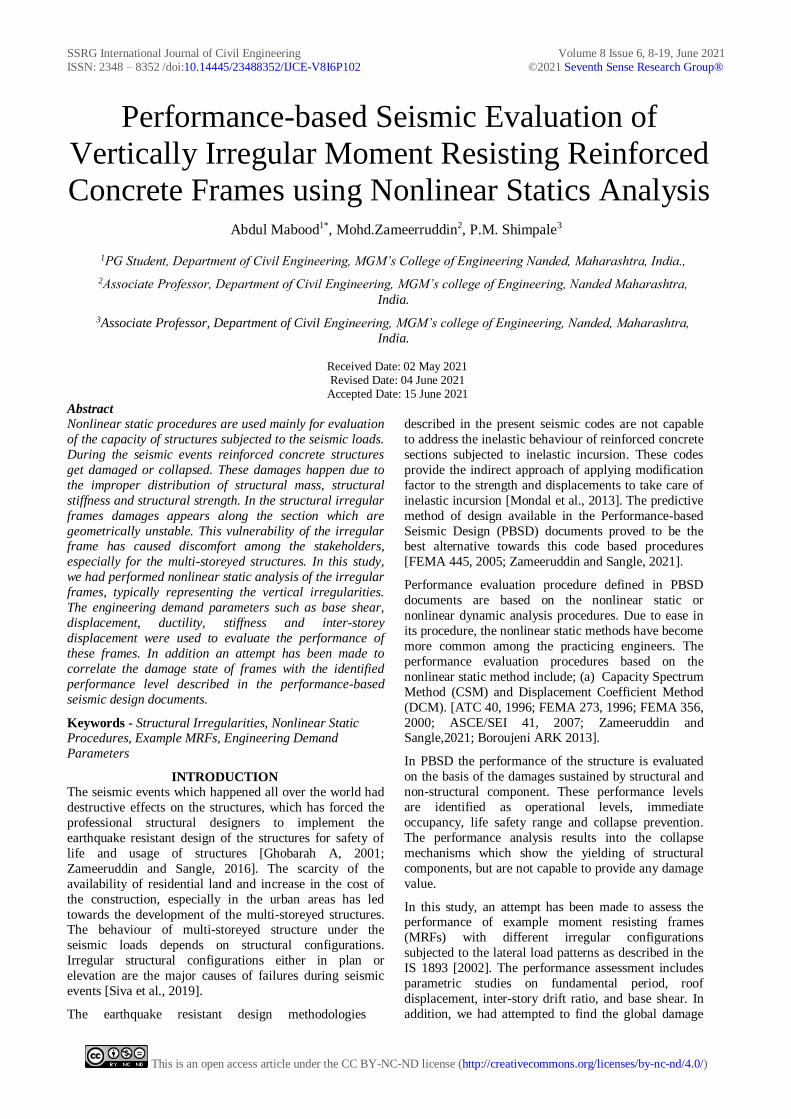
The NLSP was performed on the example MRFs for lateral load distribution obtained with reference to IS 1893:2002
guidelines using SAP 2000 V 20. The results of NLSP are
shown in the form of the pushover curves, which are
typically the base force versus roof displacement plot. Fig.
6 shows pushover curves of the example MRFs. The
intersection of capacity curve with the inelastic demand
spectra gives the performance point. Table 12 gives the
values of the base force and displacement obtained at the
performance point for various PBSE methods applied to
example MRFs
The values of the roof displacement obtained from various
PBSE methods showed that the displacement of MRF with
set-back vertical irregularity is largest one compare to
other type of example irregular MRFs.
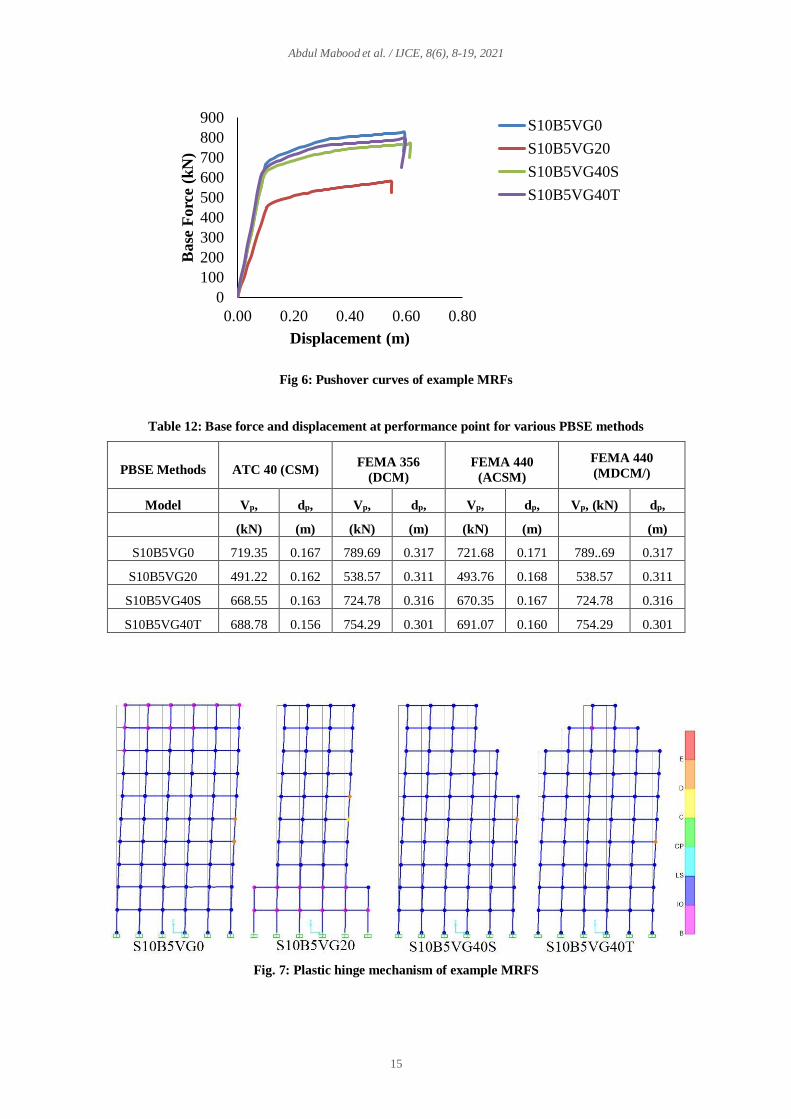
Fig 7 represents the collapse mechanism of the example
MRFs showing the yield of plastic hinges from one
performance level to other performance level. In PBSD the
performance levels are defined in terms of damages sustain
by the structural and non-structural components of a
structure during a seismic event, namely Operational (OP),
Immediate Occupancy (IO), Life Safety range (LS),
Collapse Prevention (CP) and Collapse (C).
.
Table 10: Modal Analysis results of studied example MRFs
Example MRF Tm Td Difference (%) =
[Tm-Td/Td]x100
S10B5VG0 1.428 0.96 + 48.80
S10B5VG20 1.345 0.96 + 40.10
S10B5VG40S 1.284 0.96 + 33.80
S10B5VG40T 1.288 0.96 + 34.20
Table 11: Modal Participation factors of studied example MRFs
Example MRF Mode1 Mode 2 Mode 3
S10B5VG0 0.77 0.11 0.04
S10B5VG20 0.66 0.14 0.08
S10B5VG40S 0.76 0.10 0.05
S10B5VG40T 0.77 0.10 0.04
Abdul Mabood et al. / IJCE, 8(6), 8-19, 2021
15
Fig 6: Pushover curves of example MRFs
Table 12: Base force and displacement at performance point for various PBSE methods
PBSE Methods ATC 40 (CSM) FEMA 356
(DCM)
FEMA 440
(ACSM)
FEMA 440
(MDCM/)
Model Vp, dp, Vp, dp, Vp, dp, Vp, (kN) dp,
(kN) (m) (kN) (m) (kN) (m) (m)
S10B5VG0 719.35 0.167 789.69 0.317 721.68 0.171 789..69 0.317
S10B5VG20 491.22 0.162 538.57 0.311 493.76 0.168 538.57 0.311
S10B5VG40S 668.55 0.163 724.78 0.316 670.35 0.167 724.78 0.316
S10B5VG40T 688.78 0.156 754.29 0.301 691.07 0.160 754.29 0.301
Fig. 7: Plastic hinge mechanism of example MRFS
0
100
200
300
400
500
600
700
800
900
0.00 0.20 0.40 0.60 0.80
Base
Forc
e (k
N)
Displacement (m)
S10B5VG0
S10B5VG20
S10B5VG40S
S10B5VG40T

Abdul Mabood et al. / IJCE, 8(6), 8-19, 2021
16
The story drift is a useful and simple measure of the
overall structural deformation that is routinely examined.
Fig. 9 illustrates that storey displacement and Fig. 10
presents the inter- story drift ratio of the example MRFs. It
was observed that the set-back vertical irregularities are on
higher values displacements compare to the other type of
irregularities. The storey displacement and inter-storey
may help a designer to choose a type of vertical
irregularities to be introduced in a unavoidable situations.
Fig. 9: Storey displacements of example MRFs
Fig. 10: Inter-storey drift ratio of example MRFs
To evaluate the damages for example MRFs two performance indicator levels is proposed (a) PL1 – which includes OP
and IO levels as damages to structural components are repairable and no threat to life (b) PL2- which includes LS, CP and
C levels as damages to structural components are irreparable, downtime for usage and risk to life is involved. The ductility
ratio (μ) and overstrength (Ω) derived from pushover results at PL1 and PL2 are given in Table 13-14.
Table 13: Pushover parameters for PL1 (considering P-∆) effects
Example Vd Vu VPL1 dy du dPL1 μ = Ω = μ’ = Ω’ =
MRFs (kN) (kN) (kN) (m) (m) (m) du/dy Vu/Vy du/dPL1 VU/VPL1
S10B5VG0 359.78 825.8 737.77 0.178 0.595 0.201 3.34 2.30 1.13 2.05
S10B5VG20 247.73 580.38 443.66 0.096 0.55 0.101 5.73 2.34 1.05 1.79
S10B5VG40S 322.6 767.28 588.6 0.084 0.616 0.089 7.33 2.38 1.06 1.82
S10B5VG40T 329.49 789.83 708.77 0.18 0.597 0.192 3.32 2.40 1.07 2.15
0
2
4
6
8
10
12
0 0.2 0.4 0.6 0.8
Sto
rey N
o.
Storey Drift (m)
S10B5VG0
S10B5VG20
S10B5VG40S
S10B5VG40T
0
1
2
3
4
5
6
7
8
9
10
0 0.05 0.1 0.15 0.2
Sto
rey
No
.
IDR
S10B5VG0S10B5VG20S10B5VG40SS10B5VG40T

Abdul Mabood et al. / IJCE, 8(6), 8-19, 2021
17
Table 14: Pushover parameters for PL2 (considering P-∆) effects
Example Vd Vu VPL2 dy du dPL2 μ = Ω = μ’ = Ω’ =
MRFs (kN) (kN) (kN) (m) (m) (m) du/dy Vu/Vy du/dPL1 VU/VPL1
S10B5VG0 359.78 825.8 825.8 0.178 0.595 0.595 3.34 2.30 3.34 2.30
S10B5VG20 247.73 580.3 506.93 0.096 0.550 0.230 5.73 2.34 2.40 2.05
S10B5VG40S 322.6 767.28 690.9 0.084 0.616 0.213 7.33 2.38 2.54 2.14
S10B5VG40T 329.49 789.83 789.8 0.180 0.597 0.597 3.32 2.40 3.32 2.40
In its present form PBSE procedures are capable to provide
the plastic hinge collapse mechanism, but are not able to
provide any associated damage value. Many researchers
have provided damage index using response parameters yield from NLSP and Nonlinear dynamic procedures, but
still they are not been common in practice
due to complex assessment procedures [Zameeruddin and
Sangle, 2017b, 2017c, 2020; Mihaită, 2015; Powell and
Allahbadi, 1988]. In this study, we have attempted to
evaluate the damage to the example MRFs using loss of stiffness during pushover.
Fig. 8: Loss of stiffness during pushover
Fig. 8 shows the loss of stiffness during a pushover
analysis. Table 15-16 gives the values of parameters used
in the evaluation of damage value. The damage indicator
are calibrated based on stiffness and drift values obtained
at yield, PL1, PL2 and collapse state of example MRFs
when subjected to pushover. The damage indicator
presents the loss of stiffness and ductility at identified
performance levels. The empirical relationships used are;
DIkPL1 = 1- (KPL1/ Kop)
DIkPL2 = 1-(KPL2/ Kop)
Where Kop is stiffness of structure in operational level;
KPL1 and KPL2 are the stiffness of structure at PL1 and
PL2
DIμPL1 = 1- [(dPL1-dy)/(du-dy)]
DIμPL2 = 1- [(dPL2-dy)/(du-dy)]
Where dy, dPL1, dPL2 and du are the values of
displacements at yield, PL1, PL2 and ultimate state.
Table 15: Calculation of stiffness and drift based
damage values at PL1
Example
MRFs
Kop KPL1 KPL2 DIkPL
1
DIkPL
2
S10B5VG0 4072.56 3670.50 1387.90 0.10 0.659
S10B5VG20 4376.41 4392.67 2204.04 0.00 0.496
S10B5VG40S 6653.94 6616.40 3243.66 0.01 0.513
S10B5VG40T 3903.67 3691.51 1322.95 0.05 0.661
0
1000
2000
3000
4000
5000
6000
7000
8000
0.00 0.20 0.40 0.60 0.80
Sti
ffn
ess
(kN
/m)
Displacement (m)
S10B5VG0
S10B5VG20
S10B5VG40S
S10B5VG40T

Abdul Mabood et al. / IJCE, 8(6), 8-19, 2021
18
Table 16: Calculation of stiffness and drift based
damage values at PL2
Example
MRFs
dy
(m)
du (m) dPL1
(m)
dPL2
(m)
DIμPL1 DIμPL2
S10B5VG0 0.178 0.595 0.201 0.595 0.945 0.00
S10B5VG20 0.096 0.550 0.101 0.230 0.989 0.70
S10B5VG40S 0.089 0.616 0.089 0.213 1.000 0.76
S10B5VG40T 0.18 0.597 0.192 0.597 0.971 0.00
Conclusions
With the increasing demand of functional and aesthetic
architecture a complex shaped structures are becoming
very common. The complex shaped geometry has
introduced horizontal and vertical irregularities in a
structure in terms of mass, stiffness and strength. When these structures were subjected to seismic loads they were
severely damaged or collapse demanding seismic
evaluation and damage assessment. PBSD has emerged as
best alternative towards present seismic codes which states
multiple performance levels under seismic hazards. In
present study, the performance evaluation and damage
assessment of vertically irregular buildings were studied
under the guidelines of PBSD document. The conclusion
drawn from these studies are;
1. IS 1893 provides the empirical relation to
estimate the fundamental period of vibration to estimate inertia loads acting on a
structure. The fundamental period obtained
from the Eigen value analysis is found to be
higher than the values derived using the
code empirical relation. This difference in
the time period of vibration can be attributed
towards the changes in the cross-sectional
areas of RC members and the span of
member of a building which is not taken in
to account by the IS code empirical
relationship.
2. A modal participating mass ratio describes the correlation between higher mode
participation and irregularity. Building with
set-back irregularity shows higher first mode
participation factor compare to other type of
vertical irregularity studied.
3. Various performance evaluation methods
described in PBSD document were use to
evaluate the performance of structure. The
values of the roof displacement obtained
from these PBSE methods at performance
point showed that the displacement of MRF with set-back vertical irregularity is largest
one compare to other type of example
irregular MRFs.
4. The primary concern of PBSD is to evaluate
the performance of structure and assess the
damages sustain by the structure. In its
present state the PBSE methods are capable
to evaluate the yield mechanism but do not
convey any damage values.
5. Within the dimension of performance levels
defined in PBSE, some performance
indicator levels are grouped to show global
damages to the structure as PL1 and PL2.
PL1 uses OP and IO performance levels
where repairs and less threat to life are
assured, while PL2 uses LS. CP and C
performance levels in which irreparable
damages, downtime for usage and life loss is
considered.
6. When these performance indicator levels
PL1 and PL2 were evaluated using damage indicator based on loss of stiffness and
ductility. There is a possibility of scaling the
damage in a scale of 0 to 1.
The study performed is within small scale of example
studies which can be executed on larger domain
addressing other types of structural irregularities within a
domain of PBSD. A attempt has been made to integrate
PBSE method with damage indicator which is a gray area
of research in structural engineering using NLSP.
Declaration of Competing Interest
The authors declare that they have no known competing financial interests or personal relationships that could
have appeared to influence the work reported in this
paper.
Acknowledgement
The authors of this paper acknowledge the research
contributions of all the citations under reference.
References
[1] ASCE/SEI 41. American Society of Civil Engineers. Seismic
rehabilitation of existing building; 2007[Reston, Virginia].
[2] ATC-40. Seismic evaluation and retrofit of existing concrete
buildings. Redwood City (CA): Applied Technical Council; 1996.
[3] Bhosale A. S., Davis R and Sarkar P. (2017). ASCE-ASME. J.
Risk Uncertainty Eng. Syst. Part A: Civ. Eng., 03 (3): 04017001-
10. https://doi.org/10.1061/AJRUA6.0000900
[4] BIS IS 1893. Indian standard criteria for earthquake resistant
design of structures (part 1): general provisions and buildings (fifth
revision). New Delhi: Bureau of Indian Standards; 2002.
[5] Boroujeni ARK. Evaluation of various methods of FEMA 356
compare to FEMA 440. J Civ Eng Constr Technol 2013;4(2):51–5.
http://dx.doi.org/10.5897/JCECT12.082
[6] FEMA 273. NEHRP guidelines for the seismic rehabilitation of
buildings. Washington (DC): Federal Emergency Management
Agency; 1996.
[7] FEMA 356. Pre-standard and commentary for the seismic
rehabilitation of buildings. Washington (DC): Federal Emergency
Management Agency; 2000.
[8] FEMA 445, 2006. Next-generation performance-based seismic
design guideline program for new and existing buildings. Federal
Emergency Management Agency, Washington (DC).
[9] FEMA 445. Next generation performance based seismic design
guidelines: program plan for new and existing buildings.

Abdul Mabood et al. / IJCE, 8(6), 8-19, 2021
19
Washington (DC): Federal Emergency Management Agency;
2006.
[10] Ghobarah A. Performance-based design in earthquake engineering:
state of development. Eng Struct 2001; 23:878–84.
https://doi.org/10.1016/S0141-0296(01)00036-0
[11] IS 13920, 1993. Ductile detailing of reinforced concrete structures
subjected to seismic force-code of practice. Bureau of Indian
standards, New Delhi.
[12] IS 1786, 2008. Indian standard for high strength deformed steel
bars and wires for concrete reinforcement. Bureau of Indian
standards, New Delhi.
[13] IS 456, 2000. Indian standard plain and reinforced concrete – code
of practice (fourth revision). Bureau of Indian standards, New
Delhi.
[14] IS 875, 1987. Code of practice for design loads (other than
earthquake) for buildings and structures: part 1 dead loads. Bureau
of Indian standards, New Delhi.
[15] IS 875, 1987. Code of practice for design loads (other than
earthquake) for buildings and structures: part 2 imposed loads.
Bureau of Indian standards, New Delhi.
[16] Mondal, A., Ghosh, S., Reddy, G.R., 2013. Performance-based
evaluation of the response reduction factor for ductile RC frames.
Eng. Struct. 56, 1808–1819.
https://doi.org/10.1016/j.engstruct.2013.07.038
[17] Siva N. E., Abraham N. M., and S. D. Anitha., 2019. Analysis of
irregular structures under earthquake loads. Procedia Structural
Integrity, 14, 806-819. https://doi.org/10.1016/j.prostr.2019.07.059
[18] Soni D. P. and Mistry B. B. (2006). Qualitative review on seismic
response of vertically irregular building frames. ISET journal of
earthquake technology, Technical Note. 43 (4): 121-132.
[19] Valmundsson, E. V., & Nau, J. M. (1997). Seismic response of
building frames with vertical structural irregularities. Journal of
Structural Engineering, 123(1), 30–41.
https://doi.org/10.1061/(ASCE)0733-9445(1997)123:1(30)
[20] Wilson, E.L., Habibullah, A., 2000. SAP 2000/NL-push version 17
software, computer and structures, Inc, Berkeley, CA, USA
[21] Zameeruddin, M., Sangle, K.K., 2016. Review on recent
developments in performance- based seismic design of reinforced
concrete structures. Structures 6, 119–133.
https://doi.org/10.1016/j.istruct.2016.03.001
[22] Zameeruddin, M., Sangle, K.K., 2017a. Seismic performance
evaluation of reinforced concrete frames subjected to seismic
loads. J. Inst. Eng. India Ser. A 98, 177–183.
https://doi.org/10.1007/s40030-017-0196-0.
[23] Zameeruddin, M., Sangle, K.K., 2017b. Seismic damage
assessment of reinforced concrete structure using nonlinear static
analyses. KSCE J. Civil Eng. 21 (4), 1319–1330.
https://doi.org/10.1007/s12205-016-0541-2.
[24] Zameeruddin, M., Sangle, K.K., 2017c. Energy-based damage
assessment of RCMRFs using pushover. Asian J. Civil Eng.
(BHRC) 18 (7), 1077–1093.
[25] Zameeruddin, M, Sangle, K K, 2021. Performance-based seismic
assessment of reinforced concrete frames. J. King Saud Univ. Eng.
Sci., 33(3):153-165. https://doi.org/10.1016/j.jksues.2020.04.005
[26] Zameeruddin, M, Sangle, K K, (In press). Damage assessment of
reinforced concrete moment resisting frames using performance-
based seismic evaluation procedures. J.
[27] King Saud Univ. Eng. Sci.
https://doi.org/10.1016/j.jksues.2020.04.010
[28] Powell, G H, Allahabadi, R, 1988. Seismic damage prediction by
deterministic methods: concept and procedure. Earthq. Eng. Struct.
Dyn. 16 (5), 719–734.
[29] Mihai, Mihaită, 2015. A theoretical review of the damage indices
used to model the dynamic behavior of reinforced concrete
structures. Bull. Polytech. Inst. Lasi Constr. Architect. Sect. 63 (2),
109–119.