performance based learning and assessment task thompson - survey...measuring instrument: survey,...
TRANSCRIPT

A.9 Data Analysis
Performance Based Learning and Assessment Task
Survey Activity I. ASSESSSMENT TASK OVERVIEW & PURPOSE:
The student is expected to: devise an assessment instrument, critique another group member’s instrument, respond and then revise an instrument based on critique. The students are to: analyze their data, create an experiment report and present data findings.
II. UNIT AUTHOR: Abby Thompson, Pulaski County Public Schools
III. COURSE: Algebra Functions and Data Analysis (AFDA)
IV. CONTENT STRAND: Data Analysis
V. OBJECTIVES: The student will design and conduct an experiment/survey. Key concepts include 1) sample size; 2) sampling technique; 3) controlling sources of bias and experimental error; 4) data collection; 5) data analysis and reporting
VI. REFERENCE/RESOURCE MATERIALS: Measuring instrument: Survey, Excel spreadsheets, Charts of the results, Assessment List, Group Evaluation, and Grading Rubric.
VII. PRIMARY ASSESSMENT STRATEGIES: The task includes an assessment component that performs two functions: (1) for the student it will be a checklist and provide a self-assessment and (2) for the teacher it will be used as a rubric. The assessment list will be designed to also act as a rubric where the student can use as a checklist and then self-assess A group evaluation, assessment list and grading rubric is provided.
VIII. EVALUATION CRITERIA: For each task/activity, describe the evaluation criteria (i.e., describe and/or attach appropriate scoring rubrics, observation checklists, rating scales, item weights, and the like). Benchmarks of exemplary work.
IX. INSTRUCTIONAL TIME: Fifteen forty-five minute lessons total

A.9 Data Analysis
Survey Activity Strand Data Analysis Mathematical Objectives: This lesson will cover the SOLs listed: . Students will: 1) devise an assessment instrument; 2) analyze his/her data; 3) create an experiment report. Related SOL AFDA.8 The student will design and conduct an experiment/survey. Key concepts include a) sample size; b) sampling technique; c) controlling sources of bias and experimental error; d) data collection; and e) data analysis and reporting. NCTM Standards • Apply and adapt a variety of appropriate strategies to solve problems • Communicate mathematical thinking coherently and clearly to peers, teachers, and others • Identify essential quantitative relationships in a situation and determine the class or classes
of functions that might model the relationships; • Draw reasonable conclusions about a situation being modeled. Additional Objectives for Student Learning In the benchmark provided, the students will also learn about the importance of a healthy diet and solid nutrition to student thinking and learning. However, since the student’s devise their own questions to begin the research, there could be an interdisciplinary focus. It is hard to anticipate the focus aside from the benchmark that is provided. Materials/Resources • Computer Access to Microsoft Excel or Word for graph construction • Pencils and graph paper • Colored pencils
Assumption of Prior Knowledge • The students must be familiar with modes of central tendency, and understand the
difference between the control groups versus experiment groups. • The student should be comfortable recognizing and responding to bias if it exists in a data
set.
A.9 Data Analysis
• The student should be familiar with translating data into graphical representations and then analyzing the results for a presentation to the class.
• Students should be able to draw from the relevant contexts of social issues surrounding childhood obesity and the socioeconomic implications related to the health risks.
Introduction: Setting Up the Mathematical Task • In this activity, you will investigate the relationship between the control and experiments
groups. In the example, the student will determine if the Michelle Obama video impacted the eating habits of students at DMS. The assignment allows the students to come up with a given survey question to pose to the student body. The topics the students select may have an interdisciplinary focus. The student will design and conduct an experiment/survey. Key concepts include: 1) sample size; 2) sampling technique; 3) controlling sources of bias and experimental error; 4) data collection; 5) data analysis and reporting.
• Think of a common problem in your school and a way you might influence your peer’s opinion on that matter. You will create a measuring device (such as a survey) that will measure how you peer’s opinions were influenced.
• For example, many students complain about the school lunch. Is it possible that a school lunch marketing campaign might influence the students’ perception of the lunch? A group could make a commercial highlighting the health benefits, variety, and low cost of the lunch program.

A.9 Data Analysis
Assessment Instrument: Sample Survey
Preparation Considerations in this benchmark:
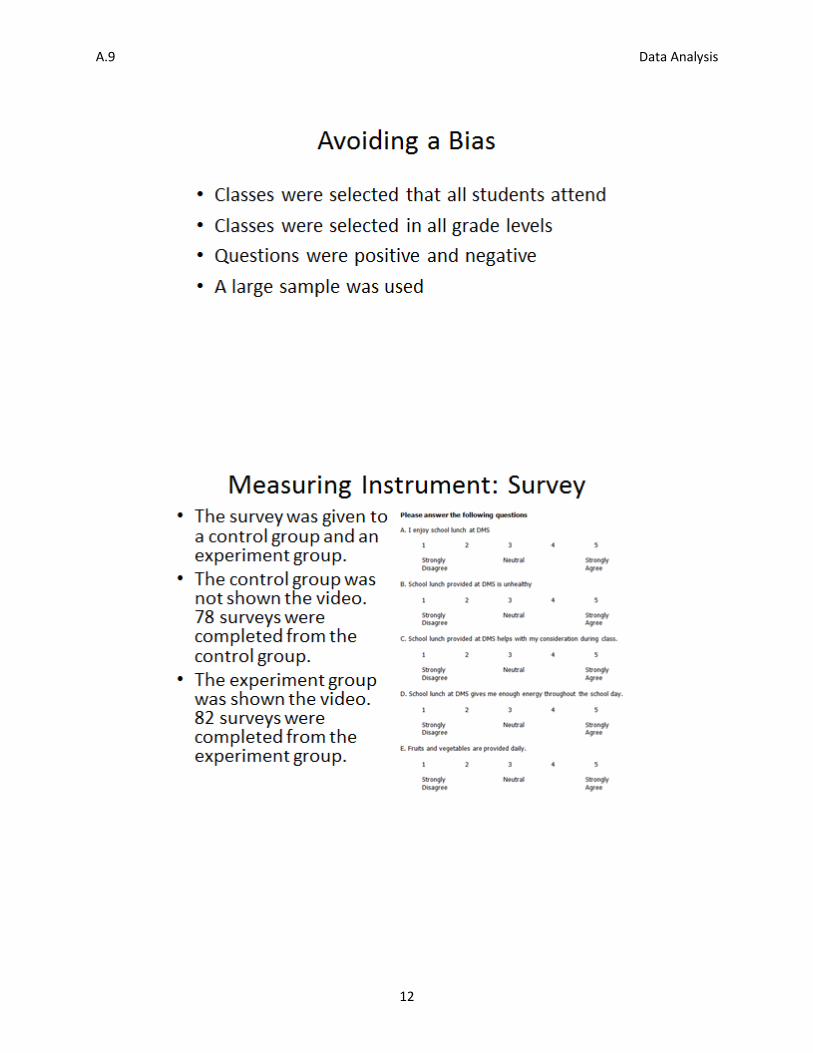
• The survey was given to a control group and an experiment group. • The control group was not shown the video. 78 surveys were completed from the
control group. • The experiment group was shown the video. 82 surveys were completed from the
experiment group.

A.9 Data Analysis
Planning: 1. Population refers to the people you mean to study and draw conclusions about. What is
your population? Is it the entire school, just the 9th graders, all school athletes, or the students enrolled in AP/Dual Enrolled classes?
2. You will not be able to survey the entire school due to time constraints and scheduling
issues. You and your group will determine an appropriate sample to measure. The number of students you measure is called the sample size. The larger your sample size, the more reliable your conclusion will be.
3. There are several different types of sampling techniques (methods to go about
obtaining a sample population). Read through the different types of sampling techniques. Select the technique that best fits your experiment. i) Simple Random Sampling: Individuals are randomly selected from a list of the
population and every single individual has an equal chance of selection ii) Systematic Sampling: Every nth individual is selected from a list of the population.
If the list is ordered in a specific way (a class roster organized by GPA) this can cause potential problems.
iii) Stratified Sampling: The entire population is divided into subgroups (such as grade). An equal number from each subgroup is selected at random.
iv) Cluster Sampling: The entire population is divided into subgroups (such as English class). Randomly select subgroups to create your sample population.
4. Your experiment is meant to influence your classmates. You will measure their opinion
or knowledge with a survey or test. You will need to obtain some baseline data. Read through the different ways to obtain baseline data. Select the technique that best fits your experiment. i) Pre-Post Test: You will use your test/survey before you apply the experiment and
after you apply the experiment. The pre-test will provide you with the baseline data.
ii) Control Group: You will divide your sample population into two groups – One group that will receive the ‘treatment’ and another group that will not. You will give the survey to both groups. The group that did not receive the treatment is the control group that will provide the baseline data.
5. Many times the people conducting the experiment can accidentally influence the results
of the experiment. The ways an experiment can be influenced is biases. For example, choosing only survey your close friends might skew the results by having a sample that is not representative of the population. Consider how you might unintentionally influence the results of the survey.
Measuring Instrument:
1. You will create a test or survey to measure your subjects’ opinion.

A.9 Data Analysis
2. The tests should be measured as ‘correct’ or ‘incorrect’. Grade these tests as your teachers do in class.
3. The survey can provide a statement and a number line to represent how much a subject agrees with this statement (1 to 10, 10 meaning very much agree). Another way to survey is to pose a question and provide multiple choice answers. Finally, you can pose questions and allow subjects to answer the question freely.
4. Remember, you do not want to create a biased survey/test. Do not pose questions in a way that solicit a certain response.
5. Create a chart that represents how the opinions of your classmates were influenced, or how they remained constant.
• Schedule:
• Days 1 – 2: Your group will write up a description of your experiment. Address all aspects of the planning section & explain your choices. Further, you will need to create a rough draft of your measuring instrument.
• Day 3: Peer evaluation – One of your classmates not in your group will read through the experiment description and measuring instrument. Your classmate will provide any thoughts on your experiment and measuring instrument.
• Day 4: Editing/Making Arrangements – You will edit your experiment and measuring instrument. Further, you will make arrangements in order to conduct your survey. If this requires the assistance of a teacher at the school, you must compose a letter to the teacher explaining what you want to do and how long it will take from the class period.
• Days 5 – 10: During this time, class will be a self-paced review. You will be allowed to use these class meetings to conduct your experiment.
• Day 11: Analyze your Data – Examine the measuring instruments to determine the effectiveness of your experiment.
• Days 12 – 14: Experiment Report – Your group will now create a PowerPoint to explain your experiment and share your results.
• Day 15: Presentations – All groups will present their PowerPoint.
• Comments: As a teacher, I approached this project as a hands-on vocabulary lesson. Many English and Social Studies classroom believe in “pre-teaching vocabulary” before getting into the meat of the subject. I have tried this approach in my Geometry classroom with much success because it allows us to have a common vocabulary from the beginning of the school year. Students would use various methods of sampling and measuring devices. In sharing with the class the various approaches, students would see a model of the approach instead of simply copying a definition. This is why I did not focus too heavily on the numeric interpretation of the data. While that is important for students to learn, many students who take this class are doing it as an alternative to trig/calculus, meaning for many of the student’s math is not a strong point. I did not want to bite off too much more than could be feasibly accomplished in a H.S. classroom

A.9 Data Analysis
IStudent Exploration Group Work:
“The student, given a set of data, will interpret variation in real-world contexts and calculate and interpret mean absolute deviation, standard deviation, and z-scores.”
• What is the average time a student travels to get to DMS?
• How fast do 8th graders complete the mile?
• How many students earn all A’s?
• What is the average number of pets of DMS students?
• How many friends does the average Dublin Duke have on facebook?
We often wonder what the average of a set of people (population) is on a certain topic. Further, we wonder how far we are from the average. In this project you will select a question that you and your classmates will be able to answer with a number (this is called quantitative data). You and your group will collect data on your classmates regarding the question you created. Once your data is collected, you will analyze the data to show if the data is normally distributed. Procedure: Your group has two days to survey students through the school. A minimum of 20 students should be surveyed. The student should provide you with their answer in form of a number. Once your information is gathered, use the statistical concepts we have discussed in class to examine the data set. Create a bar graph to display the answers provided. Compare the bar graph to the normal distribution. After a graph has been created examining the normality of the data set, select 2 data points to examine in more detail. Determine the z-score of each data point. What does the z score say about the data point? Useful Information: µ = mean, xi = individual time, n = number of students surveyed, σ = standard deviation, z = z-score
1. An outlier is any data point that falls more than 3 standard deviations from the mean.
2. The mean can be calculated with the following formula:
𝜇 =∑ 𝑥𝑖𝑛𝑖=1
𝑛

A.9 Data Analysis
3. The standard deviation can be calculated using the following formula:
𝜎 = �∑ (𝑥𝑖 − 𝜇)2𝑛𝑖=1
𝑛
4. The z-score can be calculated using the following formula:
𝑧 = 𝑥 − 𝜇𝜎
5. The normal curve is below. The numbers on the horizontal axis represent the number of
standard deviations away from the mean the data point lays. The percent(s) represent the percent of data that is expected to be in the category.
(http://www.mathnstuff.com/math/spoken/here/2class/90/statpb.gif
Monitoring Student Responses • Students will communicate thinking through the written interpretations as well as in
interactions with other students and the teacher. The students will ask specific questions and support one another through constructive feedback on ideas.
• The teacher will guide the students in considerations for determining the possible solutions.
• The teacher will explain the significance of the data as it relates to the research and also emphasize the real world connections and implications of the assignment.
• To summarize the activity, the students will present their Power Point presentations to the class and then the students will reflect on the key findings of each group’s results.
• Collecting information of the student’s knowledge is conducted by observing the students content in the Power point presentations as well as the verbal explanations for their reasoning. Teacher will monitor students’ participation, so that each student has an opportunity to share his/her insight and key findings.
Assessment List and Benchmarks You will be graded based on the attached rubric. You will grade yourself, your classmates will grade your presentation, and the teacher will grade your work. ¼ of your grade will be based on your self-evaluation, ¼ will be based on the average class evaluation, ¼ will be based off of group member evaluation, and ¼ will be based on the teacher evaluation. This Data Analysis sheet is intended to allow the student to self-assess his/her progress and standing among other class members. This also affords the student an opportunity to see how the teacher to assess his/her progress in the data analysis project as well.

A.9 Data Analysis
10
Survey Powerpoint Slides

A.9 Data Analysis
11
A.9 Data Analysis
12

A.9 Data Analysis
13

A.9 Data Analysis
14
A.9 Data Analysis
15
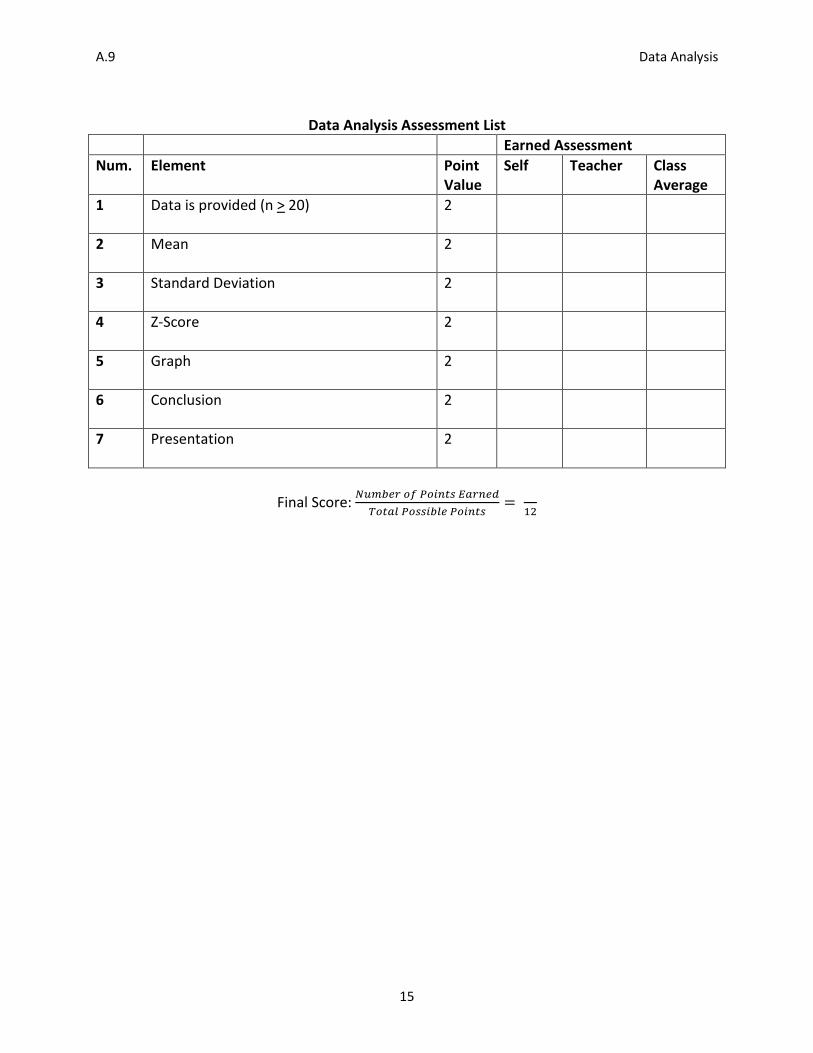
Data Analysis Assessment List
Earned Assessment Num. Element Point
Value Self Teacher Class
Average 1 Data is provided (n > 20) 2
2 Mean 2
3 Standard Deviation 2
4 Z-Score 2
5 Graph 2
6 Conclusion 2
7
Presentation 2
Final Score: 𝑁𝑢𝑚𝑏𝑒𝑟 𝑜𝑓 𝑃𝑜𝑖𝑛𝑡𝑠 𝐸𝑎𝑟𝑛𝑒𝑑
𝑇𝑜𝑡𝑎𝑙 𝑃𝑜𝑠𝑠𝑖𝑏𝑙𝑒 𝑃𝑜𝑖𝑛𝑡𝑠=
12

A.9 Data Analysis
16
Experiment Assessment List Earned Assessment Num. Element Point
Value Self Teacher Class
Average 1 Identification of Population 2
2 Identification of Sample Population 2
3 Sampling Techniques 2
4 Data Collection (Baseline Data) 2
5 Instrument Design 2
6 Defend not having a Bias 2
7 Experiment Report 2
8 Visual Representation 2
9 Presentation 2
Final Score: 𝑁𝑢𝑚𝑏𝑒𝑟 𝑜𝑓 𝑃𝑜𝑖𝑛𝑡𝑠 𝐸𝑎𝑟𝑛𝑒𝑑𝑇𝑜𝑡𝑎𝑙 𝑃𝑜𝑠𝑠𝑖𝑏𝑙𝑒 𝑃𝑜𝑖𝑛𝑡𝑠
= 16

A.9 Data Analysis
17
Assessment List: Final
Num.
Element Earned Assessment Point Value
Self Teacher Task 1
Task 2
Task 1
Task 2
1 Mathematics task is inquiry based 2 2 2 2 Mathematics task is connected to the real world 2 2 2 3 Mathematics task is open ended 2 2 2 4 Mathematics task requires higher order thinking skills 2 2 2 5 Mathematics task includes one or more performance
tasks 2 2 2
6 Mathematics task identifies one or more work habits 2 2 2 7 One mathematics task is based on the AFDA SOL’s 2 2 2 8 The assessment list identifies all essential
mathematics 2 2 2
9 The assessment list identifies all performance components
2 2 2
10 The assessment list includes work habits 2 2 2 11 The assessment list acts as a student check list 2 2 2 12 The assessment list allows for student self-
assessment 2 2 2
13 The assessment list allows for teacher assessment 2 2 2 14 The is a rubric for the assessment list 2 2 15 There are two mathematics tasks 2 2 16 There are two assessment lists 2 2 17 There are two benchmarks. 2 2 18 The project package is well organized 2 2 2 19 The project package is neat 2 2 2 20 The project package is complete 2 2 2 21 All recommended changes were made 2 2 2

A.9 Data Analysis
18
Group Member Evaluation
Name of student evaluated:______________________________________________ Name of evaluator:____________________________________________________
Please rank your classmate’s participation on the project: 0 meaning the group member was not helpful on this part of the project, 2 meaning they were very helpful on this part of the project.
# Element 0 1 2 1 Pre-Planning
- Brainstorming - Selecting Research Question
Student was not helpful
Student was somewhat helpful
Student was extremely helpful
2 Data Collection - Collected an agreed upon
number of responses
Student was not helpful
Student was somewhat helpful
Student was extremely helpful
3 Interpreting Results - Use of formulas to calculate
mean, standard deviation, and z-score of data
Student was not helpful
Student was somewhat helpful
Student was extremely helpful
4 Visual Representation - Creation of the graph to
represent data
Student was not helpful
Student was somewhat helpful
Student was extremely helpful
5 Presentation - Helped with presentation
tools - Presentation in front of class
Student was not helpful
Student was somewhat helpful
Student was extremely helpful
A.9 Data Analysis
19
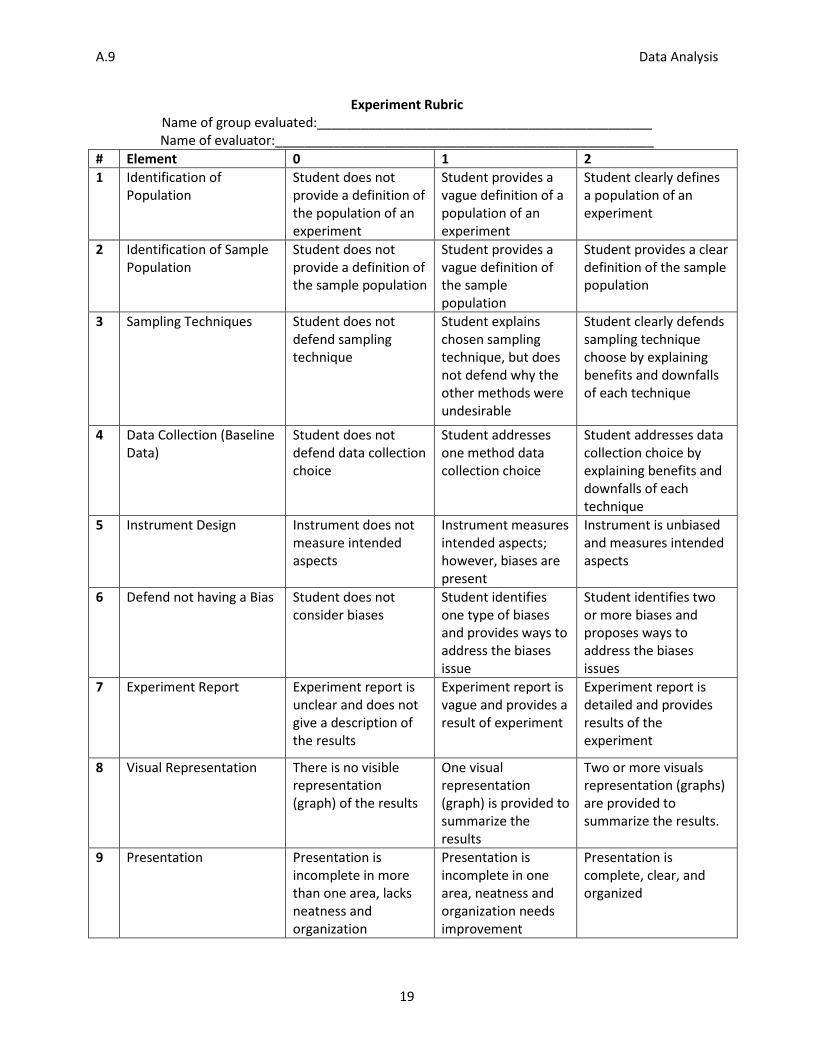
Experiment Rubric Name of group evaluated:______________________________________________ Name of evaluator:____________________________________________________
# Element 0 1 2 1 Identification of
Population Student does not provide a definition of the population of an experiment
Student provides a vague definition of a population of an experiment
Student clearly defines a population of an experiment
2 Identification of Sample Population
Student does not provide a definition of the sample population
Student provides a vague definition of the sample population
Student provides a clear definition of the sample population
3 Sampling Techniques Student does not defend sampling technique
Student explains chosen sampling technique, but does not defend why the other methods were undesirable
Student clearly defends sampling technique choose by explaining benefits and downfalls of each technique
4 Data Collection (Baseline Data)
Student does not defend data collection choice
Student addresses one method data collection choice
Student addresses data collection choice by explaining benefits and downfalls of each technique
5 Instrument Design Instrument does not measure intended aspects
Instrument measures intended aspects; however, biases are present
Instrument is unbiased and measures intended aspects
6 Defend not having a Bias Student does not consider biases
Student identifies one type of biases and provides ways to address the biases issue
Student identifies two or more biases and proposes ways to address the biases issues
7 Experiment Report Experiment report is unclear and does not give a description of the results
Experiment report is vague and provides a result of experiment
Experiment report is detailed and provides results of the experiment
8 Visual Representation There is no visible representation (graph) of the results
One visual representation (graph) is provided to summarize the results
Two or more visuals representation (graphs) are provided to summarize the results.
9 Presentation Presentation is incomplete in more than one area, lacks neatness and organization
Presentation is incomplete in one area, neatness and organization needs improvement
Presentation is complete, clear, and organized
A.9 Data Analysis
20
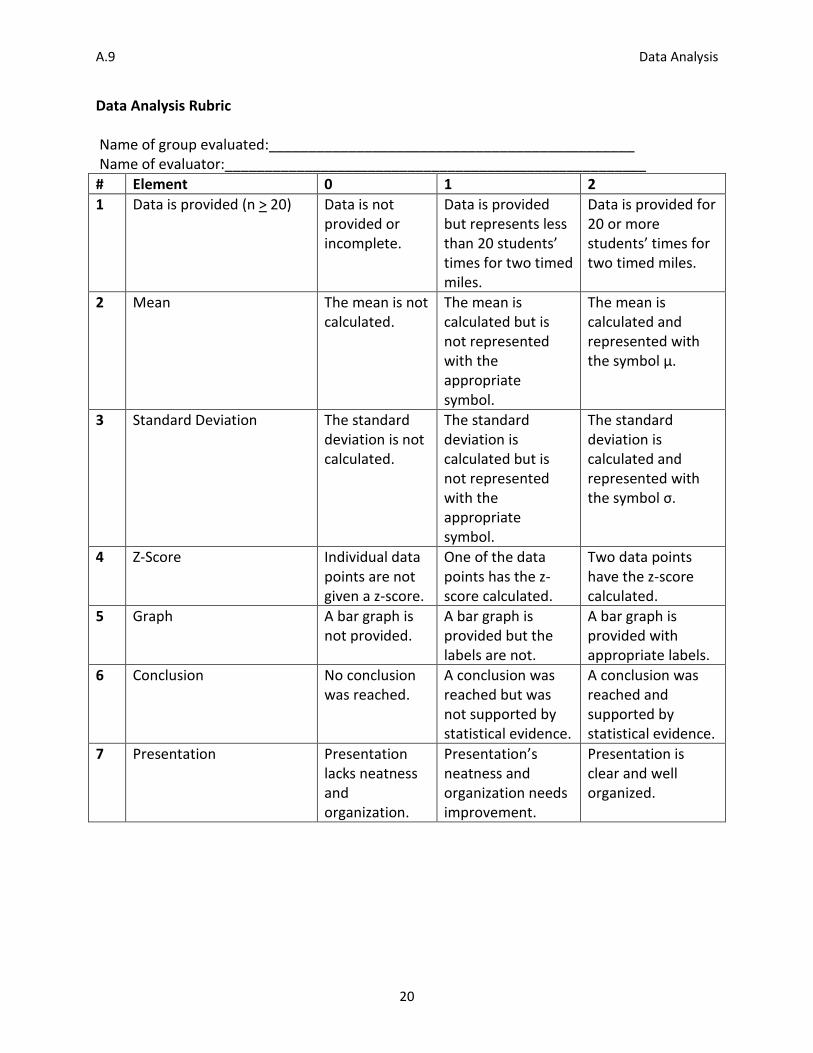
Data Analysis Rubric
Name of group evaluated:______________________________________________ Name of evaluator:_____________________________________________________ # Element 0 1 2 1 Data is provided (n > 20) Data is not
provided or incomplete.
Data is provided but represents less than 20 students’ times for two timed miles.
Data is provided for 20 or more students’ times for two timed miles.
2 Mean The mean is not calculated.
The mean is calculated but is not represented with the appropriate symbol.
The mean is calculated and represented with the symbol µ.
3 Standard Deviation The standard deviation is not calculated.
The standard deviation is calculated but is not represented with the appropriate symbol.
The standard deviation is calculated and represented with the symbol σ.
4 Z-Score Individual data points are not given a z-score.
One of the data points has the z-score calculated.
Two data points have the z-score calculated.
5 Graph A bar graph is not provided.
A bar graph is provided but the labels are not.
A bar graph is provided with appropriate labels.
6 Conclusion No conclusion was reached.
A conclusion was reached but was not supported by statistical evidence.
A conclusion was reached and supported by statistical evidence.
7 Presentation Presentation lacks neatness and organization.
Presentation’s neatness and organization needs improvement.
Presentation is clear and well organized.

A.9 Data Analysis
21
Benchmark Work
• Research Question: How long do Algebra students at DMS spend doing homework each week?
Student Amount of Time/Week
(hrs) Student
Amount of Time/Week
(hrs) #1 2 #11 2 #2 2.5 #12 3 #3 3 #13 2.5 #4 0.5 #14 3.5 #5 5 #15 6 #6 2.5 #16 3.5 #7 4.5 #17 4 #8 4 #18 2 #9 1.5 #19 2.5
#10 3 #20 2.5 • *Students were asked to approximate the time spent on homework to the nearest half
hour* • μ = 3 σ = 1.235
Standard Deviations from the Mean
Range in Hours # of Data Points in Range
Percent of Data
Percent Expected
x <-3 t < -0.705 0 0% 0.2% -3 < x < -2 -0.705 < t < 0.530 1 5% 2.2% -2 < x < -1 0.530 < t < 1.765 1 5% 13.6% -1 < x < 0 1.765 < t < 3.000 8 40% 34% 0 < x < 1 3.000 < t < 4.235 5 25% 34% 1 < x < 2 4.235 < t < 5.470 2 10% 13.6% 2 < x < 3 5.470 < t < 6.705 1 5% 2.2% x > 3 t > 6.705 0 0% 0.2%

A.9 Data Analysis
22
• Conclusion: The data is approximately normal. The shape is similar to the normal distribution.

A.9 Data Analysis
23
Single Data Point Observation:
• Amiah (0.5 hr): z = -2.024; This tells us that Amiah’s study time is not necessarily an outlier, but in the bottom 2.5% of expected answers. In comparison to her classmates, Amiah does not study as much.
• Izeah (4 hr): z = 0.810; This tells us that Izeah’s study time is close to the average study time for Algebra students. 34% of the students study approximately the same as Izeah.