performance attributions: a cross cultural study … · performance attributions: a cross cultural...
TRANSCRIPT

Interdisciplinary Journal of Information, Knowledge, and Management Volume 3, 2008
Editor: Kathy Lynch
Performance Attributions: A Cross Cultural Study Comparing Singapore, Japan and US Companies
Hendrik Halim Curtin University of
Technology, Perth, Australia
Irene Keng Howe Chew Chinese University of Hong
Kong, Hong Kong SAR
[email protected] Abstract
Attributions shape people’s realities, the explanations imposing cause-effect structures on our chaotic world. Not confined to the individual, publicized attributions further influence others’ attribution formulation and subsequent decisions. Attributions in corporate discretionary narrative disclosures, persuasive tools to steer investor buy-sell decisions are significant economically. Fo-cusing on such performance attributions, investigating cross-cultural attribution patterns and Sin-gapore’s cultural inclination, we study performance-attribution statements from company ac-counting narratives of three nations (United States of America, Japan and Singapore). Self-enhancing/protecting tendencies, though found to exist in all the countries studied, seem more predominant in Asian than Western society, contrary to previous research. Singapore is also found to be more culturally similar to Japan.
Keywords: Performance Attribution, Singapore, USA, Japan, Cross Cultural
Introduction Attribution theory is one about perceptions, of how people construct and understand their world. Attribution formulation is an activity carried out countless times each day, either purposefully or subconsciously, by everybody. Attributions regarding phenomenon of all sorts not only pacify one’s curiosity and emotions, supplement one’s knowledge archive to guide future behavior, but are further deployed to steer others’ attribution formulation and subsequent actions. Its omnipres-ence in rational thought and social interaction warrants its received attention.
While Heider (1958) initiated attribution research with his basic conceptions, latter scholars sup-plement it by: deriving relationships between certain information types and resulting attributions; such structured relationships’ applicability in diverse situations; systematic differences in attribu-tion behavior between individuals of certain characteristics (e.g. country of residence); differing attention for each information type; and possible underlying purposes of formulating attributions. For example, Jones and Davis’s (1965) Theory of Correspondence Inference, Kelley’s (1967)
ANOVA model, Kruglanski’s (1980) Lay Epistemology and the Expectancy-Covariance model identified properties of a phenomenon (e.g. observed behav-ior) that are considered in attribution formulations. But Kelley, recognizing his model’s reduced applicability under time constraints and multiple feasible attributions’ coexistence, subsequently derived the Causal Schemata and Dis-counting & Augmentation Tendency
Material published as part of this publication, either on-line or in print, is copyrighted by the Informing Science Institute. Permission to make digital or paper copy of part or all of these works for personal or classroom use is granted without fee provided that the copies are not made or distributed for profit or commercial advantage AND that copies 1) bear this notice in full and 2) give the full citation on the first page. It is per-missible to abstract these works so long as credit is given. To copy in all other cases or to republish or to post on a server or to redistribute to lists requires specific permission and payment of a fee. Contact [email protected] to request redistribution permission.
Performance Attributions
56
theory respectively. Daryl Bem’s (1967) Theory for Self-perception advocated an additional use for attributions: to discover individuals’ own internal state through self-observations. Further-more, Actor-Observer Differences, Fundamental Attribution Error, Self-serving tendency and Self-presentation Theory (with both self-enhancing/protecting and counter-defensive attribution approaches) noted systematic attribution differences under various circumstances. These are bet-ter understood considering attributions’ informational and identity-protection/enhancement func-tions. Other differences commonly studied involve those between individuals of different nation-alities, who possess different sets of cultural values.
Information and the Stock Exchange The stock exchange is a medium for allocating limited capital resources of society to prospective ventures, achieving greater wealth generation for all. But severe economic losses, unemployment, and social instability brought about by recent collapse of multinational corporations cast doubt upon its effectiveness. The problem lies in unavoidable information asymmetry between company management and investors, and the resulting agency problem.
To reduce this information disparity, governments and regulatory bodies worldwide set policies and procedures to boost resource allocation effectiveness and lower company costs-of-capital. Examples include requirements for public disclosure of company performance, supporting docu-ments, and auditor reports. Such discretionary narrative disclosures like Letters to Stakeholders, Operational Review, and Management Discussions not only present accounts of past company activities, but also attributions for performance. These fulfill the dual purposes of aiding the pub-lic’s investment decisions and providing a public relations tool for nurturing a certain corporate image (Hopwood, 1996). Annual reports are reputed to be “undisguised advertisement” or “plat-forms for preaching [management's] philosophies and [for] touting themselves and their compa-nies” (Ingram & Frazier. 1983, pp. 49). Accounting narratives enclosed are viewed as “carefully crafted public relations documents with little, if any, substantive content” (McConnell, Haslem, & Gibson, 1986). Despite such unflattering comments, discretionary narrative disclosures are vital to skilled users like financial analysts (Schipper 1991). Rogers and Grant (1997), Abrahamson and Amir (1996), and Bryan (1997) also verified narratives’ informational content and their con-tribution to company assessment.
Disclosures and attributions’ public relation purpose led to the logical deduction that subcon-scious and/or intentional biases may manifest themselves in narratives, with management attribut-ing events to their own favor as a form of impression management. Self-enhancing/protecting tendency is often noticed in the context of explaining corporate performance. Investors, lacking sufficient expertise and motivation to fully comprehend complex financial statements, will over-rely on accounting narratives for evaluations. Thus inaccurate designed performance attributions distort investors’ perceptions and result in inefficient capital allocation.
Considering the number of individuals involved, such performance attributions, publicly dis-closed in accounting narratives are more influential than others. Prime ingredients in stock ex-changes’ capital allocation function, company disclosures, and enclosed performance attributions influence investors’ buy-sell choices. Attribution’s role in society economic health is undeniable. Our research thus focuses on such “influential” performance attributions of company manage-ment. With evidence of cross-cultural attribution behavior differences as foundation, comparisons of performance attribution behavior between companies of three countries (United States of America, Japan and Singapore) are conducted, on basis of the performance’s favorableness and corresponding attributions’ internal/external inclinations. Verifying self-enhancing/protecting tendencies in, and comparing relative utilization of self-enhancing/protecting and counter-defensive attribution approaches between subject countries, is facilitated using calculated mean “attribution scores” for two performance situations (favorable/unfavorable). Besides contributing
Halim & Chew
57
to the global knowledge archive, sensitizing investors to attribution biases through this study helps restore disclosures’ objectivity by facilitating individual evaluation adjustments. Another objective involves inferring from research results, Singapore’s current position on the cultural spectrum - whether she is culturally similar to United States of America (U.S.A) or Japan.
Literature Review To facilitate appreciation of attribution theories and acknowledge inherent complexities in accu-rate attribution prediction, an exhaustive literature review of prominent attribution studies was conducted. Diverse Attribution Theories generally focus on what information about the stimuli isconsidered in the attribution process and how it impacts resulting attributions. This knowledge serves an important pre-requisite to conceptualizing how attributions and bias are formed. Attri-bution Biases acknowledges observed attribution differences and provides rationale for our scope of research. Attribution’s Underlying Functions facilitates research data’s interpretation. Cross-cultural Perceptual and Attribution Deviation provide justification for our comparison study be-tween three nations, and finally build up to Hypothesis Formulation.
Attribution Theory is preoccupied with developing comprehensive accounts of how people per-ceive and explain everyday actions of self and other (Jones et al., 1971; Kelley, 1967; Ross, 1977). Its importance resides in the potential influence that one’s prior judgment of a situation can exert upon its future development. Simply put, perceived causes determine subsequent cor-rective actions. Much research focused on deriving factors influencing attributions (e.g. different information types surrounding stimuli, perceiver’s mental framework, functions served by attribu-tions in each situation, etc.) and their relationships with attributions formulated. Currently, no unified theory exists to integrate these diverse studies, with each applicable under different cir-cumstances.
Cultural Differences in Attribution Individuals residing in different countries are known to possess different values and life outlooks, and this is manifested in their everyday behaviors including attributions. This section presents dimensions from which we can review such cross-cultural deviations and provides rationale for our cross-cultural study of corporate attribution behaviors.
According to Krull (1999) the attribution process can be separated into two distinct cognitive op-erations: the sub-processes of dispositional inference and situational correction or, situational in-ference and dispositional correction.
Based upon the dispositionism tendency of Westerners and situationism tendency of Asians, there are three plausible models to explain cultural differences:
Firstly, Asians may follow a sequence of initial resource-efficient situational inference followed by effortful dispositional correction while Westerners do the opposite, dispositional inference and then situational correction. The sequence in considering the two dimensions, dispositions and context, set different initial opinions for subsequent correction and thus result in attributional dif-ferences.
Secondly, effort allocated to each sub-process and sensitivity to dispositional and contextual in-formation and cues may differ across cultures. Asians may tend to make more situational correc-tions than Westerners, assuming insignificant differences in dispositional inferences, thus causing their attributions to deviate at the correction stage. Choi and Markus (1998), Miller (1984), and Morris and Peng (1994) support this explanation. Asians’ tendency of making more situational corrections may be partially due to better utilization of consensus information (Cha and Nam, 1985).
Performance Attributions
58
Lastly, Asians may be comparatively weaker at the initial disposition inference stage, assuming little differences in situational corrections. Miller (1984) discovered cross-cultural differences in both dispositional and situational attributions.
While the literature discussing the abovementioned differences has been vast, the above three explanations are not directly tested and there are no definite answers to the origin of cross-cultural attribution differences.
The above set of explanations seems to imply that cross-cultural variances in attribution process and sensitivity to different information types are the keys to explaining attribution differences, assuming that the informational function is in play. But the motivational function may co-exist, and with different constructs of self and social identity, play a role in attribution differences. For the collectivist society of Asians, positive feelings about the self are not only derived from task accomplishment but also from been able to: belong to the group, fit in, occupy one’s proper place, engage in appropriate action, promote others’/group’s goals, and maintain harmony (Markus & Kitayama, 1991, 1994). This is called “collective self-esteem” (Crocker & Luhtanen 1990; Kagit-cibasi, 1997). Seemingly self-deprecating attributions are actually formed in consideration of oth-ers. Specific efforts to not deny others’ contribution to success and help others “save face” by not blaming them in failure help maintain harmony in relationships (Meijer & Semin 1998). Accord-ing to Heine, Takata, and Lehman (2000), Japanese’s focus on one’s weaknesses can be due to the drive for continuous self-improvement. Hence, self-serving attributions may be perceived more negatively in Asian society than in Western culture (Markus & Kitayama 1991). Usage of the counter-defensive method of attribution may thus be more commonplace.
Hypothesis Formulation The three countries targeted for study are United States of America, Japan, and Singapore. This choice is not without its reasons. Firstly and most importantly, The United States and Japan represents cultures clearly different on the individualism-collectivism spectrum. For most re-searchers of cross-cultural studies, culture has the broad definition of being the human-made component of environment (Herskovits, 1955), constituting both objective elements like cultural manifestation within artworks, architecture, and city designs, and subjective elements. The latter, termed the “group’s characteristic way of perceiving its social environment” (Triandis, Malpass, & Davidson, 1972, p. 3), encompass shared values, beliefs, and behavioral norms (Thomas 1994) that is historically cultivated and transmitted through time. From this definition, culture, though accumulated through past behaviors, will determine future behavioral trends. Human beings, who created culture, are in turn constrained by the culture they have created (Segall, Dasen, Berry, & Poortinga 1999). Abundant past research identifies Americans as predominantly individualistic and the Japanese as collectivism-inclined.
Secondly, both nations are important economic entities of our global economy, considering their representation of companies, size of stock exchanges, and influence upon other nations. Gather-ing updated information about such influential countries is beneficial for planning and monitoring the global economy’s progress.
Thirdly, the inclusion of Singapore is done in hope of providing information relevant in our local context rather than catering to major economic and cultural entities. Although some past research conducted found Singapore as a collectivist society (Hofstede, 1994; Hofstede & Bond, 1988), other work differs (Chew, 2000). Belief that national culture will manifest itself in management practices, and without past confirmative evidence, our study hopes to provide updated insights into Singaporeans’ cultural inclinations and local companies’ attribution tendencies. Singapore also represents a good blend of Asian and Western business culture, and study into its organiza-tional culture will lend insights into the norms of other similar countries.
Halim & Chew
59
Since past research revealed that self-enhancing/protecting bias is common across cultures, our first hypothesis is to verify if this still holds true for our target nations: The United States, Japan, and Singapore.
H1: Self- enhancing/protecting bias is present in all countries being studied.
H1a: For Singapore companies, there will be a greater number of internal attributions for favor-able outcome than unfavorable outcome.
H1b: For American companies, there will be a greater number of internal attributions for favor-able outcome than unfavorable outcome.
H1c: For Japanese companies, there will be a greater number of internal attributions for favorable outcome than unfavorable outcome.
Upon verification of self-enhancing/protection bias in the three cultures, we proceed to compare the degree of bias between them. From past evidence, Asians tends to be more modest than West-erners. Hence, we would expect that:
H2: Self-enhancing/protecting bias is more pronounced for American than Japanese companies.
H2a: Americans will display more self-enhancing behavior than Japanese in explaining for favor-able performances.
H2b: Americans will display more self-protecting behavior than Japanese in explaining for unfa-vorable performances.
With comparatively little studies investigating Singaporeans’ attribution behavior, we would like to see where they stand relative to the Americans and Japanese. Considering Singapore’s recent birth (and possibly weaker cultural foundations), and both Western and Asian influence (through human migration, foreign talent retention and business relationships), we can reasonably expect bias magnitudes to lie between the American and Japanese.
H3: Self-enhancing/protecting bias is more pronounced for American than Singapore companies.
H3a: Americans will display more self-enhancing behavior than Singaporeans in explaining for favorable performances.
H3b: Americans will display more self-protecting behavior than Singaporeans in explaining for unfavorable performances.
H4: Self-enhancing/protecting bias is more pronounced for Singapore than Japanese companies.
H4a: Singaporeans will display more self-enhancing behavior than Japanese in explaining for favorable performances.
H4b: Singaporeans will display more self-protecting behavior than Japanese in explaining for unfavorable performances
Methodology
Company Selection Our study of attribution behavior requires selection of 200 companies’ annual reports each from The United States, Japan and Singapore. Comprehensive listings of public companies are ob-tained from the target counties’ major stock exchange: New York Stock Exchange, Tokyo Stock Exchange and Stock Exchange of Singapore.
Performance Attributions
60
To reasonably ensure that companies are fair representatives of local culture, and further taking into account foreign company listings, companies included in sample populations should either be incorporated in, or have major operations or markets located within the targeted country. This is due to the deemed likelihood that corporate cultures of such companies should be closely similar to local culture due to constant interactions between company and her various stakeholders. Also, management staffs are likely to reside and operate within their company’s primary market.
Selection will also be made from listed local companies less those involved in primary industries. This exclusion is due to perceived higher correlation between external environment and perform-ance with such industries. Management may more likely perceive their business to be at nature’s mercy, uncontrollable because of complex and uncontrollable relationships, and thus exert sys-tematic bias upon such companies’ attributions. They should be studied separately and the exclu-sion facilitates better focus on the type of attribution bias studies.
With sample populations determined, systematic sampling method is applied in company selec-tion. From each selected company, Letters to Shareholders, Operations Review, Management Discussions, and other documents of qualitative performance explanation and elaboration are ex-tracted from the annual report package and analyzed.
Selection of Performance-attribution Statements To see how companies explain favorable and unfavorable performance, we attempt to draw from each company’s documents: (1) a statement highlighting an instance of favorable performance, paired with attributions of its causes, and (2) a statement of an instance of unfavorable perform-ance with attributions of its causes. There are thus two sets of samples from each country, with the unit of analysis being the favorable/unfavorable performance statement paired with its expla-nations. Selection of only one sample unit of each performance type from each company is done to prevent unnecessary distortions. Large companies, with numerous subsidiaries operating in different industries and environments, will logically have more to report and explain than com-paratively smaller companies. Gathering all qualified performance-attribution statements from each annual report inevitably results in undesired higher representation of large companies’ cul-ture within the sample and distorts research findings. This method’s downside is the necessity to choose from various acceptable performance-attribution statements the unit to be included in our data sets.
Discretion in this choice introduces undesired subjectivity and can potentially distort research findings. Implementing the objective selection method of numbering each qualified performance-attribution statements and drawing lots to determine the selected unit will resolve this problem.
Other principles and rules also guide the selection process. Firstly, the performance quoted should be related to past or present organizational outcomes.
Secondly, whether the outcome is deemed favorable or not should be from the company’s per-spective, so as to ensure accurate categorizations. This can be derived from descriptive words used in presenting the outcome. Phrases like “improvement from previous years”, “noteworthy achievement of”, “impressive”, “commendable” and others provide insights into how manage-ment perceives certain outcomes. This step is required because results of performance evaluation forms the topic of attributions, and company evaluation of performance is dependent not solely on accounting numbers but also on comparisons with previously set objectives, industry averages, and past performance. With differential importance allocated to each factor, management’s lan-guage usage should be more accurate in deriving their perceptions.
Thirdly, identification of the specific attributions for a chosen performance statement can be fa-cilitated by connective words or phrases, which indicate the logical link between performance and
Halim & Chew
61
explanation statements. Phrases like “because of”, “thus”, “hence”, resulting in/from, “due to”, “caused/influenced by”, “can be ascribed/attributed to”, “arising from” and “contributed/led to” are examples of such connective phrases. However, an attribution statement can still be associ-ated with the performance statement without presence of such connective phrases, as long as a cause-effect relationship between performance and attribution statements can be derived from the text. For example, the performance statement can be about improvements in a certain business ratio or variable, while the attribution statement later discusses factors contributing to this vari-able’s improvement. The focus on the same business variable thus serves as the link between the two statements rather than the connective phrases.
Several guidelines to sample unit selection also include proximity between the performance and attribution statements. For example, the attribution statement should be within a few statements from the performance statement. From the communication perspective, this is logical because management, in their communications, will follow a systematic fashion of presenting and fully explaining an event before they proceed to the next topic. The further apart the two statements are, lower the probability that they are related to the same specific incident. Drawing from the above argument, both performance and attribution statements should appear within the same paragraph. However, it should be noted that such supplementary points only serve to assist in identification of the qualified sample units and can be ignored if other evidence clearly indicate the performance-attribution connection. It shall also be cautioned that it is not always possible to find sample units for both favorable and unfavorable performances within each company’s ac-counting narrative.
Coding of Sample Units To enable running of several statistical tests on collected data, each unit of analysis (performance-attribution statements) is coded along the following dimensions:
Firstly, the sample unit is coded by the nationality of the company from which it is derived. For example, sample units drawn from an American company’s annual report are coded 1, while those from Japanese and Singaporean companies are coded 2 and 3 respectively.
Secondly, irrespective of country, each unit is coded by their performance direction. Those of favorable performances are coded 1 while those of unfavorable performance are coded 2.
Lastly, coding of how management attributes performance requires elaboration. The various con-tributing factors to a performance can be distinguished as either internal or external. Internal at-tributions are those arising from within the firm, properties possessed and relatively controllable by the company herself. For example, “management team’s creativity level”, “employee expertise and motivation”, “company product/promotion mix”, “organization structure”, “process coordina-tion” and “company goals and strategies” are internal factors. On the contrary, external attribu-tions are uncontrollable factors arising from general or industry environment and imposed upon the company. The PEST framework is a good way of looking at such environmental forces. Ex-amples include “political instability”, “war”, “terrorism”, “economic recession”, “sudden con-sumer perception change”, “relocation of business partners”, “SARS” and “Bird Flu epidemic”. A problem that naturally surfaced from above definitions is the determination of company bounda-ries. Complex business arrangements can make this boundary fuzzy and for our purpose, the company includes its subsidiaries and associates over which it can exert significant influence in terms of decision making.
In explaining company performance, management may present more than one feasible cause in their attributions and produces a possible mix of internal and external attributions, which makes categorization of attributions as a whole to either internal or external categories difficult. A way to overcome this difficulty is to assign a score of 1 to each internal attribution and -1 to each ex-

Performance Attributions
62
ternal attribution quoted. The overall score for the sample unit is then calculated and used to indi-cate how internally or externally the companies attribute their performances. A large positive number signifies that more internal than external attributions are quoted, negative numbers indi-cate that the opposite is true and a score close to zero indicates that the number of internal attribu-tions is comparable to external attributions. This attribution scoring system is used to denote both the direction and magnitude of attribution bias.
Statistical Tests Applied Subsequent to data collection, some tests are conducted. Within each country, independent-sample T-test is used to compare the mean attribution scores between favorable and unfavorable performance-attribution samples. This is done to verify self-enhancing/protecting bias’s existence in the three cultures being investigated.
Also, One-way ANOVA followed by multiple-comparison tests are used to compare mean attri-bution scores of favorable and unfavorable performance-attribution samples between the coun-tries. This can determine their differences in degree of bias for both performance situations.
Template for Interpretation of Test Results Before proceeding to interpret and discuss our research findings, it is important to lay out feasible explanations for possible data characteristics. This activity compels us to review our understand-ings of attribution theory and ponder about how they are applied to understanding research find-ings.
Positive mean attribution scores for favorable performance-attribution samples Positive scores are generally expected of attributions for favorable performances. According to self-presentation bias, management is driven by the motivational function of attributions, trying to inflate either or both of their self- and social identities through communication to stakeholders. Greater utilization of the self-enhancing attribution approach results in greater attributions of firm success to internal than to external factors.
On the other hand, inclination towards internal attributions may also originate from the informa-tional function of attributions. Management’s constant interaction with other company members in process of their work may unavoidably expose them to more internal than external factors, making them more salient in their minds. Also, management may be subconsciously more sensi-tive to dispositional information due to dispositionism tendencies and thus more able to derive internal causes for performances. Furthermore, the evaluation sequence of conducting disposi-tional inference before situational correction also explains for the positive tendency. Finally, re-cent years are plagued by distressing events, like the September 11th incident, Iraq war, economic downturns, Bali bombings, and SARS and Bird Flu epidemics. Such inhibitory factors’ presence may make the facilitative internal factor more feasible an explanation for company success.
Positive mean attribution scores for unfavorable performance-attribution samples Positive scores obtained for unfavorable performance-attribution samples can still be explained from both motivational and informational dimensions. From the motivational perspective, greater usage of internal attributions to justify performance may not necessarily deflate management’s self- and social identities. How management evaluates their performance in private is unobserv-able and unimportant here. The mean positive score just indicates the utilization of the other attri-bution method illustrated in self-presentation bias: the counter-defensive approach. This method

Halim & Chew
63
of shouldering the blame for failures and denying credit for success can elevate their social identi-ties by portraying them as humble, modest, and responsible individuals.
From the informational function perspective, management’s greater sensitivity to dispositional information due to the dispositionism tendency, or the habit of conducting dispositional inference before situational correction can justify this score.
Negative mean attribution scores for favorable performance-attribution samples The motivation function explanation for mean negative score is similar to the one used in explain-ing positive scores for unfavorable performance-attribution samples. Again, usage of counter-defensive method in denying credit for success and attributing it to others boost management’s social identities by portraying them as modest.
From the informational function perspective, mean negative score may be associated with greater salience of external factors, management’s greater sensitivity to contextual information due to situationism tendency, or the evaluation sequence of situational inference before dispositional correction.
Negative mean attribution scores for unfavorable performance-attribution samples Attributing unfavorable performances to external factors is another tendency predicted by self-presentation bias. Self-enhancing/protecting approach makes the management seemingly less ac-countable for the company’s failure and protects their image of competence. The informational explanation of negative scores for unfavorable performance attributions is the same as that men-tioned above for favorable performance with negative attribution score.
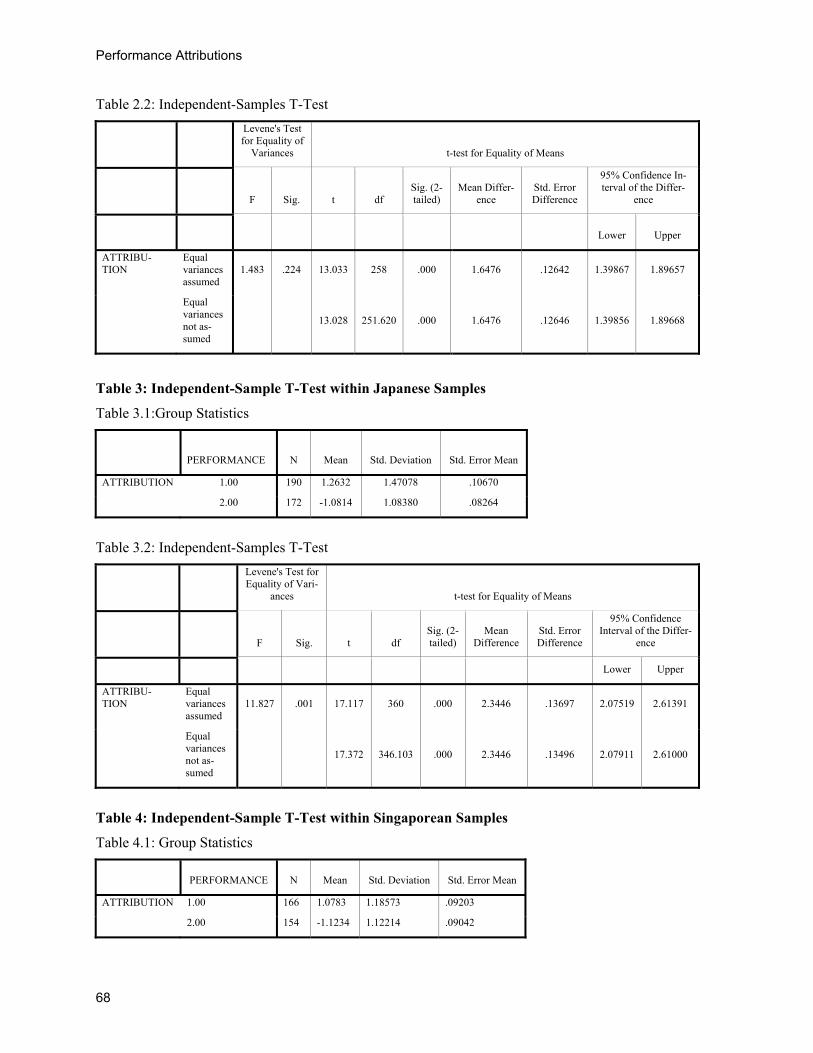
Results Greater positive magnitudes in mean attribution scores for favorable performance signify more self-enhancing tendencies, while greater negative magnitudes for unfavorable performance sig-nify more self-protecting tendencies. With the above framework in place, we now look at the ob-tained data along the within-country and between-country dimensions. As a prerequisite to as-sessing latter hypothesis, Hypothesis 1 must be supported and self-enhancing/protecting bias should be present in all three countries. Independent-sample t-tests using samples of favorable and unfavorable performance-attribution statements within each country showed that the mean scores for both situations are statistically different and in opposite polarities, positive and nega-tive for favorable and unfavorable performance respectively (Refer to Tables 2.1, 3.1 and 4.1 in the Appendix). t-values for the three countries’ samples are: U.S.A = 13.033, Japan = 17.372, Singapore = 17.065, with all p-values < 0.001. (Refer to Tables 2.2, 3.2 and 4.2 in the Appendix.) This conforms to the self-enhancing/protecting method of self-presentation bias, which generally predominates over the counter-defensive method. Thus all three sub-hypothesis (H1a, H1b and H1c) of Hypothesis 1 are supported. Before continuing, it must be clarified that both attribution methods co-exist and the question lies with different usage degree of each approach within differ-ent contexts.
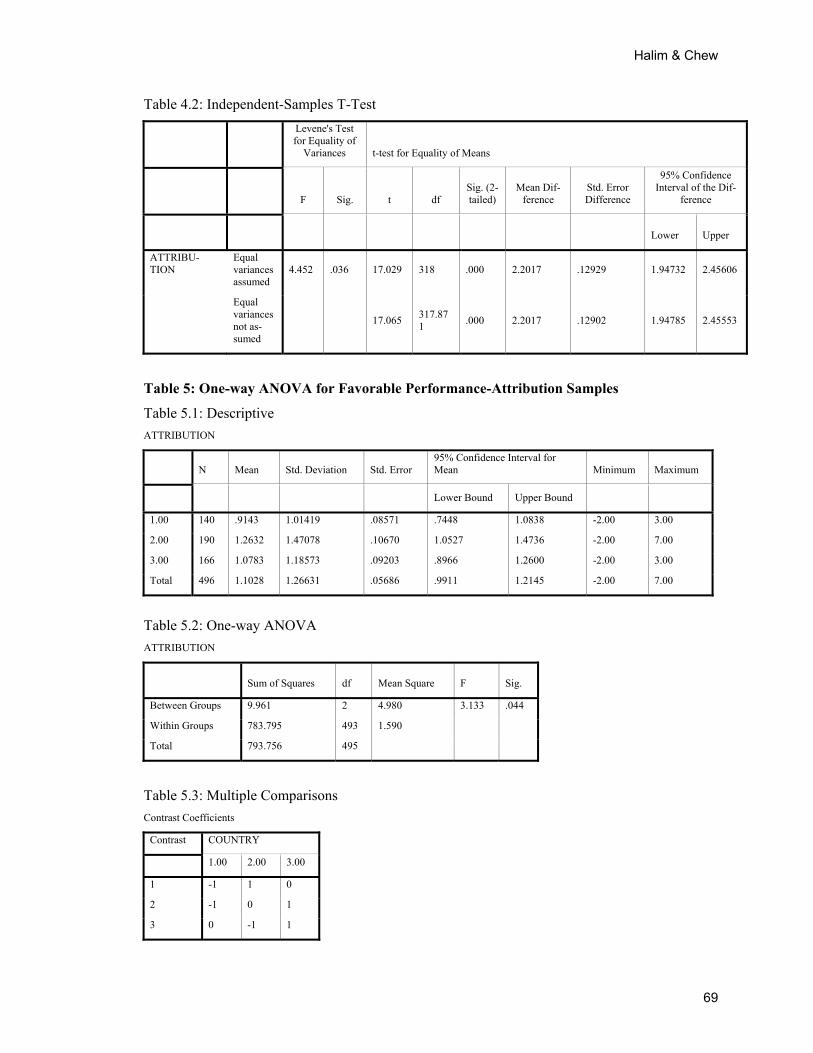
Next, comparison of mean attribution scores between cultures involves a two-step process. Firstly, one-way ANOVA is utilized to determine whether mean scores (for each performance situation) between cultures differs. If verified that not all mean scores are equal, multiple-comparison tests are run to analyze the exact relationships between them.
Performance Attributions
64
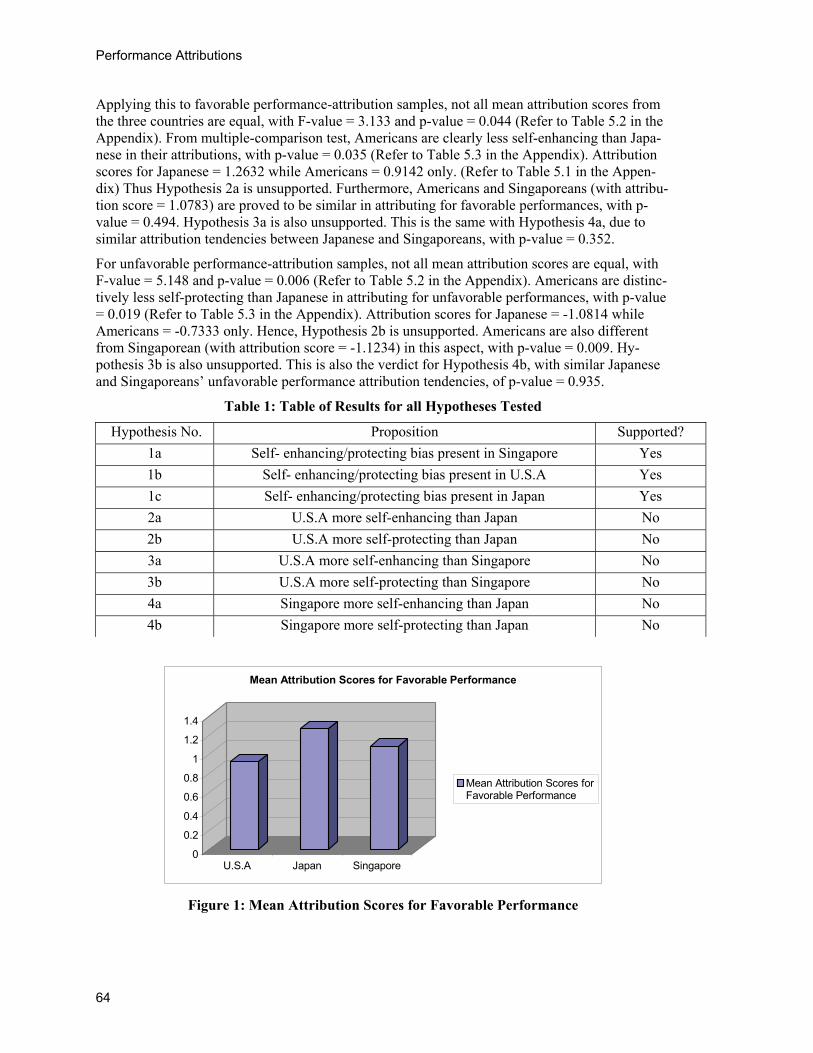
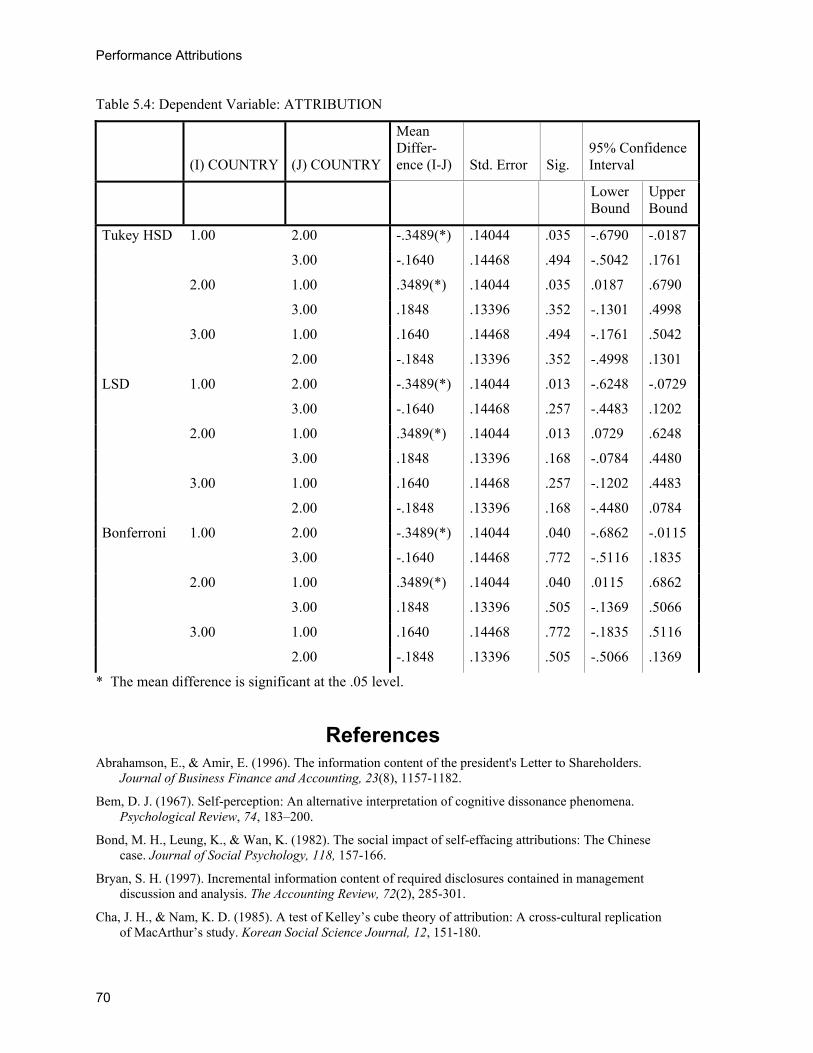
Applying this to favorable performance-attribution samples, not all mean attribution scores from the three countries are equal, with F-value = 3.133 and p-value = 0.044 (Refer to Table 5.2 in the Appendix). From multiple-comparison test, Americans are clearly less self-enhancing than Japa-nese in their attributions, with p-value = 0.035 (Refer to Table 5.3 in the Appendix). Attribution scores for Japanese = 1.2632 while Americans = 0.9142 only. (Refer to Table 5.1 in the Appen-dix) Thus Hypothesis 2a is unsupported. Furthermore, Americans and Singaporeans (with attribu-tion score = 1.0783) are proved to be similar in attributing for favorable performances, with p-value = 0.494. Hypothesis 3a is also unsupported. This is the same with Hypothesis 4a, due to similar attribution tendencies between Japanese and Singaporeans, with p-value = 0.352.
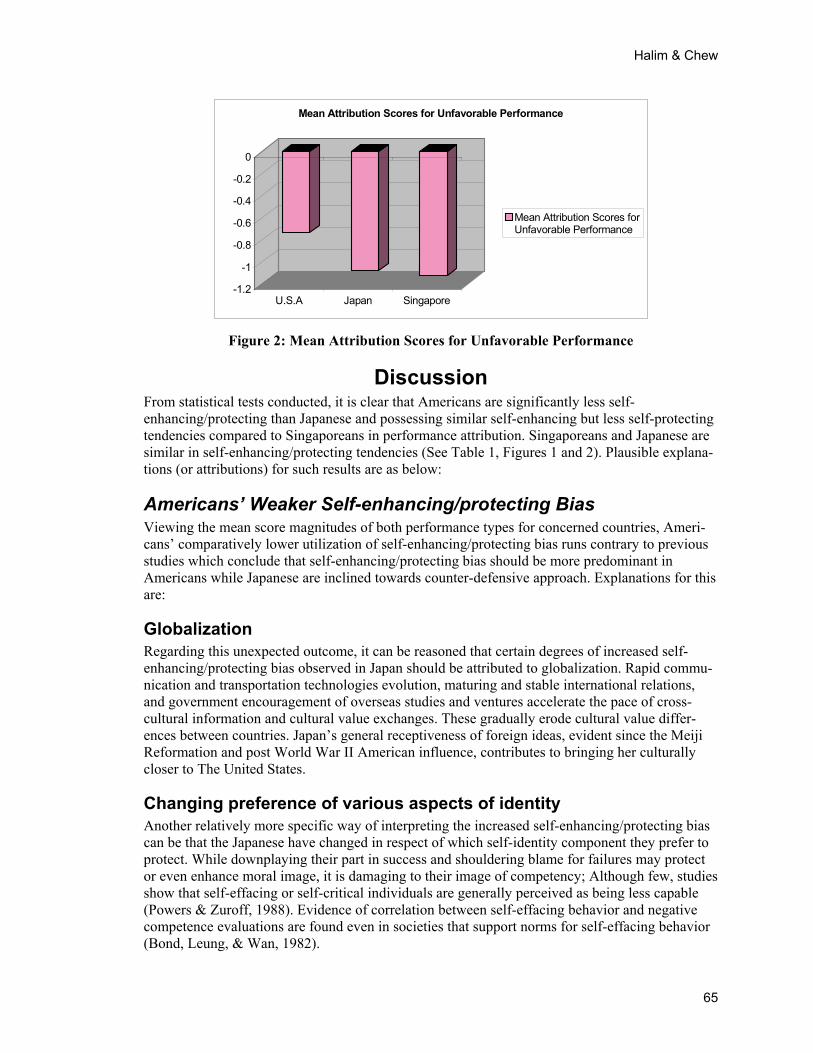
For unfavorable performance-attribution samples, not all mean attribution scores are equal, with F-value = 5.148 and p-value = 0.006 (Refer to Table 5.2 in the Appendix). Americans are distinc-tively less self-protecting than Japanese in attributing for unfavorable performances, with p-value = 0.019 (Refer to Table 5.3 in the Appendix). Attribution scores for Japanese = -1.0814 while Americans = -0.7333 only. Hence, Hypothesis 2b is unsupported. Americans are also different from Singaporean (with attribution score = -1.1234) in this aspect, with p-value = 0.009. Hy-pothesis 3b is also unsupported. This is also the verdict for Hypothesis 4b, with similar Japanese and Singaporeans’ unfavorable performance attribution tendencies, of p-value = 0.935.
Table 1: Table of Results for all Hypotheses Tested
Hypothesis No. Proposition Supported? 1a Self- enhancing/protecting bias present in Singapore Yes 1b Self- enhancing/protecting bias present in U.S.A Yes 1c Self- enhancing/protecting bias present in Japan Yes 2a U.S.A more self-enhancing than Japan No 2b U.S.A more self-protecting than Japan No 3a U.S.A more self-enhancing than Singapore No 3b U.S.A more self-protecting than Singapore No 4a Singapore more self-enhancing than Japan No 4b Singapore more self-protecting than Japan No
0
0.2
0.4
0.6
0.8
1
1.2
1.4
U.S.A Japan Singapore
Mean Attribution Scores for Favorable Performance
Mean Attribution Scores forFavorable Performance
Figure 1: Mean Attribution Scores for Favorable Performance
Halim & Chew
65
-1.2
-1
-0.8
-0.6
-0.4
-0.2
0
U.S.A Japan Singapore
Mean Attribution Scores for Unfavorable Performance
Mean Attribution Scores forUnfavorable Performance
Figure 2: Mean Attribution Scores for Unfavorable Performance
Discussion From statistical tests conducted, it is clear that Americans are significantly less self-enhancing/protecting than Japanese and possessing similar self-enhancing but less self-protecting tendencies compared to Singaporeans in performance attribution. Singaporeans and Japanese are similar in self-enhancing/protecting tendencies (See Table 1, Figures 1 and 2). Plausible explana-tions (or attributions) for such results are as below:
Americans’ Weaker Self-enhancing/protecting Bias Viewing the mean score magnitudes of both performance types for concerned countries, Ameri-cans’ comparatively lower utilization of self-enhancing/protecting bias runs contrary to previous studies which conclude that self-enhancing/protecting bias should be more predominant in Americans while Japanese are inclined towards counter-defensive approach. Explanations for this are:
Globalization Regarding this unexpected outcome, it can be reasoned that certain degrees of increased self-enhancing/protecting bias observed in Japan should be attributed to globalization. Rapid commu-nication and transportation technologies evolution, maturing and stable international relations, and government encouragement of overseas studies and ventures accelerate the pace of cross-cultural information and cultural value exchanges. These gradually erode cultural value differ-ences between countries. Japan’s general receptiveness of foreign ideas, evident since the Meiji Reformation and post World War II American influence, contributes to bringing her culturally closer to The United States.
Changing preference of various aspects of identity Another relatively more specific way of interpreting the increased self-enhancing/protecting bias can be that the Japanese have changed in respect of which self-identity component they prefer to protect. While downplaying their part in success and shouldering blame for failures may protect or even enhance moral image, it is damaging to their image of competency; Although few, studies show that self-effacing or self-critical individuals are generally perceived as being less capable (Powers & Zuroff, 1988). Evidence of correlation between self-effacing behavior and negative competence evaluations are found even in societies that support norms for self-effacing behavior (Bond, Leung, & Wan, 1982).
Performance Attributions
66
Doubtful effectiveness of counter-defensive attribution method Forsaking moral image for the image of being capable and intelligent may be the driver not only because of the change in preference but also the doubtful effectiveness of self-effacing behavior in boosting social appeal. This is evidenced by mixed research results. Self-effacing individuals are typically evaluated as less socially appealing by Westerners, who perceive them as falsely modest or obsequious (McNamara & Delamater 1985; Solomon, Brehony, Rothblum & Kelly 1985). In contrast, Asians evaluate such behaviors in a consistently positive manner, possibly grounded in the fact that such behavioral norms are well established within their cultural frame-work (Bond et al. 1982; Yoshida, Kojo, & Kaku, 1982).
Globalization not only expanded the operational scope of the company but also introduced cul-tural diversity in her stakeholders. This, coupled with cultural differences in evaluation of self-effacing behavior, may force the Japanese to reinvent their impression management strategy to favor self-enhancing and protection approach.
Inherent flaws of methodology While we can reasonably accept the possibility that Americans and Japanese will be eventually similar in their attribution bias patterns, the above mentioned reasons cannot sufficiently explain Japan’s greater self-enhancing/protecting tendency than that of Americans. In turn, this may be attributed to inherent flaws in our methodology, for our attribution scoring system is inefficient in capturing the property of interest: Magnitude of attribution bias. Deriving such magnitudes from assigning different points to factors of the two attribution types (internal vs. external) may not yield a pure measure of attribution bias strength but also include in it complexities like language usage norms differences.
It can be explained that companies immersed in a predominantly Asian culture, with possible cul-turally determined differences in need for elaboration, will tend to explain their performances in greater depth than their Western counterparts. While management in American companies may feel it sufficient to generalize and highlight the most critical reasons, Asian management may feel more responsibility in breaking down these “main points” into specific events/actions to facilitate better reader understanding. In addition, Western management may group factors of the same theme together while Asians do not do so. For example, attributions to various cost-cutting tech-niques adopted can be merely presented as such or broken down into specific measures like: “sal-ary cuts, production process rationalization, price re-negotiation with suppliers, etc.” Though of similar meaning, point allocation in each instance is different and thus unnecessarily complicates research results.
Singapore’s Similarity with Japan and Singapore’s Cultural Inclination Even accounting for the flaw in methodology, our study is still adequate for determining Singa-pore’s position on the cultural spectrum. Evident from our research is the observation that while Americans possess different degrees of attribution tendencies from the Japanese and Singapor-eans, Japanese and Singaporeans are very similar in this respect. Assuming that attribution pat-terns are reflections or estimates of underlying cultural norms, we can deduce that Singapore is closer to Japan on the cultural scale.
This is logical if we consider Singapore’s location in Asia, which immerse her in its cultural at-mosphere. Also, even with expatriate inflow, Asian races still comprise a high percentage of Sin-gapore’s population and still cling to traditional values.
Halim & Chew
67
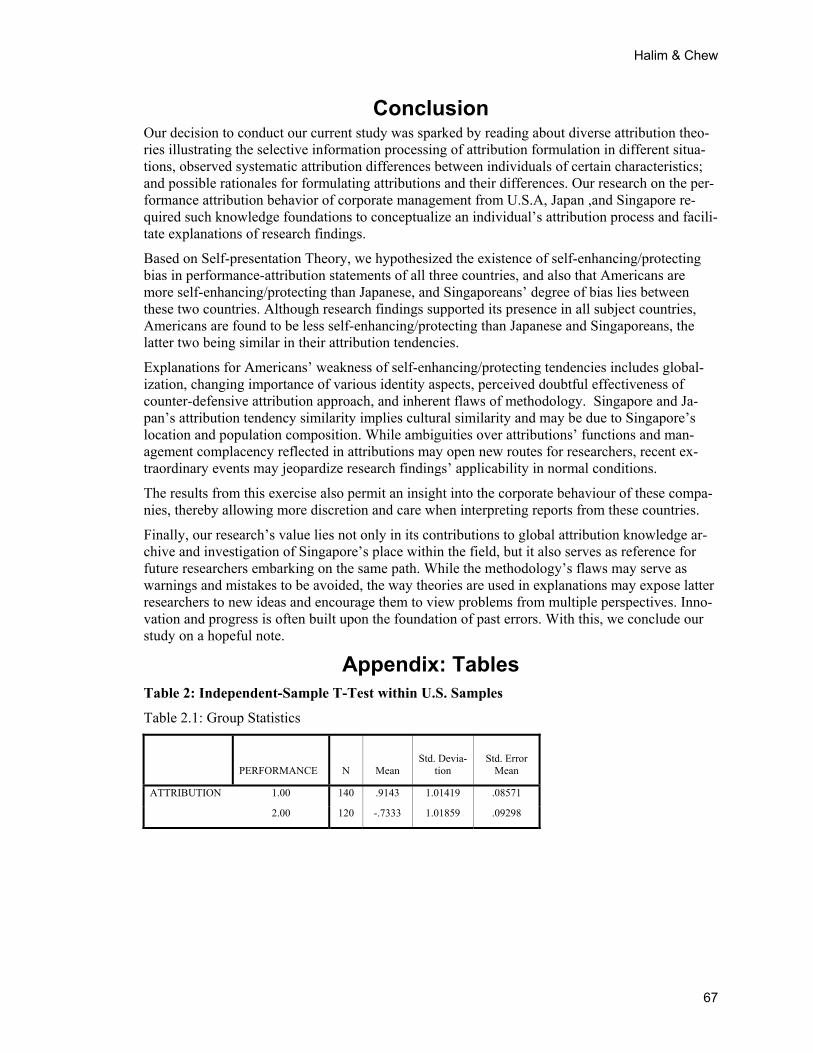
Conclusion Our decision to conduct our current study was sparked by reading about diverse attribution theo-ries illustrating the selective information processing of attribution formulation in different situa-tions, observed systematic attribution differences between individuals of certain characteristics; and possible rationales for formulating attributions and their differences. Our research on the per-formance attribution behavior of corporate management from U.S.A, Japan ,and Singapore re-quired such knowledge foundations to conceptualize an individual’s attribution process and facili-tate explanations of research findings.
Based on Self-presentation Theory, we hypothesized the existence of self-enhancing/protecting bias in performance-attribution statements of all three countries, and also that Americans are more self-enhancing/protecting than Japanese, and Singaporeans’ degree of bias lies between these two countries. Although research findings supported its presence in all subject countries, Americans are found to be less self-enhancing/protecting than Japanese and Singaporeans, the latter two being similar in their attribution tendencies.
Explanations for Americans’ weakness of self-enhancing/protecting tendencies includes global-ization, changing importance of various identity aspects, perceived doubtful effectiveness of counter-defensive attribution approach, and inherent flaws of methodology. Singapore and Ja-pan’s attribution tendency similarity implies cultural similarity and may be due to Singapore’s location and population composition. While ambiguities over attributions’ functions and man-agement complacency reflected in attributions may open new routes for researchers, recent ex-traordinary events may jeopardize research findings’ applicability in normal conditions.
The results from this exercise also permit an insight into the corporate behaviour of these compa-nies, thereby allowing more discretion and care when interpreting reports from these countries.
Finally, our research’s value lies not only in its contributions to global attribution knowledge ar-chive and investigation of Singapore’s place within the field, but it also serves as reference for future researchers embarking on the same path. While the methodology’s flaws may serve as warnings and mistakes to be avoided, the way theories are used in explanations may expose latter researchers to new ideas and encourage them to view problems from multiple perspectives. Inno-vation and progress is often built upon the foundation of past errors. With this, we conclude our study on a hopeful note.
Appendix: Tables Table 2: Independent-Sample T-Test within U.S. Samples
Table 2.1: Group Statistics
PERFORMANCE N Mean Std. Devia-
tion Std. Error
Mean
ATTRIBUTION 1.00 140 .9143 1.01419 .08571
2.00 120 -.7333 1.01859 .09298
Performance Attributions
68
Table 2.2: Independent-Samples T-Test
Levene's Test for Equality of
Variances t-test for Equality of Means
F Sig. t df Sig. (2-tailed)
Mean Differ-ence
Std. Error Difference
95% Confidence In-terval of the Differ-
ence
Lower Upper
ATTRIBU-TION
Equal variances assumed
1.483 .224 13.033 258 .000 1.6476 .12642 1.39867 1.89657
Equal variances not as-sumed
13.028 251.620 .000 1.6476 .12646 1.39856 1.89668
Table 3: Independent-Sample T-Test within Japanese Samples
Table 3.1:Group Statistics
PERFORMANCE N Mean Std. Deviation Std. Error Mean
ATTRIBUTION 1.00 190 1.2632 1.47078 .10670
2.00 172 -1.0814 1.08380 .08264
Table 3.2: Independent-Samples T-Test
Levene's Test for Equality of Vari-
ances t-test for Equality of Means
F Sig. t df Sig. (2-tailed)
Mean Difference
Std. Error Difference
95% Confidence Interval of the Differ-
ence
Lower Upper
ATTRIBU-TION
Equal variances assumed
11.827 .001 17.117 360 .000 2.3446 .13697 2.07519 2.61391
Equal variances not as-sumed
17.372 346.103 .000 2.3446 .13496 2.07911 2.61000
Table 4: Independent-Sample T-Test within Singaporean Samples
Table 4.1: Group Statistics
PERFORMANCE N Mean Std. Deviation Std. Error Mean
ATTRIBUTION 1.00 166 1.0783 1.18573 .09203
2.00 154 -1.1234 1.12214 .09042
Halim & Chew
69
Table 4.2: Independent-Samples T-Test
Levene's Test for Equality of
Variances t-test for Equality of Means
F Sig. t df Sig. (2-tailed)
Mean Dif-ference
Std. Error Difference
95% Confidence Interval of the Dif-
ference
Lower Upper
ATTRIBU-TION
Equal variances assumed
4.452 .036 17.029 318 .000 2.2017 .12929 1.94732 2.45606
Equal variances not as-sumed
17.065 317.871 .000 2.2017 .12902 1.94785 2.45553
Table 5: One-way ANOVA for Favorable Performance-Attribution Samples
Table 5.1: Descriptive ATTRIBUTION
N Mean Std. Deviation Std. Error 95% Confidence Interval for Mean Minimum Maximum
Lower Bound Upper Bound
1.00 140 .9143 1.01419 .08571 .7448 1.0838 -2.00 3.00
2.00 190 1.2632 1.47078 .10670 1.0527 1.4736 -2.00 7.00
3.00 166 1.0783 1.18573 .09203 .8966 1.2600 -2.00 3.00
Total 496 1.1028 1.26631 .05686 .9911 1.2145 -2.00 7.00
Table 5.2: One-way ANOVA ATTRIBUTION
Sum of Squares df Mean Square F Sig.
Between Groups 9.961 2 4.980 3.133 .044
Within Groups 783.795 493 1.590
Total 793.756 495
Table 5.3: Multiple Comparisons Contrast Coefficients
Contrast COUNTRY
1.00 2.00 3.00
1 -1 1 0
2 -1 0 1
3 0 -1 1
Performance Attributions
70
Table 5.4: Dependent Variable: ATTRIBUTION
(I) COUNTRY (J) COUNTRY
Mean Differ-ence (I-J) Std. Error Sig.
95% Confidence Interval
Lower Bound
Upper Bound
Tukey HSD 1.00 2.00 -.3489(*) .14044 .035 -.6790 -.0187
3.00 -.1640 .14468 .494 -.5042 .1761
2.00 1.00 .3489(*) .14044 .035 .0187 .6790
3.00 .1848 .13396 .352 -.1301 .4998
3.00 1.00 .1640 .14468 .494 -.1761 .5042
2.00 -.1848 .13396 .352 -.4998 .1301
LSD 1.00 2.00 -.3489(*) .14044 .013 -.6248 -.0729
3.00 -.1640 .14468 .257 -.4483 .1202
2.00 1.00 .3489(*) .14044 .013 .0729 .6248
3.00 .1848 .13396 .168 -.0784 .4480
3.00 1.00 .1640 .14468 .257 -.1202 .4483
2.00 -.1848 .13396 .168 -.4480 .0784
Bonferroni 1.00 2.00 -.3489(*) .14044 .040 -.6862 -.0115
3.00 -.1640 .14468 .772 -.5116 .1835
2.00 1.00 .3489(*) .14044 .040 .0115 .6862
3.00 .1848 .13396 .505 -.1369 .5066
3.00 1.00 .1640 .14468 .772 -.1835 .5116
2.00 -.1848 .13396 .505 -.5066 .1369
* The mean difference is significant at the .05 level.
References Abrahamson, E., & Amir, E. (1996). The information content of the president's Letter to Shareholders.
Journal of Business Finance and Accounting, 23(8), 1157-1182.
Bem, D. J. (1967). Self-perception: An alternative interpretation of cognitive dissonance phenomena. Psychological Review, 74, 183–200.
Bond, M. H., Leung, K., & Wan, K. (1982). The social impact of self-effacing attributions: The Chinese case. Journal of Social Psychology, 118, 157-166.
Bryan, S. H. (1997). Incremental information content of required disclosures contained in management discussion and analysis. The Accounting Review, 72(2), 285-301.
Cha, J. H., & Nam, K. D. (1985). A test of Kelley’s cube theory of attribution: A cross-cultural replication of MacArthur’s study. Korean Social Science Journal, 12, 151-180.
Halim & Chew
71
Chew, K. H. (2000). Cross-cultural management in local and multinational corporations in Singapore. In J. B. P. Sinha (Ed.), Basic research report: Managing cultural diversity for productivity, The Asian way (pp. 327-369). Asian Productivity Organization.
Choi, I., & Markus, H. R. (1998). Implicit theories and causal attribution East and West. Unpublished manuscript, University of Michigan.
Crocker, J., & Luhtanen, R. (1990). Collective self-esteem and in-group bias. Journal of Personality and Social Psychology, 58, 60-67.
Heider, F. (1958). The Psychology of Interpersonal Relations. New York: Wiley.
Heine, S. J., Takata, T., & Lehman, D. R. (2000). Beyond self-presentation: Evidence for self-criticism among the Japanese. Personality and Social Psychology Bulletin, 26, 71-78.
Herskovits, M. J. (1995). Cultural anthropology. New York, NY: Knopf.
Hofstede, G. (1994). The business of international business culture. International Business Review, 3, 01-14
Hofstede, G., & Bond, M. H. (1988). The Confucius connection: From cultural roots to economic growth. Organizational Dynamics, 16, 04-21.
Hopwood, A. G. (1996). Making visible and the construction of visibilities: Shifting agendas in the design of the corporate report: An introduction. Accounting, Organizations and Society, 21, 54-56.
Ingram, R.W., & Frazier, K. B. (1980). Environmental performance and corporate disclosure. Journal of Accounting Research, 18(2), 614-622.
Jones, E. E., Kanouse, D. W., Kelley, H. H., Nisbett, R. E., Valins, S., & Weiner, B. (1971). Attribution: Perceiving the causes of behavior. Morristown, NJ: General Learning Press.
Jones, E. E., & Davis, K. E. (1965). A theory of correspondent inferences: From acts to dispositions. In L. Berkowitz (Ed.), Advances in Experimental Social Psychology (Vol. 2, pp. 219-266). New York: Aca-demic Press.
Kagitcibasi, C. (1997). Individualism and collectivism. In M. H. Berry, Segall & C. Kagitcibasi (Eds), Handbook of cross-cultural psychology (Vol. 3: Social behavior and applications) Boston, MA: Allyn and Bacon,
Kelly H. H. (1967). Attribution theory in social psychology. In D. Levine (Ed.), Nebraska Symposium on Motivation, Vol. 15 (pp. 192-240). Lincoln: University of Nebraska Press.
Kruglanski, A. W. (1980). Lay epistemo-logic—process and contents: another look at attribution theory. Psychological Review, 87(1), 70-87.
Krull, D., Loy, M., Lin, J., & Wang, C. (1999). The fundamental attribution error: Correspondence bias in individualist and collectivist cultures. Personality and Social Psychology Bulletin, 25(10), 1208-1220. Thousand Oaks.
Markus, H. R., & Kitayama, S. (1991). Culture and the self: Implications for cognition, emotion and moti-vation. Psychological Review, 98, 224-253.
Markus, H. R., & Kitayama, S. (1994). The cultural construction of self and emotion: Implications for so-cial behavior. In S. Kitayama & H. R. Markus (Eds.), Emotion and culture: Empirical studies of mu-tual influence. Washington: APA.
McConnell, D., Haslem, J. A., & Gibson, V. R. (1986). The president's letter to stockholders: A new look. Financial Analysts Journal, September-October, 66-70.
McNamara, J. R., & Delamater, R. J. (1985). Note on the social impact of assertiveness in occupational contexts. Psychological Reports, 56, 819-822,
Meijer, Z. Y., & Semin, G. R. (1998). When the self-serving bias does not serve the self: Attributions of success and failure in cultural perspective. Free University Amsterdam.
Performance Attributions
72
Miller, J. G. (1984). Culture and the development of everyday social explanation. Journal of Personality and Social Psychology, 46, 961-978.
Morris, M. W., & Peng, K. (1994). Culture and cause: American and Chinese attributions for social and physical events. Journal of Personality and Social Psychology, 67, 949-971.
Powers, T. A., & Zuroff, D. C. (1988). Interpersonal consequences of over self-criticism: A comparison with neutral and self-enhancing presentations of self. Journal of Personality and Social Psychology, 54, 1054-1062.
Rogers, R. K., & Grant, J. (1997). An empirical investigation of the relevance of the financial reporting process to financial analysts. Unpublished manuscript. Portland State University, February 1997.
Ross, L. (1977). The intuitive psychologist and his shortcomings: Distortions in the attribution process. In L. Berkowitz (Ed.), Advances in experimental social psychology (Vol. 10, pp. 173-220). New York: Academic Press.
Schipper, K. (1991). Analysts' forecasts. Accounting Horizons, 5(4), 105-121.
Segall, M. H., Dasen, P. R., Berry, J. W., & Poortinga, Y. H. (1999). Human behavior in global perspective (2nd ed.). Boston, MA: Allyn & Bacon.
Solomon, L. J., Brehony, K. A., Rothblum, E. D., & Kelly, J. A. (1985). Corporate managers’ reactions to assertive social skills exhibited by males and females. Journal of Organization Behavior Management, 4, 49-63.
Thomas, A. (1994). Psychologie und multikulturelle gesellschaft: Problemanalysen und problemlösungen” [Psychology and multicultural society: Analysis and problem solving]. Göttingen, Germany: Verlag für Angewandte Psychologie.
Triandis, H. C., Malpass, R., & Davidson, A. R. (1972). Psychology and culture. Annual Review of Psy-chology, 24, 355-378.
Yoshida, T., Kojo, K., & Kaku, H. (1982). A study on the development of self-presentation in children. Japanese Journal of Educational Psychology, 30, 120-127.
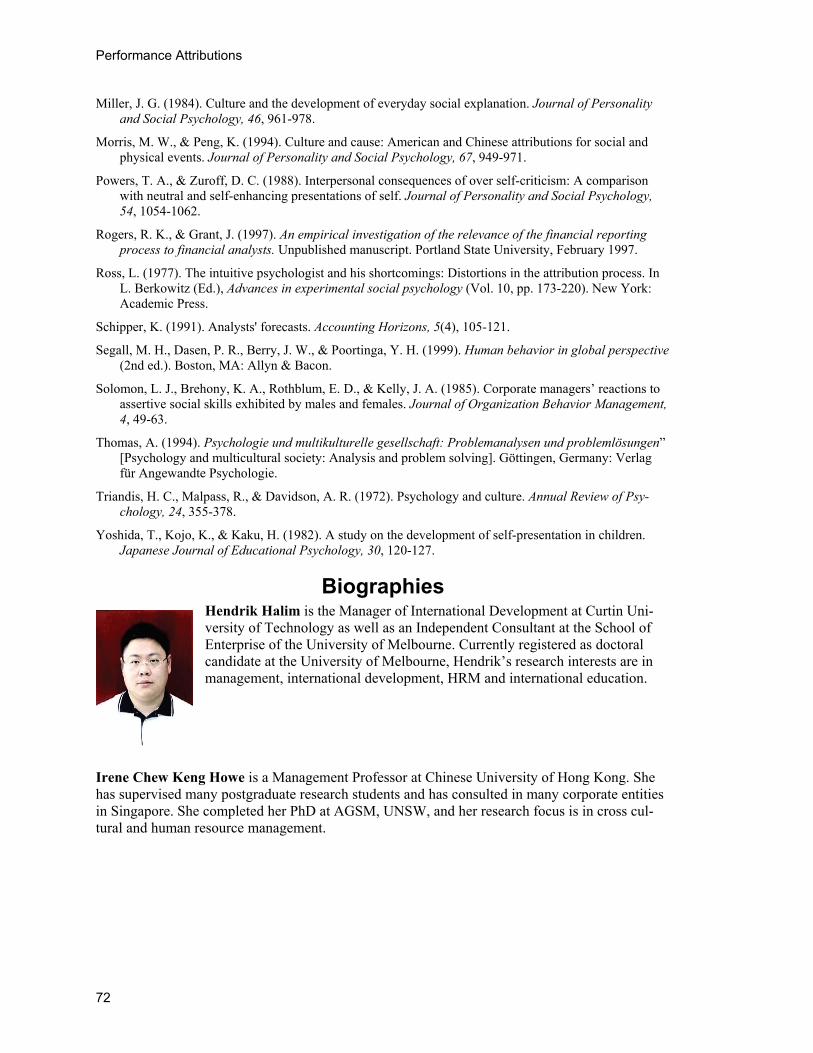
Biographies Hendrik Halim is the Manager of International Development at Curtin Uni-versity of Technology as well as an Independent Consultant at the School of Enterprise of the University of Melbourne. Currently registered as doctoral candidate at the University of Melbourne, Hendrik’s research interests are in management, international development, HRM and international education.
Irene Chew Keng Howe is a Management Professor at Chinese University of Hong Kong. She has supervised many postgraduate research students and has consulted in many corporate entities in Singapore. She completed her PhD at AGSM, UNSW, and her research focus is in cross cul-tural and human resource management.