performance appraisal of mobile …
TRANSCRIPT

ATBU, Journal of Science, Technology & Education (JOSTE); Vol. 4 (1), March, 2016 ISSN: 2277-0011
Surajo, A. M. Copyright © 2016 JOSTE. All Rights Reserved (www.atbuftejoste.com)
67
PERFORMANCE APPRAISAL OF MOBILE TELECOMMUNICATION NETWORK (MTN) TRAFFIC CONGESTION IN DUTSE, JIGAWASTATE
Surajo, A. MusaJigawa State Institute of Information Technology, (JSIIT) Kazaure
[email protected],[email protected]
ABSTRACTThis is an analysis of traffic congestion in the MTN Mobile Network of Dutse metropolis due to unplanned event with aview to reducing its effect. Drive and Pulled data test methods where adopted for the network performance duringpeak and off-peak periods. The Drive Test gave a 20% and 10% deviation from the recommended KPIs set by MTNduring peak and off-peak hours respectively, while the Data Pulled test during an unplanned public event indicates thatthe cells near the scene of the event experienced high congestion level with a 32% (PCong), 3.5-6% (Pdrop), 76.59%(TCH availability), and 96.18% (SDCCH) which is a great deviation from the MTN acceptable KPIs of <5%, <2% , >99%and >98% respectively. Thus, this paper finally, proposed both hardware and software solutions that will helpminimized these distributed congestion challenges within the network system.
Keywords: GSM, GPRS, CDMA, PSTN, PCong, Pdrop, TCH and SDCCH
INTRODUCTIONThe demand of wireless communication has
been on the increase from generation to generation.Most common ones are the data and/or voicecommunication that includes Infrared, Bluetooth,Mobile Ad hoc Networks (MANETs), Vehicular Ad hocNetworks (VANETs), Voice Over Internet Protocol(VoIP), Global System for Mobile Communication(GSM),etc. [1]. GSM is the most popular among thembecause it is easy to acquire and maintain, has clarityof voice communication and ease of datacommunication among others. However, the effectiveperformance of the GSM is greatly challenged by theadded features of data communications (i.e. GeneralPacket Radio Service (GPRS)) on the same systemthough, third Generation (3G) Technology has greatlyreduced this challenge to the barest [2]. Anotherdegrading factor facing GSM power throughput is thetraffic congestion that takes multifarious dimensions.Therefore, this paper aimed at identifying some of thecauses of this congestion as they affect the service
performance of the MTN mobile network a case studyof Dutse metropolis, Jigawa State, Nigeria.LITERATURE REVIEW
The history of communication started since1800s of which Samuel Morse invented the Telegraphand Alexandra Bell in 1876 came up with the Telephonewhich was later followed by various inventions thatleads to cellular communication in 1983. In 1982through 1985 the European digital telecommunicationsstandard use the 900MHz frequency band as the firstGlobal System for Mobile Communication (GSM)technology. Nordic Mobile Telephony NMT 450 was thefirst analogue technology by the Europe (Middle East)in 1981, which was followed by the Advanced MobilePhone System that is also analogue in nature by Northand South America in 1983. Other analogue telephonesare the Total Access Communication System TACS(1985) by Europe and China and the Nordic MobileTelephony NMT 900 in 1986 by Europe (Middle East)[13].
In an effort to select the best digitaltransmission technology to use in Paris in 1986, a fieldtests was conducted and a choice was made to use
ATBU, Journal of Science, Technology & Education (JOSTE); Vol. 4 (1), March, 2016 ISSN: 2277-0011
Surajo, A. M. Copyright © 2016 JOSTE. All Rights Reserved (www.atbuftejoste.com)
68
Time Division Multiple Access TDMA and/or FrequencyDivision Multiple Access FDMA. A combination of thetwo technologies were made and put to use byworldwide telephone operators introducing the firstdigital telephony known as Global System for MobileCommunication (GSM) in 1991. The same year, DigitalAMPS IS136 was introduced by North and SouthAmerica. In 1992, GSM 1800 was introduced by Europe;Code Division Multiple Access CDMA ISO95 wasintroduced by North America and Korea 1993. In 1994and 1995 respectively Personal Digital Cellular PDCand Personal Communication Services PCS 1900 wereintroduced by Japan and North America respectively[13].
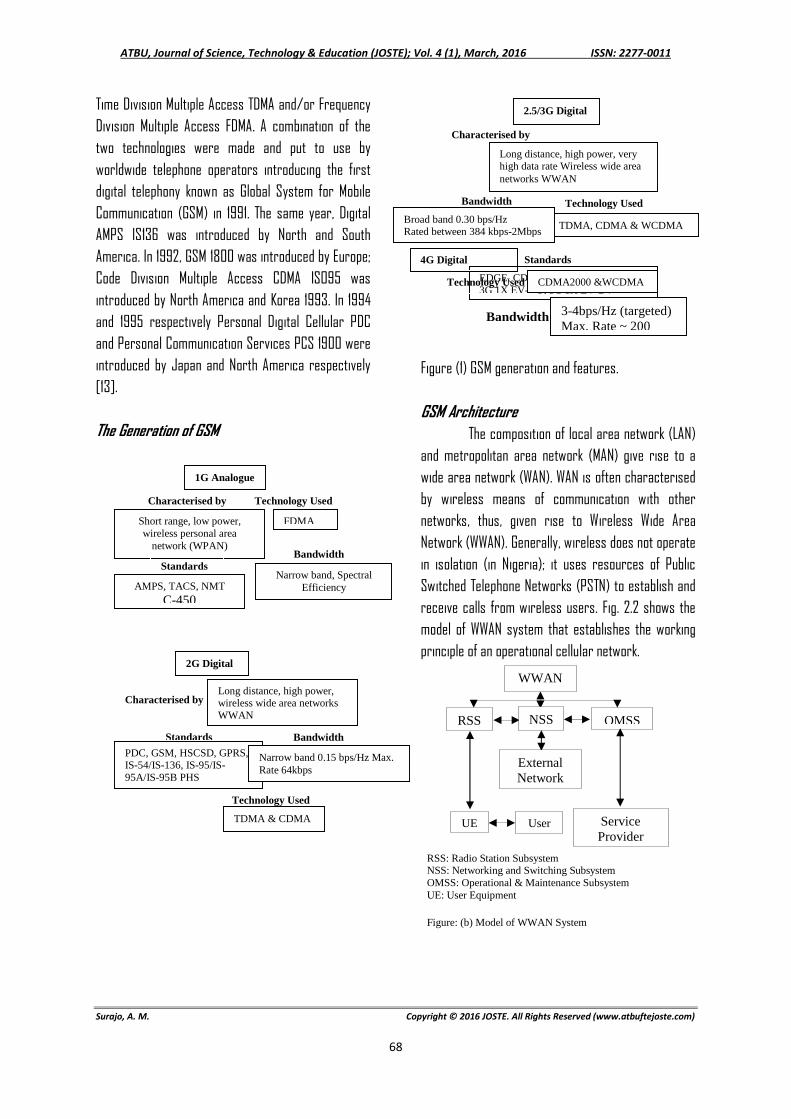
The Generation of GSM
Figure (1) GSM generation and features.
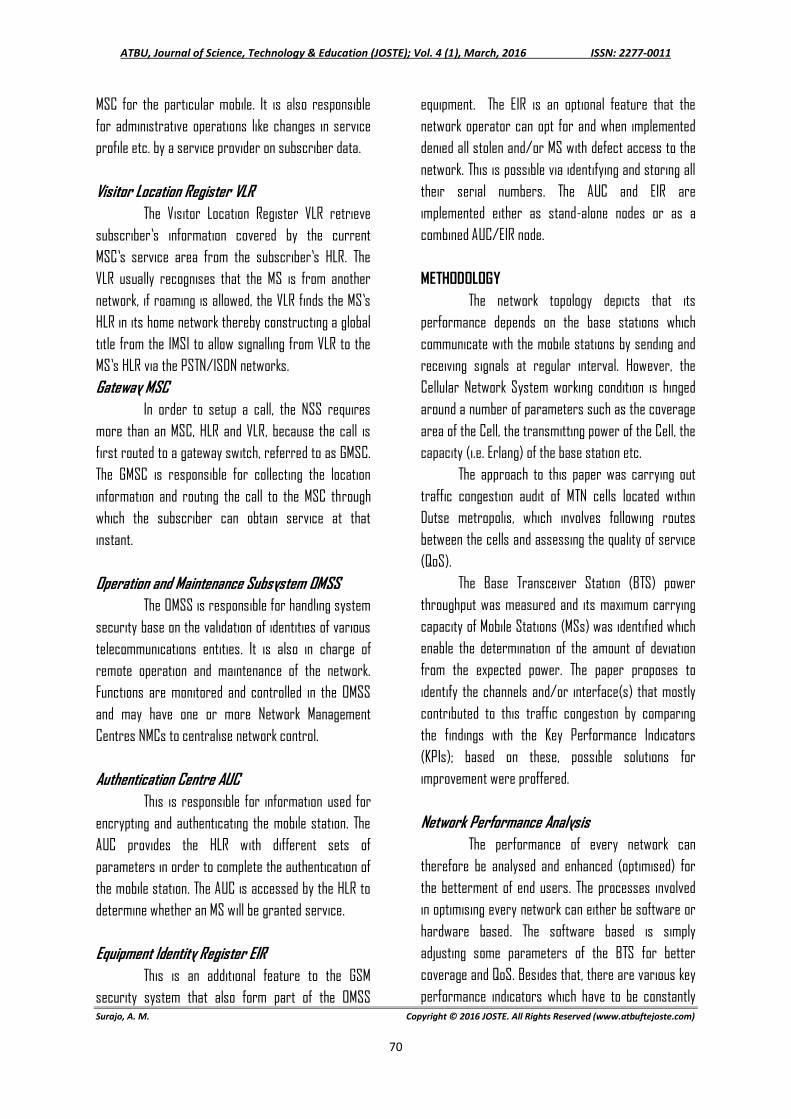
GSM ArchitectureThe composition of local area network (LAN)
and metropolitan area network (MAN) give rise to awide area network (WAN). WAN is often characterisedby wireless means of communication with othernetworks, thus, given rise to Wireless Wide AreaNetwork (WWAN). Generally, wireless does not operatein isolation (in Nigeria); it uses resources of PublicSwitched Telephone Networks (PSTN) to establish andreceive calls from wireless users. Fig. 2.2 shows themodel of WWAN system that establishes the workingprinciple of an operational cellular network.
Bandwidth
Technology UsedCharacterised by
1G Analogue
Short range, low power,wireless personal area
network (WPAN)
Standards
AMPS, TACS, NMTC-450
FDMA
Narrow band, SpectralEfficiency
WWAN
NSS OMSSRSS
ServiceProvider
ExternalNetwork
UserUE
RSS: Radio Station SubsystemNSS: Networking and Switching SubsystemOMSS: Operational & Maintenance SubsystemUE: User Equipment
Figure: (b) Model of WWAN System
Technology Used
StandardssPDC, GSM, HSCSD, GPRS,
IS-54/IS-136, IS-95/IS-95A/IS-95B PHS
Bandwidth
Characterised by
2G Digital
Long distance, high power,wireless wide area networksWWAN
Narrow band 0.15 bps/Hz Max.Rate 64kbps
TDMA & CDMA
Standards
EDGE, CDMA2000, WCDMA/UMTS3G 1X EV-DO, 3G 1X EV-DV
Bandwidth Technology Used
Characterised by
2.5/3G Digital
Long distance, high power, veryhigh data rate Wireless wide areanetworks WWAN
TDMA, CDMA & WCDMABroad band 0.30 bps/HzRated between 384 kbps-2Mbps
Technology Used CDMA2000 &WCDMA
Bandwidth 3-4bps/Hz (targeted)Max. Rate ~ 200Mbps
4G Digital

ATBU, Journal of Science, Technology & Education (JOSTE); Vol. 4 (1), March, 2016 ISSN: 2277-0011
Surajo, A. M. Copyright © 2016 JOSTE. All Rights Reserved (www.atbuftejoste.com)
69
Radio Station Subsystem (RSS)The radio station subsystem RSS is
sometimes referred to as the Base Station Subsystem(BSS) and is responsible for providing and managingtransmission paths between the User Equipment (UE)and the Network Station Subsystem (NSS) [2]. Thisinvolves the management of the radio interfacebetween the UE and other WWAN system.
User Equipment (UE)The telecommunication services can only be
accessed by the user via radio transceiver called theUser Equipment (UE) [2]. The UE can be portable orhandheld station with hardware part and softwarethat is responsible for the interface between the userand the Base Station. A subscriber identity module(SIM) is the second part of the UE that hold user’sspecific data in the form of smart card, whicheffectively functions as a logical terminal. When UE isportable it is called a Mobile Station (MS).
Base Transceiver Station (BTS)The Base Transceiver Station (BTS) is the
physical equipment that facilitates radio signaltransmission and reception, signal measurement,encryption and communication with the Base StationController (BSC). Usually, the BTS is located at thecentre of the cell which communicates with thenetwork through the BTS. A base station can have aminimum number of BTS and at the same time canhave its multiples in single station [2].
Base Station Controller BSCThe Base Station Controller, BSC is another
component of the BSS that serves as theconcatenation base of several BTSs. The radio channelused by every BTS is allocated by the BSC. In addition,the BSC connects speech and signalling channel toMSC and handles frequency administration, transfersand handovers of mobile station between differentBTSs [2].
Networking and Switching Subsystem NSSThe UE is managed and connected to the entire
network facilities via the NSS. The NSS is neitherdirectly connected with the UE, nor the BSS, but has adirect contact with the external networks. The UE/MS,BSS and the NSS form the operational part of theentire wireless wide area network WWAN. The mainswitching function of the WWAN (Mobile SwitchingCentre MSC), data basis required by the subscriber(Home Location Register HLR) and mobilitymanagement (Visitor Location Register VLR) are thebasic parts of the NSS and has its major role as tomanage communication between the WWAN and othernetworks.
Mobile Switching Centre MSCThe Mobile Switching Centre MSC performs
the following functions in a WWAN system [12]: Performs necessary switching function
required for the user equipment locatedwithin the associated geographical area,called an MSC area.
Monitors the mobility of its subscribers andmanages necessary resources required tohandle and update the location registrationprocedures and to carry out the handofffunctions.
Involved in the networking function tocommunicate with other networks such asPSTN and ISDN.
The interworking function of the MSC dependsupon the type of the network to which it is connectedand the service to be performed. The call routing, callcontrol and echo control functions are also performedby the MSC.
Home Location Register HLRThe Home Location Register HLR is a
functional unit used for management of mobilesubscribers. The HLR stores basic information aboutsubscriber’s information and part of the mobileinformation to allow incoming calls to be routed to the
ATBU, Journal of Science, Technology & Education (JOSTE); Vol. 4 (1), March, 2016 ISSN: 2277-0011
Surajo, A. M. Copyright © 2016 JOSTE. All Rights Reserved (www.atbuftejoste.com)
70
MSC for the particular mobile. It is also responsiblefor administrative operations like changes in serviceprofile etc. by a service provider on subscriber data.
Visitor Location Register VLRThe Visitor Location Register VLR retrieve
subscriber’s information covered by the currentMSC’s service area from the subscriber’s HLR. TheVLR usually recognises that the MS is from anothernetwork, if roaming is allowed, the VLR finds the MS’sHLR in its home network thereby constructing a globaltitle from the IMSI to allow signalling from VLR to theMS’s HLR via the PSTN/ISDN networks.Gateway MSC
In order to setup a call, the NSS requiresmore than an MSC, HLR and VLR, because the call isfirst routed to a gateway switch, referred to as GMSC.The GMSC is responsible for collecting the locationinformation and routing the call to the MSC throughwhich the subscriber can obtain service at thatinstant.
Operation and Maintenance Subsystem OMSSThe OMSS is responsible for handling system
security base on the validation of identities of varioustelecommunications entities. It is also in charge ofremote operation and maintenance of the network.Functions are monitored and controlled in the OMSSand may have one or more Network ManagementCentres NMCs to centralise network control.
Authentication Centre AUCThis is responsible for information used for
encrypting and authenticating the mobile station. TheAUC provides the HLR with different sets ofparameters in order to complete the authentication ofthe mobile station. The AUC is accessed by the HLR todetermine whether an MS will be granted service.
Equipment Identity Register EIRThis is an additional feature to the GSM
security system that also form part of the OMSS
equipment. The EIR is an optional feature that thenetwork operator can opt for and when implementeddenied all stolen and/or MS with defect access to thenetwork. This is possible via identifying and storing alltheir serial numbers. The AUC and EIR areimplemented either as stand-alone nodes or as acombined AUC/EIR node.
METHODOLOGYThe network topology depicts that its
performance depends on the base stations whichcommunicate with the mobile stations by sending andreceiving signals at regular interval. However, theCellular Network System working condition is hingedaround a number of parameters such as the coveragearea of the Cell, the transmitting power of the Cell, thecapacity (i.e. Erlang) of the base station etc.
The approach to this paper was carrying outtraffic congestion audit of MTN cells located withinDutse metropolis, which involves following routesbetween the cells and assessing the quality of service(QoS).
The Base Transceiver Station (BTS) powerthroughput was measured and its maximum carryingcapacity of Mobile Stations (MSs) was identified whichenable the determination of the amount of deviationfrom the expected power. The paper proposes toidentify the channels and/or interface(s) that mostlycontributed to this traffic congestion by comparingthe findings with the Key Performance Indicators(KPIs); based on these, possible solutions forimprovement were proffered.
Network Performance AnalysisThe performance of every network can
therefore be analysed and enhanced (optimised) forthe betterment of end users. The processes involvedin optimising every network can either be software orhardware based. The software based is simplyadjusting some parameters of the BTS for bettercoverage and QoS. Besides that, there are various keyperformance indicators which have to be constantly

ATBU, Journal of Science, Technology & Education (JOSTE); Vol. 4 (1), March, 2016 ISSN: 2277-0011
Surajo, A. M. Copyright © 2016 JOSTE. All Rights Reserved (www.atbuftejoste.com)
71
monitored and maintained. Necessary changes mightbe proposed in order to keep the KPIs within thethreshold of the mobile operators.
For the hardware based, it can either be anElectrical Tilt or Mechanical Tilt. Thus, this projectfocuses on the software aspect of the network.
Key Performance Indicators (KPIs)The KPIs served as the gauge to those
parameters of the network that determine itsperformance. The system will be at its optimum whenthese performance parameters are all measured tobe operating at the KPIs. This research considers thefollowing as key performance parameters of thesystem:
1) Paging Success Rate2) Immediate Assignment Success Rate3) Random Access Success Rate4) TCH Assignment Success Rate5) Call Drop Rate6) Handover Success RateKPIs as previously stated may have an
International Standard as such mobile operators mayhave their own reference point due to theirpeculiarities and the condition under which they areoperating. This thesis focuses on MTN operators.Table 1: KPIs for MTN Operators
DATA COLLECTION PROCEDUREIn an effort to arriving at the research aim
and objectives, there are two basic methods used indata collection to this project, these are:a) Drive Testb) Record tracking from the network stackcounters. In addition to the above, a verbal discussionwas also adopted for more information about somestandards used by MTN operators where the needarises. The traffic congestion audit of MTN cellslocated within Dutse metropolis was thereforeconducted via the drive test and record trackingmethods. The details of the results are as follows:
Drive TestThe drive test is a means of data collection
on moving vehicle. This type of test is done regardlessof the technology involved e.g. GSM, CDMA, UMTS, andLTE etc. the analysis of the drive test data is theinhibiting factor toward evaluating a network and inreturn may make some changes in an effort tooptimising the entire system. The following equipmentare needed to carry out a successful drive test.
a) Laptop Computerb) Data Collection Software (e.g. TEMS 9.0 for
this case)c) Dongle Key (Serve as security for unlocking
the software inform of flash memory)d) Mobile Phone (at least one mobile phone)e) A GPS (Global Positioning System) worldwide
navigation system that uses informationreceived from orbiting satellites.
f) A Scanner (Optional).
Drive Test TypesBasically there are numerous types/reasons
for which a drive test was conducted among othersare: Performance Analysis Integration of new sites and change
parameters of existing ones Marketing
Metric KPIPercentage Congestion (Pcong) <5%Percentage Drop (Pdrop) <2%Erlang According to
site designTraffic Channel (TCH) Availability >99%Percentage Control Congestion(PCCong)
<1%
PBADICM <2%Percentage Traffic (PTFail) <5%Percentage Setup (PSFail) <5%Percentage Control Fail (PCFail) <5%Handover (HO) Success Rate >95%Call Setup Success Rate CSSR >95%
ATBU, Journal of Science, Technology & Education (JOSTE); Vol. 4 (1), March, 2016 ISSN: 2277-0011
Surajo, A. M. Copyright © 2016 JOSTE. All Rights Reserved (www.atbuftejoste.com)
72
BenchmarkingThe most popular among these are the
Performance Analysis (for an individual operator) andthe Benchmarking (Compares between two or moreoperators). Test for performance analysis is the mostcommon, and usually made in areas/sites of interest.Drive test for data collection and/or analysis allowstest data to be collected while moving. The data can beviewed or analysed in real time allowing a view ofnetwork performance on the field. Data from all unitsare grouped by collection software and stored.
The GPS is meant to collect the data latitudeand longitude of every point of measurement like time,
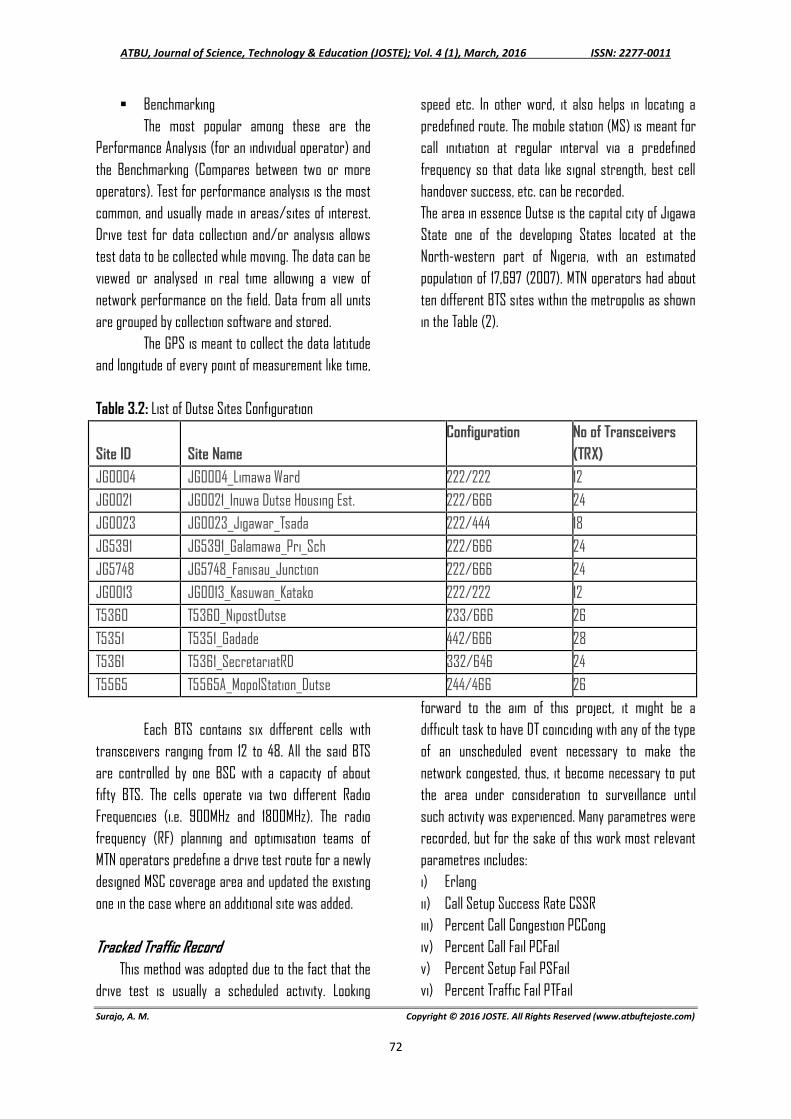
speed etc. In other word, it also helps in locating apredefined route. The mobile station (MS) is meant forcall initiation at regular interval via a predefinedfrequency so that data like signal strength, best cellhandover success, etc. can be recorded.The area in essence Dutse is the capital city of JigawaState one of the developing States located at theNorth-western part of Nigeria, with an estimatedpopulation of 17,697 (2007). MTN operators had aboutten different BTS sites within the metropolis as shownin the Table (2).
Table 3.2: List of Dutse Sites Configuration
Site ID Site NameConfiguration No of Transceivers
(TRX)JG0004 JG0004_Limawa Ward 222/222 12JG0021 JG0021_Inuwa Dutse Housing Est. 222/666 24JG0023 JG0023_Jigawar_Tsada 222/444 18JG5391 JG5391_Galamawa_Pri_Sch 222/666 24JG5748 JG5748_Fanisau_Junction 222/666 24JG0013 JG0013_Kasuwan_Katako 222/222 12T5360 T5360_NipostDutse 233/666 26T5351 T5351_Gadade 442/666 28T5361 T5361_SecretariatRD 332/646 24T5565 T5565A_MopolStation_Dutse 244/466 26
Each BTS contains six different cells withtransceivers ranging from 12 to 48. All the said BTSare controlled by one BSC with a capacity of aboutfifty BTS. The cells operate via two different RadioFrequencies (i.e. 900MHz and 1800MHz). The radiofrequency (RF) planning and optimisation teams ofMTN operators predefine a drive test route for a newlydesigned MSC coverage area and updated the existingone in the case where an additional site was added.
Tracked Traffic RecordThis method was adopted due to the fact that the
drive test is usually a scheduled activity. Looking
forward to the aim of this project, it might be adifficult task to have DT coinciding with any of the typeof an unscheduled event necessary to make thenetwork congested, thus, it become necessary to putthe area under consideration to surveillance untilsuch activity was experienced. Many parametres wererecorded, but for the sake of this work most relevantparametres includes:i) Erlangii) Call Setup Success Rate CSSRiii) Percent Call Congestion PCCongiv) Percent Call Fail PCFailv) Percent Setup Fail PSFailvi) Percent Traffic Fail PTFail

ATBU, Journal of Science, Technology & Education (JOSTE); Vol. 4 (1), March, 2016 ISSN: 2277-0011
Surajo, A. M. Copyright © 2016 JOSTE. All Rights Reserved (www.atbuftejoste.com)
73
vii) BADICMviii) Percent Drop Pdropix) Stand Alone Dedicated Control Channel SDCCHx) Traffic Channel TCH
RESULTS ANALYSIS AND DISCUSSIONDrive Test at Dutse (Peak Hour)As previously discussed in chapter three
sections 3, drive test is the first adopted method ofdata collection in this project. The Drive Test (DT) wasconducted during the peak hour to verify the level ofcongestion, the signal strength as well as the receivequality within this hour.
Following the predefined drive test route bythe MTN operators, the DT was undertaken following
the predefined test route is shown in figure (4) below:Figure (3) Test Route (In Dutse Metropolis)
On the basis of the drive test via the route shownabove, the relevant logged data are obtained asfollows:
i) Receive Level
ii) Receive Qualityiii) Congestion Level
Receive LevelReceive level indicates the number of calls
received at different attenuation levels. In other wordit can be the network coverage. The receive level plotobtained in the drive test is shown in figure (4) below:
Figure (4) MS1 Rx Level Plot
For the sake of clarity, the receive level plot is furtherTabulated in Table 3 below:
Table 3: MS1 Rx Level CountRanges (indB)
CallSamples
% usage CumulativePercentage
[Min, -110] 0 0.00% 0.00%[-110, -95] 1706 3.59% 3.59%[-95, -85] 11244 23.63% 27.22%[-85, -81] 8786 18.46% 45.68%[-81, -70] 20469 43.02% 88.70%[-70, Max] 5379 11.30% 100.00%Total 47584 100.00% 100.00%
Figure (5) MS1 Rx Level ChartFigure (5) represent the MS1 Rx level chart
with the sampled call (Vertical Left) in percentage(Vertical Right) The call samples obtained with betterattenuation level -70, max (5379) is the list comparedto the other dB levels, with an exception of -110, -95(1706) which is indeterminate. Hence, the MS1 Rx levelchart above indicated poor signal strength receiveslevel as compared with recommended MTN KPIs.

ATBU, Journal of Science, Technology & Education (JOSTE); Vol. 4 (1), March, 2016 ISSN: 2277-0011
Surajo, A. M. Copyright © 2016 JOSTE. All Rights Reserved (www.atbuftejoste.com)
74
Receive Quality (dB)The receive quality indicates in quantitative
terms the quality of the received signal. Although asignal Rx level might be strong, yet, the signal qualitycould be poor. At times user may have experienced abreakage in voice while communicating but still the Rxlevel seem to be good.
Figure (6) MS1 Rx Level Chart
Similar procedures were followed as in thecase of receive level to come up with the chart infigure 6 and clearly shows that the lower level 0,1 thecall samples read up to 42352 and continued todegrade with an increase of the level until level 6,7with 1122 and 7, max with 1243 sample calls. Compared
with the recommended KPIs by the MTN operators, itclearly shows that poor quality was signal receivedduring this time because it is considered good at 1,2and 2,3 respectively; as such optimization is requiredto ensure optimal performance of the cell sites.
CongestionCongestion according to Syski in [1] is
defined as the unavailability of network to thesubscriber at the time of making a call. It is thesituation when the blocking occurs and no free pathcan be provided for an offered call. That is, when a
subscriber cannot obtain a connection to the wantedsubscriber immediately. Figure 4.5 is the sample ofone out of six blocked calls experienced during thetest.
Fig. (7) Blocked Call2 experienced on cell 5360DC

ATBU, Journal of Science, Technology & Education (JOSTE); Vol. 4 (1), March, 2016 ISSN: 2277-0011
Surajo, A. M. Copyright © 2016 JOSTE. All Rights Reserved (www.atbuftejoste.com)
75
Table (4) Network Analysis Summary
Table (4) displays the Network analysis summary ofthe entire Drive Test and the resulting effect. Theresult shown by the DT has the following observedissues:
i) The CSSR of the first DT was 83.33%, whichis less than the acceptable KPI threshold of> 95%.ii) Handover success rate was less by 0.17% tothe minimal accepted KPI.iii) There were six blocked calls by differentcells (five on 900MHz band and only one is on1800MHz band). Four of the blocked calls arecaused by “absence of immediate assignment” andthe rest as a result of “non mobility managementconnection”.iv) Low Rx level was recorded as shown in table4.2.v) Rx quality is also very poor as recorded.
vi) There are no dropped calls throughout thecalls established.
Drive Test (Off Peak Period)The first DT was conducted during the peak
hour whereas the record track was conducted tomonitor the effect of congestion due to theunscheduled event. An attempt was also made toevaluate the network during off peak hour. Thiswas done in an effort to ascertain the level ofcongestion that may likely occurred during thishour. This was conducted on Wednesday 13th
February, 2013 by 11:27 am. TEMS investigation(9.0) software for data collection was used hence;Table 4.4 shows the result summary produced.
Table 4.4 TEMS 9.0 Result Summary
Events MTN (Dedicated Long Call Mode)
Call Initiation 32Call Attempt 30Call Setup success 25Drop Call Count 0Block Call Count 6Total Good Calls - /Call End 25Established Calls 25Total Handover Success 58Total Handover Failures 3Cell Reselection 5% Call Setup Success 83.33%% Blocked Calls 20.00%% Dropped Calls 0.00%% Established Calls 100.00%% Good Calls 100.00%% Handover Success 94.83%% Handover Failure 5.17%

ATBU, Journal of Science, Technology & Education (JOSTE); Vol. 4 (1), March, 2016 ISSN: 2277-0011
Surajo, A. M. Copyright © 2016 JOSTE. All Rights Reserved (www.atbuftejoste.com)
76
The network experienced three dropped call and onlyone handover failure was recorded. This goes to showthat the congestion level as compared to the peakhour is less.
Possible Coursesa) CSSR might be affected and degraded due to thefollowing issues:
i) Due to radio interface congestionii) Due to lack of radio resources allocation likeSDCCH.iii) Increase in radio traffic in inbound network.iv) Faulty BSS hardware.
b) Call Drop Rate might be as a result of the following:i) Priority call initiationii) Interference (either external or internal) beingobserved over air interface. Internal interferencecorresponds to in-band (900/1800MHz) whileexternal interference corresponds to otherwireless (usually military) networks.iii) Coverage limitationii) Hardware faults
c) TCH: Traffic Channel Congestion might be as aresult of the followings:i) Low TRX in the siteii) Increased the number of users beyond the
site pre-planned capacity.iii) TRX hardware faults.
d) Rx Level: low signal received level could arouseas a result of the followings:i) Low transmission power.ii) Hardware (Mechanical and/or Electrical
tilt orientation).e) Rx Quality: This can be as a result of the
following:i) Low receiving level.ii) Internal and/or external interference.iii) Assignment failure.iv) Hardware problem.
Tracked Traffic RecordAppendix A revealed that the first three Cells
(in Table 6, 7 and 8) are among the six Cells found inBTS0 with site name “NipostDutse”. While theremaining three (cells in Table 9, 10 and 11) are part ofthose attached to BTS1i.e. “Secretariat Road”. Thesesites where given preference due to their closenessto the scene of the event as such, they have higherprobability to traffic congestion effect.
The AnalysisThe success of RF optimisation of
operational cellular network is based on the findings,observations and improvement made to the entiresystem and then the result propagated to the enduser. [14] sees the followings as the most importantKPIs for GSM for radio network optimisation andbenchmarking as to achieve remarkable QoS:
a) CSSR (Call Setup Success Rate)b) CDR (Call Drop Rate)c) HSR (Handover Success Rate)
Event#[No.of]
Relationship
#Cell #Log
MissingNeighbourDetection,GSMSymmetry
4 - - 1
Call Attempt 27 - - 1
Call AttemptRetry
2 - - 1
Call Setup 27 - - 1
Dropped Call 3 - - 1
Handover 71 - - 1
HandoverFailure
1 - - 1
Routing AreaUpdate
2 - - 1

ATBU, Journal of Science, Technology & Education (JOSTE); Vol. 4 (1), March, 2016 ISSN: 2277-0011
Surajo, A. M. Copyright © 2016 JOSTE. All Rights Reserved (www.atbuftejoste.com)
77
d) TCH (Traffic Channel) Congestion Ratee) Rx Levelf) Rx Quality
All the key parametres responsible for traffic and theQos are therefore compared to the KPIs applicable toMTN operators as shown in figure (8) to (17).
Figure (8) Erlang (According to Site Plan)
Figure (8) shows the erlang of every cell andno deviation was recorded as it depend on the siteplan of their corresponding BTS as manifested in thechart above, thus no deviation was recorded.
Figure (9) Call Setup Success Rate
Observations:The corresponding CSSR in figure 4.7 of all the cellsare as follows:i) All the Call Setup Success Rate on cell 5361A are
very poor during the week days with Mondayhaving the least value of 51.4% less with more than40% of the acceptable KPI threshold.
ii) Cell 5360Dc record CSSR failure from Monday(81.31%) through Thursday with 6.55% less theKPI.
iii) Others maintained good quality as compared tothe target.
Figure (10) Percentage Control CongestionFrom figure 4.8 it can be seen that:i) 5361A experience the highest PCCong on Monday
31.98% which is incomparable with the accepted KPIof < 1%.
ii) Cell 5360DC recorded higher KPI acceptable valueon Monday, Tuesday and Wednesday of 2.94, 1.35and 1.14 respectively.
iii) All others are within the threshold.Figure (10) Percentage Congestion
Figure 4.9 shows that:i) The congestion level is poor on cell 5361A
throughout the week.ii) The poor record of congestion is recorded from
Monday through Thursday on cell 5360DC.iii) The remaining cells are within the KPIs threshold.

ATBU, Journal of Science, Technology & Education (JOSTE); Vol. 4 (1), March, 2016 ISSN: 2277-0011
Surajo, A. M. Copyright © 2016 JOSTE. All Rights Reserved (www.atbuftejoste.com)
78
Figure (11) Percentage Control Fail
Figure above shows that all the PCFail of all c arewithin the threshold of <5%.
Figure (12) Percentage Traffic Fail
Figure (12) shows that the percentage traffic fail iswithin the threshold <5%.
Figure (13) Percentage Setup Fail
From figure 4.12 the resulted observations are:
i) A Setup failure has higher percentage on cell5361A most especially from Monday to Thursday.
ii) Cell 5360DC also experienced high setup failureon Monday by 15.43% through Thursday.
iii) All other cells maintained the recommended KPIs.
Figure (14) Percentage Drop
Figure above shows how percentage drop was onlyexperienced above the KPI on cell 5361C mostespecially on Monday.
Figure (15) Percentage Bad ICM
Figure (15) shows that:

ATBU, Journal of Science, Technology & Education (JOSTE); Vol. 4 (1), March, 2016 ISSN: 2277-0011
Surajo, A. M. Copyright © 2016 JOSTE. All Rights Reserved (www.atbuftejoste.com)
79
i) 1.48 is the recorded value on Monday, cell 5361Awhich is more than 70 times the acceptable valueof < 2%
ii) All but few are beyond the recommended KPI value.iii) It can also be observed that the BADICM isfluctuating within the weeks.
Figure (16) Traffic Channel Availability
It was observed in Figure (16) that:i) The TCH availability was also very poor on cell
5361A with Monday & Tuesday having the leastrecorded value of 76.59% and 76.53% respectivelyand the remaining are all less than the minimal KPIs.
ii) TCH failure on cell 5360DC started form Mondayonward with a least recorded value of 84.57%.
ii) All other cells maintained the threshold.
Figure (17) SDCCH Estab. Succ. Rate
Figure (17) shows that:i) All the SDCCH record of cell 5361A (Secretarial
Road) is very poor as they are by far less than therecommended KPI rated value of > 98%.
ii) SDCCH record of Monday 5th Nov, 2012; of cell5360DC (NipostDutse) was 96.18% less by 1.82% tothe minimal threshold.
iii) Other cells have reasonable values compared tothe KPIs.
CONCLUSIONThis paper proposed a method to solving the
persistent congestion problems that usually arousedue to multiple reasons amongst which are the addedfeatures that are attached to data connectionservices like browsing and/or multimedia activities,unplanned public events etc.
Going by the research findings, it entails that thechannels that are significantly involved in call setupare at the same time played a vital role towardcongestion effect. They are Broadcast Control Channel(BCCH) and the Paging Channel (PCH) all part ofControl Channel (CCH). These channels communicate
with almost all the nodes of the operational GSMsystem during the paging process, thereby influencedby the performance of each of the node thus; pagingsuccess became the most complex among all otherKPIs. If the paging success rate is improved virtuallyalmost all other KPIs are improved.
Although the congestion analysis is not a newissue to MTN network in Nigeria, the contributedtoward investigating the real time effect of congestioncaused by un-planned public event using nonconventional approach in an area that cannot easilyexperience such effect under normal trafficconsidering the ratio of MTN facilities to the populationof settlers within the metropolis.
The limitation faced while conducting thisresearch work was the difficulty in identifying theactual numbers of subscribers that attempted a callover a period of time because of redial issue. Havingaccess to the GSM operator’s gadgets while datacollection without which the research may not be asuccess; is another deteriorating factor towardachieving the aim of the research.
RECOMMENDATIONSBelow are some of the recommended
improvement methodologies that when implementedmight either minimise the congestion problem oreliminate it entirely:a) There is need for improving/upgrading the existing
sites’ capacity of cells (such as TRX) to forestall theavalanches of listed problems.
b) Faulty hardware replacement (e.g. TRX) needs to bereplacedtoensureresource

ATBU, Journal of Science, Technology & Education (JOSTE); Vol. 4 (1), March, 2016 ISSN: 2277-0011
Surajo, A. M. Copyright © 2016 JOSTE. All Rights Reserved (www.atbuftejoste.com)
80
c) availability.d) There is need for employing National roaming
agreement between the GSM operators in Nigeria.e) Although they might have their own congestion
effect yet; there is need for a special considerationto emergency and/or priority calls to forestallhealth and security needs.
f) Employing dynamic half data rate (i.e. reducing datarate) might doubled the availability of resourcesthere by aiding congestion to minimal.
g) Radio resources enhancement (i.e. modification ofconcerned parametres) need to be implemented.
h) New site integration is also suggested in order toimprove indoor and outdoor coverage, which isusually termed as “Grid enhancement”.
i) There is need for additional Radio Frequencyrepeaters.
j) Physical optimisation techniques need to be made toan existing coverage optimisation.
k) Frequency hopping need to be incorporated (whereabsent) to minimise effect of interference.
l) In a nutshell there is need for deployment ofportable BTS (commonly called COW BTS) as abetter solution to improve congestion in case offoreseeable special events.
REFERENCES[1] Kuboye, B.M. (2010). Optimization models for
minimizing congestion in Global System forMobile Communications (GSM) in Nigeria.Journal Media and Communication Studiesvol. 2(5), pp. 122-126. Available online @www.academicjournals.org/jmcs. retrievedon 5th Aug, 2012.
[2] Mughele, E.S. et al (2012). Congestion ControlMechanisms and Patterns of Call Distributionin GSM Telecommunication Networks: TheCase of MTN Nigeria. African Journal ofComputing &ICTs.Vol. 4, No. 3. Issue 2 pp. 29-42. retrieved on 5th Aug, 2012.
[3] Juan, V.A., Peng, Z. &Raimo, K. (2006)Performance evaluation of GSM handover
traffic in a GPRS/GSM network. NetworkingLaboratory Helsinki University of TechnologyOtakiri.5A, Espoo, FIN 02015,Finland.http://ieeexplore.ieee.org/xpls/abs_all.jsp.
[4] Nilchil, D. (2003). Matlab Implementation ofGSM Traffic Channel. A Master’s Thesissubmitted to Department of ElectricalEngineering University of South Florida.
[5] Jahangir, H.S., Sepp, J.H., & Mika, R. (2000).Performance Analysis of GSM Traffic ChannelCapacity with(out) High Speed CircuitSwitched Data. IEEE Semi-annual VehicularTechnology conference (VTC 2000 Fall).Boston, USA. Pp. 1603-1609.
[6] Hugo, A., Jose, C. & Luis, M.C. (2002) Analysisof a Traffic Model for GSM/GPRS. Instituto deTelecommunicacoes/Instituto SuperiorTechnico, Technical University of Lisbon Av.RoviscoPais, 1049-001 Lisboa, Portugal.
[7] Adegoke, A.S. &Okpeki, U.K. (2010). Analysis ofGSM Traffic Performance.Pacific JournalScience and Technology Vol. 11, No.2.Available atwww.akamaiuniversity.us/PJST.htm.Retrieved Oct, 2012.
[8] Marwan, K., Alaa, M., & Sung-JU, L. (2003).Transmission Power Control in Wireless ADHoc Networks: Challenges, solutions andopen issues. National Science Foundation andCentre for Low Power Electronics (CLPE)University of Arizona.
[9] Ashwin, S., Kumar, P.S. &Holtzman, J.M.(2003). Power Control and ResourceManagement for a Multimedia CDMA WirelessSystem. WINLAB, Rutgers University, P.O. Box909 Piscataway, NJ 08855-0909.
[10] Josh, B. et al (1998). A PerformanceComparison of Multi-Hop Wireless Ad HocNetwork Routing Protocols. Fourth annualACM/IEEE International Conference on Mobile

ATBU, Journal of Science, Technology & Education (JOSTE); Vol. 4 (1), March, 2016 ISSN: 2277-0011
Surajo, A. M. Copyright © 2016 JOSTE. All Rights Reserved (www.atbuftejoste.com)
81
Computing and Networking (Mobi Com 98)Dallas, Texas, USA.
[11] Chien, H.C. &Siew, C.K. (2003).Characterizing Errors in Wireless LAN. AThesis report to the School of ComputerScience and Engineering University of NewSouth Wales Sydney, Ausralia.
[12] Vijay K. G. (2007) Wireless Communicationand Networking. 500 Sansomestreet, suite400, San Francisco, CA94111, first EditionMorgan Kaufman Publishers.
[13] Ericsson, (2002) GSM System Survey. AStudents hand book for Ericsson GSMSystems. EN/LZT 123 3321 R3B.
[14] Pavan Kumar V. S. (2002) Improvement ofKey Performance Indicacators and QoSEvaluation in Operational GSM Networks. Anonline journal @ www.ijera.com Vol. 1, Issue3, pp. 411-417. Retrieved on Feb, 2013.
[15] John S. (1995) Overview of the global Systemfor Mobile [email protected] retrievedAugust, 2012.
[16] Mishra A. R. (2004) Fundamentals of CellularNetwork Planning and Optimisation. John
Wiley & Sons Ltd. The Atrium Southern Gate,Chichester West Sussex PO198SQ England.

ATBU, Journal of Science, Technology & Education (JOSTE); Vol. 4 (1), March, 2016ISSN: 2277-0011
Surajo, A. M. Copyright © 2016 JOSTE. All Rights Reserved (www.atbuftejoste.com)
82
APPENDIXTable (6) Jigawa_NipostDutse_Cell 5360DC
Table (7) Jigawa_NipostDutse_Cell 5360DB
Table (8) Jigawa_NipostDutse_Cell 5360DC
Day (2012) Erlang CSSR PCCong PCong PCFail PSFail PTFail BADICM Pdrop SDCCH TCH
Fri_02Nov 1035.14 98.48 0 1.57 0.98 0.53 0.19 0.02 0.31 99.02 99.47
Sat_03Nov 966.84 98.48 0 1.1 1.13 0.38 0.26 0.02 0.28 98.87 99.62
Sun_04Nov 977.84 96.33 0.01 7.16 0.96 2.7 0.19 0.02 0.22 99.03 97.3
Mon_05Nov 1030.82 81.31 2.94 34.06 0.92 15.43 0.15 0.07 0.35 96.18 84.57
Tue_06Nov 1072.03 86.45 1.35 28.79 0.86 11.58 0.12 0.04 0.23 97.8 88.42
Wed_07Nov 1014.07 87.59 1.14 27.35 0.82 10.63 0.14 0.03 0.25 98.05 89.37
Thur_08Nov 931.91 88.45 0.4 29.13 0.81 10.44 0.1 0.03 0.29 98.79 89.56
Table (9) Jigawa_SecretariatRd_Cell 5361A
Day (2012) Erlang CSSR PCCong PCong PCFail PSFail PTFail BADICM Pdrop SDCCH TCH
Fri_02Nov 317.21 72.51 11.7 21.02 0.91 0.39 16.95 0.16 0.51 87.49 83.05
Sat_03Nov 302.38 85.57 3.52 12.35 0.89 0.39 10.36 0.01 0.73 95.62 89.64
Sun_04Nov 299.02 83.71 4.15 12.87 0.99 0.33 11.41 0.08 0.72 94.9 88.59
Mon_05Nov 325.12 51.4 31.98 28.3 1.05 1.46 23.41 1.48 1.71 67.31 76.59
Tue_06Nov 328.63 56.73 24.98 28.22 0.89 0.4 23.47 0.09 0.67 74.36 76.53
Wed_07Nov 314.31 64.19 17.79 25.77 0.81 0.35 21.06 0.06 0.53 81.54 78.94
Thur_08Nov 303.65 60.13 22.48 25.89 0.78 0.37 21.64 0.08 0.59 76.92 78.36
Day (2012) Erlang CSSR PCCong PCong PCFail PSFail PTFail BADICM Pdrop SDCCH TCH
Fri_02Nov 475.99 99.2 0 0 0.65 0.12 0.25 0.38 0.19 99.35 99.88
Sat_03Nov 425.6 99.18 0 0 0.65 0.14 0.57 0.56 0.03 99.35 99.86
Sun_04Nov 447.05 99.2 0 0 0.66 0.11 0.22 0.44 0 99.34 99.89
Mon_05Nov 581.24 99.2 0 0 0.66 0.13 0.29 0.4 0.01 99.34 99.87
Tue_06Nov 568.59 99.27 0 0 0.59 0.11 0.33 0.49 1.03 99.41 99.89
Wed_07Nov 531.82 99.36 0 0 0.51 0.11 0.22 0.39 0.01 99.49 99.89
Thur_08Nov 473.6 99.44 0.01 0 0.46 0.08 0.28 0.43 0.17 99.54 99.92
Day (2012) Erlang CSSR PCCong PCong PCFail PSFail PTFail BADICM Pdrop SDCCH TCH
Fri_02Nov 638.09 98.88 0 0.01 0.94 0.15 0.26 0.03 0.53 99.06 99.85
Sat_03Nov 599.12 99.02 0 0.03 0.79 0.15 0.41 0.03 0.48 99.21 99.85
Sun_04Nov 596.27 99.08 0 0.02 0.76 0.14 0.27 0.01 0.47 99.24 99.86
Mon_05Nov 668.79 99 0 0.14 0.75 0.22 0.24 0.38 0.46 99.25 99.78
Tue_06Nov 682.99 98.86 0 0.09 0.92 0.2 0.26 0 0.45 99.08 99.8
Wed_07Nov 678 98.94 0 0.19 0.77 0.25 0.28 0.01 0.48 99.23 99.75
Thur_08Nov 624.93 99.13 0 0.06 0.72 0.13 0.28 0 0.51 99.28 99.87

ATBU, Journal of Science, Technology & Education (JOSTE); Vol. 4 (1), March, 2016ISSN: 2277-0011
Surajo, A. M. Copyright © 2016 JOSTE. All Rights Reserved (www.atbuftejoste.com)
83
Table (10) Jigawa_SecretariatRd_Cell 5361B
Table (11) Jigawa_SecretariatRd_Cell 5361CDay (2012) Erlang CSSR PCCong PCong PCFail PSFail PTFail BADICM Pdrop SDCCH TCHFri_02Nov 107.38 93.61 0.02 0.01 2.02 1.41 2.36 0.4 4.24 97.96 97.64Sat_03Nov 90.65 93.36 0 0.01 2.38 1.26 1.92 0.57 4.33 97.62 98.08Sun_04Nov 100.26 94.7 0 0.08 1.43 1.03 1.98 0.72 3.37 98.57 98.02Mon_05Nov 145.76 93.86 0 0.76 2.05 2.01 2.11 0.95 5.99 97.95 97.89Tue_06Nov 150.53 92.3 0 0.15 3.11 1.57 2.12 1.15 5.08 96.89 97.88Wed_07Nov 114.21 94.55 0 0.03 1.73 0.96 1.65 0.71 4.35 98.27 98.35Thur_08Nov 114.52 95.22 0 0.08 1.45 1.01 1.85 0.6 3.64 98.55 98.15
Day (2012) Erlang CSSR PCCong PCong PCFail PSFail PTFail BADICM Pdrop SDCCH TCH
Fri_02Nov 143.24 97.9 0 0.15 1.14 0.73 1.08 0.04 1.37 98.86 99.27
Sat_03Nov 144.05 98.01 0 0.29 1.19 0.55 0.62 0.02 1.03 98.81 99.45
Sun_04Nov 147.22 98.25 0 0.27 0.98 0.63 0.72 0 0.86 99.02 99.37
Mon_05Nov 177.35 97.37 0 0.82 1.31 1.1 1.01 0.26 1.21 98.69 98.9
Tue_06Nov 190.56 96.38 0.02 0.59 2.05 1.18 1.1 0.01 1.2 97.93 98.82
Wed_07Nov 159.15 97.49 0 0.26 1.47 0.83 1.01 0.02 1.22 98.53 99.17
Thur_08Nov 169.34 97.44 0 0.33 1.51 0.79 0.99 0.01 1.32 98.49 99.21