performance and design of prototype … and design of prototype wood-plastic composite sections by...
TRANSCRIPT

PERFORMANCE AND DESIGN OF PROTOTYPE
WOOD-PLASTIC COMPOSITE SECTIONS
By
KEVIN JEROME HAIAR
A thesis submitted in partial fulfillment of the requirements for the degree of
MASTER OF SCIENCE IN CIVIL ENGINEERING
WASHINGTON STATE UNIVERSITY Department of Civil and Environmental Engineering
May 2000
1
CHAPTER 1
INTRODUCTION
1.1 Background and Overview
The benefits of wood as a structural material have long been utilized in marine
applications, including fender systems used to protect docking structures and vessels during
vessel berthing. In the past, preservative-treated timber has been a commonly used material for
structural elements in fender systems. Due to degradation from marine borers and the placement
of environmental restrictions on the use of preservative-treated wood, an alternative material is
sought to replace the wood members. The U.S. Office of Naval Research funded a project at
Washington State University to investigate the use of wood-plastic composite (WPC) lumber as
an alternative to the traditional timber members. The benefits of WPC lumber include resistance
to marine borers and rot, reduced environmental impact due to the absence of preservative
treatments, and members can be produced in hollow net sections. In addition, as manufacturing
processes and material composition are refined, reduced production costs will enable the WPC
material to become a viable option for many structural applications.
The information presented in this thesis is part of an ongoing comprehensive research
project being conducted at Washington State University to develop wood-based composite
members for waterfront structures. The project consists of four major components: materials
development, structural analysis and design, recycling, and a demonstration component for
validation of the technology and products.
The objectives of the structural design and analysis component are to support the
materials development by providing estimates for structural demand, identifying components of
existing waterfront facilities as targets for application of composite materials, establishing design

2
criteria, verifying through testing component performance, and facilitating the implementation of
both drop-in replacements and complete waterfront systems utilizing engineered wood-plastic
composites. The specific contributions to these objectives reported in this thesis include
conducting tests of prototype components to characterize performance, developing standard
criteria for component evaluation and assignment of design values, providing guidance for
design of specific demonstration applications, and developing analytical models for
understanding the behavior of WPC structural members.
In order to design with WPC material, strength properties must be quantified and the
material behavior must be understood. As the material contains considerable amounts of plastic
and is subject to heightened creep during loading, load rates for standard timber strength tests are
not appropriate. Standard tests for WPC material were proposed and used to determine material
strength properties for structural sections. The proposed test procedures are based primarily on
standard methods for determining strength properties in wood and plastic. Tests were conducted
on near full-size WPC specimens to determine compression perpendicular-to-extrusion,
compression parallel-to-extrusion, modulus of rupture, shear, puncture, and impact resistance
strengths for prototype wood-plastic composite members. Allowable design value assignment
procedures are proposed for WPC materials and were applied to the experimental results
obtained from the tests of near full-size WPC specimens to obtain allowable design values for
HDPE and PVC formulations. These allowable design values were used in the design of
prototype components for demonstration applications of this project.
A Fortran program (MPHIWPC) was developed to characterize behavior of WPC beam
sections. The program uses constitutive stress-strain relations for the WPC material to develop
moment-curvature data points as a function of flexural strain in a WPC section. The moment-
3
curvature data is then used to determine load-displacement behavior for two common test setups.
The program enabled an improved understanding of the behavior of WPC sections and will in
the future assist in the design of WPC flexural members by providing preliminary strength
estimates for proposed sections.
1.2 Objectives
The overall goal of the research presented in this thesis is to characterize the performance of
wood-plastic composites for use in fender system component design. The specific objectives
are:
1. to develop adequate test procedures for wood-plastic composite materials to determine
strength properties;
2. to characterize material behavior and determine strength values for use in design of
structural sections using the proposed test procedures;
3. to develop a method to analyze behavior to predict flexural strength for aid in the design
of wood-plastic composite members;
4. to determine allowable design values for use in designing WPC deckboards and prototype
fender system components for specific naval facilities applications; and
5. to analyze the decking and the support system at the Newport Naval Undersea Weapons
Center (NUWC) Pier 171 to provide information needed for a prototype deckboard
section design to replace current timber deckboards.

4
CHAPTER 2
TEST PROCEDURES FOR EVALUATING WOOD-PLASTIC
COMPOSITE MATERIALS
2.1 Abstract
Test procedures are developed for establishing performance criteria for prototype wood-
plastic components. These procedures are for testing near full-size composite sections and are
proposed as standard methods for determining strength properties of wood-plastic structural
members. The specific strength properties covered are modulus of rupture (MOR), compression
parallel-to-extrusion strength, compression perpendicular-to-extrusion strength, beam shear
strength, shear strength parallel and perpendicular to extrusion, shear strength by Iosipescu shear
fixture, puncture strength, and resistance to impact.
2.2 Introduction
This chapter presents proposed standard procedures for testing wood-plastic composite
(WPC) members and for characterizing strength properties for the material. The development of
test methods specific to the WPC material was necessary due to the nonlinear behavior and
heightened creep of wood-plastic during loading. Because the WPC formulations proposed for
prototype fender system components are wood based, and the sections are similar in size to
structural lumber, standard test methods and setups for determination of timber strength
properties were used as a basis for development of the test methods for WPC material. The most
significant modification to the standard timber tests was load rates, which must be increased to
avoid excessive creep during testing. The load rates for the proposed standard procedures were
based on load rates from standard test methods for determination of plastic strength properties.
5
The specific strength properties considered are modulus of rupture (MOR), compression
parallel-to-extrusion strength, compression perpendicular-to-extrusion strength, beam shear
strength, shear strength parallel and perpendicular to extrusion, shear strength by Iosipescu shear
fixture, puncture strength, and resistance to impact by a falling weight. These procedures were
developed for wood-plastic composites that contain less than or equal to 50 percent plastic by
weight and are therefore proposed only for materials of similar formulations.
2.3 Flexure
2.3.1 Scope
This test method covers the determination of modulus of rupture for structural beams
made of wood-plastic material. The method is applicable to beams of rectangular, round, or
irregular cross sections. Members may also be slightly cambered. For waterfront structures, this
test method may be applied for deckboards, wales and fender piles. These components may be
built-up from individual solid or hollow sections.
2.3.2 Summary of Test Method
The test specimen, which may be straight or curved and hollow or solid, is subjected to a
bending moment by supporting it near the ends, at locations called reactions, and applying
transverse loads symmetrically between the reactions. The test is displacement controlled and
load-displacement data is collected until rupture occurs.
The test method, apparatus, and procedure are in accordance with the ASTM D 198
(1997) flexure test. ASTM D 198 is a standard test method used to determine the properties of
structural-size lumber. Due to the behavior of plastics and the possibility of hollow sections, two
modifications are required.
6
For the first modification, the speed of testing must be increased to account for the
heightened creep of plastic material during loading. Load rates specified by ASTM D 790
(1997) are proposed for use in order to avoid this excessive creep during testing. ASTM D 790
is a standard test method for flexural properties of unreinforced and reinforced plastics. The
standard specifies the load rate be employed as a rate of straining in the outer fiber of 0.01
mm/mm/min (0.01 in./in./min).
For the second modification, the test span length should be determined from ratios of
length to radius of gyration, l/r, rather than length to depth, l/d, where l is the unsupported span
length, r is the least radius of gyration, and d is the depth of the beam. The reason for this
modification is to account for hollow sections and nonrectangular sections. In order to reduce
displacements due to shear, and thus collect data not influenced by shear deformations, the
length must be such that the shear span is relatively long. This is characterized by the l/d ratio
for solid rectangular beams, but must be characterized by the l/r ratio for hollow and
nonrectangular sections. The procedures for determining span length as functions of the radius
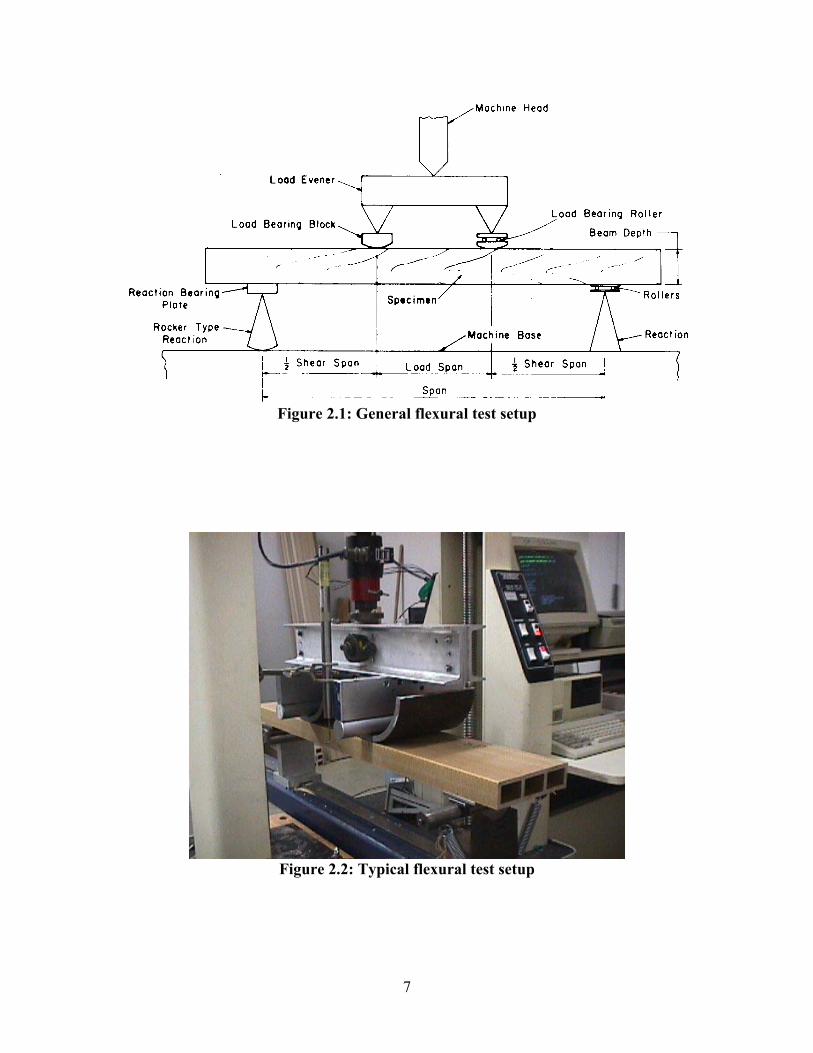
of gyration are presented in Appendix A. Figure 2.1 is a sketch of the flexural test setup for
four-point bending. Figure 2.2 shows a typical flexural test setup.
7
Figure 2.1: General flexural test setup
Figure 2.2: Typical flexural test setup

8
2.4 Compression Parallel to Extrusion (short column l/r <17)
2.4.1 Scope
This test method covers the determination of compression parallel-to-extrusion strength
of members made of wood plastic material. The method is applicable to members of rectangular,
round, or irregular cross sections. Test specimens are required to have length/radius of gyration
ratios (l/r), less than 17, where r is the least radius of gyration and l is the unsupported length.
For waterfront structures, this test method may be applied to chocks and piles. This component
may be built-up from individual solid or hollow sections.
2.4.2 Summary of Test Method
The test specimen is subjected to an axial force parallel to the direction of extrusion and
uniformly distributed over the contact surface. The test is displacement controlled and load-
displacement data is collected until failure occurs.
The test method, apparatus, and procedure are in accordance with the ASTM D 198
(1998) compression parallel-to-grain test. Due to the plastic content of the material, the speed of
testing must be increased to account for the heightened creep of plastic material during loading.
The compression specimens shall be loaded at a constant displacement rate specified by ASTM
D 695 (1998). ASTM D 695 is a standard test method for compressive properties of rigid
plastics. The ASTM D 695 load rates are prescribed as 1.3 ± 0.3 mm/min (0.050 ± 0.010
in./min) rate of motion for the crosshead or grips of the machine. Minimum cross-section size
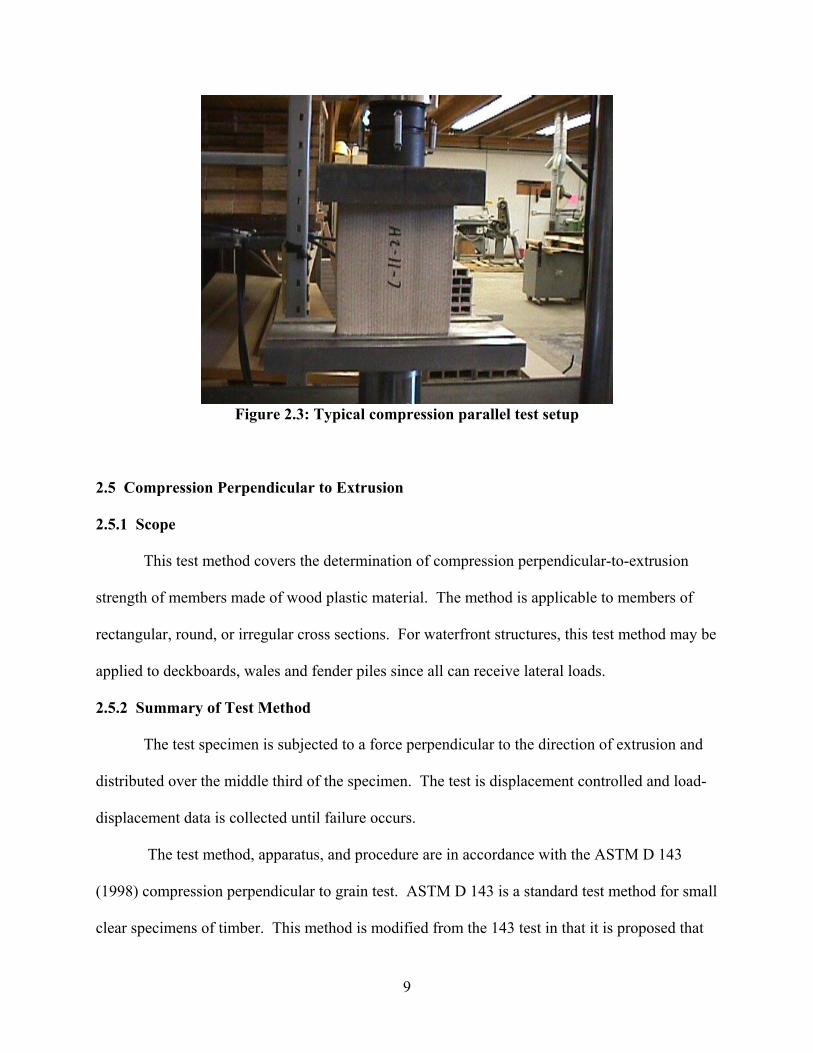
shall be 1.0 in. by 1.0 in. Figure 2.3 shows a typical compression parallel-to-extrusion test setup.
9
Figure 2.3: Typical compression parallel test setup
2.5 Compression Perpendicular to Extrusion
2.5.1 Scope
This test method covers the determination of compression perpendicular-to-extrusion
strength of members made of wood plastic material. The method is applicable to members of
rectangular, round, or irregular cross sections. For waterfront structures, this test method may be
applied to deckboards, wales and fender piles since all can receive lateral loads.
2.5.2 Summary of Test Method
The test specimen is subjected to a force perpendicular to the direction of extrusion and
distributed over the middle third of the specimen. The test is displacement controlled and load-
displacement data is collected until failure occurs.
The test method, apparatus, and procedure are in accordance with the ASTM D 143
(1998) compression perpendicular to grain test. ASTM D 143 is a standard test method for small
clear specimens of timber. This method is modified from the 143 test in that it is proposed that
10
any size specimen may be tested provided that the middle third of the specimen is loaded in
compression. Due to the plastic content of the material the speed of testing must be increased to
account for the heightened creep of plastic material during loading. The compression specimens
shall be loaded at a constant displacement rate specified by ASTM D 695 (1998). ASTM D 695
is a standard test method for compressive properties of rigid plastics. The ASTM D 695 load
rates are prescribed as 1.3 ± 0.3 mm/min (0.050 ± 0.010 in./min) rate of motion for the crosshead
or grips of the machine. Load shall be applied normal to the direction of extrusion through a
metal bearing plate. The metal bearing plate must be equal to one-third the length of the
specimen and shall be placed at right angles to the length. The radius of curvature of the plate
edges shall be 2 ± 0.5 mm (0.08 ± 0.02 in.). This is to relieve stress concentration at the edge of
the plate in the material and to prevent the plate from cutting into the material causing untimely
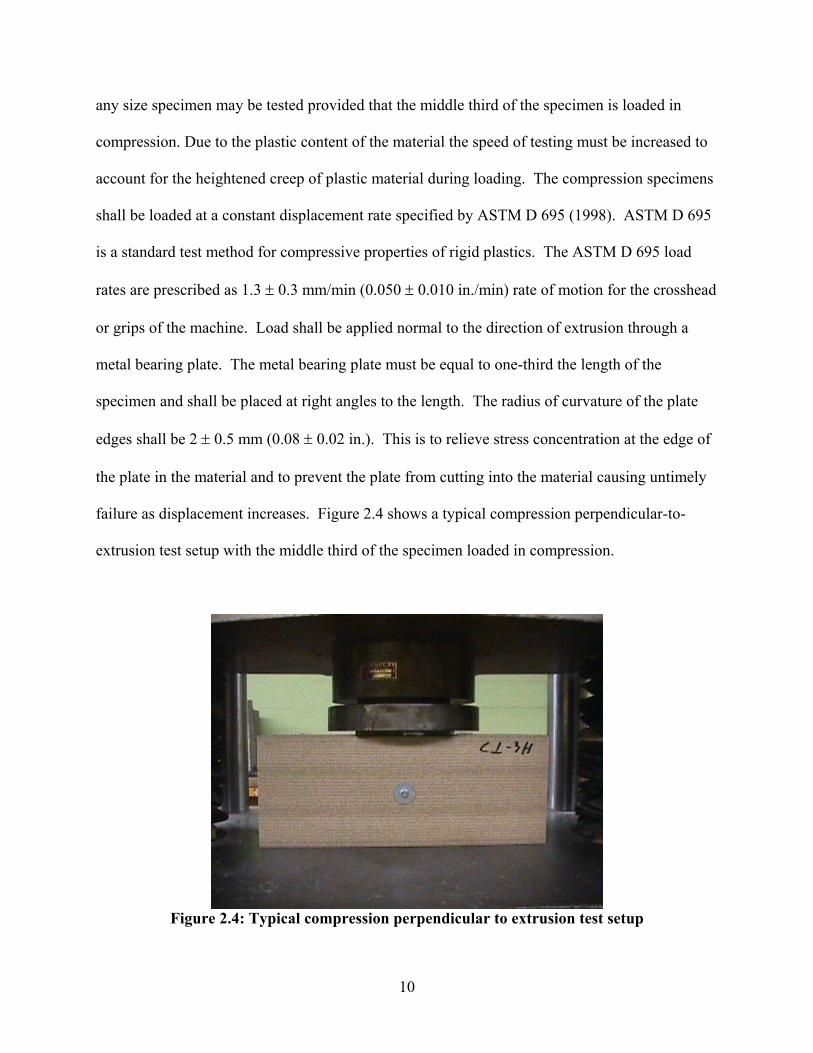
failure as displacement increases. Figure 2.4 shows a typical compression perpendicular-to-
extrusion test setup with the middle third of the specimen loaded in compression.
Figure 2.4: Typical compression perpendicular to extrusion test setup
11
2.6 Shear
Methods are presented for determining shear strength of WPC materials. The beam shear
method is useful because beam shear is generally the most common form of shear loading, and
many components of fender systems are subject to beam shear under flexural loading. Because a
shear failure cannot always be obtained under flexural loading, shear parallel and perpendicular
to extrusion tests and an Iosipescu shear test may be used to determine shear strengths.
2.6.1 Beam Shear
2.6.1.1 Scope
This test method covers the determination of bending shear strength for members made
of wood-plastic material. The method is specific to the application of beams and defines the
shear strength of a member when loaded normal to the longitudinal axis of the beam. The
method is applicable to members of rectangular, round, or irregular cross sections. For
waterfront structures, this test method may be applied to deckboards, wales and fender piles.
2.6.1.2 Summary of Test Method
The test specimen is subjected to 5-point bending to induce a shear failure in the beam.
The member shall be supported at the ends and at the center while load points are to be located at
the quarter points. The test is displacement controlled and load-displacement data is collected
until failure occurs.
The test method, apparatus, and procedure are in accordance with the five-point bending
test setup developed by the Forest Products Laboratory (Rammer and Soltis 1994). The test uses
a five-point flexural loading to investigate shear failures in wood beams. Figure 2.5 shows a
sketch of the general test setup. Figure 2.6 shows a typical test setup for the five-point bending
shear test. The method is adapted for wood-plastic test specimens by loading pieces in the same

12
configuration with load rates specified by ASTM D 790 (1998) for flexural tests on plastic
materials. ASTM D 790 prescribes a constant rate of strain in the outer fiber of 0.01 in./in./min
(0.01 in./in./min).
Each span shall have a length of 5d, with an overall effective beam length of 10d, where
d is the actual depth of the specimen. An alternate method for determining span length may be
used when approximate shear and bending strength values are available. This method is
presented in Appendix B. The alternate method allows for a more accurate determination of a
span that will produce a shear failure. This method is preferred when the shear strength to
bending strength ratio is relatively high compared to typical ratios for wood. With higher shear
strengths a shear failure can be difficult, or even impossible, to achieve under flexural loading.
The loading and middle support plate lengths from Figure 5, b1 and b2, respectively, shall
be determined based on the perpendicular-to-extrusion compressive strength of the material so as
to minimize the amount of local crushing in the material near the supports and loading points.
Figure 2.5: General setup for five-point beam shear test

13
Figure 2.6: Typical five-point bending shear test setup
2.6.2 Shear Parallel to Extrusion and Shear Perpendicular to Extrusion
2.6.2.1 Scope
This test method covers the determination of shear strength parallel or perpendicular to
extrusion for members made of wood plastic material. For determining shear strength parallel to
extrusion, load shall be applied to produce shear failure along a plane parallel to the longitudinal
axis of the member. For determining shear strength perpendicular to extrusion, load shall be
applied to produce failure along a plane perpendicular to the longitudinal axis of the member.
For waterfront structures, this test method may be applied to deckboards, wales and fender piles.
14
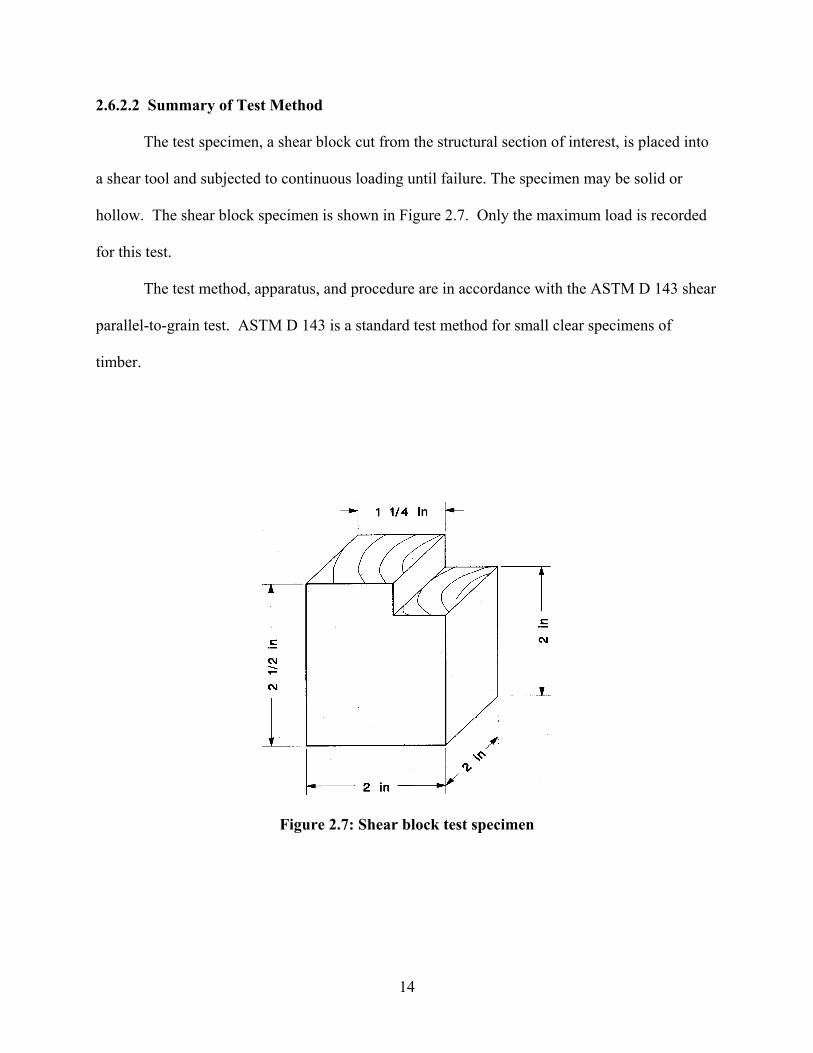
2.6.2.2 Summary of Test Method
The test specimen, a shear block cut from the structural section of interest, is placed into
a shear tool and subjected to continuous loading until failure. The specimen may be solid or
hollow. The shear block specimen is shown in Figure 2.7. Only the maximum load is recorded
for this test.
The test method, apparatus, and procedure are in accordance with the ASTM D 143 shear
parallel-to-grain test. ASTM D 143 is a standard test method for small clear specimens of
timber.
Figure 2.7: Shear block test specimen
15
2.6.3 Iosipescu Shear Test (ASTM D 5379)
2.6.3.1 Scope
This test method covers the determination of shear strength for materials made of wood
plastic material. This method uses an Iosipescu shear fixture to test small specimens in single
shear. For waterfront structures, this test method may be applied to deckboards, wales and
fender piles.
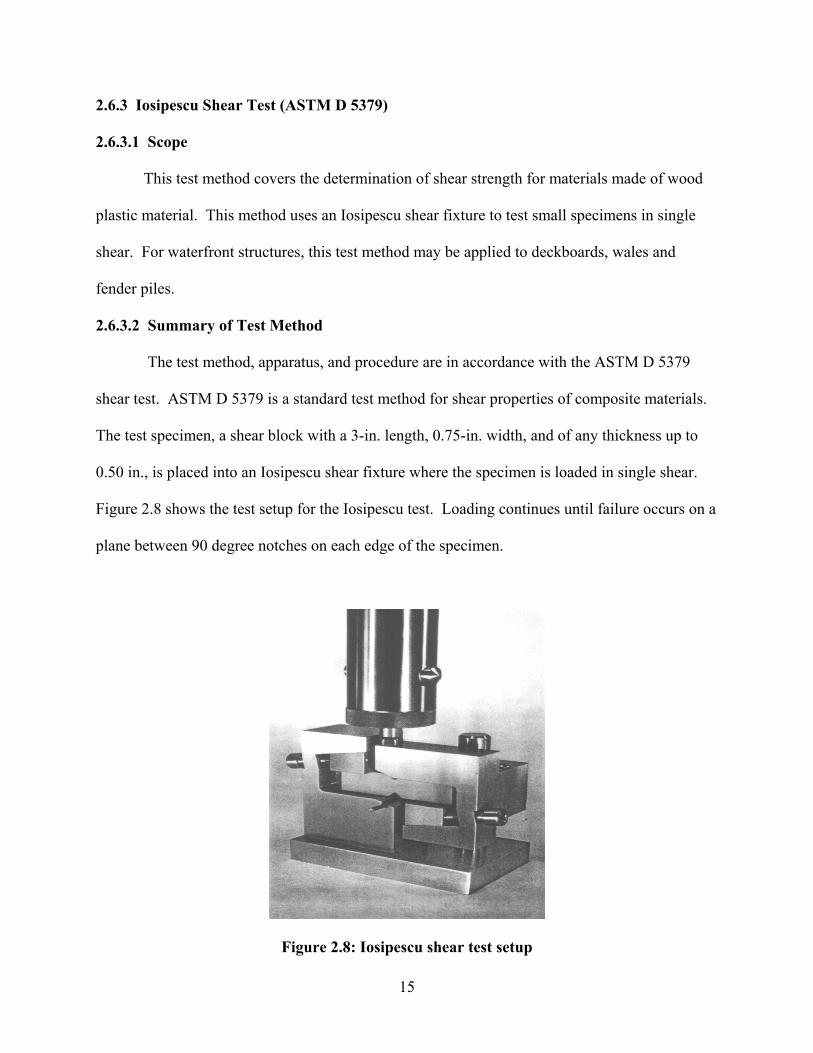
2.6.3.2 Summary of Test Method
The test method, apparatus, and procedure are in accordance with the ASTM D 5379
shear test. ASTM D 5379 is a standard test method for shear properties of composite materials.
The test specimen, a shear block with a 3-in. length, 0.75-in. width, and of any thickness up to
0.50 in., is placed into an Iosipescu shear fixture where the specimen is loaded in single shear.
Figure 2.8 shows the test setup for the Iosipescu test. Loading continues until failure occurs on a
plane between 90 degree notches on each edge of the specimen.
Figure 2.8: Iosipescu shear test setup
16
2.6.4 Shear Summary
Because a shear failure can be difficult to obtain in some cross-sections, namely solid
cross-sections, using the beam shear method, the D 143 shear parallel and perpendicular to grain
test or the D 5379 Iosipescu shear test may be applied considering application for the material.
Recent research at Washington State University on wood-plastic composites has shown that the
D 143 test method produces shear strengths that are lower than those obtained by the D 5379 test
method.
2.7 Puncture
2.7.1 Scope
This test method covers the determination of puncture strength for members made of
wood plastic material. The method is applicable for test pieces in the form of sheets or molded
disks with thickness 0.127 to 12.7 mm (0.050 to 0.500 in.). For waterfront structures, this test
method may be applicable to deckboards, chocks, wales and fender piles.
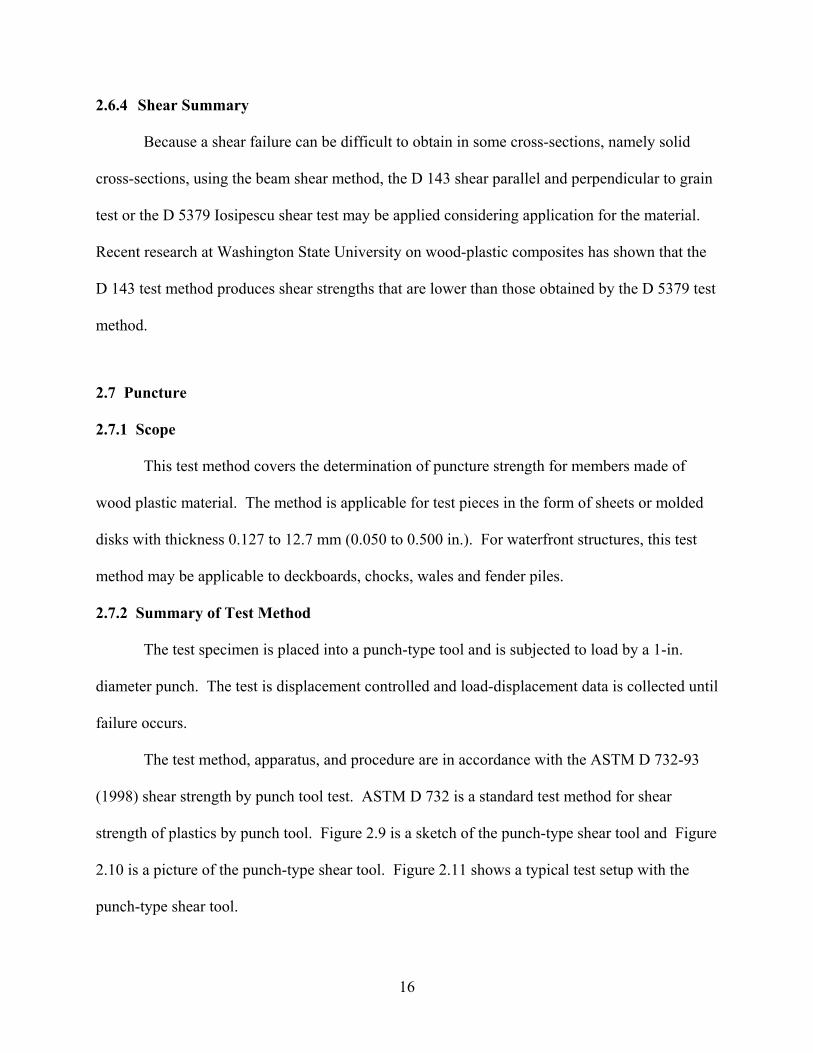
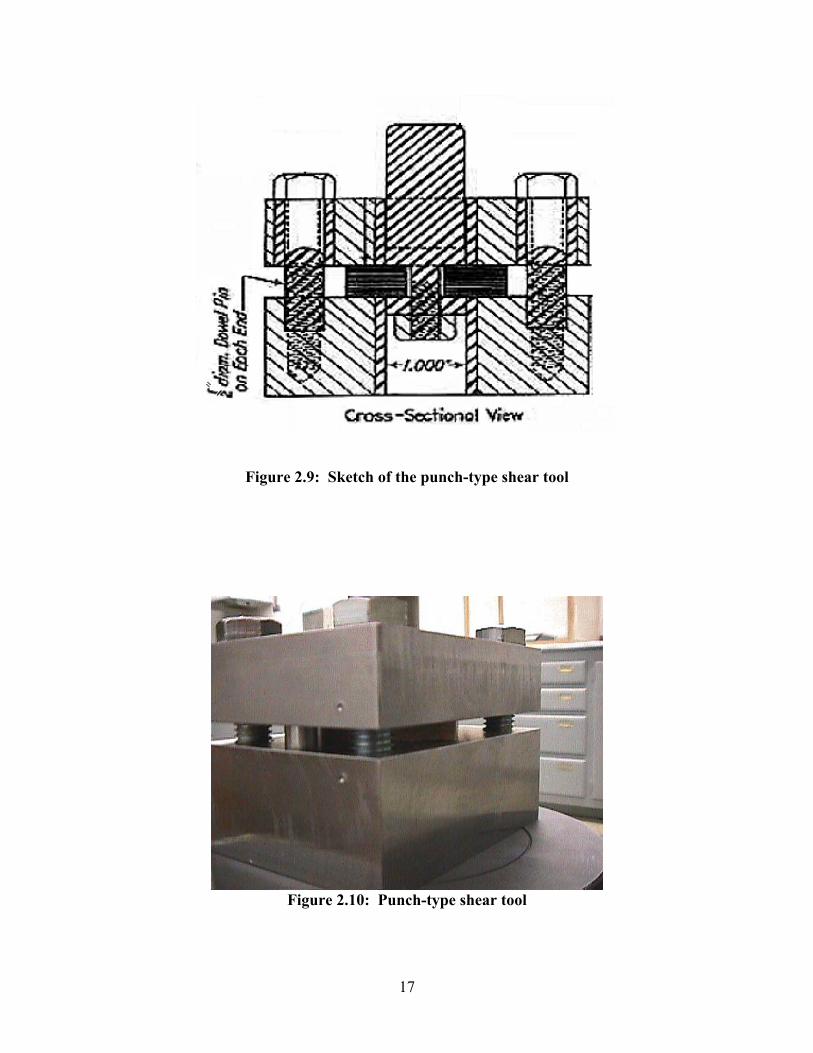
2.7.2 Summary of Test Method
The test specimen is placed into a punch-type tool and is subjected to load by a 1-in.
diameter punch. The test is displacement controlled and load-displacement data is collected until
failure occurs.
The test method, apparatus, and procedure are in accordance with the ASTM D 732-93
(1998) shear strength by punch tool test. ASTM D 732 is a standard test method for shear
strength of plastics by punch tool. Figure 2.9 is a sketch of the punch-type shear tool and Figure
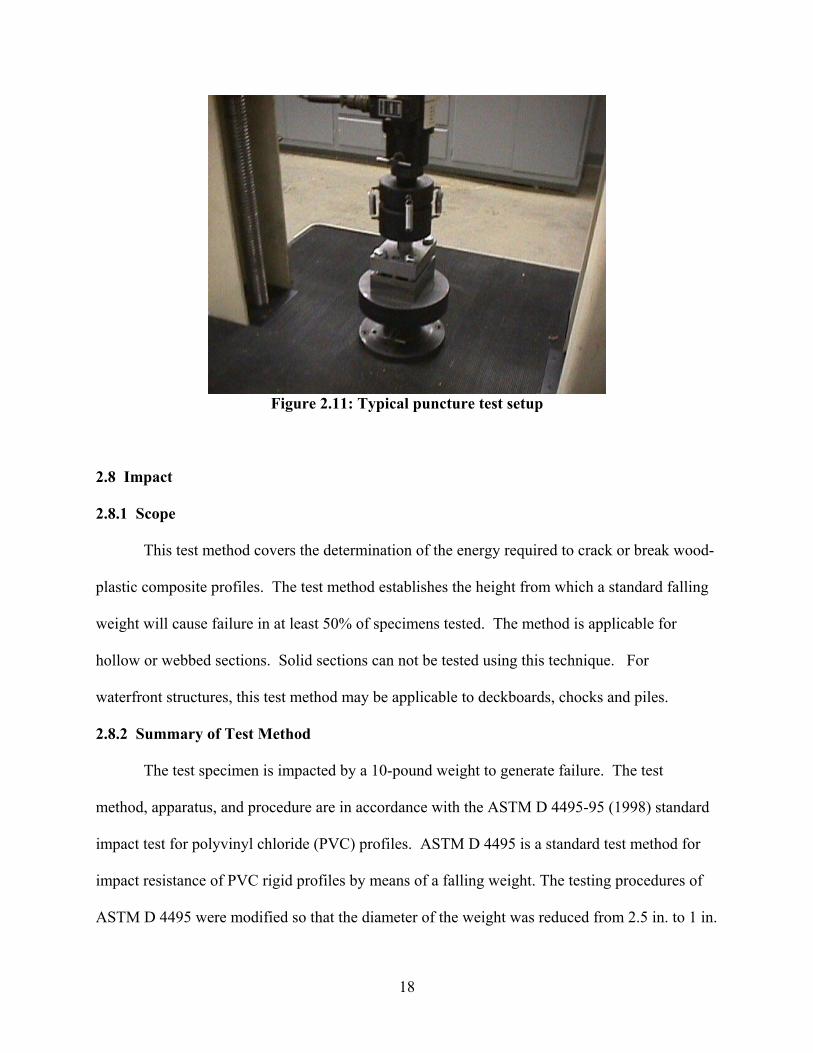
2.10 is a picture of the punch-type shear tool. Figure 2.11 shows a typical test setup with the
punch-type shear tool.
17
Figure 2.9: Sketch of the punch-type shear tool
Figure 2.10: Punch-type shear tool
18
Figure 2.11: Typical puncture test setup
2.8 Impact
2.8.1 Scope
This test method covers the determination of the energy required to crack or break wood-
plastic composite profiles. The test method establishes the height from which a standard falling
weight will cause failure in at least 50% of specimens tested. The method is applicable for
hollow or webbed sections. Solid sections can not be tested using this technique. For
waterfront structures, this test method may be applicable to deckboards, chocks and piles.
2.8.2 Summary of Test Method
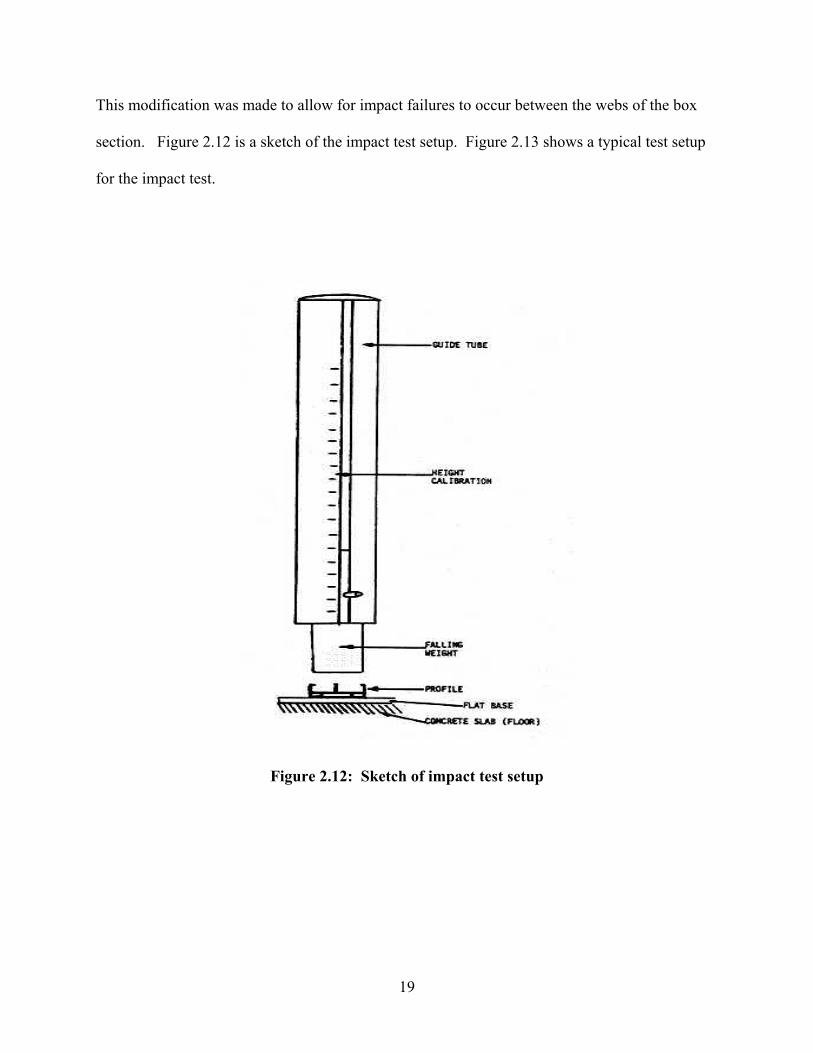
The test specimen is impacted by a 10-pound weight to generate failure. The test
method, apparatus, and procedure are in accordance with the ASTM D 4495-95 (1998) standard
impact test for polyvinyl chloride (PVC) profiles. ASTM D 4495 is a standard test method for
impact resistance of PVC rigid profiles by means of a falling weight. The testing procedures of
ASTM D 4495 were modified so that the diameter of the weight was reduced from 2.5 in. to 1 in.
19
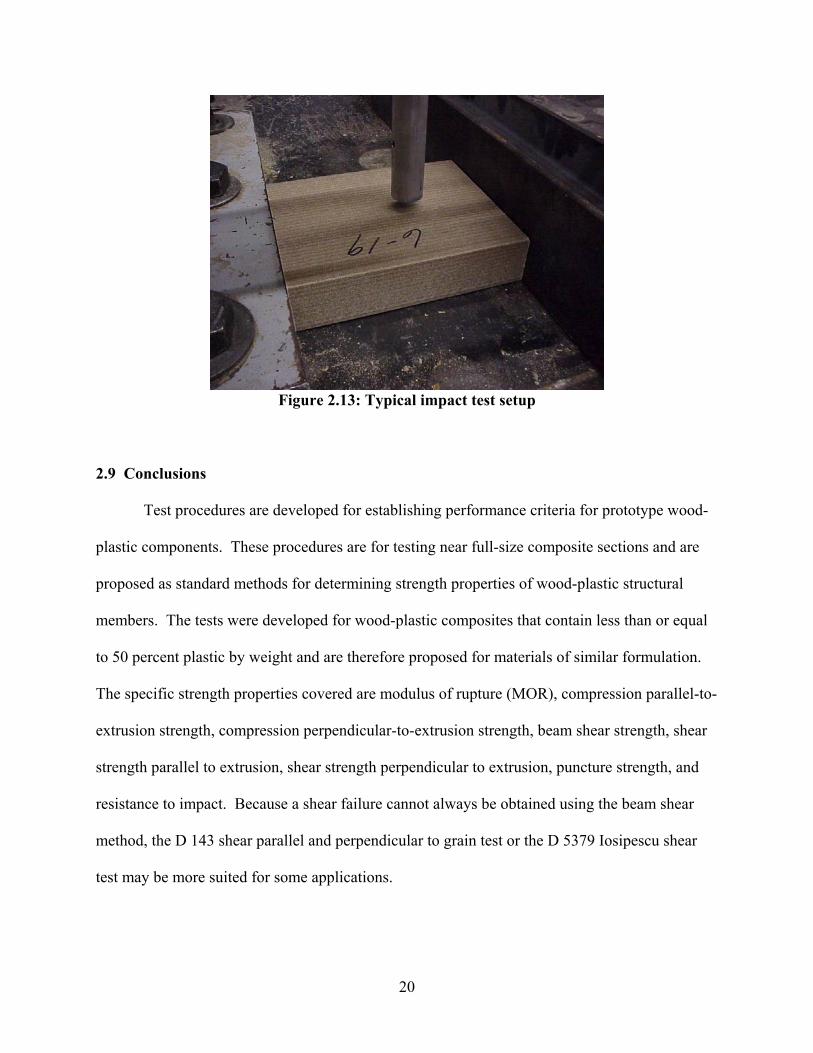
This modification was made to allow for impact failures to occur between the webs of the box
section. Figure 2.12 is a sketch of the impact test setup. Figure 2.13 shows a typical test setup
for the impact test.
Figure 2.12: Sketch of impact test setup
20
Figure 2.13: Typical impact test setup
2.9 Conclusions
Test procedures are developed for establishing performance criteria for prototype wood-
plastic components. These procedures are for testing near full-size composite sections and are
proposed as standard methods for determining strength properties of wood-plastic structural
members. The tests were developed for wood-plastic composites that contain less than or equal
to 50 percent plastic by weight and are therefore proposed for materials of similar formulation.
The specific strength properties covered are modulus of rupture (MOR), compression parallel-to-
extrusion strength, compression perpendicular-to-extrusion strength, beam shear strength, shear
strength parallel to extrusion, shear strength perpendicular to extrusion, puncture strength, and
resistance to impact. Because a shear failure cannot always be obtained using the beam shear
method, the D 143 shear parallel and perpendicular to grain test or the D 5379 Iosipescu shear
test may be more suited for some applications.
21
CHAPTER 3
TEST RESULTS OF WOOD-PLASTIC COMPOSITE COMPONENTS
3.1 Abstract
This chapter presents the results from a series of experimental tests conducted on wood-
plastic composite (WPC) specimens to characterize material behavior and strength values. Tests
were conducted on near full-size sections representative of prototype components for use in
fendering systems. The specimens included both polyvinyl chloride (PVC) and high-density
polyethylene (HDPE) formulations. Compression, bending, shear, puncture and impact strengths
were determined. The test results indicate that specimens formulated using the PVC formulation
are stronger and stiffer than specimens using HDPE formulation. However, the PVC specimens
displayed more brittle behavior during the tests than did the HDPE specimens. The resulting
strength values were used in the design of components for application in specific demonstration
projects.
3.2 Introduction
Tests were conducted on near full-size WPC sections to determine compression
perpendicular-to-extrusion, compression parallel-to-extrusion, modulus of rupture, shear,
puncture, and impact resistance strengths of prototype structural elements. The specimens were
selected to be representative of the components expected to be used in fendering systems. Two
WPC formulations were evaluated: an HDPE formulation consisting of approximately 70%
wood and 30% HDPE, and a PVC formulation consisting of 50% wood and 50% PVC.
22
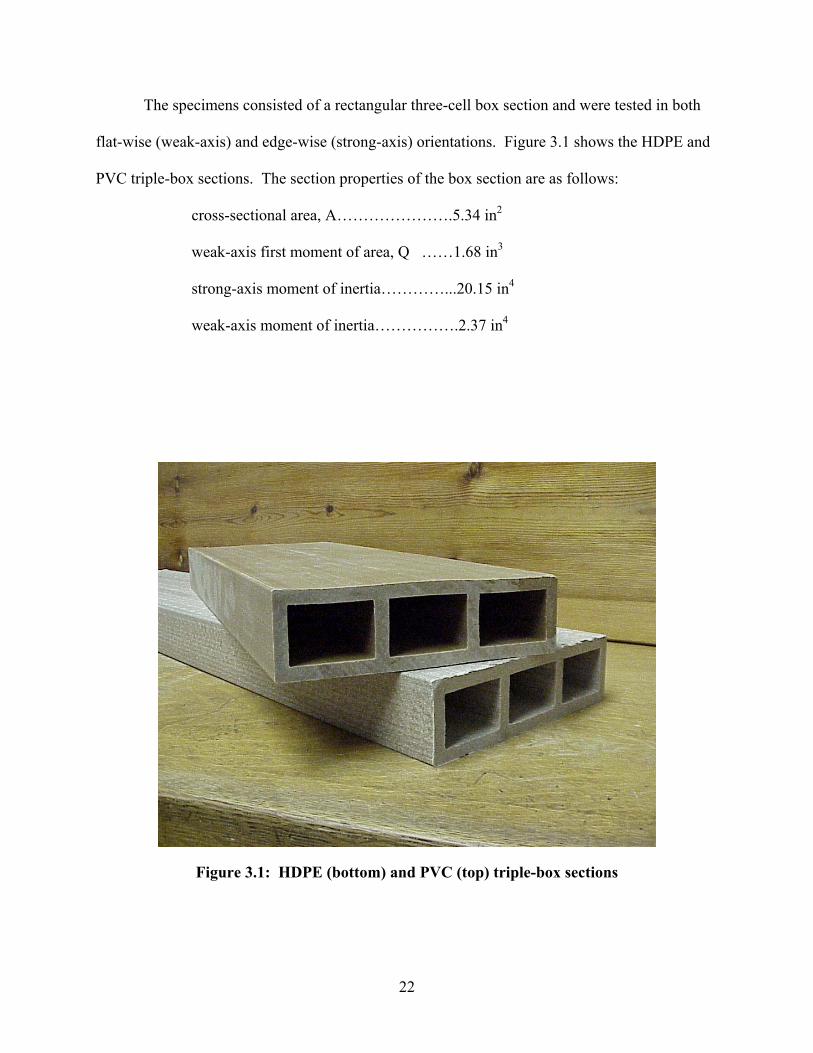
The specimens consisted of a rectangular three-cell box section and were tested in both
flat-wise (weak-axis) and edge-wise (strong-axis) orientations. Figure 3.1 shows the HDPE and
PVC triple-box sections. The section properties of the box section are as follows:
cross-sectional area, A………………….5.34 in2
weak-axis first moment of area, Q ……1.68 in3
strong-axis moment of inertia…………...20.15 in4
weak-axis moment of inertia…………….2.37 in4
Figure 3.1: HDPE (bottom) and PVC (top) triple-box sections
23
3.3 Compression Parallel-to-Extrusion Tests
3.3.1 Test Procedures
Five specimens of both HDPE and PVC were tested to determine compression
perpendicular-to-extrusion strength by means of ASTM D 198 (1997). ASTM D 198 is a
standard test method for determining the strength properties of lumber. One spherical bearing
block is used to ensure uniform loading along the vertical axis. The specimens were loaded at a
constant displacement rate of 0.05 in./min as specified by ASTM D 695 (1996). ASTM D 695 is
a standard test method for compressive properties of rigid plastics. Research conducted
previously on wood-based composite materials at the Wood Materials and Engineering
Laboratory (WMEL) has indicated that loading rates for plastic materials are more appropriate
than load rates specified for wood due to the increased creep rates associated with plastic
materials. The specimen dimensions were 6.5 in. x 1.8 in. x 8 in.
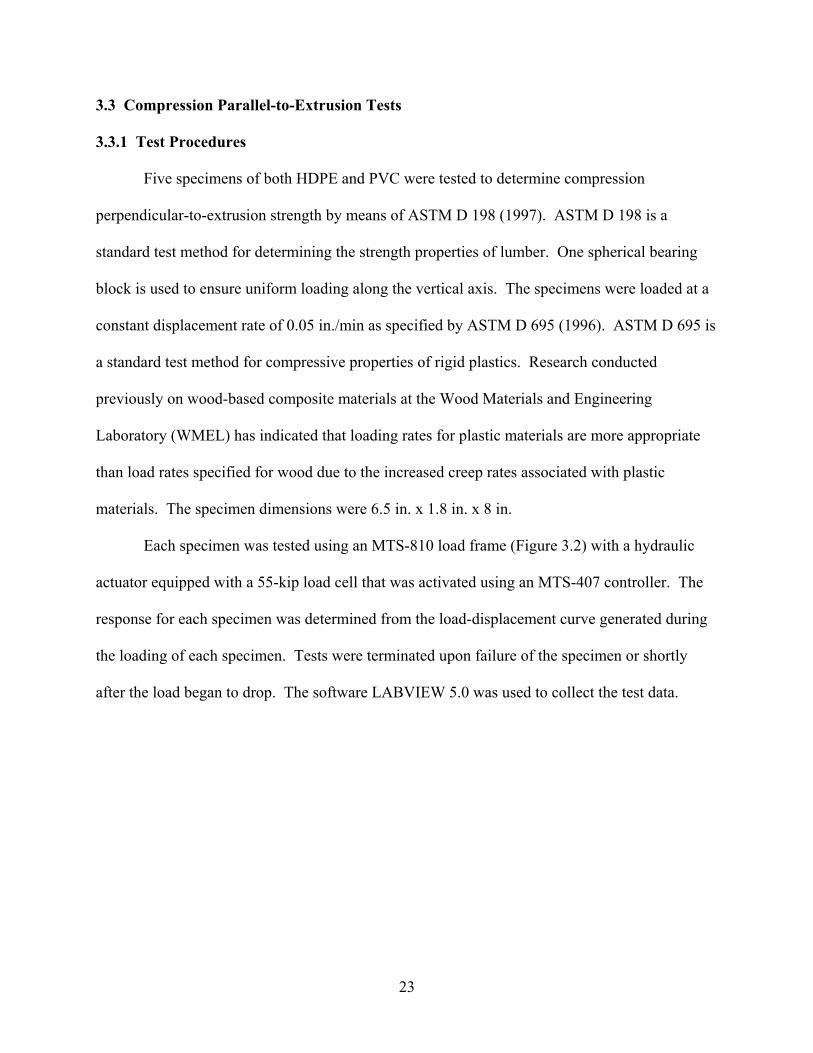
Each specimen was tested using an MTS-810 load frame (Figure 3.2) with a hydraulic
actuator equipped with a 55-kip load cell that was activated using an MTS-407 controller. The
response for each specimen was determined from the load-displacement curve generated during
the loading of each specimen. Tests were terminated upon failure of the specimen or shortly
after the load began to drop. The software LABVIEW 5.0 was used to collect the test data.
24
Figure 3.2: Compression parallel test setup
3.3.2 Discussion of Results
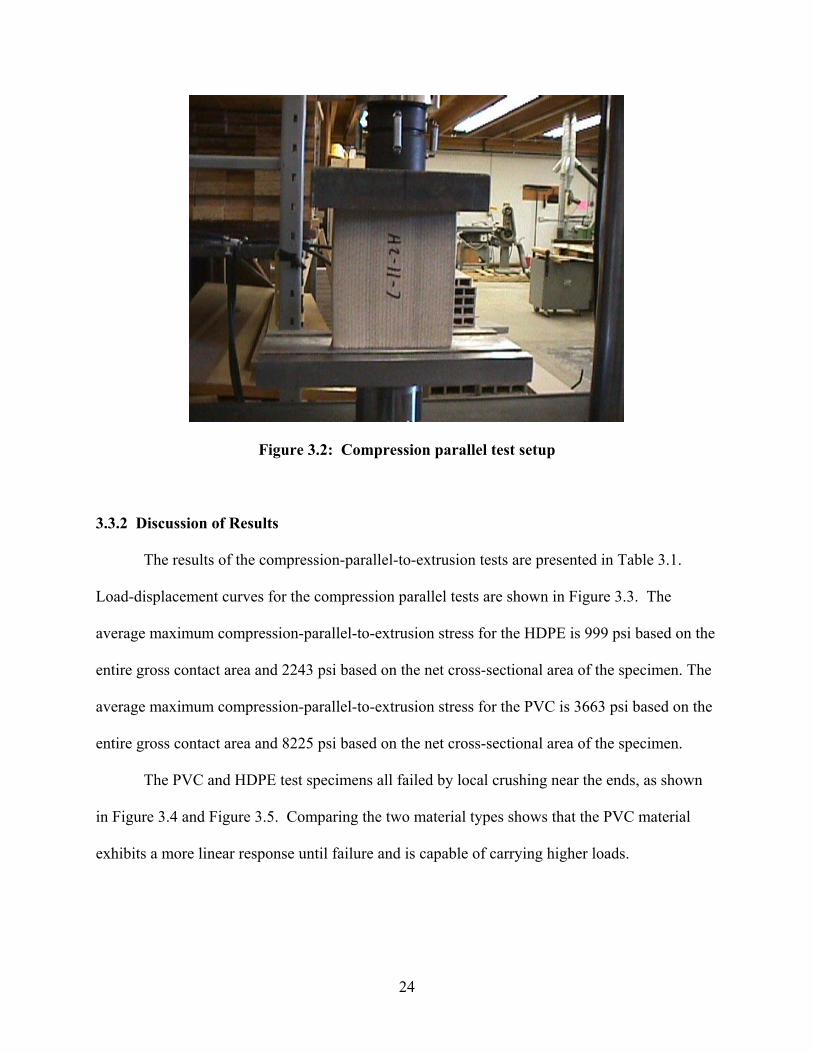
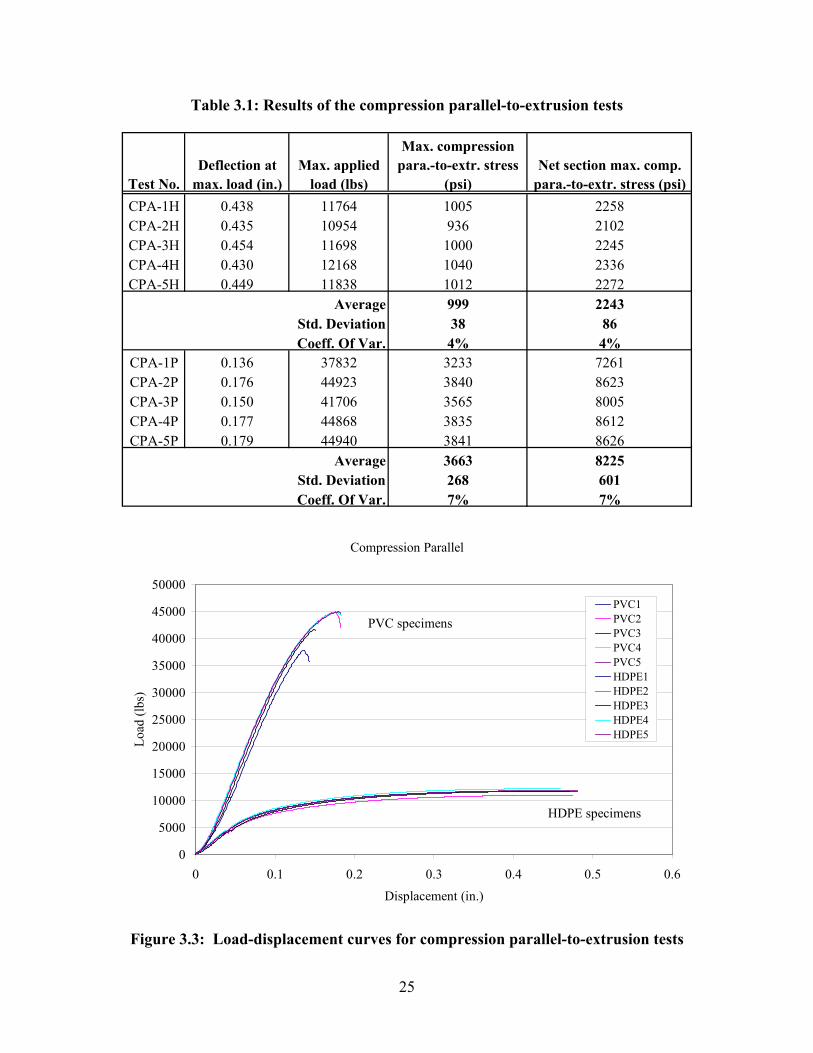
The results of the compression-parallel-to-extrusion tests are presented in Table 3.1.
Load-displacement curves for the compression parallel tests are shown in Figure 3.3. The
average maximum compression-parallel-to-extrusion stress for the HDPE is 999 psi based on the
entire gross contact area and 2243 psi based on the net cross-sectional area of the specimen. The
average maximum compression-parallel-to-extrusion stress for the PVC is 3663 psi based on the
entire gross contact area and 8225 psi based on the net cross-sectional area of the specimen.
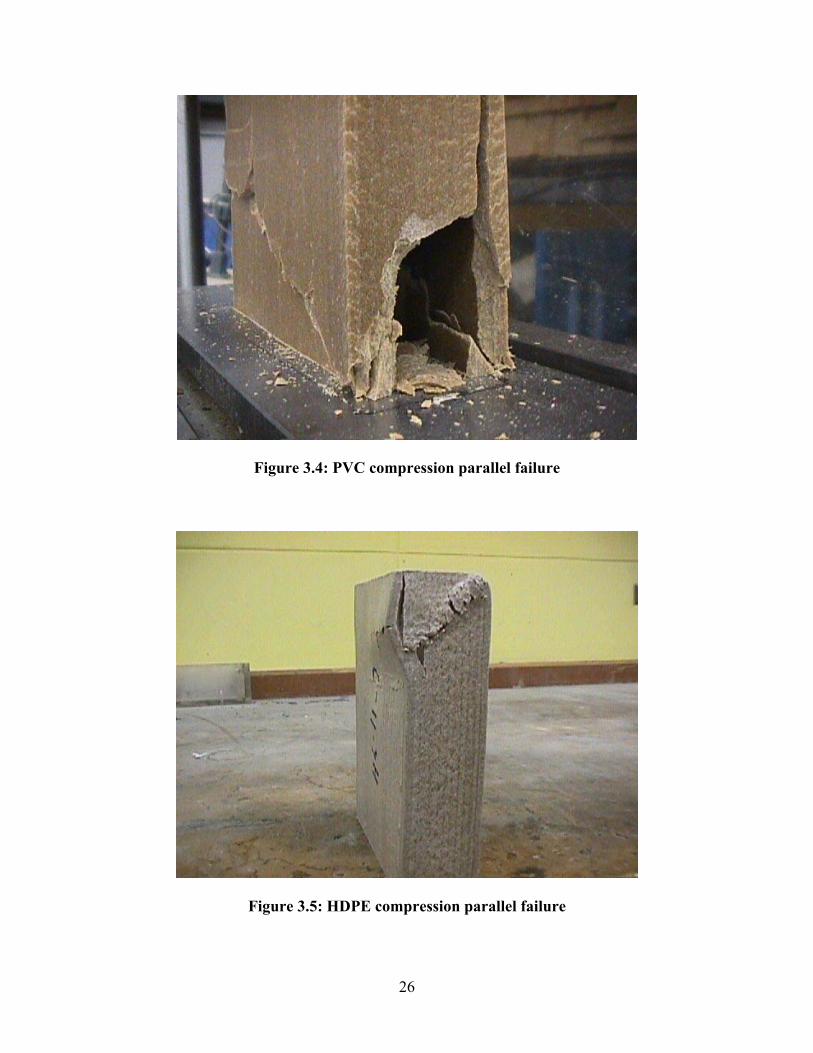
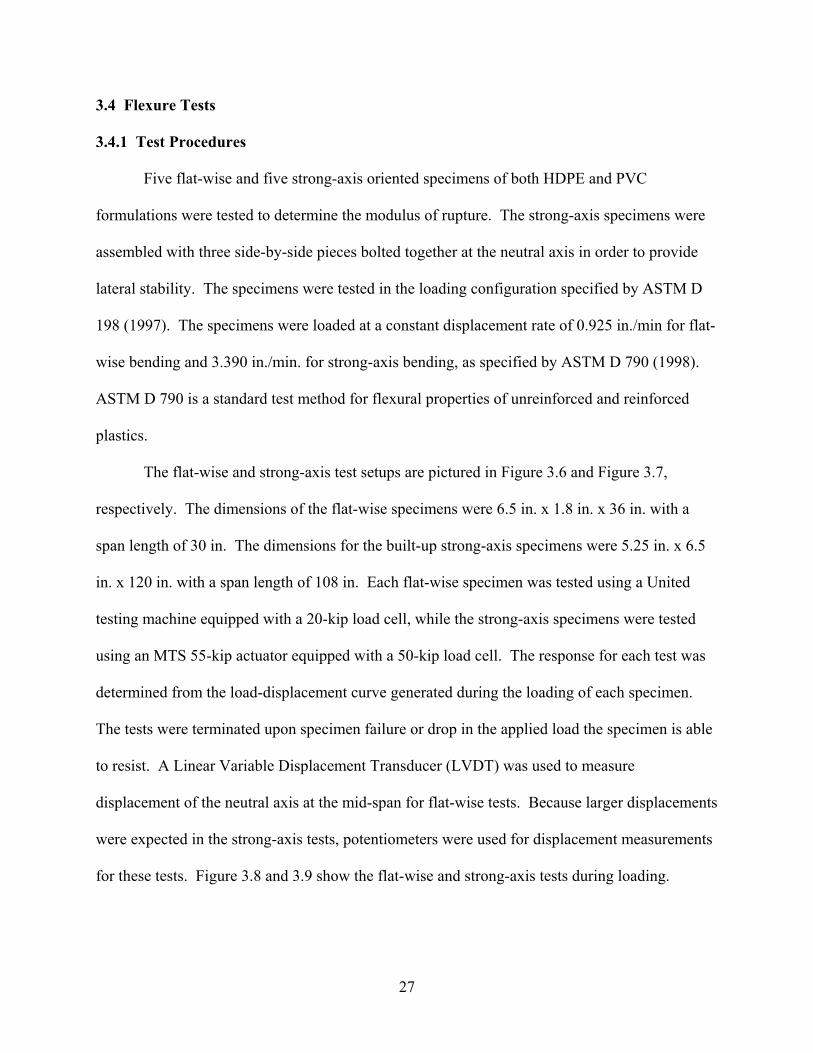
The PVC and HDPE test specimens all failed by local crushing near the ends, as shown
in Figure 3.4 and Figure 3.5. Comparing the two material types shows that the PVC material
exhibits a more linear response until failure and is capable of carrying higher loads.
25
Table 3.1: Results of the compression parallel-to-extrusion tests
Test No.Deflection at
max. load (in.)Max. applied
load (lbs)
Max. compression para.-to-extr. stress
(psi)Net section max. comp.
para.-to-extr. stress (psi)CPA-1H 0.438 11764 1005 2258CPA-2H 0.435 10954 936 2102CPA-3H 0.454 11698 1000 2245CPA-4H 0.430 12168 1040 2336CPA-5H 0.449 11838 1012 2272
Average 999 2243Std. Deviation 38 86Coeff. Of Var. 4% 4%
CPA-1P 0.136 37832 3233 7261CPA-2P 0.176 44923 3840 8623CPA-3P 0.150 41706 3565 8005CPA-4P 0.177 44868 3835 8612CPA-5P 0.179 44940 3841 8626
Average 3663 8225Std. Deviation 268 601Coeff. Of Var. 7% 7%
Compression Parallel
0
5000
10000
15000
20000
25000
30000
35000
40000
45000
50000
0 0.1 0.2 0.3 0.4 0.5 0.6
Displacement (in.)
Load
(lbs
)
PVC1PVC2PVC3PVC4PVC5HDPE1HDPE2HDPE3HDPE4HDPE5
PVC specimens
HDPE specimens
Figure 3.3: Load-displacement curves for compression parallel-to-extrusion tests
26
Figure 3.4: PVC compression parallel failure
Figure 3.5: HDPE compression parallel failure
27
3.4 Flexure Tests
3.4.1 Test Procedures
Five flat-wise and five strong-axis oriented specimens of both HDPE and PVC
formulations were tested to determine the modulus of rupture. The strong-axis specimens were
assembled with three side-by-side pieces bolted together at the neutral axis in order to provide
lateral stability. The specimens were tested in the loading configuration specified by ASTM D
198 (1997). The specimens were loaded at a constant displacement rate of 0.925 in./min for flat-
wise bending and 3.390 in./min. for strong-axis bending, as specified by ASTM D 790 (1998).
ASTM D 790 is a standard test method for flexural properties of unreinforced and reinforced
plastics.
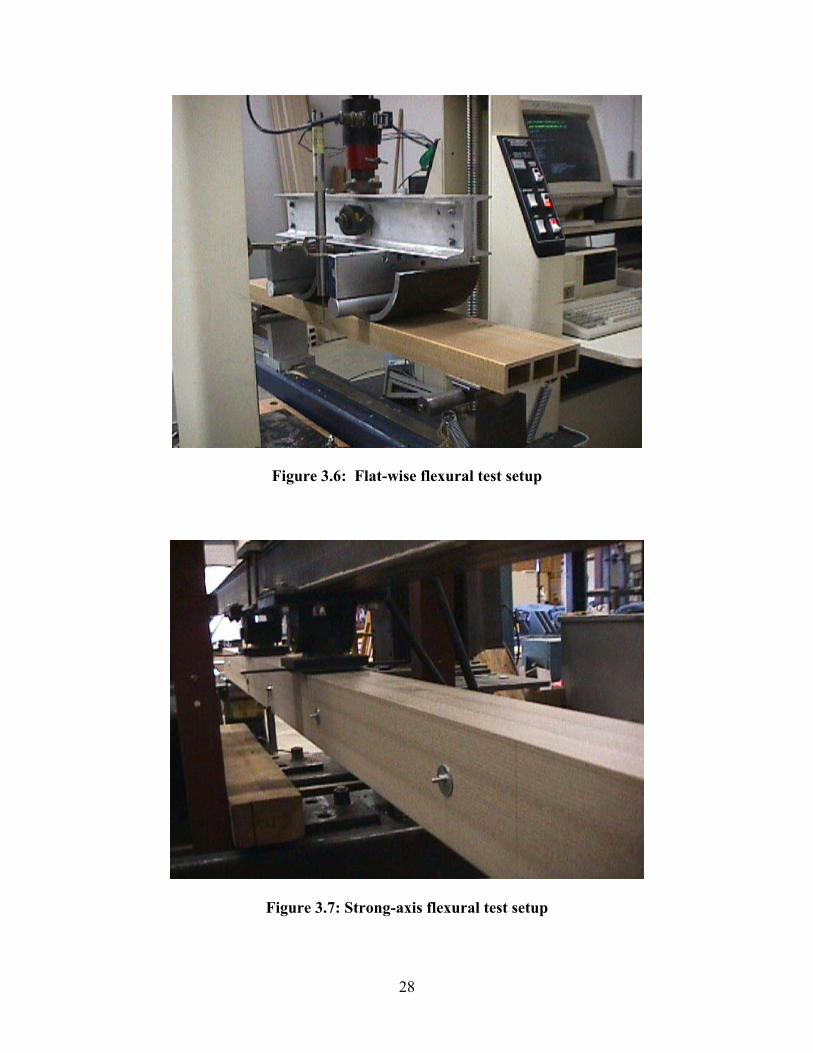
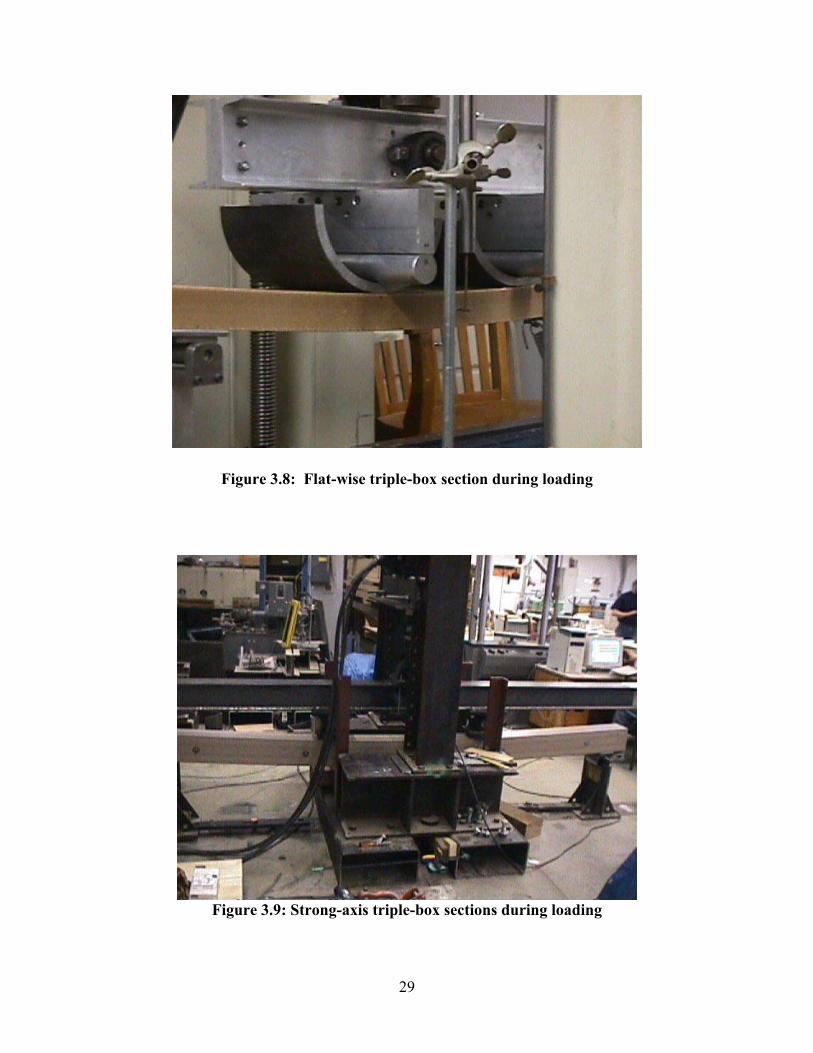
The flat-wise and strong-axis test setups are pictured in Figure 3.6 and Figure 3.7,
respectively. The dimensions of the flat-wise specimens were 6.5 in. x 1.8 in. x 36 in. with a
span length of 30 in. The dimensions for the built-up strong-axis specimens were 5.25 in. x 6.5
in. x 120 in. with a span length of 108 in. Each flat-wise specimen was tested using a United
testing machine equipped with a 20-kip load cell, while the strong-axis specimens were tested
using an MTS 55-kip actuator equipped with a 50-kip load cell. The response for each test was
determined from the load-displacement curve generated during the loading of each specimen.
The tests were terminated upon specimen failure or drop in the applied load the specimen is able
to resist. A Linear Variable Displacement Transducer (LVDT) was used to measure
displacement of the neutral axis at the mid-span for flat-wise tests. Because larger displacements
were expected in the strong-axis tests, potentiometers were used for displacement measurements
for these tests. Figure 3.8 and 3.9 show the flat-wise and strong-axis tests during loading.
28
Figure 3.6: Flat-wise flexural test setup
Figure 3.7: Strong-axis flexural test setup
29
Figure 3.8: Flat-wise triple-box section during loading
Figure 3.9: Strong-axis triple-box sections during loading

30
3.4.2 Discussion of Results: Flat-wise Flexure Tests
The results of the flat-wise flexure tests are presented in Table 3.2. Load-displacement
curves for the flat-wise flexure tests are shown in Figure 3.10. The average modulus of rupture
stress for the HDPE is 1746 psi, and the average modulus of rupture stress for the PVC is 5308
psi.
The beams all failed in tension at the extreme fiber of the specimens. A failed specimen
is shown in Figure 3.11. The PVC specimens failed in a brittle manner with little or no warning
of failure. The HDPE failures were relatively ductile with large displacements near the
maximum load.
Table 3.2: Results of the flat-wise flexure tests
Test No.Deflection at
max load (in.)Max applied
load (lbs)Max bending
moment (lb-in.)Modulus of
rupture (psi)F-1H 1.14 904 4518 1730F-2H 1.24 936 4678 1792F-3H 1.27 937 4686 1794F-4H 1.32 896 4480 1716F-5H 1.17 887 4434 1698
Average 4559 1746Std. Deviation 116 44Coeff. Of Var. 3% 3%
F-1P 0.78 2669 13347 5112F-2P 0.67 2811 14057 5383F-3P 0.71 2563 12813 4907F-4P 0.73 2914 14568 5579F-5P 0.74 2903 14515 5559
Average 13860 5308Std. Deviation 763 292Coeff. Of Var. 6% 6%

31
Flatwise Flexure Tests
0
500
1000
1500
2000
2500
3000
3500
0 0.2 0.4 0.6 0.8 1 1.2 1.4 1.6
Deflection (in.)
Load
(lbs
.)
PVC1PVC2PVC3PVC4PVC5HDPE1HDPE2HDPE3HDPE4HDPE5
PVC specimens
HDPE specimens
Figure 3.10: Load-displacement curves for flat-wise flexure tests
Figure 3.11: Flat-wise flexural failure

32
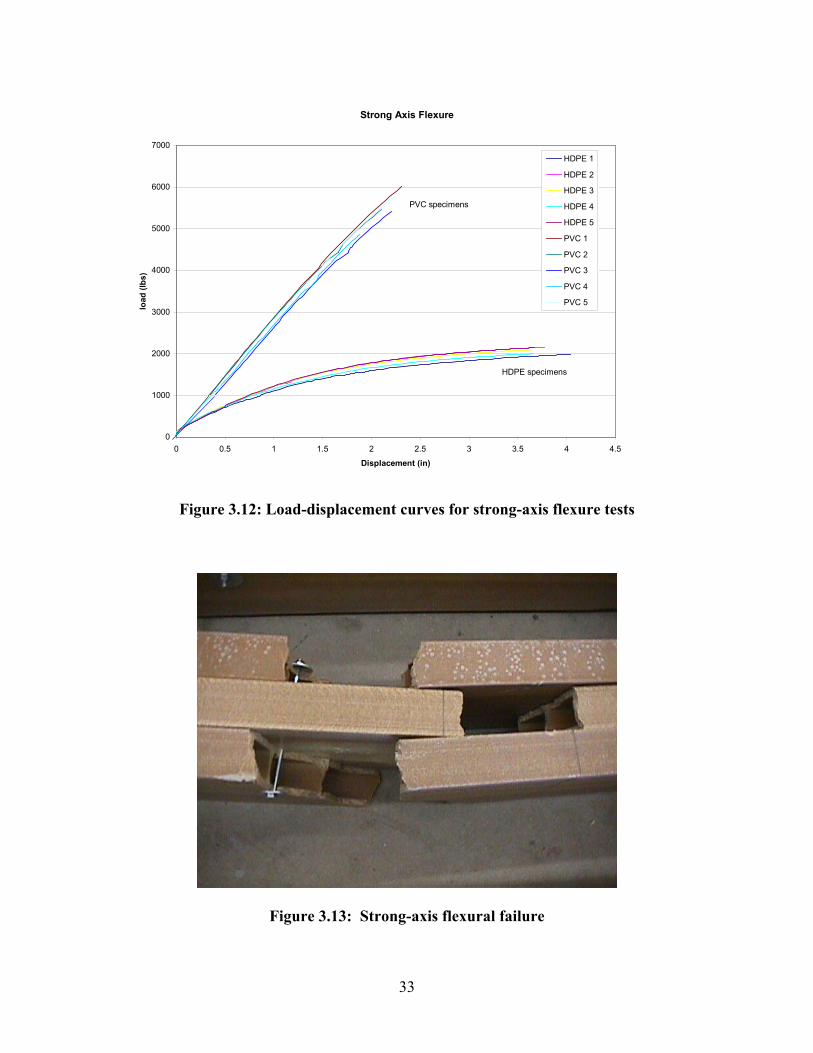
3.4.3 Discussion of Results: Strong-axis Flexure Tests
The results of the strong-axis flexure tests are presented in Table 3.3. Load-displacement
curves for the strong-axis flexure tests are shown in Figure 3.12. The average modulus of
rupture stress for the HDPE specimens is 1898 psi, and the average modulus of rupture stress for
the PVC specimens is 5033 psi.
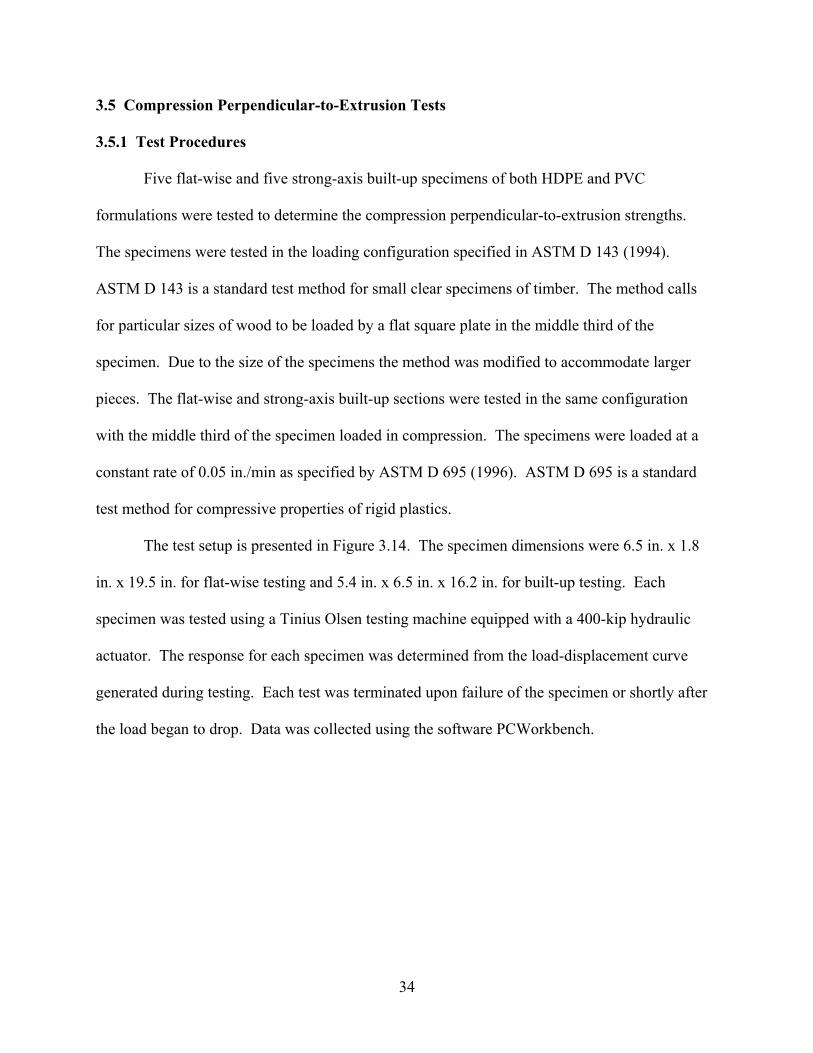
Similar to the weak-axis results, the strong-axis beams failed in tension at the extreme
fiber of the specimens, as seen in Figure 3.13. The general behavior of both the HDPE and PVC
specimens in strong-axis bending was similar to that observed in the flat-wise tests. However,
the strong-axis specimens all failed through the bolt-hole at the center of each piece.
Table 3.3: Results of the strong-axis flexure tests
Test No.Deflection at
max load (in.)Max applied
load (lbs)Max bending
moment (lb-in.)Modulus of
rupture (psi)SA-1H 4.04 1978 35604 1809SA-2H 3.77 2161 38898 1976SA-3H 3.62 2090 37620 1911SA-4H 3.65 1999 35982 1828SA-5H 3.68 2150 38700 1966
Average 37361 1898Std. Deviation 1517 77Coeff. Of Var. 4% 4%
SA-1P 2.11 6007 108126 5492SA-2P 1.90 5460 98280 4992SA-3P 2.01 5419 97542 4955SA-4P 1.60 4865 87570 4448SA-5P 2.04 5770 103860 5276
Average 99076 5033Std. Deviation 7749 394Coeff. Of Var. 8% 8%
33
Strong Axis Flexure
0
1000
2000
3000
4000
5000
6000
7000
0 0.5 1 1.5 2 2.5 3 3.5 4 4.5
Displacement (in)
load
(lbs
)
HDPE 1
HDPE 2
HDPE 3
HDPE 4
HDPE 5
PVC 1
PVC 2
PVC 3
PVC 4
PVC 5
PVC specimens
HDPE specimens
Figure 3.12: Load-displacement curves for strong-axis flexure tests
Figure 3.13: Strong-axis flexural failure
34
3.5 Compression Perpendicular-to-Extrusion Tests
3.5.1 Test Procedures
Five flat-wise and five strong-axis built-up specimens of both HDPE and PVC
formulations were tested to determine the compression perpendicular-to-extrusion strengths.
The specimens were tested in the loading configuration specified in ASTM D 143 (1994).
ASTM D 143 is a standard test method for small clear specimens of timber. The method calls
for particular sizes of wood to be loaded by a flat square plate in the middle third of the
specimen. Due to the size of the specimens the method was modified to accommodate larger
pieces. The flat-wise and strong-axis built-up sections were tested in the same configuration
with the middle third of the specimen loaded in compression. The specimens were loaded at a
constant rate of 0.05 in./min as specified by ASTM D 695 (1996). ASTM D 695 is a standard
test method for compressive properties of rigid plastics.
The test setup is presented in Figure 3.14. The specimen dimensions were 6.5 in. x 1.8
in. x 19.5 in. for flat-wise testing and 5.4 in. x 6.5 in. x 16.2 in. for built-up testing. Each
specimen was tested using a Tinius Olsen testing machine equipped with a 400-kip hydraulic
actuator. The response for each specimen was determined from the load-displacement curve
generated during testing. Each test was terminated upon failure of the specimen or shortly after
the load began to drop. Data was collected using the software PCWorkbench.

35
Figure 3.14: Compression perpendicular-to-extrusion test setup
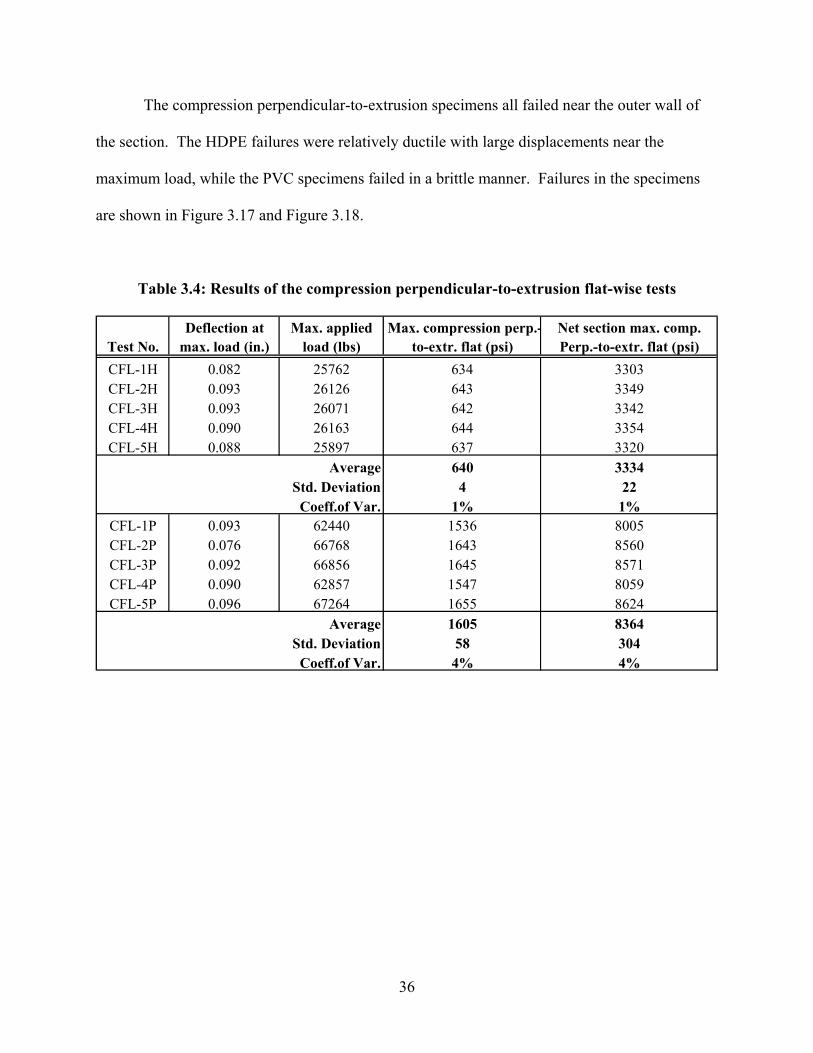
3.5.2 Discussion of Results
The results of the flat-wise and built-up compression-perpendicular-to-extrusion tests are
presented in Table 3.4 and Table 3.5. Load-displacement curves for the compression
perpendicular tests are presented in Figure 3.15 and Figure 3.16. The average compression-
perpendicular-to-extrusion strengths for the flat-wise tests, based upon net web area, are 3334 psi
and 8364 psi for the HDPE and PVC specimens, respectively. The average compression-
perpendicular-to-extrusion strengths for the built-up specimens, based upon net web area, are
3968 psi and 7702 psi for the HDPE and PVC, respectively. Higher COV’s occurred with the
built-up test results, when compared to the COV’s for the flat-wise tests, as a result of slight
irregularities in the formed ends of the sections causing lack of full contact of the applied
compression load on the specimen during testing.
36
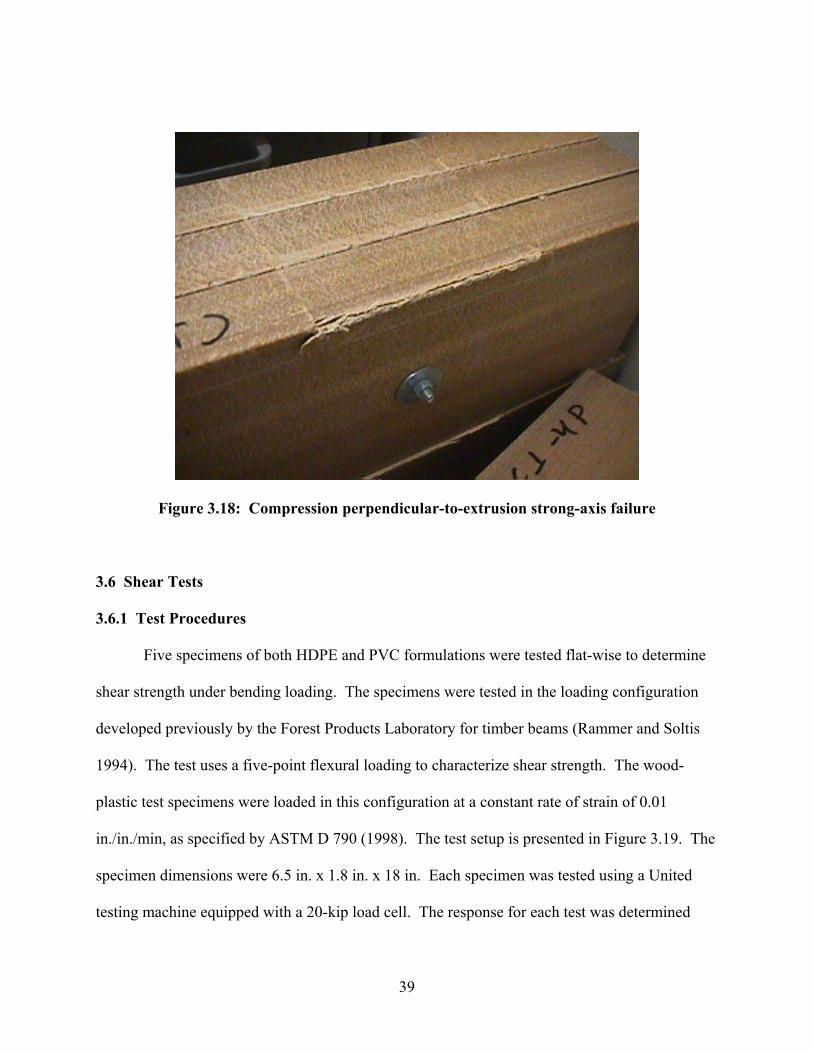
The compression perpendicular-to-extrusion specimens all failed near the outer wall of
the section. The HDPE failures were relatively ductile with large displacements near the
maximum load, while the PVC specimens failed in a brittle manner. Failures in the specimens
are shown in Figure 3.17 and Figure 3.18.
Table 3.4: Results of the compression perpendicular-to-extrusion flat-wise tests
Test No.Deflection at
max. load (in.)Max. applied
load (lbs)Max. compression perp.-
to-extr. flat (psi)Net section max. comp. Perp.-to-extr. flat (psi)
CFL-1H 0.082 25762 634 3303CFL-2H 0.093 26126 643 3349CFL-3H 0.093 26071 642 3342CFL-4H 0.090 26163 644 3354CFL-5H 0.088 25897 637 3320
Average 640 3334Std. Deviation 4 22
Coeff.of Var. 1% 1%CFL-1P 0.093 62440 1536 8005CFL-2P 0.076 66768 1643 8560CFL-3P 0.092 66856 1645 8571CFL-4P 0.090 62857 1547 8059CFL-5P 0.096 67264 1655 8624
Average 1605 8364Std. Deviation 58 304
Coeff.of Var. 4% 4%
37
Table 3.5: Results of the compression perpendicular
Test No.Deflection at
max. load (in.)Max. applied
load (lbs)Max. compression
perp.-to-extr. strong (psi)Net section max. comp.
Perp.-to-extr. strong (psi)CSA-1H 0.154 30665 755 3931CSA-2H 0.144 31488 775 4037CSA-3H 0.144 30480 750 3908CSA-4H 0.146 30658 754 3930CSA-5H 0.146 31451 774 4032
Average 762 3968Std. Deviation 12 62Coeff.of Var. 2% 2%
CSA-1P 0.112 72826 1792 9337CSA-2P 0.080 45304 1115 5808CSA-3P 0.077 51683 1272 6626CSA-4P 0.097 66319 1632 8502CSA-5P 0.090 64236 1581 8235
Average 1478 7702Std. Deviation 277 1444Coeff.of Var. 19% 19%
Compression Perpendicular Flatwise
0
10000
20000
30000
40000
50000
60000
70000
80000
0 0.01 0.02 0.03 0.04 0.05 0.06 0.07 0.08 0.09 0.1Displacement (in.)
Load
(lbs
)
HDPE1HDPE2HDPE3HDPE4HDPE5PVC1PVC2PVC3PVC4PVC5
PVC specimens
HDPE specimens
Figure 3.15: Load-displacement curves for compression perpendicular-to-extrusion flat-wise tests

38
Compression Perp Strong
0
10000
20000
30000
40000
50000
60000
70000
80000
0 0.02 0.04 0.06 0.08 0.1 0.12 0.14 0.16 0.18
Displacement (in.)
Load
(lbs
)
PVC1PVC2PVC3PVC4PVC5HDPE1HDPE2HDPE3HDPE4HDPE5
PVC specimens
HDPE specimens
Figure 3.16: Load-displacement curves for compression perpendicular-to-extrusion strong-axis tests
Figure 3.17: Compression perpendicular-to-extrusion flat-wise failure
39
Figure 3.18: Compression perpendicular-to-extrusion strong-axis failure
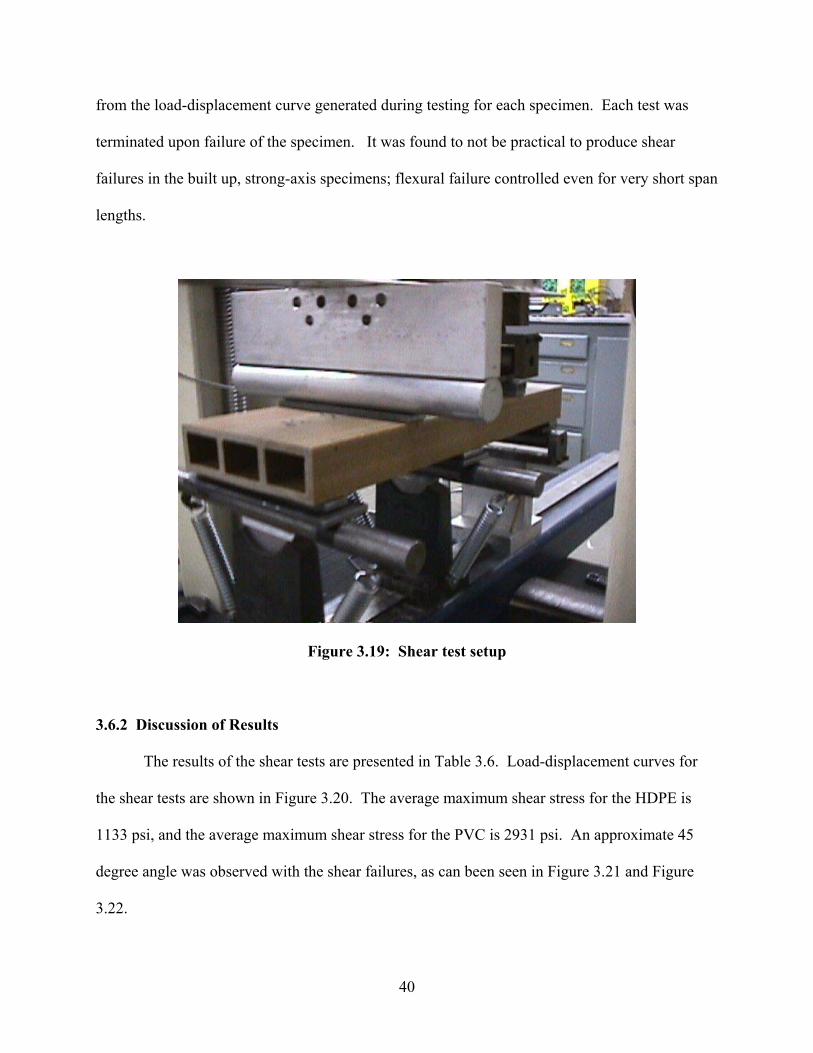
3.6 Shear Tests
3.6.1 Test Procedures
Five specimens of both HDPE and PVC formulations were tested flat-wise to determine
shear strength under bending loading. The specimens were tested in the loading configuration
developed previously by the Forest Products Laboratory for timber beams (Rammer and Soltis
1994). The test uses a five-point flexural loading to characterize shear strength. The wood-
plastic test specimens were loaded in this configuration at a constant rate of strain of 0.01
in./in./min, as specified by ASTM D 790 (1998). The test setup is presented in Figure 3.19. The
specimen dimensions were 6.5 in. x 1.8 in. x 18 in. Each specimen was tested using a United
testing machine equipped with a 20-kip load cell. The response for each test was determined
40
from the load-displacement curve generated during testing for each specimen. Each test was
terminated upon failure of the specimen. It was found to not be practical to produce shear
failures in the built up, strong-axis specimens; flexural failure controlled even for very short span
lengths.
Figure 3.19: Shear test setup
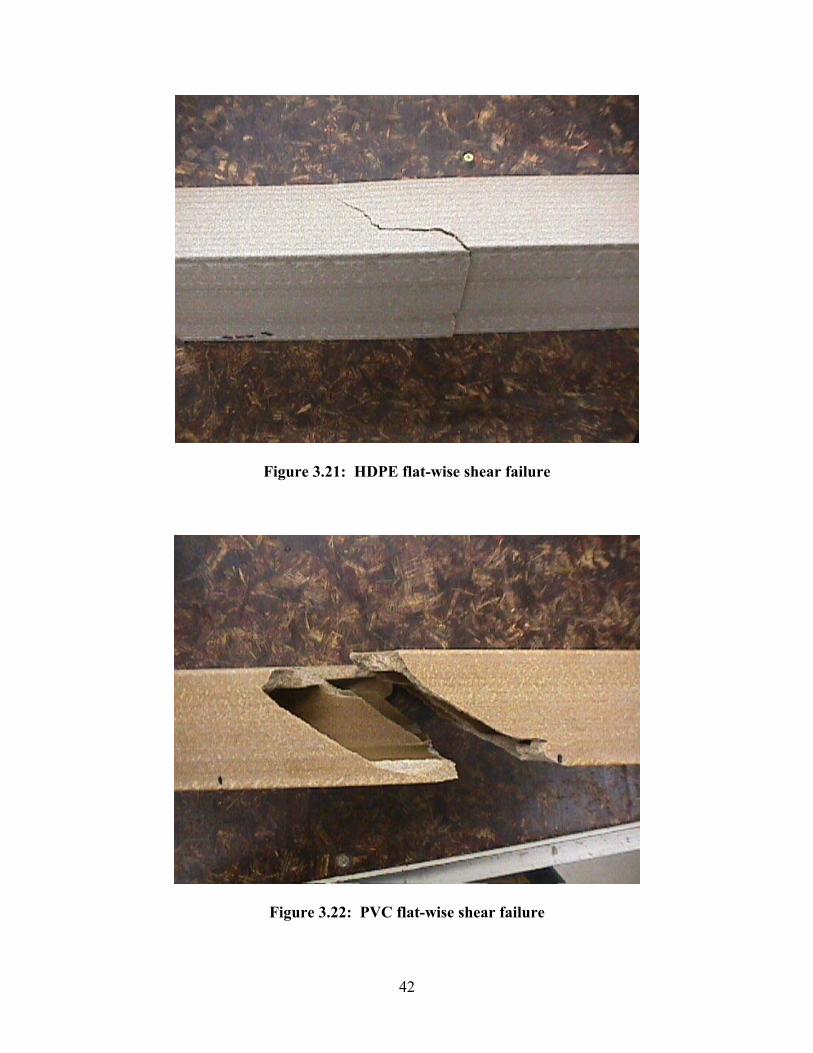
3.6.2 Discussion of Results
The results of the shear tests are presented in Table 3.6. Load-displacement curves for
the shear tests are shown in Figure 3.20. The average maximum shear stress for the HDPE is
1133 psi, and the average maximum shear stress for the PVC is 2931 psi. An approximate 45
degree angle was observed with the shear failures, as can been seen in Figure 3.21 and Figure
3.22.

41
Table 3.6: Results of the shear tests
Test No.Deflection at
max. load (in.)Max. applied
load (lbs)Max Shear
(lbs)Max. shear stress (psi)
S-1H 0.209 5635 1937 1154S-2H 0.226 5559 1911 1138S-3H 0.206 5549 1908 1136S-4H 0.202 5476 1882 1121S-5H 0.199 5455 1875 1117
Average 1903 1133Std. Deviation 25 15Coeff. of Var. 1% 1%
S-1P 0.213 15845 5447 3245S-2P 0.214 15149 5207 3102S-3P 0.204 14429 4960 2955S-4P 0.185 13403 4607 2745S-5P 0.174 12726 4375 2606
Average 4919 2931Std. Deviation 435 259Coeff. of Var. 9% 9%
Shear
0
2000
4000
6000
8000
10000
12000
14000
16000
18000
0 0.02 0.04 0.06 0.08 0.1 0.12 0.14 0.16 0.18 0.2
Displacement (in.)
Load
(lbs
)
PVC1PVC2PVC3PVC4PVC5HDPE1HDPE2HDPE3HDPE4HDPE5
PVC specimens
HDPE specimens
Figure 3.20: Load-displacement curves for shear tests
42
Figure 3.21: HDPE flat-wise shear failure
Figure 3.22: PVC flat-wise shear failure
43
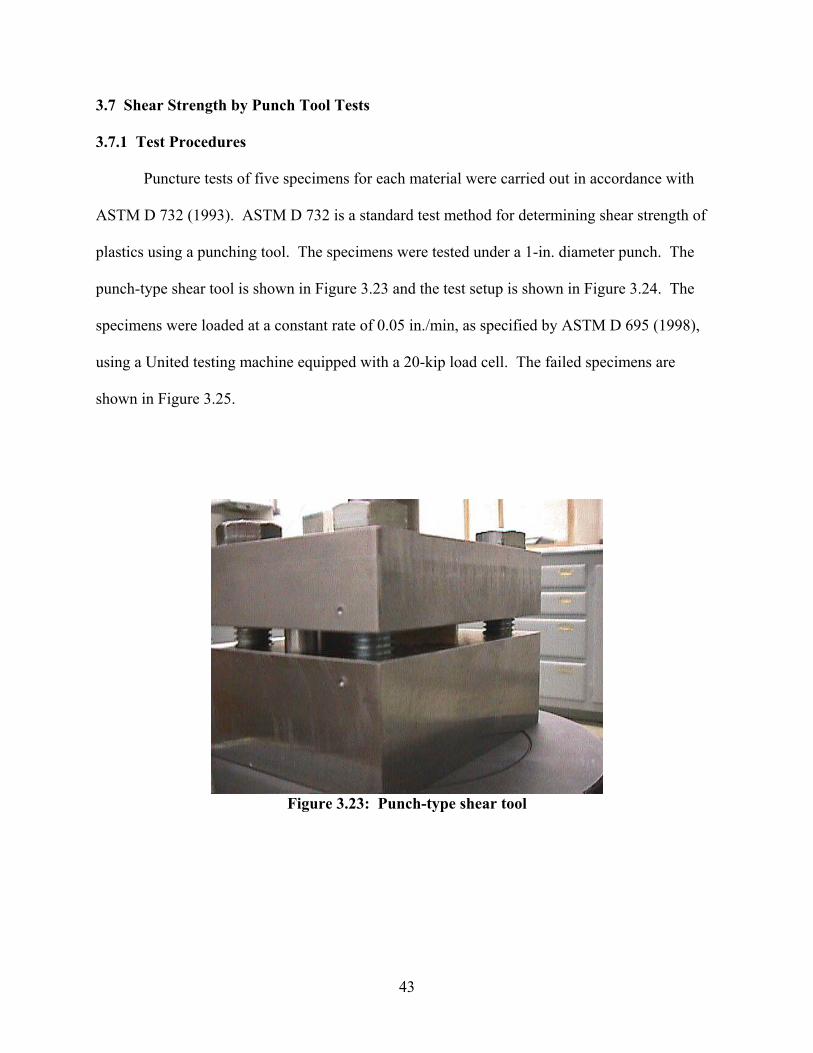
3.7 Shear Strength by Punch Tool Tests
3.7.1 Test Procedures
Puncture tests of five specimens for each material were carried out in accordance with
ASTM D 732 (1993). ASTM D 732 is a standard test method for determining shear strength of
plastics using a punching tool. The specimens were tested under a 1-in. diameter punch. The
punch-type shear tool is shown in Figure 3.23 and the test setup is shown in Figure 3.24. The
specimens were loaded at a constant rate of 0.05 in./min, as specified by ASTM D 695 (1998),
using a United testing machine equipped with a 20-kip load cell. The failed specimens are
shown in Figure 3.25.
Figure 3.23: Punch-type shear tool

44
Figure 3.24: Puncture test setup
Figure 3.25: Puncture test failures
45
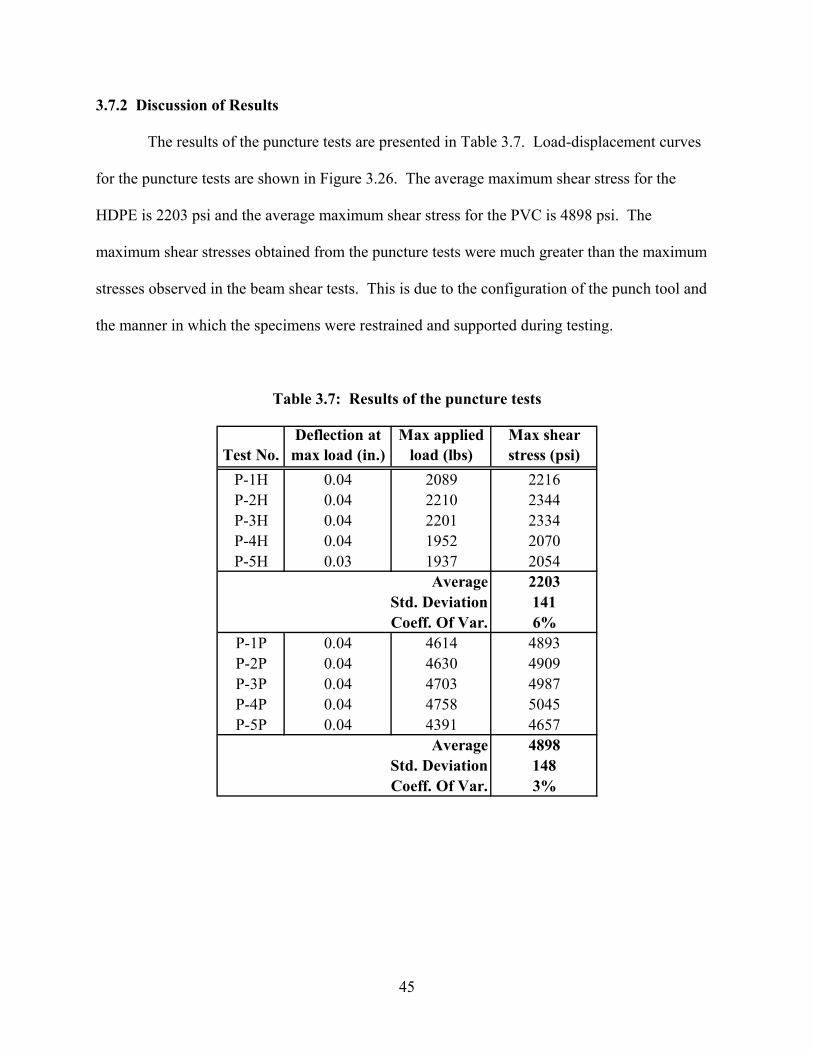
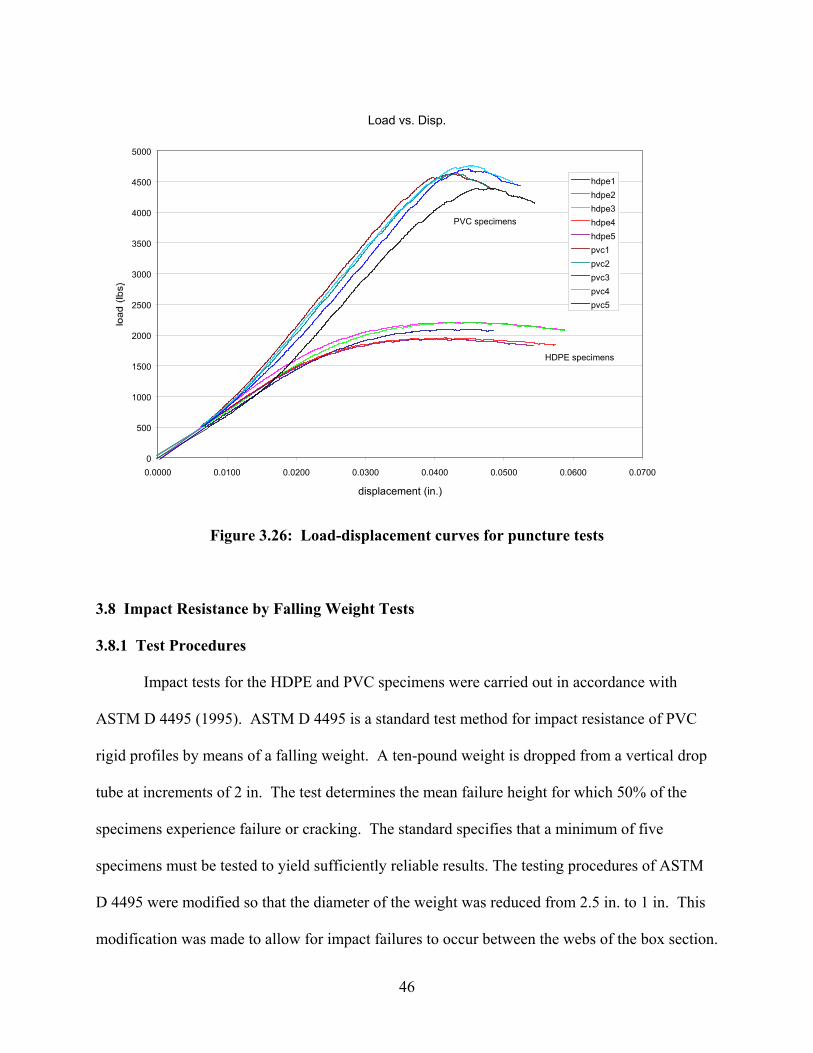
3.7.2 Discussion of Results
The results of the puncture tests are presented in Table 3.7. Load-displacement curves
for the puncture tests are shown in Figure 3.26. The average maximum shear stress for the
HDPE is 2203 psi and the average maximum shear stress for the PVC is 4898 psi. The
maximum shear stresses obtained from the puncture tests were much greater than the maximum
stresses observed in the beam shear tests. This is due to the configuration of the punch tool and
the manner in which the specimens were restrained and supported during testing.
Table 3.7: Results of the puncture tests
Test No.Deflection at
max load (in.)Max applied
load (lbs)Max shear stress (psi)
P-1H 0.04 2089 2216P-2H 0.04 2210 2344P-3H 0.04 2201 2334P-4H 0.04 1952 2070P-5H 0.03 1937 2054
Average 2203Std. Deviation 141Coeff. Of Var. 6%
P-1P 0.04 4614 4893P-2P 0.04 4630 4909P-3P 0.04 4703 4987P-4P 0.04 4758 5045P-5P 0.04 4391 4657
Average 4898Std. Deviation 148Coeff. Of Var. 3%
46
Load vs. Disp.
0
500
1000
1500
2000
2500
3000
3500
4000
4500
5000
0.0000 0.0100 0.0200 0.0300 0.0400 0.0500 0.0600 0.0700
displacement (in.)
hdpe1hdpe2hdpe3hdpe4hdpe5pvc1pvc2pvc3pvc4pvc5
PVC specimens
HDPE specimens
Figure 3.26: Load-displacement curves for puncture tests
3.8 Impact Resistance by Falling Weight Tests
3.8.1 Test Procedures
Impact tests for the HDPE and PVC specimens were carried out in accordance with
ASTM D 4495 (1995). ASTM D 4495 is a standard test method for impact resistance of PVC
rigid profiles by means of a falling weight. A ten-pound weight is dropped from a vertical drop
tube at increments of 2 in. The test determines the mean failure height for which 50% of the
specimens experience failure or cracking. The standard specifies that a minimum of five
specimens must be tested to yield sufficiently reliable results. The testing procedures of ASTM
D 4495 were modified so that the diameter of the weight was reduced from 2.5 in. to 1 in. This
modification was made to allow for impact failures to occur between the webs of the box section.

47
Tests were conducted on specimens with dimensions of 6.5 in. x 1.8 in. x 6 in. The test setup is
shown in Figure 3.27.
The impact test was performed on three locations of the sections. First, impact was
centered over an open cell creating failure in the flange. Second, impact was centered directly
over a web creating failure in the web. Finally, impact was centered over the edge of a web
inducing web or flange failure.
Figure 3.27: Impact test setup
3.8.2 Discussion of Results
The results of the impact tests are summarized in Table 3.8. Failure in the flange for the
PVC specimens occurred with a lower drop height than for the HDPE specimens. This is
reflective of the relatively brittle behavior of the PVC material. However, failure in the web
required higher drop heights than the HDPE because of the additional compressive strength of
the PVC. The average drop heights for PVC and HDPE flange failure were 4.0 in. and 8.2 in.,
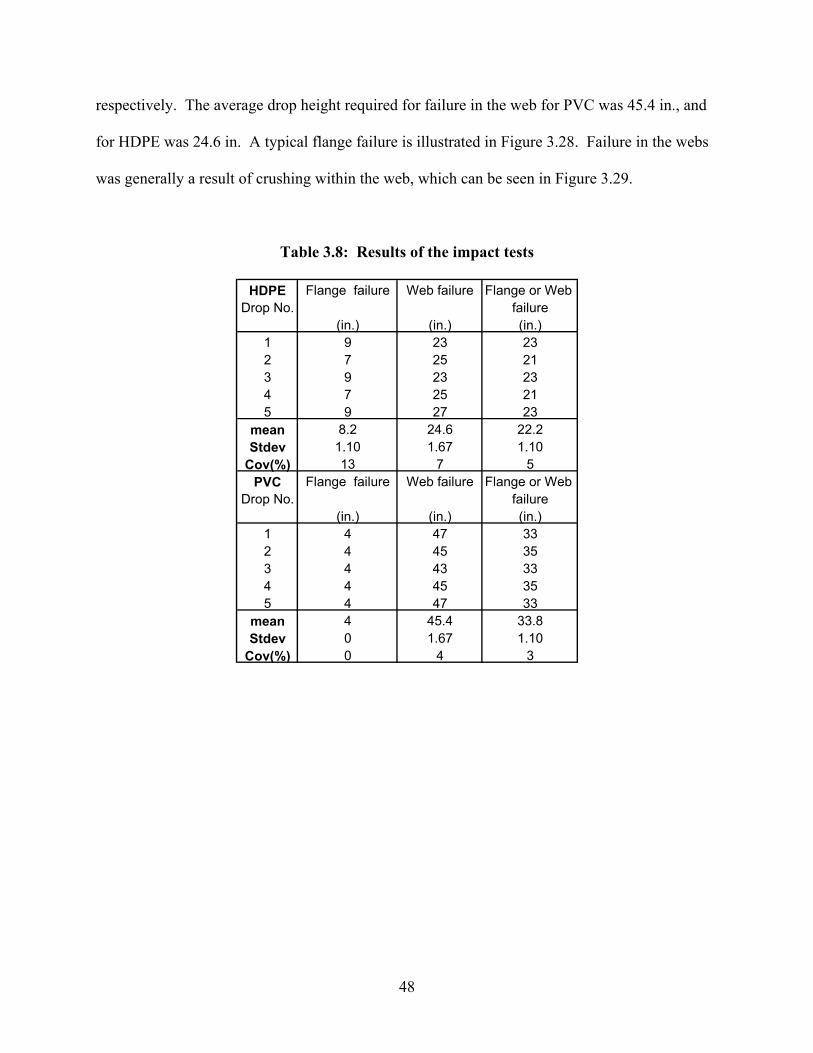
48
respectively. The average drop height required for failure in the web for PVC was 45.4 in., and
for HDPE was 24.6 in. A typical flange failure is illustrated in Figure 3.28. Failure in the webs
was generally a result of crushing within the web, which can be seen in Figure 3.29.
Table 3.8: Results of the impact tests
HDPE Flange failure Web failure Flange or Web Drop No. failure
(in.) (in.) (in.)1 9 23 232 7 25 213 9 23 234 7 25 215 9 27 23
mean 8.2 24.6 22.2Stdev 1.10 1.67 1.10
Cov(%) 13 7 5PVC Flange failure Web failure Flange or Web
Drop No. failure(in.) (in.) (in.)
1 4 47 332 4 45 353 4 43 334 4 45 355 4 47 33
mean 4 45.4 33.8Stdev 0 1.67 1.10
Cov(%) 0 4 3

49
Figure 3.28: Impact failure in PVC flange
Figure 3.29: Impact failure in PVC web
50
3.9 Comparison of Material Strength, Stiffness, and Energy Dissipation Characteristics
The test results enable the comparison of strength, apparent stiffness, and the energy
dissipated during loading by the HDPE and PVC sections. Table 3.9 presents the relative ratios
for the three characteristics. The comparison of ultimate strengths for each test for the two
formulations shows that the PVC formulation is from 2 to 4 times stronger than the HDPE
formulation. Stiffness comparisons were made with stiffness determined at 40 percent of
ultimate strength. Figure 3.30 shows the apparent stiffness for typical flat-wise test sections.
Forty percent of ultimate strength is a common basis used for design values (e.g., concrete)
allowing safety in capacity and often ductility. The stiffness determined for both formulations
using this method is within ten percent of results from previous research in determining apparent
modulus of elasticity for WPC material (Lockyear, 1999). The comparison of relative stiffness
for each test for the two formulations indicates that the PVC formulation is from 2 to 3 times
stiffer than the HDPE formulation.
Computing the area under the load-displacement curves for each test enables a
comparison of the energy dissipation capability of the materials. Figure 3.31 illustrates a typical
comparison of energy absorbed during shear testing. Due to the apparent ductile response of the
HDPE, in the form of large displacements with little increase in load near failure, it might be
expected to absorb more energy than the PVC formulation. However, the comparison of energy
absorbed for each test for the two formulations shows that the PVC formulation will absorb from
1 to 1.5 times more energy than the HDPE formulation.

51
Table 3.9: Comparison of strength, stiffness, and energy dissipation for HDPE and PVC formulations
Relative Strength Ratio Relative Stiffness Ratio Energy RatioPUlt / PUlt (at 0.4PUlt) (area under load-disp. curve)
PVC / HDPE PVC / HDPE PVC / HDPE
Flexure (flatwise) 3.3 2.1 1.3Flexure (edgewise) 2.7 1.8 1.2Shear 2.4 1.8 1.7Comp. Perp. (flatwise) 2.4 2.8 1.4Comp. Perp. (edgewise) 2.1 1.8 0.7Comp. Parallel 3.8 3.1 0.9
Flatwise Flexure Tests
0
500
1000
1500
2000
2500
3000
3500
0 0.2 0.4 0.6 0.8 1 1.2 1.4 1.6
Deflection (in.)
0.4*Ult. HDPE
0.4*Ult. PVC
1160
350
5300 lb/in.
2500 lb/in.
HDPE
PVC
Figure 3.30: Relative stiffness for HDPE and PVC sections

52
Figure 3.31: Comparison of energy absorbed for HDPE and PVC formulations
3.10 Conclusions
Based upon the experimental tests conducted on WPC sections presented in this chapter,
material strength values are established for the design of prototype structural elements for
application in demonstration projects. The test results indicate that specimens formulated with
the PVC material are stronger and stiffer than those formulated with the HDPE material.
However, the PVC specimens exhibited a nearly linear response to failure and with lesser
displacement at failure than was obtained with the HDPE specimens. The average compression
parallel-to-extrusion strengths were 2243 psi and 8225 psi for HDPE and PVC, respectively,
based on net cross-sectional area. The average modulus of rupture (MOR) from the bending

53
tests for HDPE was 1822 psi and for PVC was 5171 psi. The average compression
perpendicular-to-extrusion strengths were 3651 psi for the HDPE and 8033 psi for the PVC,
based on net web area. The average shear stresses from bending shear tests were 1133 psi and
2931 for HDPE and PVC, respectively.
54
CHAPTER 4
PREDICTING BENDING STRENGTH AND BEHAVIOR IN WOOD-
PLASTIC COMPOSITE SECTIONS
4.1 Abstract A Fortran program (MPHIWPC) was developed to analyze wood-plastic composite
(WPC) sections under flexural loading. The program determines for beam elements the stress
distribution through the depth, the corresponding moment-curvature relationship, and the load-
displacement behavior under either 3-point or 4-point bending. Based on comparisons between
test results and the predicted results using the program, MPHIWPC provides a very good
prediction of the flexural response of both nonreinforced and reinforced WPC sections. The
program enabled an improved understanding of the behavior of WPC sections and will in the
future assist in the design of WPC flexural members by providing preliminary strength estimates
for proposed sections.
4.2 Introduction
In an attempt to further understand the WPC behavior, a Fortran program (MPHIWPC)
was developed to analyze WPC beam sections under flexural loading. The program is useful for
determining strength and ductility of the sections and for analyzing the distribution of stress
though the depth, the shift of the neutral axis as load increases, and the effects of reinforcement
on flexural response. The program is able to analyze solid or hollow sections with or without
reinforcing, and it incorporates the nonlinear response of the WPC material and the differences
in strength and stiffness in tension and compression.
55
Assumptions in the program include plane sections remain plane (no warping occurs in
the member during loading), only axial stresses and strains act in the material (implying pure
bending of the member), perfect bond (no slip) between reinforcement fiber and the WPC, and
shear deformations are not considered.
4.3 Program MPHIWPC
4.3.1 Program Description
The program develops moment-curvature data points as a function of flexural strain in
bending sections. The moment-curvature data is then used to determine load-displacement
behavior for two common test setups. Material behavior parameters, cross-sectional shape, and
test configuration are required as input to carry out the analysis. The program increments the
level of compressive strain, with the increment being specified by the user, and determines
moment and curvature for each level of strain. For each increment, the slope of the strain
distribution through the depth of the beam is adjusted until equilibrium of axial tensile and
compressive forces in the section is reached. Failure is indicated when either the compressive
strain capacity or the tensile strain capacity of the WPC material is reached.
With the assumption of a perfect bond between the fiber and WPC, the fiber reinforcing
strains, stresses, and forces can be computed, as for the WPC material, using the strain
distribution. Load and mid-span displacement data are computed using the moment-area
method. The program currently limits the load-deflection calculations to 3-point bending setups
with loading at the midpoint and 4-point bending setups with loading at the third points.
Appendix C contains a flowchart for the program and the MPHIWPC code.
56
4.3.2 Program Input
The specific input required for the moment-curvature calculations includes the
constitutive stress-strain relationships for both the WPC material and the fiber reinforcement.
Previous research developed hyperbolic tangent models to characterize the stress-strain behavior
for the HDPE and PVC formulations (Lockyear, 1999). The models were adjusted slightly
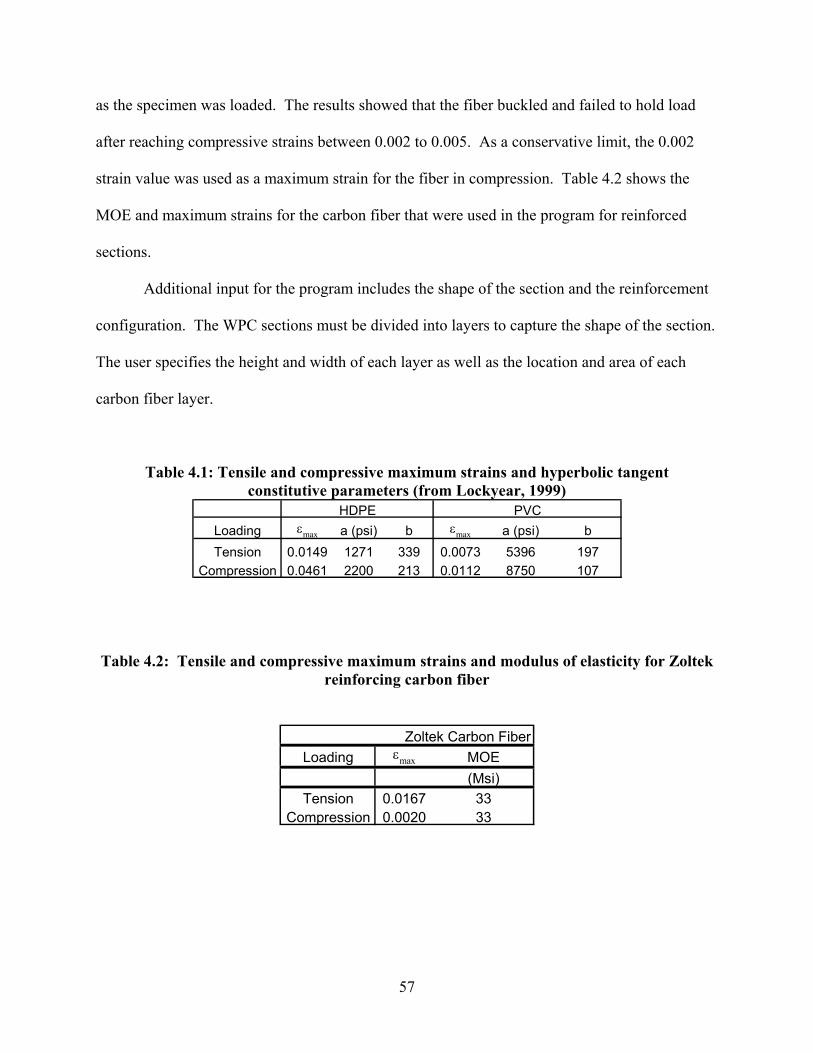
before use in the program. The constitutive input parameters and maximum strains for the WPC
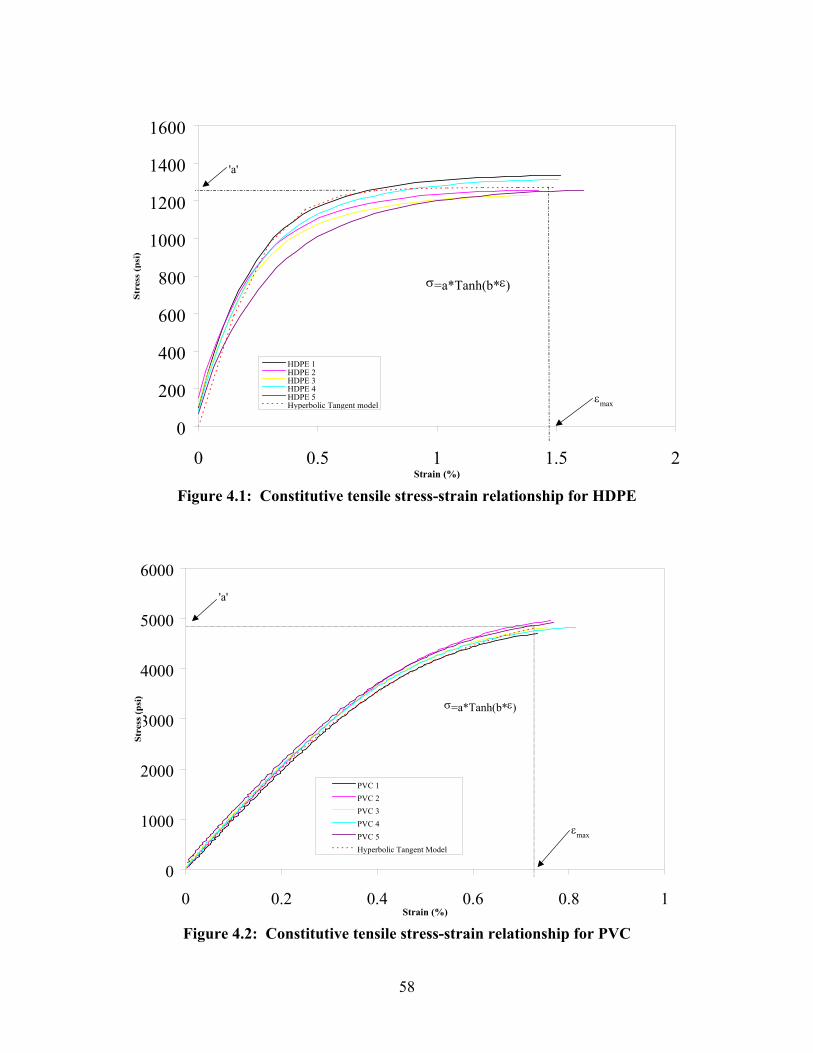
materials are shown in Table 4.1. Figures 4.1 and 4.2 show the tensile hyperbolic tangent
models superimposed with coupon test results for the HDPE and PVC materials, respectively.
Figures 4.3 and 4.4 show the compressive hyperbolic tangent models along with coupon test
results for the HDPE and PVC materials, respectively.
The figures show that the hyperbolic tangent model can characterize the tensile behavior
of the material very well. As seen in Figures 4.3 and 4.4, the hyperbolic tangent model
characterizes the compressive behavior of the PVC material quite well, but some differences
exist between the model and the compression test results for the HDPE material. Based on
information from the carbon fiber manufacturer, Zoltek Inc., the tensile stress-strain relation for
the carbon fiber is assumed to be linear until failure. Therefore, only the tensile modulus of
elasticity (MOE) and strain capacity are required to describe the behavior of the carbon fiber in
tension (Table 4.2). Because no data was available on the behavior of the fiber in compression,
and for simplicity, the compressive MOE was assumed to be equal to the tensile MOE.
To determine the maximum compressive strain for the reinforcing fiber, a double-box
section reinforced with a single layer of fiber on both the top and bottom flanges of the section
was instrumented with strain gages and loaded axially in compression. The gages were mounted
on the fiber layers at the two ends of a double-box section. Load and strain data were collected
57
as the specimen was loaded. The results showed that the fiber buckled and failed to hold load
after reaching compressive strains between 0.002 to 0.005. As a conservative limit, the 0.002
strain value was used as a maximum strain for the fiber in compression. Table 4.2 shows the
MOE and maximum strains for the carbon fiber that were used in the program for reinforced
sections.
Additional input for the program includes the shape of the section and the reinforcement
configuration. The WPC sections must be divided into layers to capture the shape of the section.
The user specifies the height and width of each layer as well as the location and area of each
carbon fiber layer.
Table 4.1: Tensile and compressive maximum strains and hyperbolic tangent constitutive parameters (from Lockyear, 1999)
Loading εmax a (psi) b εmax a (psi) bTension 0.0149 1271 339 0.0073 5396 197
Compression 0.0461 2200 213 0.0112 8750 107
HDPE PVC
Table 4.2: Tensile and compressive maximum strains and modulus of elasticity for Zoltek
reinforcing carbon fiber
Zoltek Carbon FiberLoading εmax MOE
(Msi)Tension 0.0167 33
Compression 0.0020 33
58
0
200
400
600
800
1000
1200
1400
1600
0 0.5 1 1.5 2Strain (%)
HDPE 1HDPE 2HDPE 3HDPE 4HDPE 5Hyperbolic Tangent model
'a'
εmax
σ=a*Tanh(b*ε)
Figure 4.1: Constitutive tensile stress-strain relationship for HDPE
0
1000
2000
3000
4000
5000
6000
0 0.2 0.4 0.6 0.8 1Strain (%)
PVC 1PVC 2PVC 3PVC 4PVC 5Hyperbolic Tangent Model
'a'
σ=a*Tanh(b*ε)
εmax
Figure 4.2: Constitutive tensile stress-strain relationship for PVC

59
0
500
1000
1500
2000
2500
3000
0 1 2 3 4 5 6Strain (%)
HDPE 1
HDPE 2
HDPE 3
HDPE 4
HDPE 5
Hyperbolic Tangent Model
'a'
εmax
σ=a*Tanh(b*ε)
Figure 4.3: Constitutive compressive stress-strain realtionship for HDPE
0100020003000400050006000700080009000
10000
0 0.2 0.4 0.6 0.8 1 1.2 1.4Strain (%)
PVC 1PVC 2PVC 3PVC 4PVC 5Hyperbolic Tangent Model
εmax
'a'
σ=a*Tanh(b*ε)
Figure 4.4: Constitutive compressive stress-strain relationship for PVC

60
4.3.3 Program Output
The output from the moment-curvature calculations for each increment of strain consists
of the strain at the top and bottom of the section along with the moment, curvature, and depth of
the neutral axis. Load-displacement data are also determined at each strain increment as well as
the stress distribution through the depth of the section.
4.4 Comparison of Flexural Test Results to Predicted Results
4.4.1 Comparison of Load-Displacement Results for Near Full-Size Sections
As a means of evaluating the accuracy of the results from MPHIWPC, the triple-box
sections previously tested in bending were analyzed using the program. Sections constructed
from both WPC formulations were analyzed and compared to experimental results. The HDPE
formulation consists of approximately 70% wood and 30% HDPE, and the PVC formulation
consists of approximately 50% wood and 50% PVC. The specimens were a rectangular three-
cell box section and were tested in both the flat-wise and edge-wise orientations. Figure 4.5
shows the triple-box cross-section. Figures 4.6 and 4.7 show the flat-wise and edge-wise test
setups.
Figure 4.5: Triple-box cross section
61
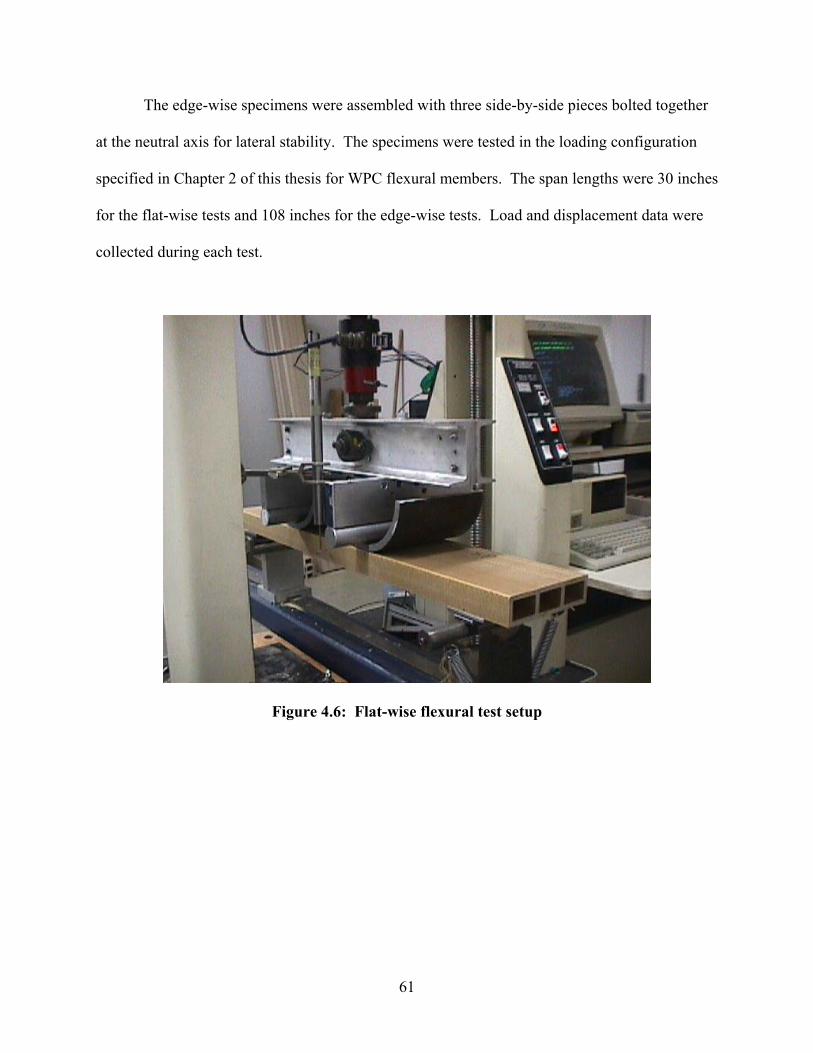
The edge-wise specimens were assembled with three side-by-side pieces bolted together
at the neutral axis for lateral stability. The specimens were tested in the loading configuration
specified in Chapter 2 of this thesis for WPC flexural members. The span lengths were 30 inches
for the flat-wise tests and 108 inches for the edge-wise tests. Load and displacement data were
collected during each test.
Figure 4.6: Flat-wise flexural test setup
62
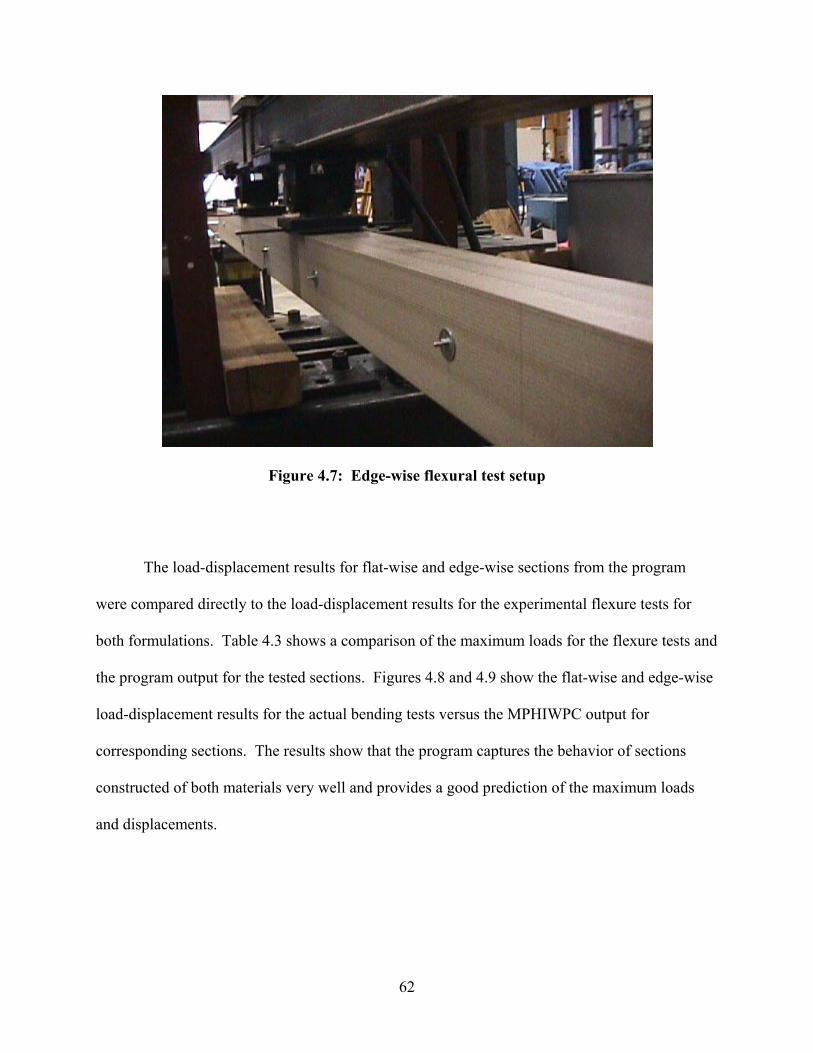
Figure 4.7: Edge-wise flexural test setup
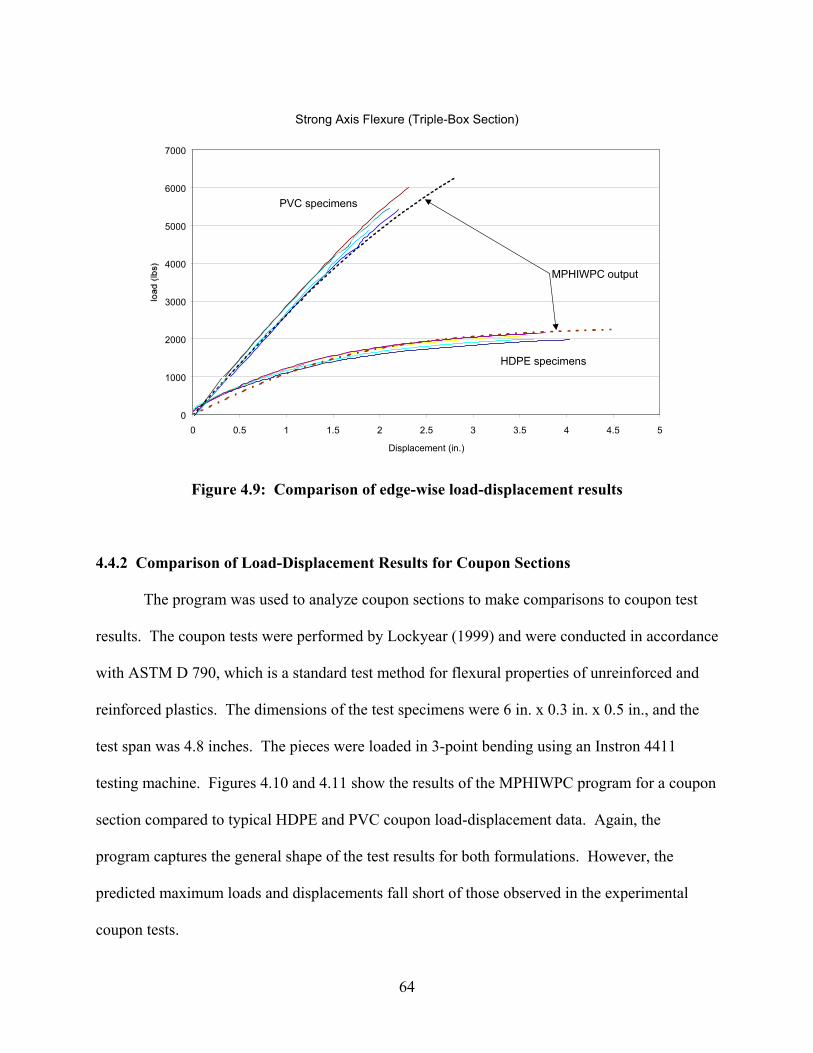
The load-displacement results for flat-wise and edge-wise sections from the program
were compared directly to the load-displacement results for the experimental flexure tests for
both formulations. Table 4.3 shows a comparison of the maximum loads for the flexure tests and
the program output for the tested sections. Figures 4.8 and 4.9 show the flat-wise and edge-wise
load-displacement results for the actual bending tests versus the MPHIWPC output for
corresponding sections. The results show that the program captures the behavior of sections
constructed of both materials very well and provides a good prediction of the maximum loads
and displacements.

63
Table 4.3: Comparison of maximum loads
Section Maximum LoadFlexure Tests MPHIWPC Percent
(average) output Diff.(lbs) (lbs) (%)
HDPE flatwise 912 949 (+4)PVC flatwise 2772 2934 (+6)HDPE edgewise 2076 2249 (+8)PVC edgewise 5504 6278 (+14)
Flatwise Flexure Tests (Triple-Box Section)
0
500
1000
1500
2000
2500
3000
3500
0 0.2 0.4 0.6 0.8 1 1.2 1.4 1.6
Deflection (in.)
PVC specimens
HDPE specimens
MPHIWPC output
Figure 4.8: Comparison of flat-wise load-displacement results
64
Strong Axis Flexure (Triple-Box Section)
0
1000
2000
3000
4000
5000
6000
7000
0 0.5 1 1.5 2 2.5 3 3.5 4 4.5 5
Displacement (in.)
PVC specimens
HDPE specimens
MPHIWPC output
Figure 4.9: Comparison of edge-wise load-displacement results
4.4.2 Comparison of Load-Displacement Results for Coupon Sections
The program was used to analyze coupon sections to make comparisons to coupon test
results. The coupon tests were performed by Lockyear (1999) and were conducted in accordance
with ASTM D 790, which is a standard test method for flexural properties of unreinforced and
reinforced plastics. The dimensions of the test specimens were 6 in. x 0.3 in. x 0.5 in., and the
test span was 4.8 inches. The pieces were loaded in 3-point bending using an Instron 4411
testing machine. Figures 4.10 and 4.11 show the results of the MPHIWPC program for a coupon
section compared to typical HDPE and PVC coupon load-displacement data. Again, the
program captures the general shape of the test results for both formulations. However, the
predicted maximum loads and displacements fall short of those observed in the experimental
coupon tests.

65
Previous comparisons of modulus of rupture (MOR) showed similar differences between
coupon and near full-size section test results (Paynter, 1998). Differences in the values were, at
that time, attributed to sample size (i.e., variations due to the small number of test specimens),
scale effects (size effects), and/or to the effect of the bolt holes in the flexure zone of the near
full-size section tests. The test results presented in Chapter 3 of this thesis suggest that bolt holes
in the flexure zone of the section are not the cause of these differences, as similar MOR’s were
observed between the flat-wise and edge-wise oriented tests. The results in Chapter 3 of this
thesis also suggest that sample size is not the cause of these differences because a larger set of
data is now available to establish strength values. The suggestion of size effects of some form
between coupon and larger net sections remains a possible cause for the differences in strength.
Other factors that may account for the observed differences in the strength of the WPC sections
includes shape effects due to the specific geometry of the sections and production effects during
extrusion.

66
Load vs. Displacement (HDPE Coupon)
0
5
10
15
20
25
0 0.05 0.1 0.15 0.2 0.25
disp. (in.)
Typical HDPE coupon results
MPHIWPC output
Figure 4.10: Comparison of load-displacement curves for HDPE coupon
Load-Diplacement (PVC Coupon)
0
10
20
30
40
50
60
70
80
90
0 0.05 0.1 0.15 0.2 0.25
displacement (in.)
Typical PVC coupon resultsMPHIWPC output
Figure 4.11: Comparison of load-displacement curves for PVC coupon
67
To investigate size and geometry effects further, the program was modified to permit
some additional straining of the material. The WPC materials were allowed to soften in both
tension and compression after reaching the maximum strains for the material. This causes a
redistribution of the stress in the depth of the section. The softening of the WPC material may be
causing the additional load and displacement seen in the experimental coupon tests because the
sections are solid.
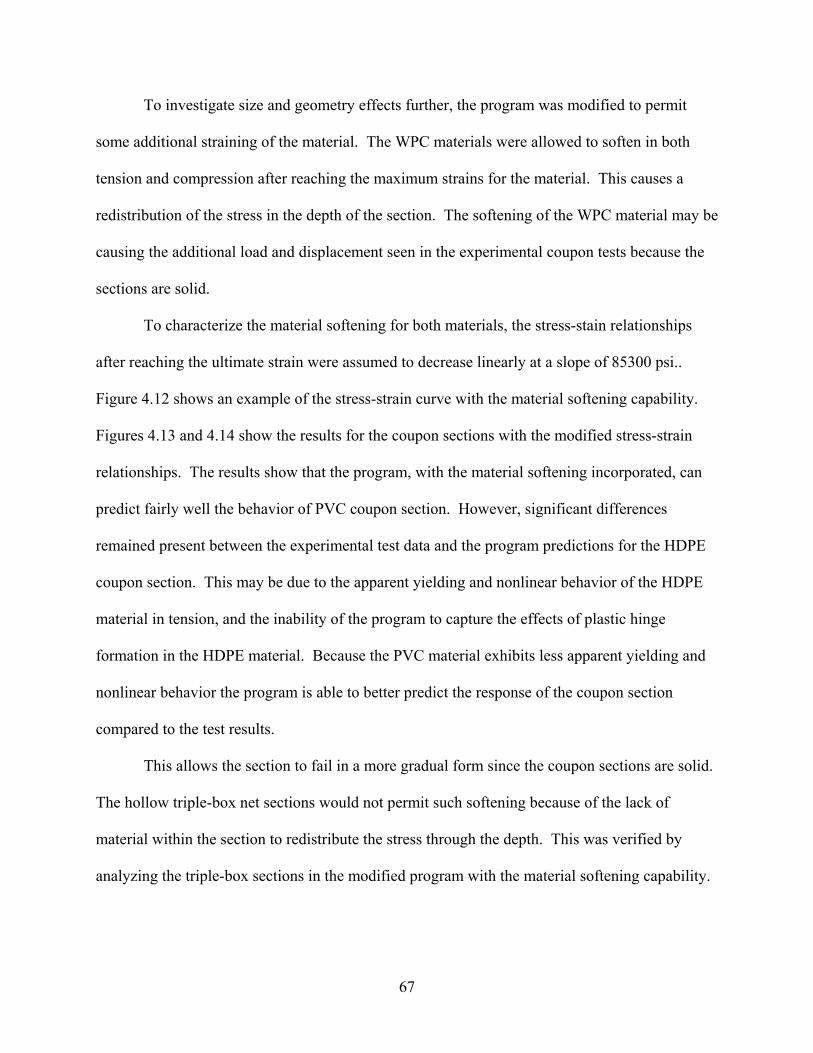
To characterize the material softening for both materials, the stress-stain relationships
after reaching the ultimate strain were assumed to decrease linearly at a slope of 85300 psi..
Figure 4.12 shows an example of the stress-strain curve with the material softening capability.
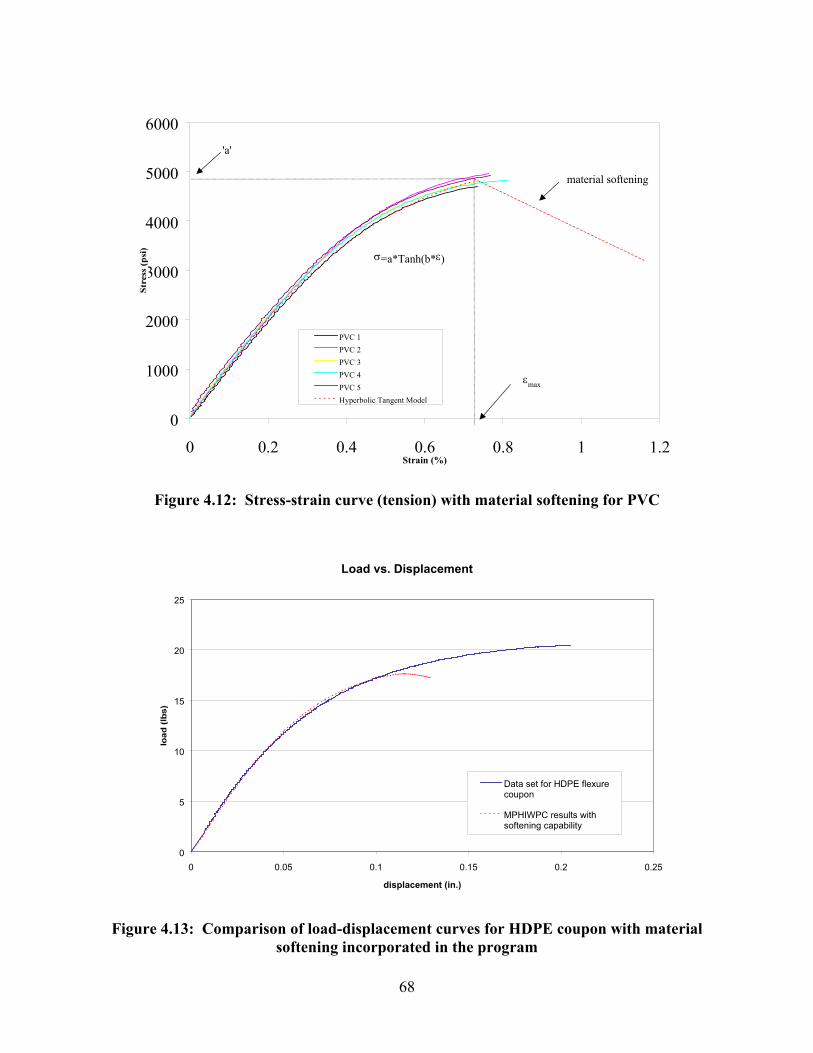
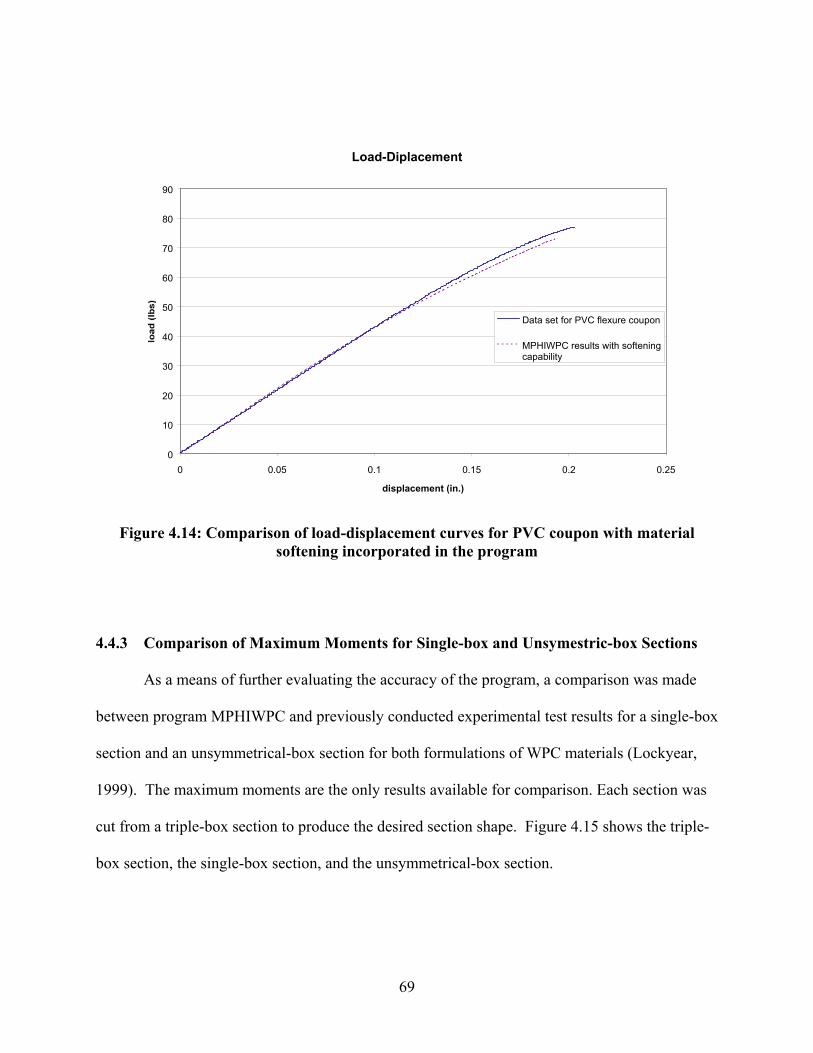
Figures 4.13 and 4.14 show the results for the coupon sections with the modified stress-strain
relationships. The results show that the program, with the material softening incorporated, can
predict fairly well the behavior of PVC coupon section. However, significant differences
remained present between the experimental test data and the program predictions for the HDPE
coupon section. This may be due to the apparent yielding and nonlinear behavior of the HDPE
material in tension, and the inability of the program to capture the effects of plastic hinge
formation in the HDPE material. Because the PVC material exhibits less apparent yielding and
nonlinear behavior the program is able to better predict the response of the coupon section
compared to the test results.
This allows the section to fail in a more gradual form since the coupon sections are solid.
The hollow triple-box net sections would not permit such softening because of the lack of
material within the section to redistribute the stress through the depth. This was verified by
analyzing the triple-box sections in the modified program with the material softening capability.
68
0
1000
2000
3000
4000
5000
6000
0 0.2 0.4 0.6 0.8 1 1.2Strain (%)
PVC 1PVC 2PVC 3PVC 4PVC 5Hyperbolic Tangent Model
'a'
σ=a*Tanh(b*ε)
εmax
material softening
Figure 4.12: Stress-strain curve (tension) with material softening for PVC
Load vs. Displacement
0
5
10
15
20
25
0 0.05 0.1 0.15 0.2 0.25
displacement (in.)
Data set for HDPE flexurecoupon
MPHIWPC results withsoftening capability
Figure 4.13: Comparison of load-displacement curves for HDPE coupon with material softening incorporated in the program
69
Load-Diplacement
0
10
20
30
40
50
60
70
80
90
0 0.05 0.1 0.15 0.2 0.25
displacement (in.)
Data set for PVC flexure coupon
MPHIWPC results with softeningcapability
Figure 4.14: Comparison of load-displacement curves for PVC coupon with material softening incorporated in the program
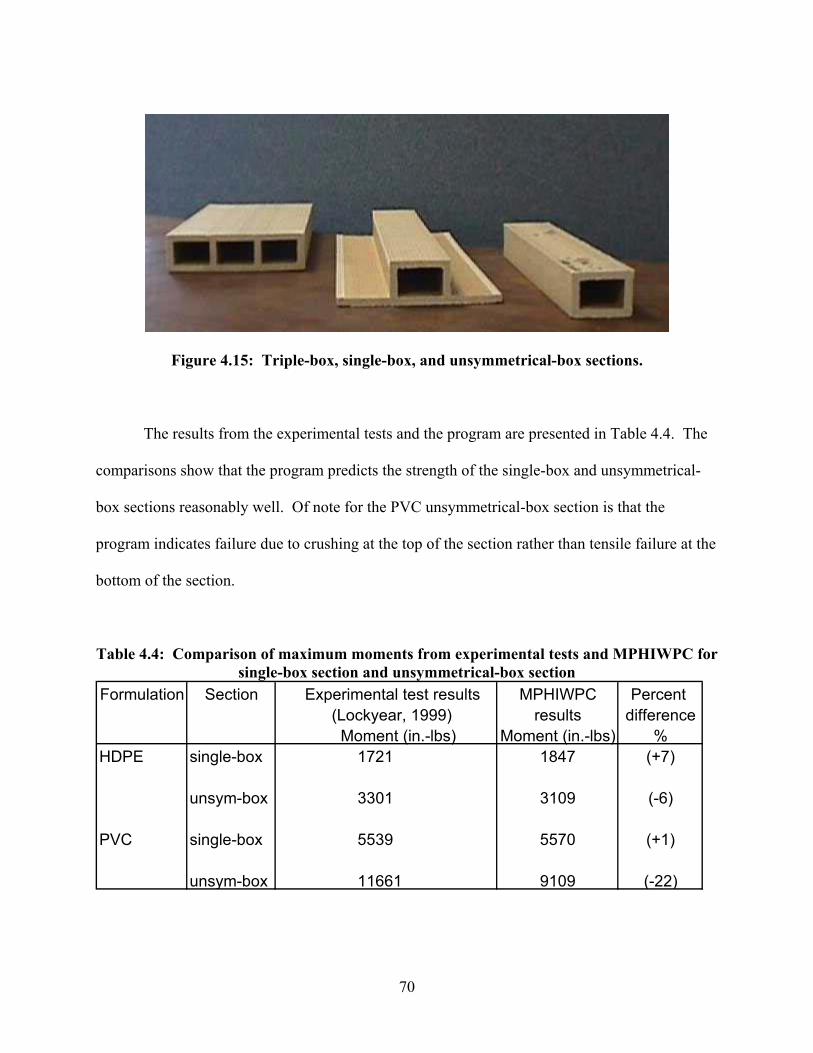
4.4.3 Comparison of Maximum Moments for Single-box and Unsymestric-box Sections
As a means of further evaluating the accuracy of the program, a comparison was made
between program MPHIWPC and previously conducted experimental test results for a single-box
section and an unsymmetrical-box section for both formulations of WPC materials (Lockyear,
1999). The maximum moments are the only results available for comparison. Each section was
cut from a triple-box section to produce the desired section shape. Figure 4.15 shows the triple-
box section, the single-box section, and the unsymmetrical-box section.
70
Figure 4.15: Triple-box, single-box, and unsymmetrical-box sections.
The results from the experimental tests and the program are presented in Table 4.4. The
comparisons show that the program predicts the strength of the single-box and unsymmetrical-
box sections reasonably well. Of note for the PVC unsymmetrical-box section is that the
program indicates failure due to crushing at the top of the section rather than tensile failure at the
bottom of the section.
Table 4.4: Comparison of maximum moments from experimental tests and MPHIWPC for single-box section and unsymmetrical-box section
Formulation Section Experimental test results MPHIWPC Percent (Lockyear, 1999) results difference Moment (in.-lbs) Moment (in.-lbs) %
HDPE single-box 1721 1847 (+7)
unsym-box 3301 3109 (-6)
PVC single-box 5539 5570 (+1)
unsym-box 11661 9109 (-22)

71
4.4.4 Comparison of Load-Displacement Results for Fiber Reinforced Sections
The strength and behavior of fiber reinforced WPC specimens were evaluated with the
program and compared to some limited reinforced section test results. The load-displacement
data from a reinforced double-box specimen is shown compared to the MPHIWPC load-
displacement output for the same section in Figure 4.16. The results show that the program
predicts very well the flexural response of reinforced WPC sections. At this time, the data from
the flexural test of the reinforced double-box section is the only reinforced data available for
comparison.
Load vs. Deflection (3-point bending double-box section)
0
100
200
300
400
500
600
0 0.1 0.2 0.3 0.4 0.5 0.6 0.7
deflection (in.)
Bending test results
Predicted behavior using MPHIWPC
Figure 4.16: Comparison of load-displacement curves for fiber reinforced section

72
4.5 Shifting of the Neutral Axis in WPC Sections
4.5.1 Unreinforced Near Full-size Sections
Because the WPC material is stronger in compression than tension, it would be expected
that the neutral axis would shift toward the top of the member as moment is increased. The
MPHIWPC program illustrates this change as a function of moment. Figures 4.17 and 4.18 show
the shift of the neutral axis as moment increases for both formulations for flat-wise and edge-
wise orientations, respectively. As tensile strains approach maximum values, tensile yielding of
the material causes differences in the rate of strain in the outer fibers of the section. This causes
the neutral axis to shift upward since the rate of compressive strain will lag the rate of tensile
strain due to the higher compressive strength when compared to tensile strength for both WPC
formulations.
Neutral Axis Depth vs. Moment (Flatwise)
0
0.2
0.4
0.6
0.8
1
1.2
1.4
1.6
1.8
0 2000 4000 6000 8000 10000 12000 14000
Moment (in.-lbs)
HDPE flatwise triple box section
PVC flatwise triple box section
Figure 4.17: Neutral axis shift in flat-wise sections

73
Neutral Axis Depth vs. Moment (Edgewise)
0
1
2
3
4
5
6
0 5000 10000 15000 20000 25000 30000 35000
Moment (in.-lbs)
HDPE edgewise triplebox section
PVC edgewise triple box section
Figure 4.18: Neutral axis shift in edge-wise sections
4.5.2 Fiber Reinforced Near Full-Size Sections
The program was also used to characterize the neutral axis position in reinforced sections.
Figure 4.19 shows the neutral axis shift with increase in moment for an HDPE reinforced double-
box section. The upward shift of the neutral axis at small moment values is consistent with
previous results for the nonreinforced section. This is because equal amounts of compressive
and tensile reinforcing are used in the member. The upward shift continues until the
compressive fiber reinforcement located near the top of the section buckles. The drop in the
neutral axis near 1500 in.-lbs is due to the buckling failure of the compressive fiber
reinforcement at this load. The downward trend near the maximum moment is due to the higher
total tensile strength with reinforcing now located only at the bottom of the section. This is

74
similar to the behavior of the unreinforced section near maximum moment where the neutral axis
shifts up due to higher compressive strength.
Neutral Axis vs. Moment
0
0.5
1
1.5
2
2.5
3
3.5
0 500 1000 1500 2000 2500 3000 3500 4000 4500 5000
moment in.-lbs)
HDPE Reinforced Double-box Section
Figure 4.19: Neutral axis shift in reinforced double-box section 4.6 Experimental Bending Tests to Investigate Neutral Axis Shift, Strain Distribution, and Failure Strains in WPC Sections
Experimental bending tests were conducted to further understand the neutral axis shifting,
the distribution of strain through the depth, and to compare failure strains in the WPC sections
with similar output from the program MPHIWPC. Two flat-wise and two edge-wise triple-box
sections of both formulations were instrumented with strain gages and tested in bending. The
tests were carried out in accordance with the loading configuration specified in Chapter 2 of this
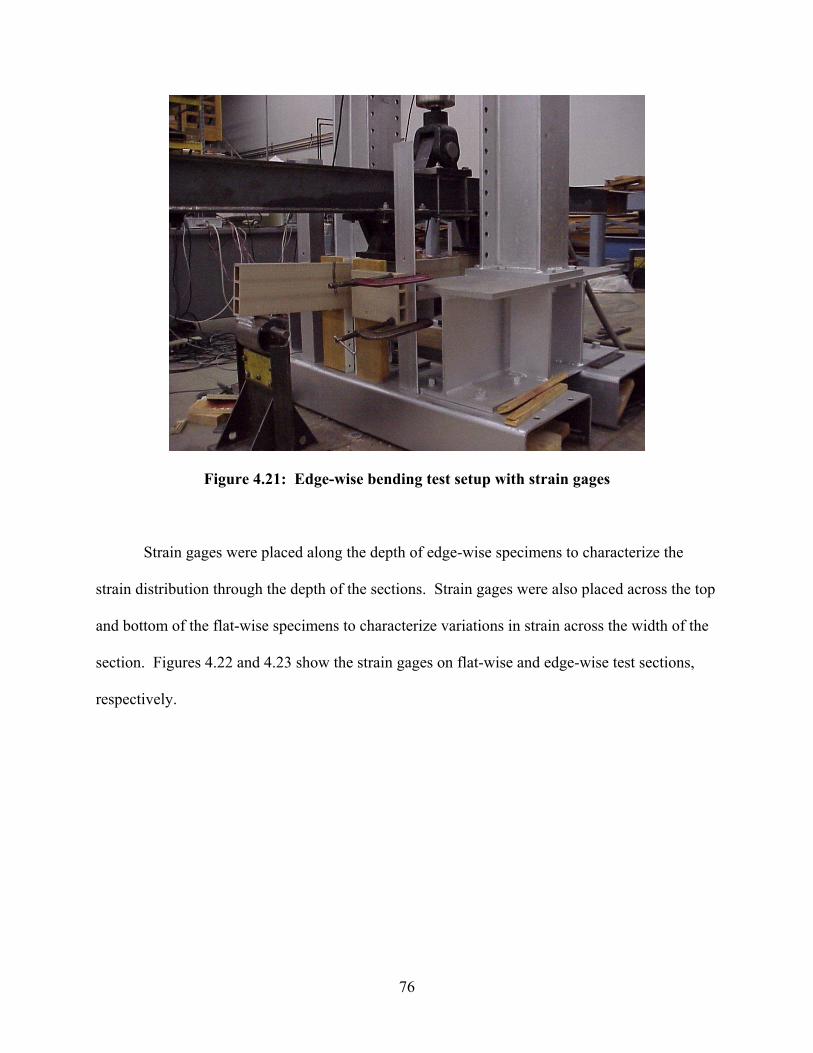
thesis for WPC flexural members. Figures 4.20 and 4.21 show the test setup for the flat-wise
and edge-wise tests, respectively. The span lengths were 30 inches for the flat-wise tests and 66
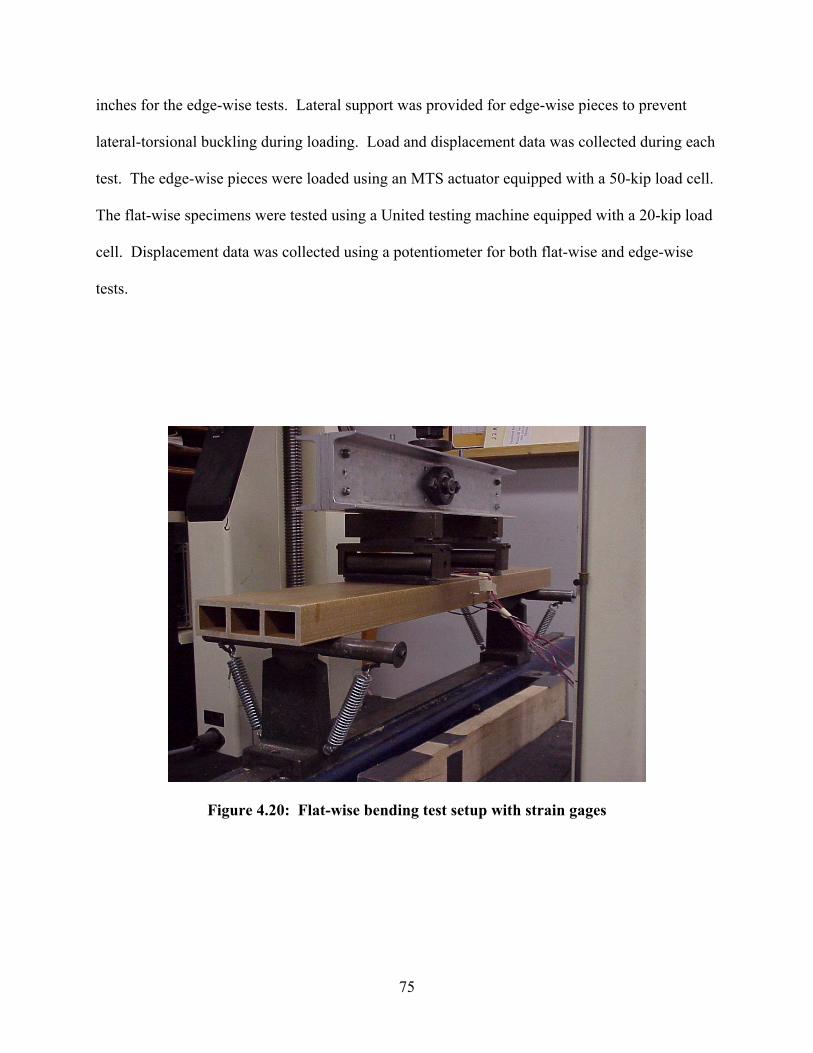
75
inches for the edge-wise tests. Lateral support was provided for edge-wise pieces to prevent
lateral-torsional buckling during loading. Load and displacement data was collected during each
test. The edge-wise pieces were loaded using an MTS actuator equipped with a 50-kip load cell.
The flat-wise specimens were tested using a United testing machine equipped with a 20-kip load
cell. Displacement data was collected using a potentiometer for both flat-wise and edge-wise
tests.
Figure 4.20: Flat-wise bending test setup with strain gages
76
Figure 4.21: Edge-wise bending test setup with strain gages
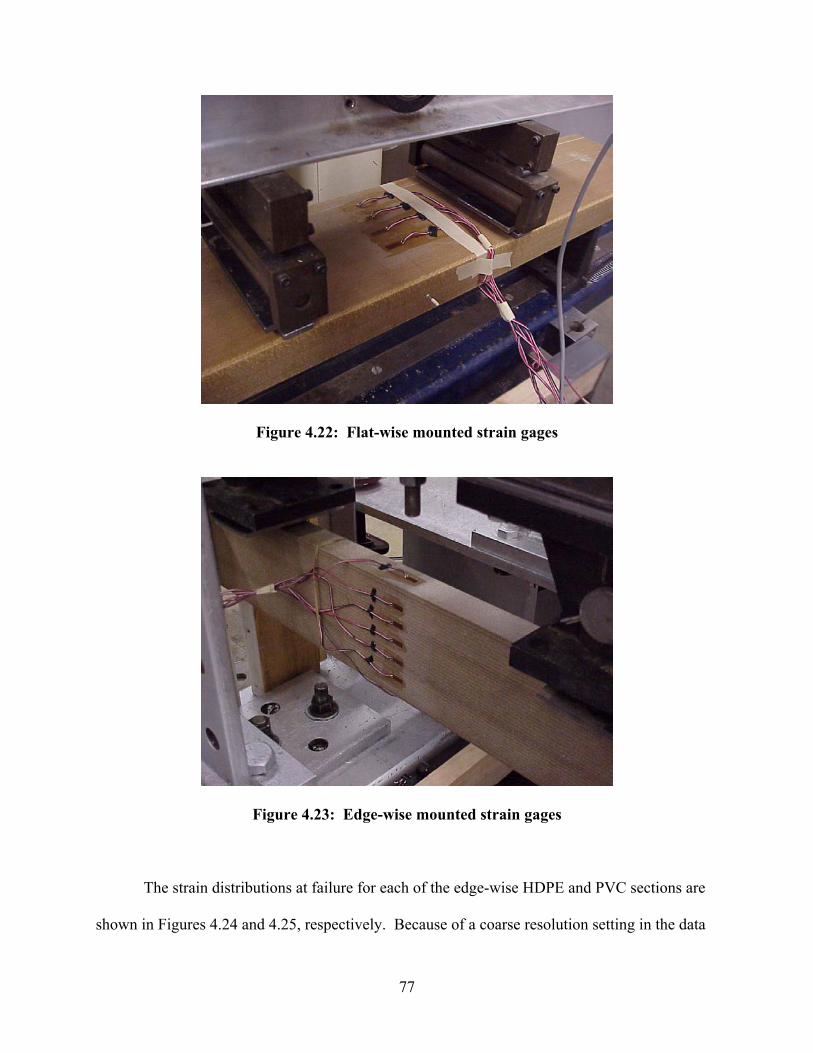
Strain gages were placed along the depth of edge-wise specimens to characterize the
strain distribution through the depth of the sections. Strain gages were also placed across the top
and bottom of the flat-wise specimens to characterize variations in strain across the width of the
section. Figures 4.22 and 4.23 show the strain gages on flat-wise and edge-wise test sections,
respectively.
77
Figure 4.22: Flat-wise mounted strain gages
Figure 4.23: Edge-wise mounted strain gages
The strain distributions at failure for each of the edge-wise HDPE and PVC sections are
shown in Figures 4.24 and 4.25, respectively. Because of a coarse resolution setting in the data
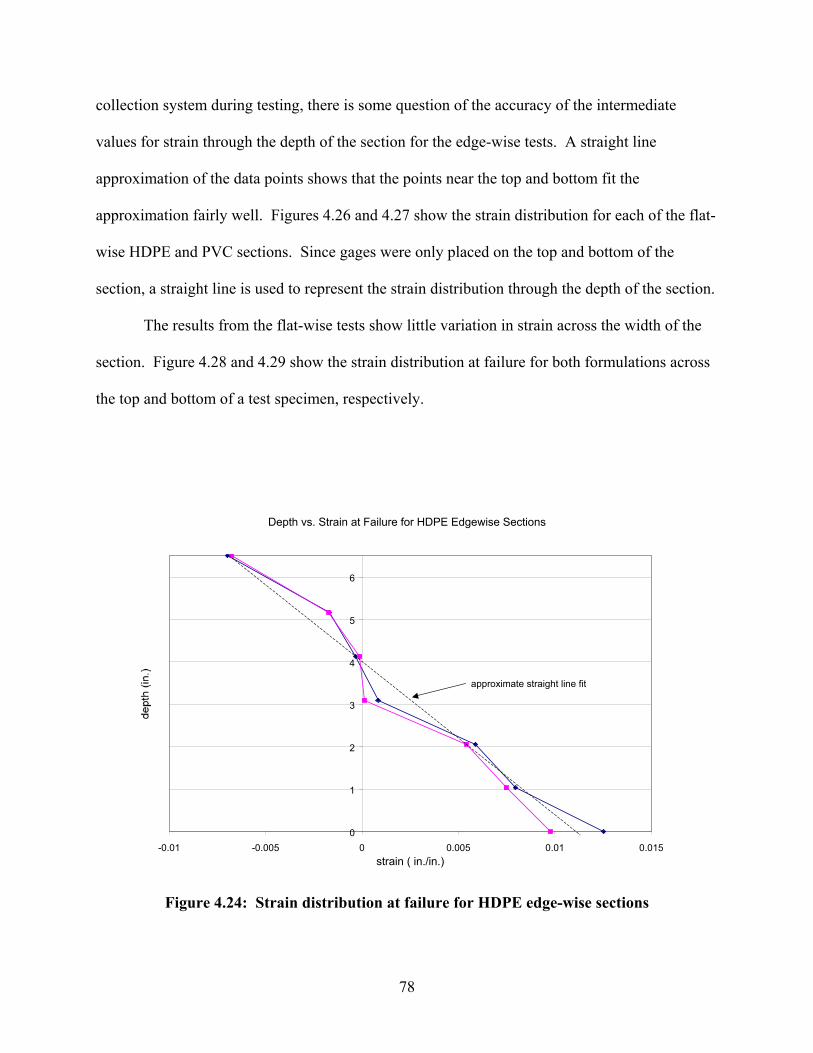
78
collection system during testing, there is some question of the accuracy of the intermediate
values for strain through the depth of the section for the edge-wise tests. A straight line
approximation of the data points shows that the points near the top and bottom fit the
approximation fairly well. Figures 4.26 and 4.27 show the strain distribution for each of the flat-
wise HDPE and PVC sections. Since gages were only placed on the top and bottom of the
section, a straight line is used to represent the strain distribution through the depth of the section.
The results from the flat-wise tests show little variation in strain across the width of the
section. Figure 4.28 and 4.29 show the strain distribution at failure for both formulations across
the top and bottom of a test specimen, respectively.
Depth vs. Strain at Failure for HDPE Edgewise Sections
0
1
2
3
4
5
6
-0.01 -0.005 0 0.005 0.01 0.015strain ( in./in.)
approximate straight line fit
Figure 4.24: Strain distribution at failure for HDPE edge-wise sections
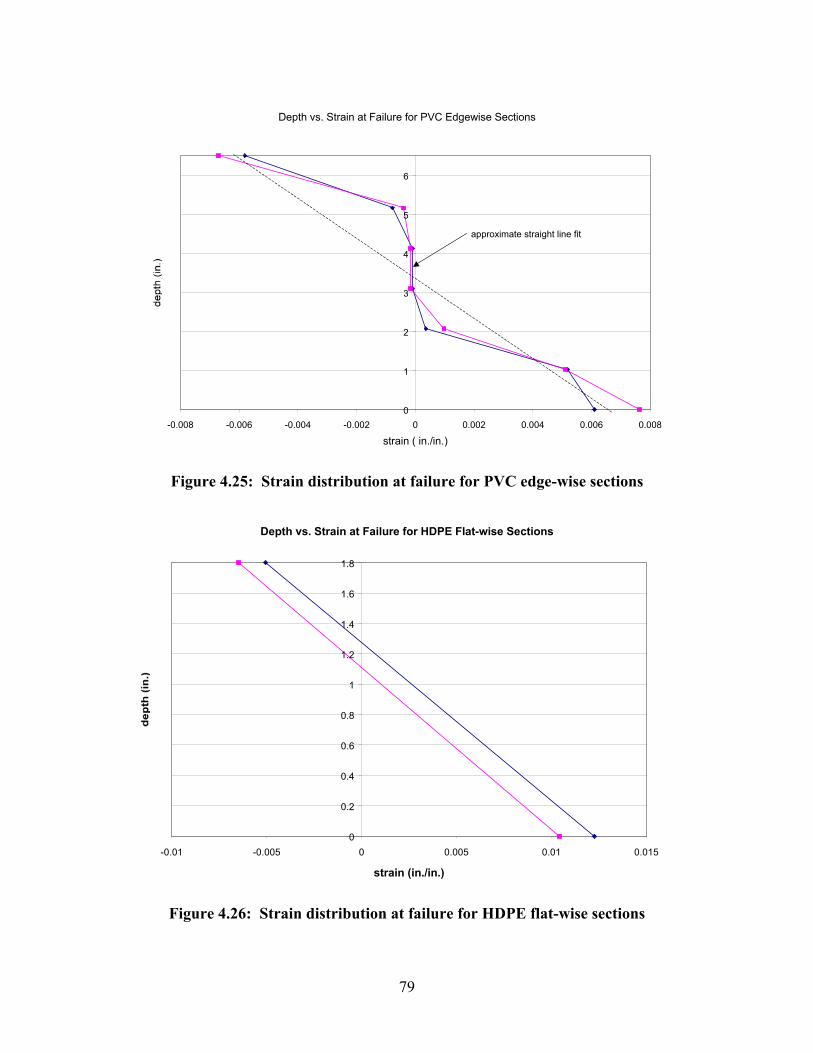
79
Depth vs. Strain at Failure for PVC Edgewise Sections
0
1
2
3
4
5
6
-0.008 -0.006 -0.004 -0.002 0 0.002 0.004 0.006 0.008
strain ( in./in.)
approximate straight line fit
Figure 4.25: Strain distribution at failure for PVC edge-wise sections
Depth vs. Strain at Failure for HDPE Flat-wise Sections
0
0.2
0.4
0.6
0.8
1
1.2
1.4
1.6
1.8
-0.01 -0.005 0 0.005 0.01 0.015
strain (in./in.)
Figure 4.26: Strain distribution at failure for HDPE flat-wise sections
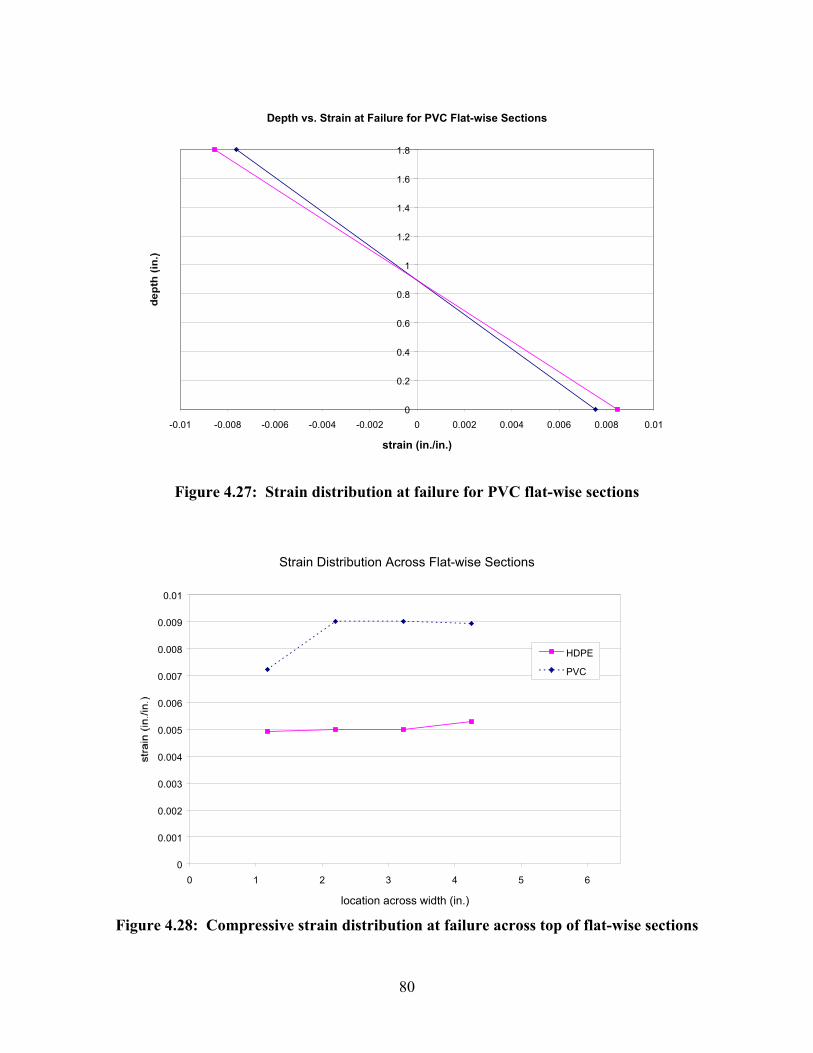
80
Depth vs. Strain at Failure for PVC Flat-wise Sections
0
0.2
0.4
0.6
0.8
1
1.2
1.4
1.6
1.8
-0.01 -0.008 -0.006 -0.004 -0.002 0 0.002 0.004 0.006 0.008 0.01
strain (in./in.)
Figure 4.27: Strain distribution at failure for PVC flat-wise sections
Strain Distribution Across Flat-wise Sections
0
0.001
0.002
0.003
0.004
0.005
0.006
0.007
0.008
0.009
0.01
0 1 2 3 4 5 6
location across width (in.)
HDPE
PVC
Figure 4.28: Compressive strain distribution at failure across top of flat-wise sections

81
Strain Distribution Across Flat-wise Sections
0
0.002
0.004
0.006
0.008
0.01
0.012
0 1 2 3 4 5 6
location across width (in.)
HDPE
PVC
Figure 4.29: Tensile strain distribution at failure across bottom of flat-wise sections
Table 4.5 shows a comparison of the recorded strains at failure for the experimental tests
to the maximum strains determined for the WPC material from coupon tests and used as strain
limits in the program MPHIWPC. The results show that the strains at failure in the experimental
tests are reasonably similar to the limiting strain values set for the WPC material. The difference
in maximum strains at failure between the experimental tests and those determined by Lockyear
were greater for the HDPE material.
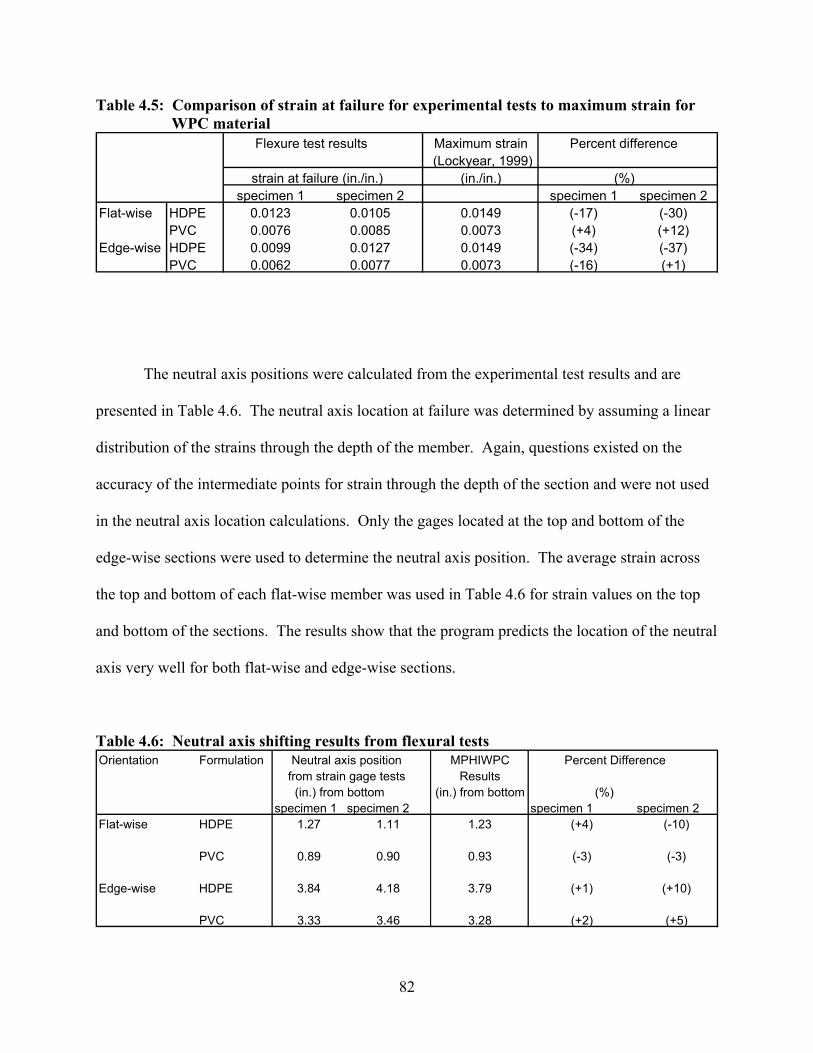
82
Table 4.5: Comparison of strain at failure for experimental tests to maximum strain for WPC material
Flexure test results Maximum strain Percent difference (Lockyear, 1999)
strain at failure (in./in.) (in./in.) (%)specimen 1 specimen 2 specimen 1 specimen 2
Flat-wise HDPE 0.0123 0.0105 0.0149 (-17) (-30)PVC 0.0076 0.0085 0.0073 (+4) (+12)
Edge-wise HDPE 0.0099 0.0127 0.0149 (-34) (-37)PVC 0.0062 0.0077 0.0073 (-16) (+1)
The neutral axis positions were calculated from the experimental test results and are
presented in Table 4.6. The neutral axis location at failure was determined by assuming a linear
distribution of the strains through the depth of the member. Again, questions existed on the
accuracy of the intermediate points for strain through the depth of the section and were not used
in the neutral axis location calculations. Only the gages located at the top and bottom of the
edge-wise sections were used to determine the neutral axis position. The average strain across
the top and bottom of each flat-wise member was used in Table 4.6 for strain values on the top
and bottom of the sections. The results show that the program predicts the location of the neutral
axis very well for both flat-wise and edge-wise sections.
Table 4.6: Neutral axis shifting results from flexural tests Orientation Formulation Neutral axis position MPHIWPC Percent Difference
from strain gage tests Results (in.) from bottom (in.) from bottom (%)specimen 1 specimen 2 specimen 1 specimen 2
Flat-wise HDPE 1.27 1.11 1.23 (+4) (-10)
PVC 0.89 0.90 0.93 (-3) (-3)
Edge-wise HDPE 3.84 4.18 3.79 (+1) (+10)
PVC 3.33 3.46 3.28 (+2) (+5)
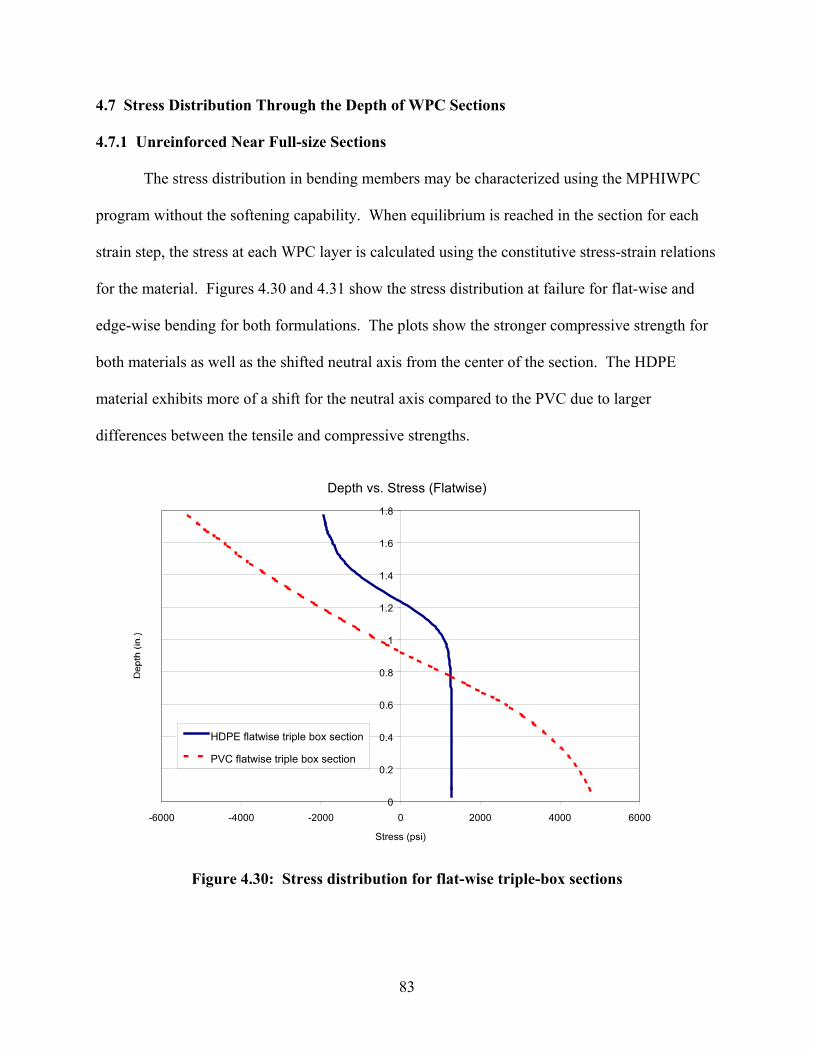
83
4.7 Stress Distribution Through the Depth of WPC Sections 4.7.1 Unreinforced Near Full-size Sections
The stress distribution in bending members may be characterized using the MPHIWPC
program without the softening capability. When equilibrium is reached in the section for each
strain step, the stress at each WPC layer is calculated using the constitutive stress-strain relations
for the material. Figures 4.30 and 4.31 show the stress distribution at failure for flat-wise and
edge-wise bending for both formulations. The plots show the stronger compressive strength for
both materials as well as the shifted neutral axis from the center of the section. The HDPE
material exhibits more of a shift for the neutral axis compared to the PVC due to larger
differences between the tensile and compressive strengths.
Depth vs. Stress (Flatwise)
0
0.2
0.4
0.6
0.8
1
1.2
1.4
1.6
1.8
-6000 -4000 -2000 0 2000 4000 6000
Stress (psi)
HDPE flatwise triple box section
PVC flatwise triple box section
Figure 4.30: Stress distribution for flat-wise triple-box sections
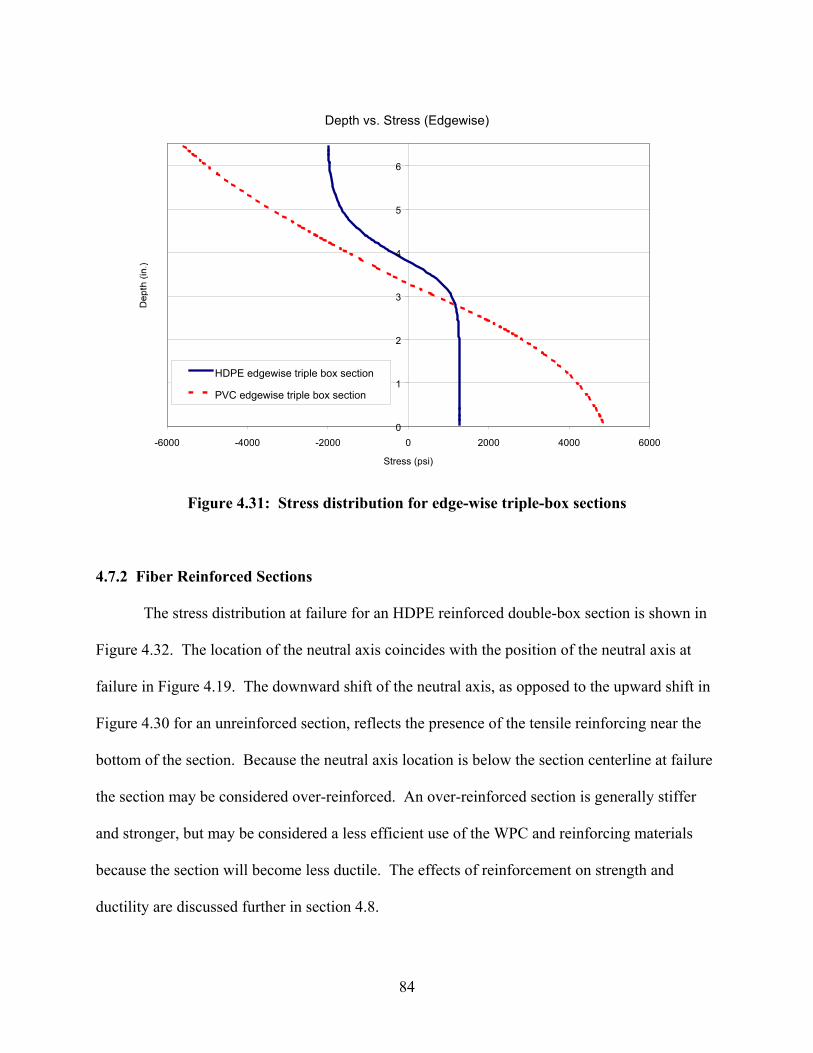
84
Depth vs. Stress (Edgewise)
0
1
2
3
4
5
6
-6000 -4000 -2000 0 2000 4000 6000
Stress (psi)
HDPE edgewise triple box section
PVC edgewise triple box section
Figure 4.31: Stress distribution for edge-wise triple-box sections
4.7.2 Fiber Reinforced Sections
The stress distribution at failure for an HDPE reinforced double-box section is shown in
Figure 4.32. The location of the neutral axis coincides with the position of the neutral axis at
failure in Figure 4.19. The downward shift of the neutral axis, as opposed to the upward shift in
Figure 4.30 for an unreinforced section, reflects the presence of the tensile reinforcing near the
bottom of the section. Because the neutral axis location is below the section centerline at failure
the section may be considered over-reinforced. An over-reinforced section is generally stiffer
and stronger, but may be considered a less efficient use of the WPC and reinforcing materials
because the section will become less ductile. The effects of reinforcement on strength and
ductility are discussed further in section 4.8.

85
Depth vs. Stress
0
0.5
1
1.5
2
2.5
3
3.5
-2500 -2000 -1500 -1000 -500 0 500 1000 1500 2000 2500
stress (psi)
HDPE Reinforced Double-box Section
Figure 4.32: Stress distribution in reinforced double-box section
4.8 Effects of Reinforcement Quantity on Strength and Ductility for WPC Sections
The program enables comparison of bending strength and ductility for different quantities
of reinforcing in WPC sections. The modified program with the softening capability was used to
analyze a double-box section with various amounts of reinforcement for HDPE and PVC
formulations. Figures 4.33 and 4.34 show the load-displacement results for the reinforced
double-box sections. For an HDPE section, as the amount of reinforcing for both tension and
compression is increased from one layer through four layers, the maximum load increases while
the maximum displacement decreases. This is because the HDPE material is near the point of
tensile yielding with only one layer of reinforcement. With more than one layer of tensile
reinforcing the section becomes stiffer and will carry more load, but ductility is lost because a
compressive failure at the top of the section occurs and the section is essentially over-reinforced.

86
For the PVC sections, as the reinforcing area increases the maximum load and maximum
displacement also increase. This is expected for the PVC formulation because it exhibits similar
stiffness in tension and compression and because the material shows little apparent yielding near
failure.
Load vs. Deflection (3-point bending double-box section)
0
100
200
300
400
500
600
700
800
0 0.2 0.4 0.6 0.8 1 1.2
deflection (in.)
4 Layers
3 Layers
2 Layers
1 Layer
unreinforced
Figure 4.33: Load-displacement for various quantities of reinforcing for HDPE double-box
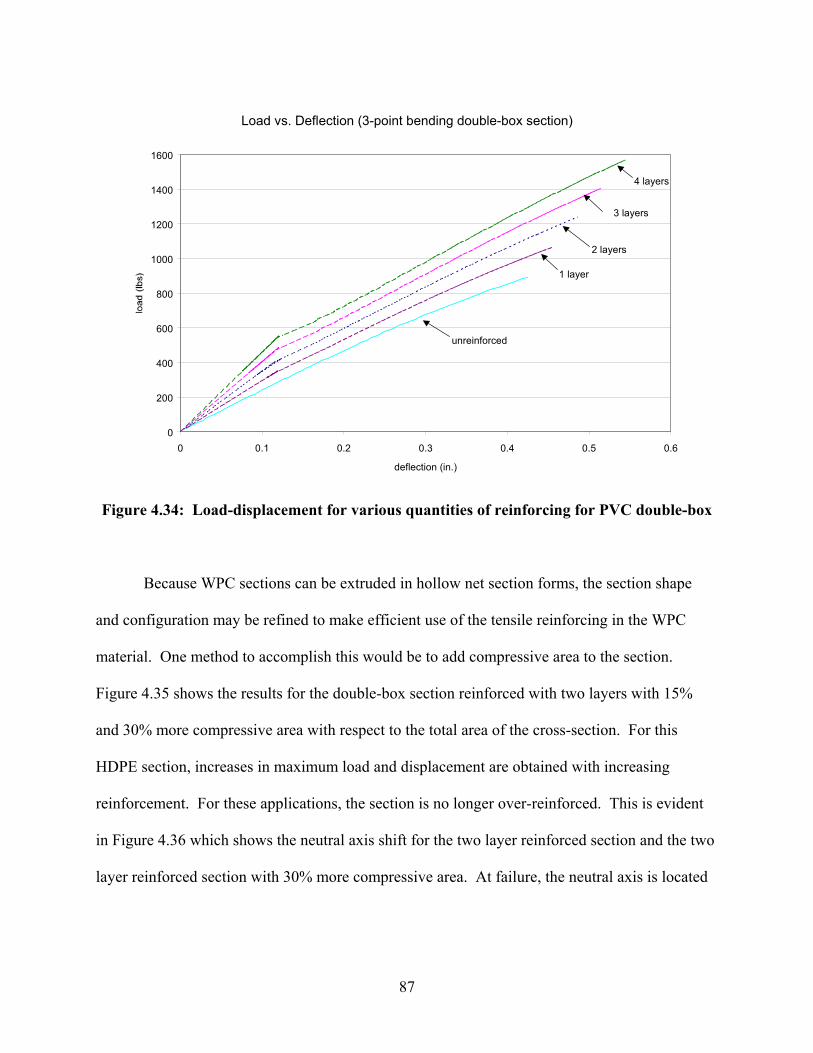
87
Load vs. Deflection (3-point bending double-box section)
0
200
400
600
800
1000
1200
1400
1600
0 0.1 0.2 0.3 0.4 0.5 0.6
deflection (in.)
unreinforced
1 layer
2 layers
3 layers
4 layers
Figure 4.34: Load-displacement for various quantities of reinforcing for PVC double-box
Because WPC sections can be extruded in hollow net section forms, the section shape
and configuration may be refined to make efficient use of the tensile reinforcing in the WPC
material. One method to accomplish this would be to add compressive area to the section.
Figure 4.35 shows the results for the double-box section reinforced with two layers with 15%
and 30% more compressive area with respect to the total area of the cross-section. For this
HDPE section, increases in maximum load and displacement are obtained with increasing
reinforcement. For these applications, the section is no longer over-reinforced. This is evident
in Figure 4.36 which shows the neutral axis shift for the two layer reinforced section and the two
layer reinforced section with 30% more compressive area. At failure, the neutral axis is located
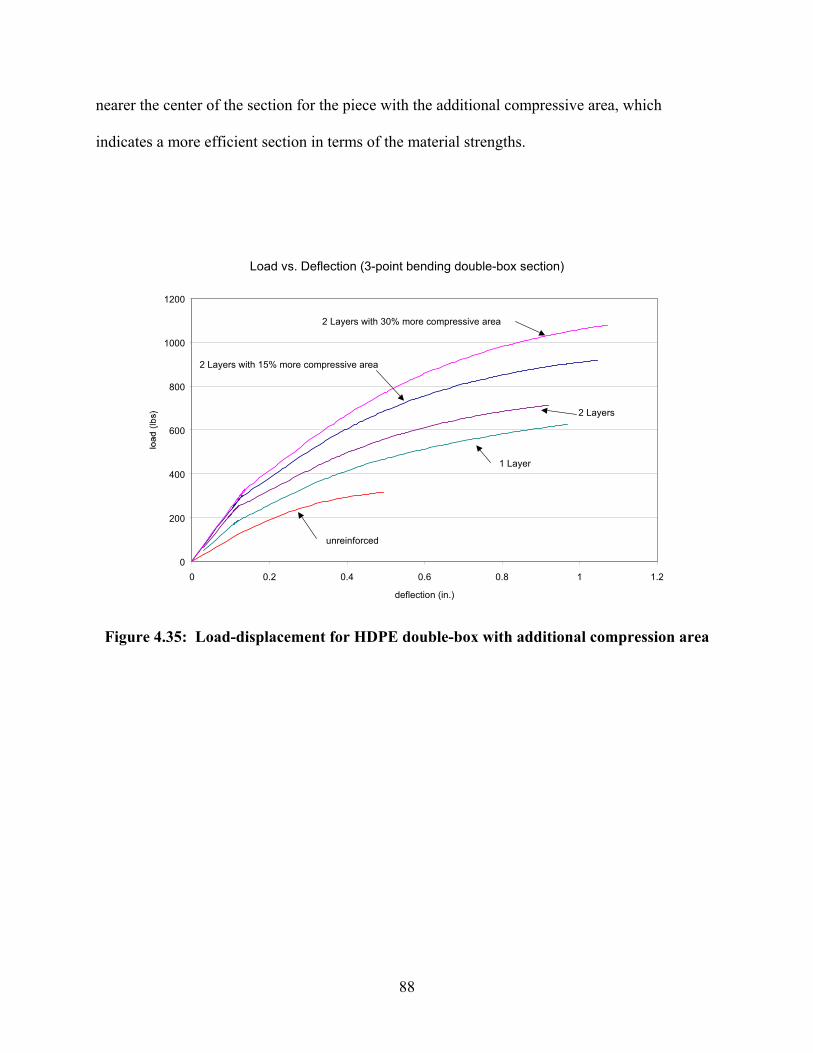
88
nearer the center of the section for the piece with the additional compressive area, which
indicates a more efficient section in terms of the material strengths.
Load vs. Deflection (3-point bending double-box section)
0
200
400
600
800
1000
1200
0 0.2 0.4 0.6 0.8 1 1.2
deflection (in.)
2 Layers with 30% more compressive area
2 Layers with 15% more compressive area
2 Layers
1 Layer
unreinforced
Figure 4.35: Load-displacement for HDPE double-box with additional compression area
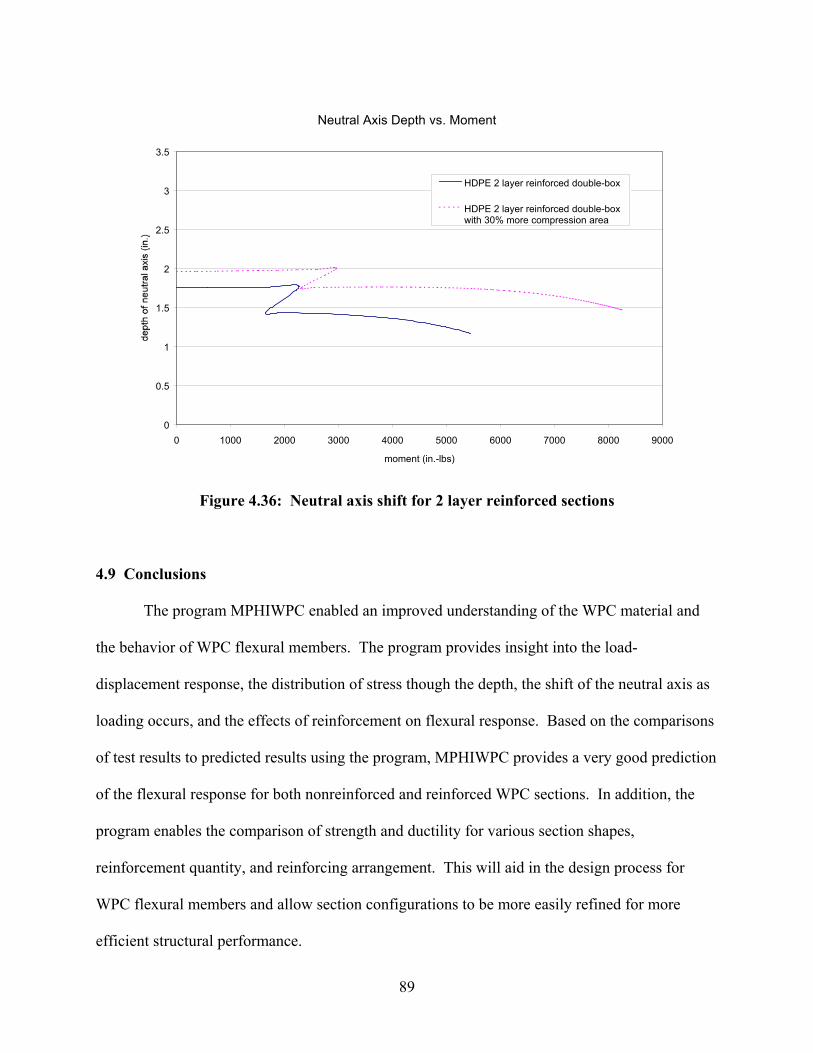
89
Neutral Axis Depth vs. Moment
0
0.5
1
1.5
2
2.5
3
3.5
0 1000 2000 3000 4000 5000 6000 7000 8000 9000
moment (in.-lbs)
HDPE 2 layer reinforced double-box
HDPE 2 layer reinforced double-boxwith 30% more compression area
Figure 4.36: Neutral axis shift for 2 layer reinforced sections
4.9 Conclusions
The program MPHIWPC enabled an improved understanding of the WPC material and
the behavior of WPC flexural members. The program provides insight into the load-
displacement response, the distribution of stress though the depth, the shift of the neutral axis as
loading occurs, and the effects of reinforcement on flexural response. Based on the comparisons
of test results to predicted results using the program, MPHIWPC provides a very good prediction
of the flexural response for both nonreinforced and reinforced WPC sections. In addition, the
program enables the comparison of strength and ductility for various section shapes,
reinforcement quantity, and reinforcing arrangement. This will aid in the design process for
WPC flexural members and allow section configurations to be more easily refined for more
efficient structural performance.

90
The comparison of flexural test results for coupon specimens to program predictions
indicates that possible causes for the differences in strength may be due to size effects, shape
effects due to section geometry, and production effects during extrusion. To investigate size and
geometry effects on strength, the program was modified to allow the WPC material to soften
upon reaching the ultimate strains. Since coupon section are solid they may be expected to
redistribute stress more than hollow net sections. The results showed that the program can
predict fairly well the behavior of solid PVC coupon section with the material softening
capability incorporated in the program. However, program results for the HDPE coupon section
continued to show significant differences in strength and displacements from the experimental
test data. These differences may be the result of the inability of the program to capture the
effects of plastic hinge formation in the HDPE material, or they may be due to production effects
during extrusion of the sections.
91
CHAPTER 5
ASSIGNMENT OF ALLOWABLE WOOD-PLASTIC COMPOSITE
DESIGN VALUES
5.1 Abstract
This chapter outlines proposed procedures for determination of allowable design values
for the design of wood-plastic composite (WPC) structural members. The proposed procedures
are applied to experimental results obtained from tests of near full-size WPC specimens to obtain
allowable design values for high-density polyethylene (HPDE) and polyvinyl chloride (PVC)
formulations. These allowable design values were used in the design of prototype components
for the demonstration applications of this project.
5.2 Introduction
Other ongoing activities in this project have included development of a draft set of
ASTM standard procedures for assignment of design values for WPC (draft D WPC, 1999)
materials. The proposed specifications were adapted from traditional timber design value
assignment procedures. Allowable design values were determined for HDPE and PVC
formulations using the results of tests performed on a limited number of near full-size specimens.
The HDPE formulation consisted of 70% wood and 30% HDPE and the PVC formulation
consisted of 50% wood and 50% PVC. The allowable design values established in this chapter
were intended for use only in demonstration projects of this research. However, the procedures
used to develop the allowable design values do provide guidance for future use in determining
design values for use in the design of WPC components.
92
5.3 Characteristic Design Values
The proposed standard suggests using a nonparametric lower fifth percentile tolerance
limit, with 75 percent confidence as a characteristic design value, and requires a minimum of 28
test specimens (ASTM D 2915 section 3.4.3.1). Using this method the lower fifth percentile is
estimated as the smallest or weakest value from the 28 test specimens. To obtain a lower fifth
percentile tolerance limit for a fewer number of tests, a parametric one-sided tolerance limit
method may be used with an assumption of normally distributed data (ASTM D 2915 section
3.4.3.2). This method varies from the proposed procedure in that the characteristic design value,
B, is affected by the variance observed in the material. Using the parametric one-sided method,
the characteristic design values for bending (Fb), shear (Fv), compression perpendicular to
extrusion (Fc-perp), and compression parallel to extrusion (Fc-par) may be calculated using the
following equation:
−=
xskxxB (1)
Where:
B = Characteristic design value;
x = mean value of specimen tests;
k = confidence level factor (ASTM D 2915 Table 3); and
s = standard deviation of specimen values
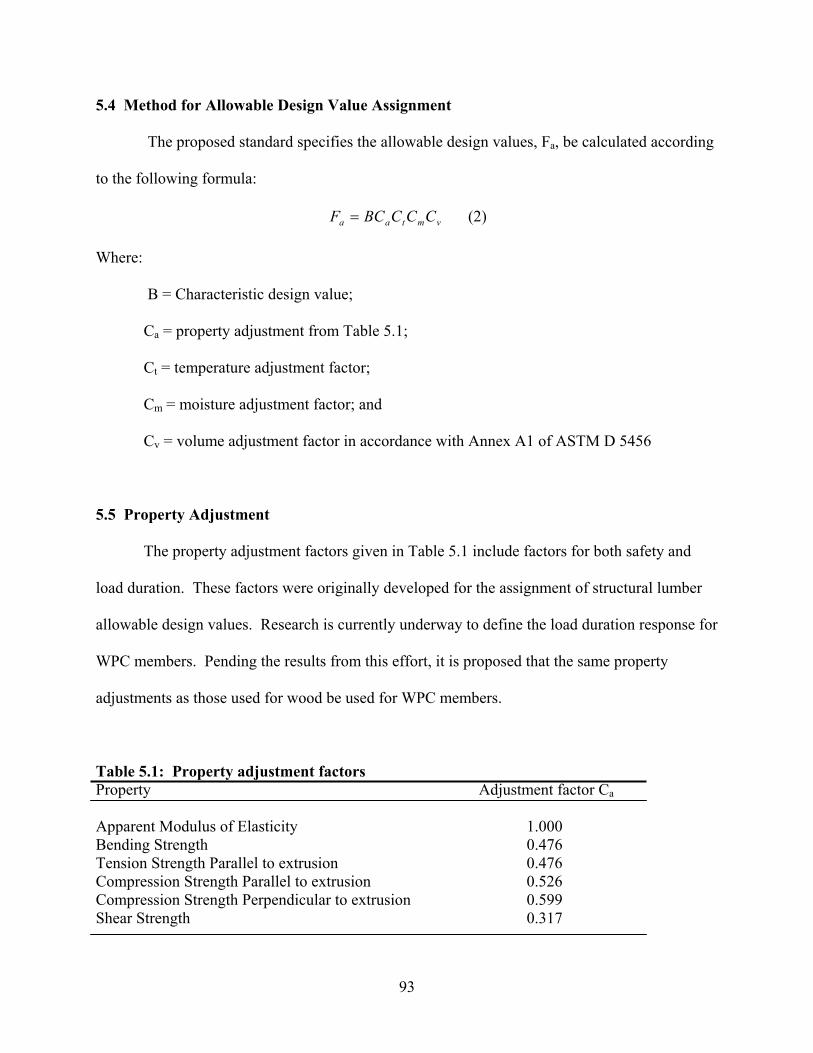
93
5.4 Method for Allowable Design Value Assignment
The proposed standard specifies the allowable design values, Fa, be calculated according
to the following formula:
vmtaa CCCBCF = (2)
Where:
B = Characteristic design value;
Ca = property adjustment from Table 5.1;
Ct = temperature adjustment factor;
Cm = moisture adjustment factor; and
Cv = volume adjustment factor in accordance with Annex A1 of ASTM D 5456
5.5 Property Adjustment
The property adjustment factors given in Table 5.1 include factors for both safety and
load duration. These factors were originally developed for the assignment of structural lumber
allowable design values. Research is currently underway to define the load duration response for
WPC members. Pending the results from this effort, it is proposed that the same property
adjustments as those used for wood be used for WPC members.
Table 5.1: Property adjustment factors Property Adjustment factor Ca Apparent Modulus of Elasticity 1.000 Bending Strength 0.476 Tension Strength Parallel to extrusion 0.476 Compression Strength Parallel to extrusion 0.526 Compression Strength Perpendicular to extrusion 0.599 Shear Strength 0.317
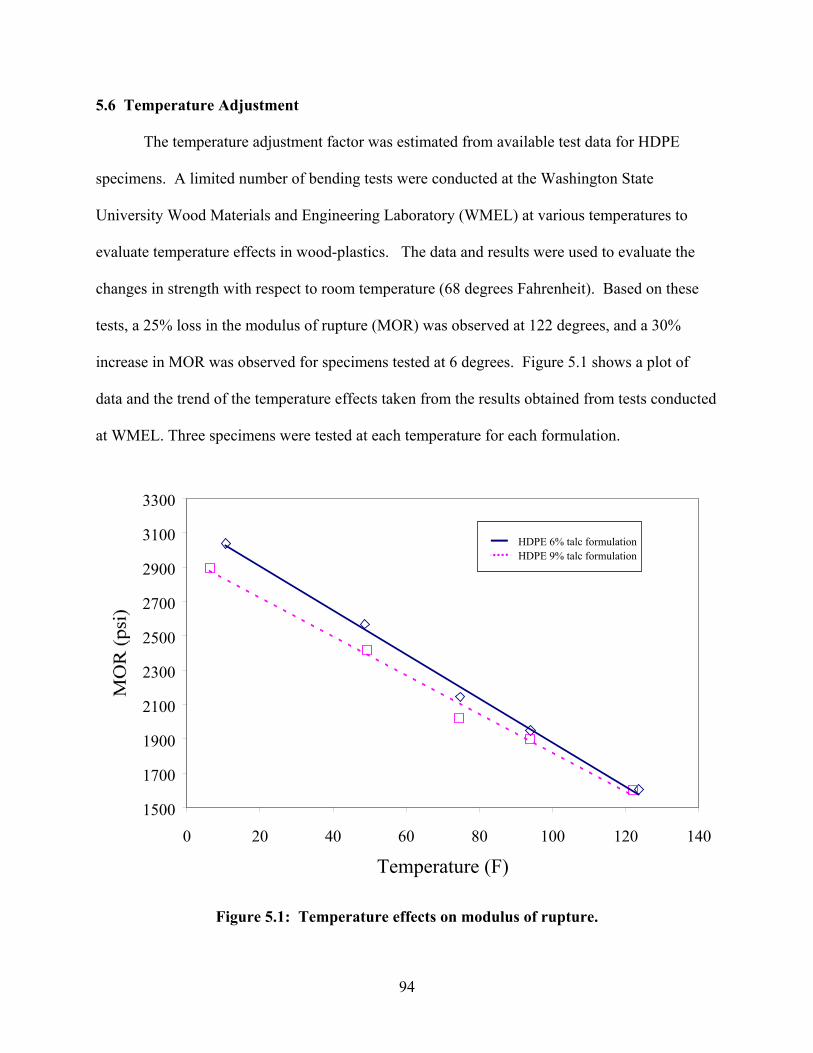
94
5.6 Temperature Adjustment
The temperature adjustment factor was estimated from available test data for HDPE
specimens. A limited number of bending tests were conducted at the Washington State
University Wood Materials and Engineering Laboratory (WMEL) at various temperatures to
evaluate temperature effects in wood-plastics. The data and results were used to evaluate the
changes in strength with respect to room temperature (68 degrees Fahrenheit). Based on these
tests, a 25% loss in the modulus of rupture (MOR) was observed at 122 degrees, and a 30%
increase in MOR was observed for specimens tested at 6 degrees. Figure 5.1 shows a plot of
data and the trend of the temperature effects taken from the results obtained from tests conducted
at WMEL. Three specimens were tested at each temperature for each formulation.
1500
1700
1900
2100
2300
2500
2700
2900
3100
3300
0 20 40 60 80 100 120 140
Temperature (F)
HDPE 6% talc formulationHDPE 9% talc formulation
Figure 5.1: Temperature effects on modulus of rupture.

95
Table 5.2 lists proposed factors for adjusting strength due to temperature effects for
various ranges of temperatures expected in service. The draft standard maintains that the
adjustment factor found for bending strength may be used for all strength properties for which
design values are to be assigned. Of note is the fact that the 25 percent loss in strength at high
temperature is similar to the adjustment factor used for wood members at similar temperatures.
Table 5.2: Temperature adjustment factors for strength Temperature Adjustment, Ct
In Service Expected Ct
Temperature Exposure ( Degrees F )
T < 100 0.85 100 < T < 130 0.75 130 < T < 150 0.6
5.7 Moist Service Adjustment
Currently, it is the judgement of other researchers involved in the materials development
portion of this project that moisture effects in the above-water components of a WPC fendering
system will be minimal. Hence, no moisture factor was applied to the characteristic design
values of this report.
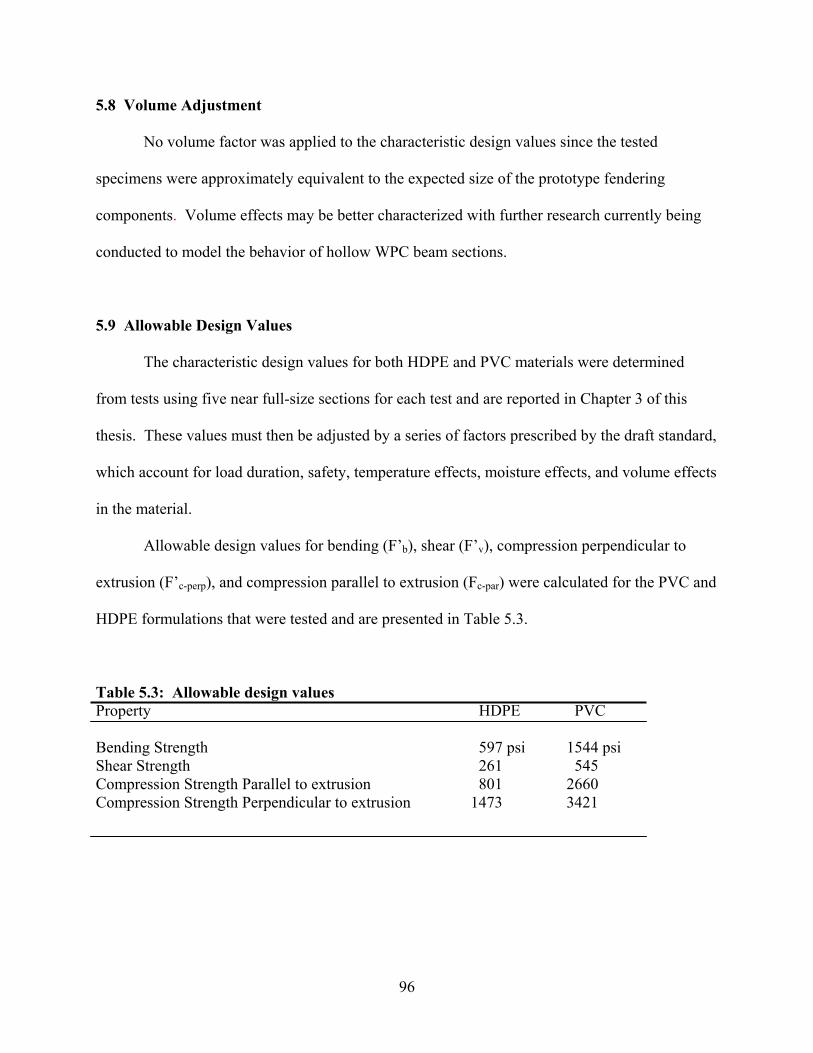
96
5.8 Volume Adjustment
No volume factor was applied to the characteristic design values since the tested
specimens were approximately equivalent to the expected size of the prototype fendering
components. Volume effects may be better characterized with further research currently being
conducted to model the behavior of hollow WPC beam sections.
5.9 Allowable Design Values
The characteristic design values for both HDPE and PVC materials were determined
from tests using five near full-size sections for each test and are reported in Chapter 3 of this
thesis. These values must then be adjusted by a series of factors prescribed by the draft standard,
which account for load duration, safety, temperature effects, moisture effects, and volume effects
in the material.
Allowable design values for bending (F’b), shear (F’v), compression perpendicular to
extrusion (F’c-perp), and compression parallel to extrusion (Fc-par) were calculated for the PVC and
HDPE formulations that were tested and are presented in Table 5.3.
Table 5.3: Allowable design values Property HDPE PVC Bending Strength 597 psi 1544 psi Shear Strength 261 545 Compression Strength Parallel to extrusion 801 2660 Compression Strength Perpendicular to extrusion 1473 3421
97
5.10 Conclusions
Allowable design values for HDPE and PVC material formulations were established
using test data from tests conducted on near full-size WPC specimens. The proposed
nonparametric lower fifth percentile tolerance limit procedure, with 75 percent confidence as a
characteristic design value, was substituted with a parametric one-sided tolerance limit method
with an assumption of normally distributed data. This was done due to an insufficient number of
test specimens to fully carry out the proposed procedures.
Characteristic design values for strength were determined using the substitute procedure
and were adjusted for safety, load duration, and temperature. No adjustments were made for
moisture or volume effects. The allowable design values are presented in Table 5.3. These
allowable design values were used in the design of prototype components for demonstration
applications of this project.
98
CHAPTER 6
ANALYSIS AND DESIGN OF WOOD-PLASTIC DECKBOARD SECTION
6.1 Abstract
This chapter is a summary of the analysis and design of the decking system at the
Newport Naval Undersea Weapons Center (NUWC) Pier 171. The deck is to be replaced as a
demonstration project for the wood-plastic composite (WPC) material. The objectives were to
analyze the decking and the support system while subjected to specific load requirements then,
using design values determined from material testing and design value assignment procedures,
provide information needed for the deckboard section design.
6.2 Introduction
Appropriate structural models were developed to determine the demand expected for the
deckboards. Figure 6.1 shows the pier deck and some of the supporting structural elements. The
boards were modeled as beam elements using the computer program COSMOS/M version 2.00
to account for shear effects in the material (Figure 6.2). As a means of verification, a plane
stress analysis was also performed and conveyed results within ten percent of the beam element
model. The plane stress model was also done using COSMOS/M version 2.00 (Figure 6.3). The
material properties of the polyvinyl chloride (PVC) wood composite material were used in the
analysis since this is the most likely candidate material for the deckboards.
The load requirements for the deck surface are as follows:
• 600 psf anywhere on the deck surface; and
• 16000 lbs single wheel load from a forklift.
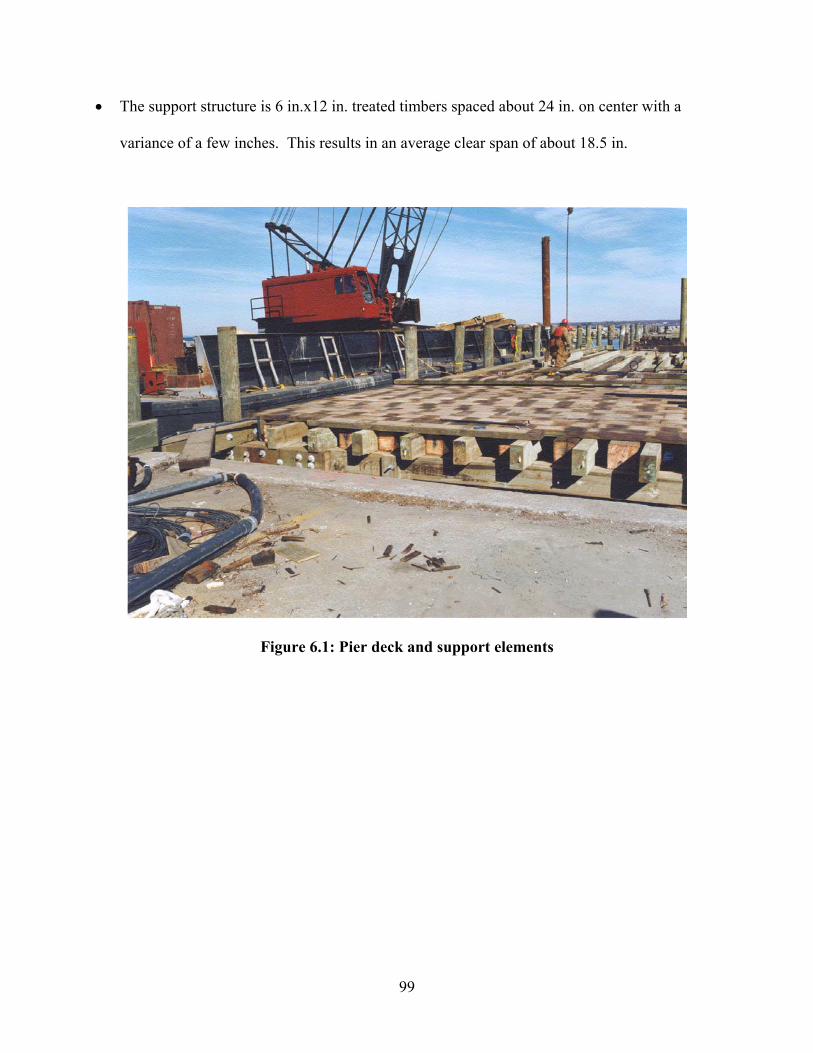
99
• The support structure is 6 in.x12 in. treated timbers spaced about 24 in. on center with a
variance of a few inches. This results in an average clear span of about 18.5 in.
Figure 6.1: Pier deck and support elements
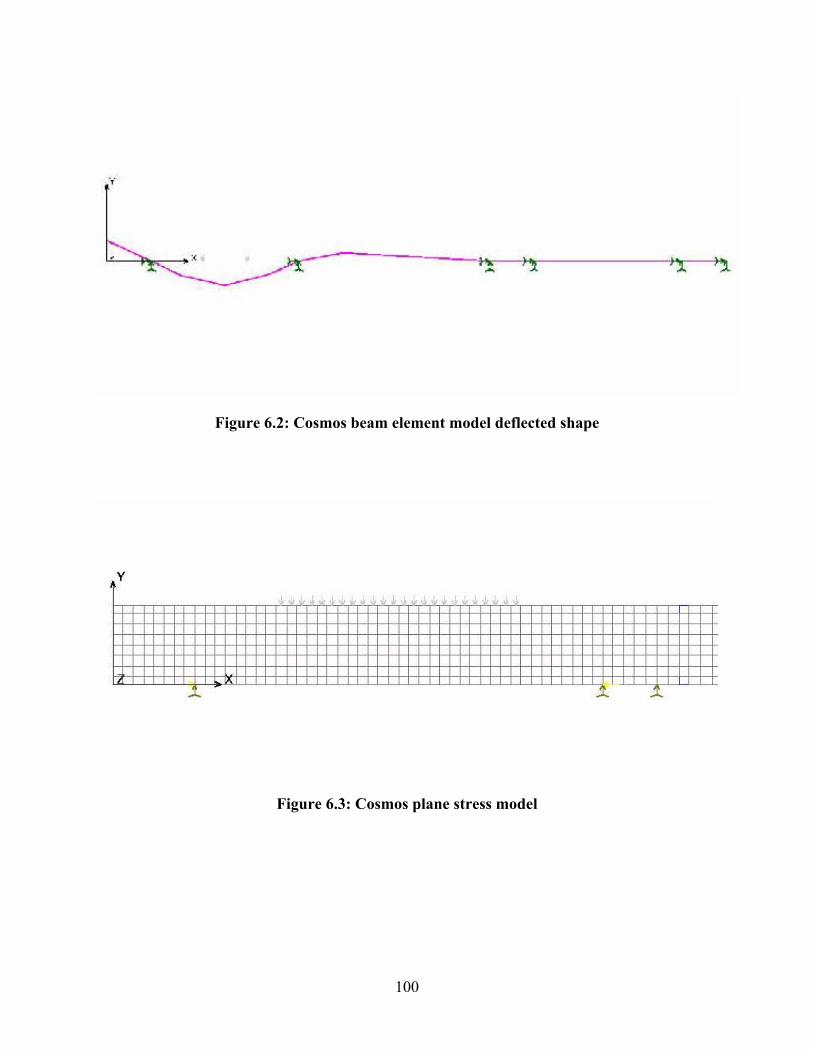
100
Figure 6.2: Cosmos beam element model deflected shape
Figure 6.3: Cosmos plane stress model
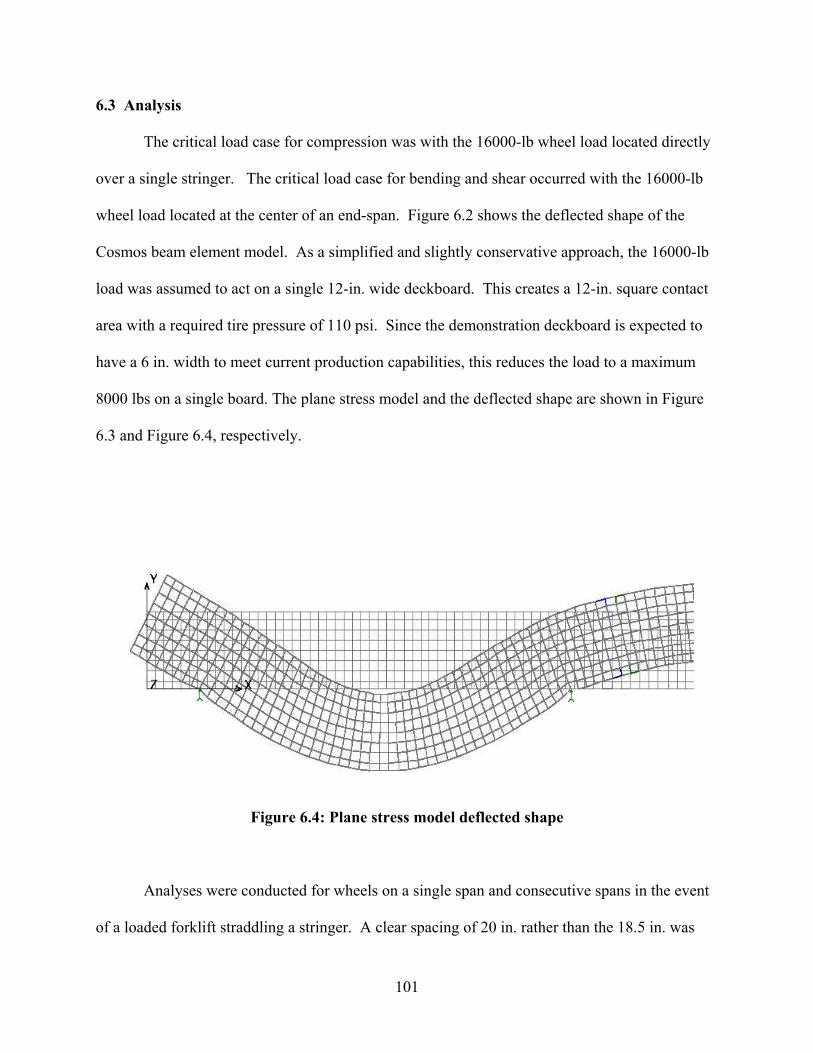
101
6.3 Analysis
The critical load case for compression was with the 16000-lb wheel load located directly
over a single stringer. The critical load case for bending and shear occurred with the 16000-lb
wheel load located at the center of an end-span. Figure 6.2 shows the deflected shape of the
Cosmos beam element model. As a simplified and slightly conservative approach, the 16000-lb
load was assumed to act on a single 12-in. wide deckboard. This creates a 12-in. square contact
area with a required tire pressure of 110 psi. Since the demonstration deckboard is expected to
have a 6 in. width to meet current production capabilities, this reduces the load to a maximum
8000 lbs on a single board. The plane stress model and the deflected shape are shown in Figure
6.3 and Figure 6.4, respectively.
Figure 6.4: Plane stress model deflected shape
Analyses were conducted for wheels on a single span and consecutive spans in the event
of a loaded forklift straddling a stringer. A clear spacing of 20 in. rather than the 18.5 in. was

102
used to account for variability in the spacing of the stringers. The stringers were modeled as two
pin supports 6 in. apart to simulate the bending of the planks over the stringer corners. However,
since the spikes used to fasten the deckboards to the stringers are not expected to provide uplift
resistance, the deckboard was not restrained with pin supports at exterior stringer edges of the
loaded span (See Figure 6.2). The maximum loads and stresses from the analysis are shown in
Table 6.1. Figure 6.5 shows the normal stresses from the plane stress analysis and Figure 6.6
shows the shear stresses from the plane stress analysis.
Table 6.1: Loads, stresses, and allowable design stresses
Load Stress Allowable Design Stress Moment 21,000 in.-lbs 1706 psi 1747 psi Shear 4000 lb 506 psi 580 psi Comp. Perp. 8000 lb 484 psi 1985 psi
Figure 6.5: Flexural stresses from plane stress model
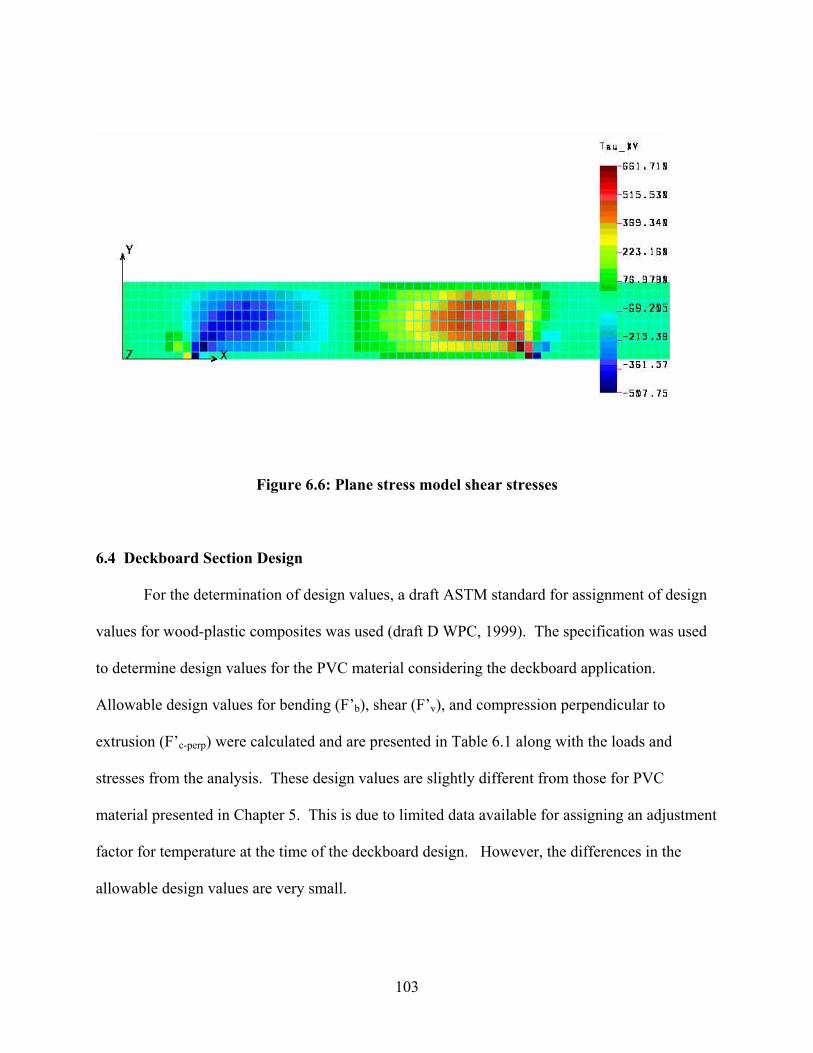
103
Figure 6.6: Plane stress model shear stresses
6.4 Deckboard Section Design
For the determination of design values, a draft ASTM standard for assignment of design
values for wood-plastic composites was used (draft D WPC, 1999). The specification was used
to determine design values for the PVC material considering the deckboard application.
Allowable design values for bending (F’b), shear (F’v), and compression perpendicular to
extrusion (F’c-perp) were calculated and are presented in Table 6.1 along with the loads and
stresses from the analysis. These design values are slightly different from those for PVC
material presented in Chapter 5. This is due to limited data available for assigning an adjustment
factor for temperature at the time of the deckboard design. However, the differences in the
allowable design values are very small.
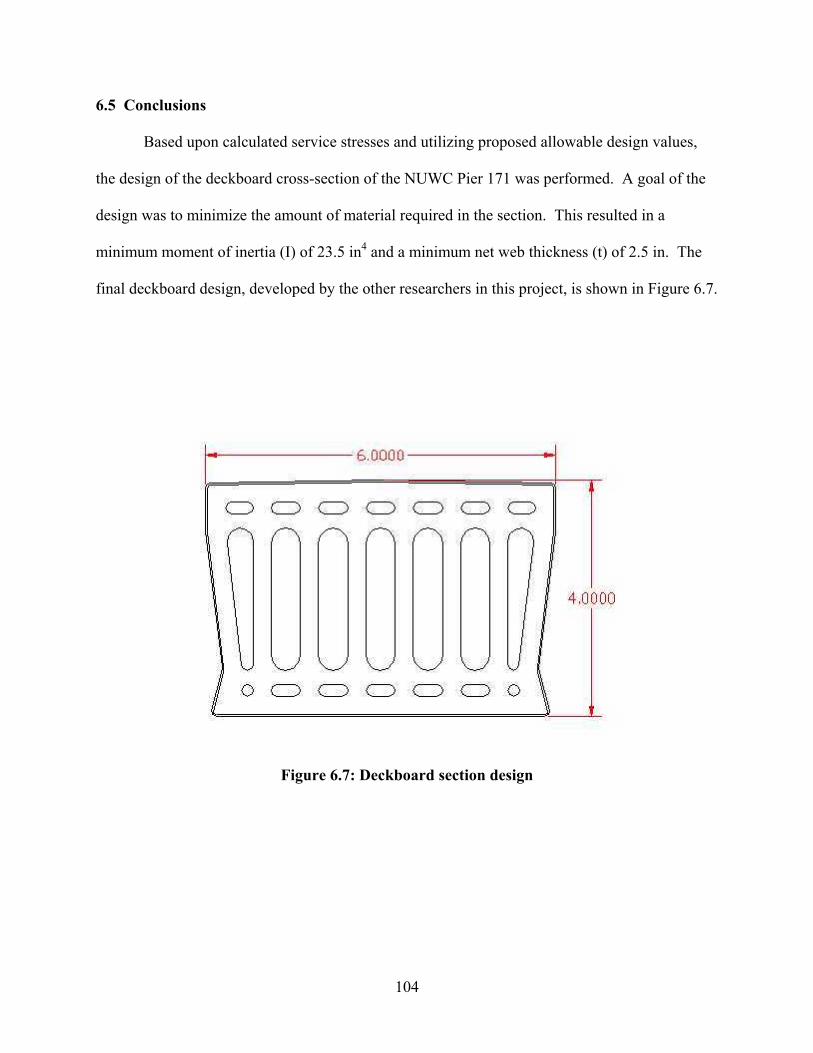
104
6.5 Conclusions
Based upon calculated service stresses and utilizing proposed allowable design values,
the design of the deckboard cross-section of the NUWC Pier 171 was performed. A goal of the
design was to minimize the amount of material required in the section. This resulted in a
minimum moment of inertia (I) of 23.5 in4 and a minimum net web thickness (t) of 2.5 in. The
final deckboard design, developed by the other researchers in this project, is shown in Figure 6.7.
Figure 6.7: Deckboard section design
105
CHAPTER 7
CONCLUSIONS
7.1 Summary
The purpose of this research was to characterize the performance of wood-plastic
composites (WPC) for use in fender system component design. The specific goals of this
research included determining adequate test procedures for WPC materials, characterizing
material behavior and strengths, and determining allowable design values for use in designing
WPC prototype fender system components. The goals of this research also included developing
a method for analyzing and predicting flexural strength and behavior to aid in the design of WPC
prototype fender system components such as chocks, wales, and piles.
Test procedures were developed for testing WPC members and determining strength
properties for the material. The specific strength properties considered were modulus of rupture
(MOR), compression parallel-to-extrusion strength, compression perpendicular-to-extrusion
strength, beam shear strength, shear strength parallel and perpendicular to extrusion, shear
strength by Iosipescu shear fixture, puncture strength, and resistance to impact by a falling
weight.
Based on the proposed test procedures, tests were conducted on near full-size WPC
sections to determine strength for prototype WPC structural elements. The specimens were
selected to be representative of the components expected to be used in fendering systems. Two
WPC formulations were evaluated: an HDPE formulation consisting of approximately 70%
wood and 30% HDPE, and a PVC formulation consisting of 50% wood and 50% PVC. The
specimens consisted of a rectangular three-cell box section and were tested in both the flat-wise
and edge-wise orientations.
106
A Fortran program (MPHIWPC) was developed to characterize behavior for WPC beam
sections. The program uses constitutive stress-strain relationships for the WPC and reinforcing
materials to predict strength and ductility for various nonreinforced and reinforced cross-
sections. The program provides insight into the load-displacement response, the distribution of
stress though the depth, the shift of the neutral axis as loading occurs, and the effects of
reinforcement on flexural response. The program has also enabled an improved understanding of
the general behavior of WPC sections and will in the future assist in the design of WPC flexural
members.
Allowable design values were determined for HDPE and PVC formulations using a draft
set of ASTM standard procedures for assignment of design values for WPC materials (draft D
WPC, 1999). The design values were used in the analysis of a decking system at the Newport
Naval Undersea Weapons Center (NUWC) Pier 171 to provide information needed for
deckboard section design. The design values may also be used for design of prototype fender
system components such as chocks, wales, and piles.
7.2 Conclusions
Based on the experimental tests of wood-plastic composite members presented in this
thesis, material strength values were established for the design of prototype fender system
components. The test results provide a basis for comparison of strength, apparent stiffness, and
the energy dissipated during loading between the HDPE and PVC formulations. The comparison
of behavior for each test for the two formulations shows that the PVC formulation is from 2 to 4
times stronger and from 2 to 3 times stiffer than the HDPE formulation. The comparison of

107
energy absorbed for each test for the two formulations shows that the PVC formulation will
absorb from 1 to 1.5 times more energy than the HDPE formulation.
The comparisons between near full-size section test results and predicted results using
program MPHIWPC indicate that the program provides a very good prediction of the flexural
response of nonreinforced and reinforced WPC sections. The program will aid the design
process for WPC flexural members by enabling the comparison of strength and ductility for
different section shapes, reinforcement quantity, and reinforcing arrangement. This may ease
the refinement of WPC sections for more efficient structural performance.
Some differences in apparent strength existed between hollow section and solid coupon
test results. Previous studies have attributed these differences to size and/or geometry effects.
The program, MPHIWPC, was modified to investigate size and geometry effects on strength by
allowing the WPC material to soften upon reaching the ultimate strains. Since coupon sections
are solid, they may be expected to redistribute stress more than hollow net sections with
softening of the material. Results with softening showed that the program can predict fairly well
the behavior of solid PVC coupon. Program results for the HDPE coupon section, however,
continued to show significant differences in strength and displacements from the experimental
test data. These differences may be the result of the inability of the program to capture the
effects of plastic hinge formation in the HDPE material.
7.3 Recommendations
The following recommendations are provided as possible further refinement for the
MPHIWPC program:
108
1. Provide more comparisons between program predictions and physical test results for
fiber reinforced specimens. Currently, only the double-box reinforced section test
results are available for comparison.
2. Modify the program to incorporate more load scenarios. At present, the program can
only analyze bending for 3-point and 4-point load cases. Fender systems are subject
to various load cases and the capability to analyze these would be beneficial in the
development of prototype components.
109
REFERENCES
American Society of Testing Materials, 1998. Standard test methods of static tests of lumber in structural sizes. ASTM D 198. ASTM. Philadelphia, PA. American Society of Testing Materials, 1998. Standard test methods for flexural properties of unreinforced and reinforced plastics and electrical insulating materials. ASTM D 790. ASTM. Philadelphia, PA. American Society of Testing Materials, 1998. Standard methods of testing small clear specimens of timber. ASTM D 143. ASTM. Philadelphia, PA. American Society of Testing Materials, 1998. Standard test method for compressive properties of rigid profiles. ASTM D 695. ASTM. Philadelphia, PA. American Society of Testing Materials, 1998. Standard test method for shear properties of composite materials by the v-notched beam method. ASTM D 5379. ASTM. Philadelphia, PA. American Society of Testing Materials, 1998. Standard test method for shear strength of plastics by punch tool. ASTM D 732. ASTM. Philadelphia, PA. American Society of Testing Materials, 1998. Standard test method for impact resistance of polyvinyl chloride rigid profiles by means of a falling weight. ASTM D 4495. ASTM. Philadelphia, PA. American Society of Testing Materials, 1998. Standard practice for evaluating allowable properties for grades of structural lumber, Sections 3.4.3.1 and 3.4.3.2 ASTM D 2915. ASTM. Philadelphia, PA. American Society of Testing Materials, 1998. Standard specification for evaluation of structural composite lumber products. ASTM D 5456. ASTM. Philadelphia, PA. Draft ASTM standard, 1999. Standard specification for establishing design values for wood-plastic composites. Designation: D WPC. Hoyle, R. J., Jr. and Woeste, F. E. 1989. Wood Technology in the Design of Structures, fifth edition, Iowa State University Press, Ames, Iowa 50010. Lockyear, Scott, Masters Thesis Chapter 3 and Appendix B. Mechanical Analysis of Transversely loaded Wood/Plastic Sections, 1999. Paynter, Monique, Master Thesis Chapter 5. Wood Based Composite Members for Waterfront Fendering Systems, 1998.

110
Rammer, D.R.; Soltis, L.A. 1994. Experimental shear strength of glued-laminated beams. Research Paper. FPL—RP—527. Madison, WI: U.S. Department of Agriculture, Forest Service, Forest Products Laboratory. Zoltek, (1999) Internet web page, URL: http://www.zoltek.com/carbon_fiber_products/ continuous_fiber.shtml
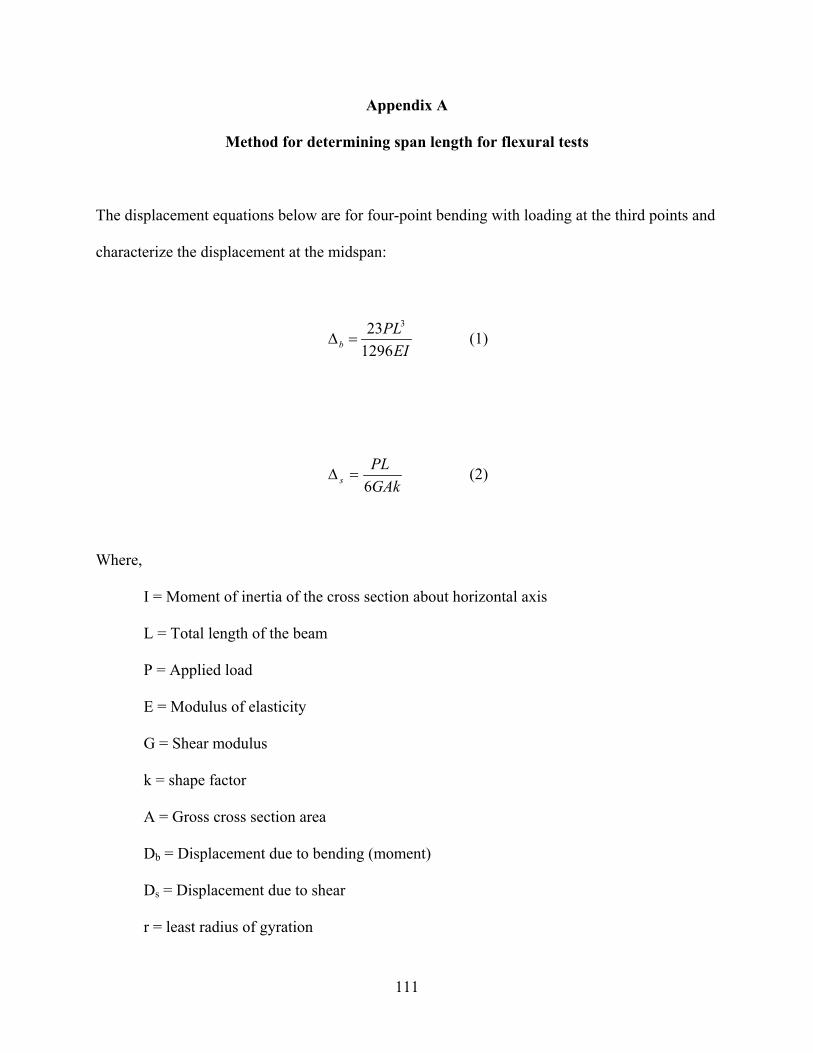
111
Appendix A
Method for determining span length for flexural tests
The displacement equations below are for four-point bending with loading at the third points and
characterize the displacement at the midspan:
EIPL
b 129623 3
=∆ (1)
GAkPL
s 6=∆ (2)
Where,
I = Moment of inertia of the cross section about horizontal axis
L = Total length of the beam
P = Applied load
E = Modulus of elasticity
G = Shear modulus
k = shape factor
A = Gross cross section area
Db = Displacement due to bending (moment)
Ds = Displacement due to shear
r = least radius of gyration
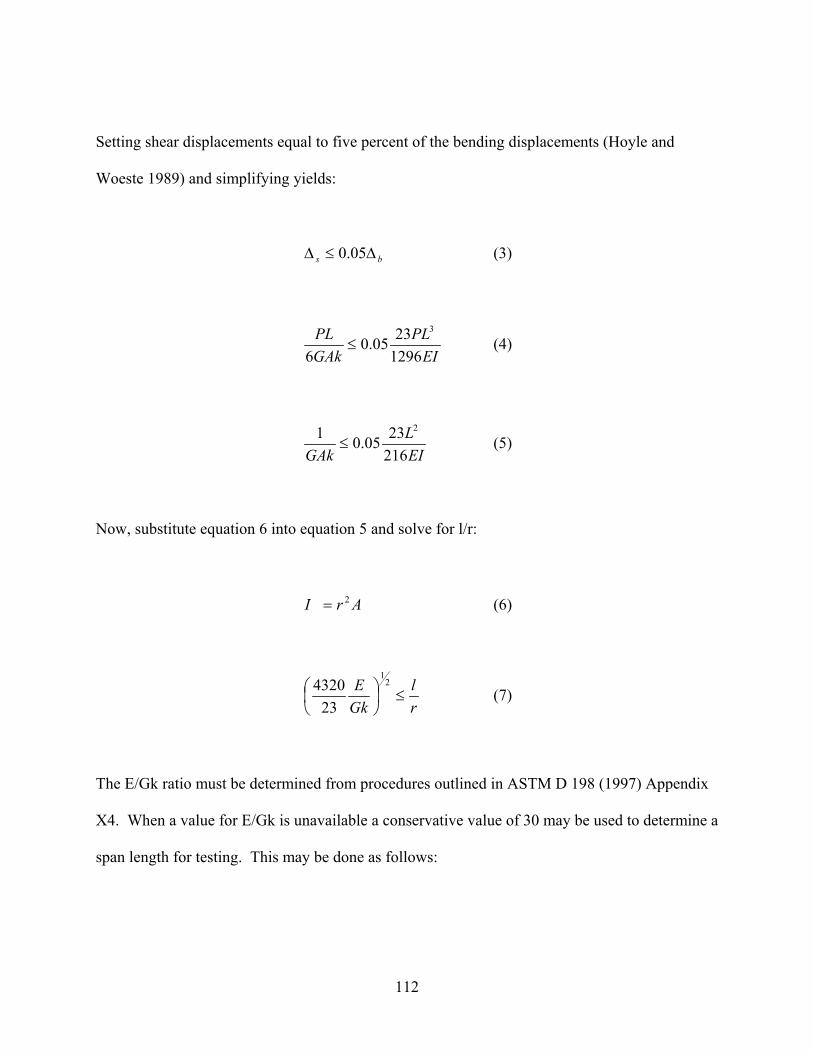
112
Setting shear displacements equal to five percent of the bending displacements (Hoyle and
Woeste 1989) and simplifying yields:
bs ∆≤∆ 05.0 (3)
EIPL
GAkPL
12962305.0
6
3
≤ (4)
EIL
GAk 2162305.01 2
≤ (5)
Now, substitute equation 6 into equation 5 and solve for l/r:
ArI 2= (6)
rl
GkE
≤
2
1
234320 (7)
The E/Gk ratio must be determined from procedures outlined in ASTM D 198 (1997) Appendix
X4. When a value for E/Gk is unavailable a conservative value of 30 may be used to determine a
span length for testing. This may be done as follows:
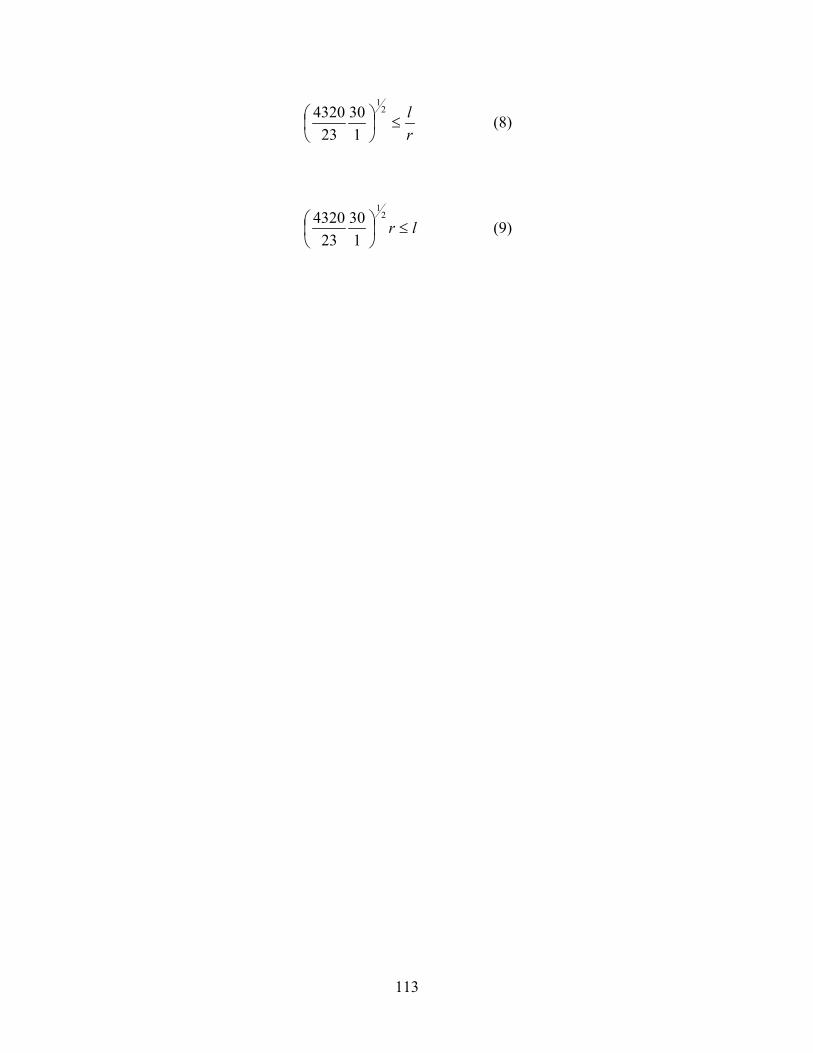
113
rl
≤
2
1
130
234320 (8)
lr ≤
2
1
130
234320 (9)
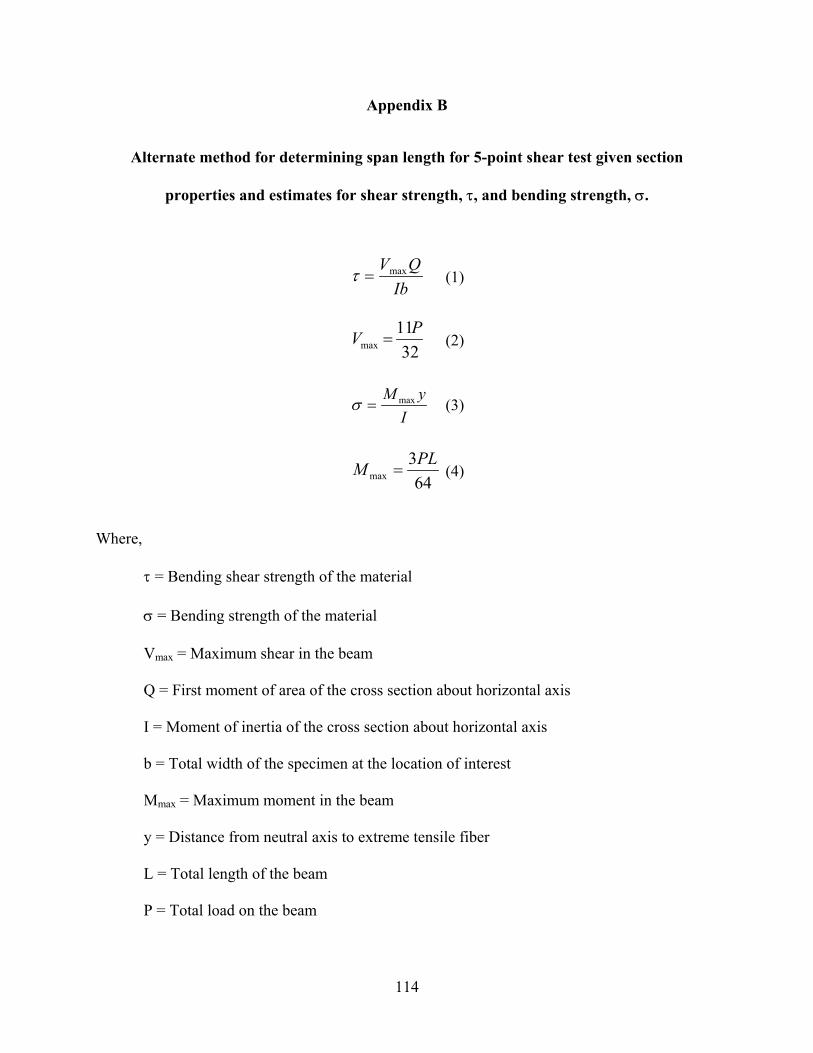
114
Appendix B
Alternate method for determining span length for 5-point shear test given section
properties and estimates for shear strength, τ, and bending strength, σ.
IbQVmax=τ (1)
3211
maxPV = (2)
IyM max=σ (3)
643
maxPLM = (4)
Where,
τ = Bending shear strength of the material
σ = Bending strength of the material
Vmax = Maximum shear in the beam
Q = First moment of area of the cross section about horizontal axis
I = Moment of inertia of the cross section about horizontal axis
b = Total width of the specimen at the location of interest
Mmax = Maximum moment in the beam
y = Distance from neutral axis to extreme tensile fiber
L = Total length of the beam
P = Total load on the beam
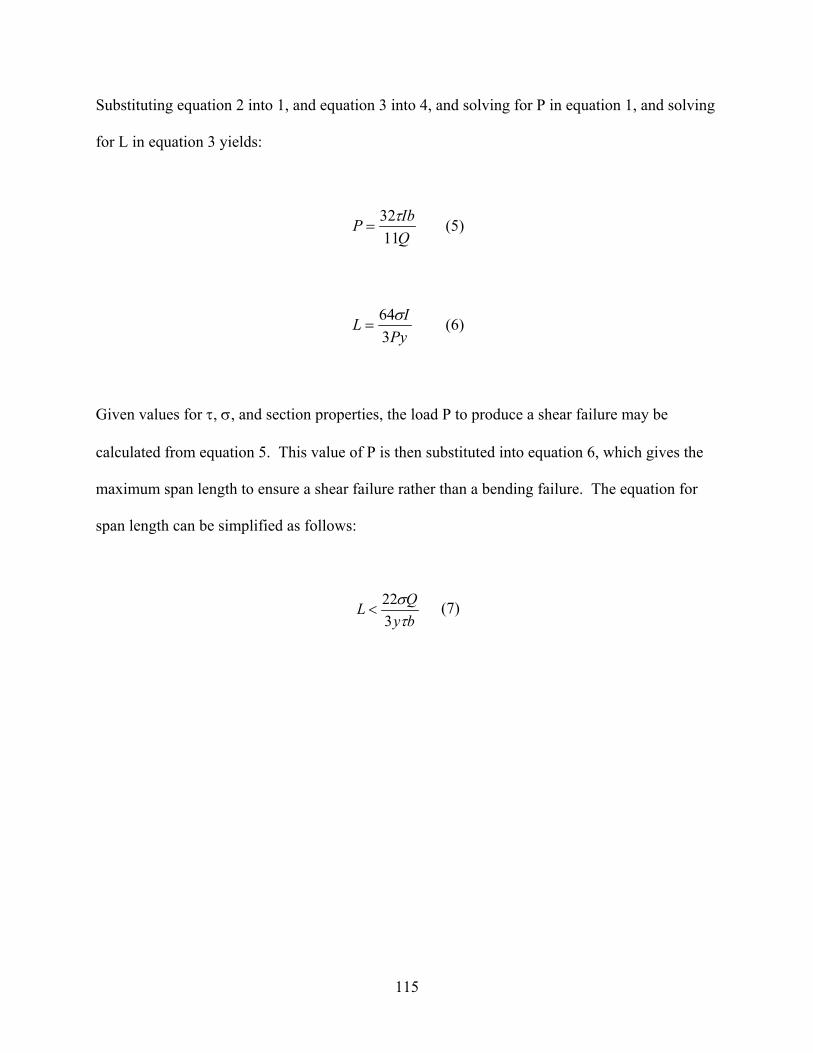
115
Substituting equation 2 into 1, and equation 3 into 4, and solving for P in equation 1, and solving
for L in equation 3 yields:
QIbP
1132τ
= (5)
PyIL
364σ
= (6)
Given values for τ, σ, and section properties, the load P to produce a shear failure may be
calculated from equation 5. This value of P is then substituted into equation 6, which gives the
maximum span length to ensure a shear failure rather than a bending failure. The equation for
span length can be simplified as follows:
byQL
τσ
322
< (7)

116
Appendix C: Program MPHIWPC
INPUT CALCULATE CENTROIDFOR EACH LAYER
CHECK FOR REINFORCINGOUTSIDE OF THE SECTION
LOOP THROUGH STRAINSTEPS FOR EQUILIBRIUM
CALCULATE WPC TENSILE ANDCOMPRESSIVE FORCES
CALCULATE CARBON FIBERFORCES
CHECK FOR EQUILIBRIUM
ADJUST STRAIN DISTRIBUTION
CALCULATE MOMENT ANDCURVATURE
CHECK FOR NO CONVERGENCEWRITE OUTPUT: NA,STRESS DIST., FIBERFORCES, MAX. STRAINS
DETERMINE TENSION ORCOMPRESSION FAILURE
LOOP THROUGH MOM.-CURV. DATA TODETERMINE LOAD-DEFL.
DETERMINE MOMENTDIAGRAM FOR EACH MOMENTOF MOM-CURV DATA
CUT BEAM INTO SEGMENTS
DETERMINE MOMENT AT EACHSEGMENT OF BEAM FROMMOMENT DIAGRAM
FIND CURVATURE FOR EACHSEGMENT USING MOM-PHICURVE
USE MOMENT-AREA METHODAND SUM MOMENTS OFSEGMENTS TO DETERMINEMIDSPAN DEFLECTION
WRITE LOAD AND DEFL.DATA TO OUTPUT FILE
END

117
PROGRAM MPHIWPC C C **************************************************************** C C MOMENT-CURVATURE KEVIN HAIAR 01/27/2000 WASH. STATE UNIV. C C C VERSION 1.0 MOMENT-CURVATURE, STRESS DISTRIBUTION AND C LOAD-DEFLECTION FOR VARIABLE SPAN 4-POINT C BENDING OR 3-POINT BENDING, FOR WPC MEMBERS C WITH OR WITHOUT CARBON FIBER REINFORCING C C THIS PROGRAM GENERATES THE POINTS FOR A PLOT OF MOMENT VS. C CURVATURE FOR A WOOD-PLASTIC COMPOSITE (WPC) CROSS-SECTION C SUBJECTED TO MONOTONICALLY INCREASING MOMENT. C C CROSS SECTIONS MAY BE ANY SHAPE AND SIZE, BUT MUST BE MANUALLY C CUT INTO LAYERS AND EACH LAYER HEIGHT AND WIDTH MUST BE C DETERMINED AND STATED IN THE INPUT FILE C C THE BEHAVIOR OF THE WPC IS BASED ON A HYPERBOLIC TANGENT C STRESS-STRAIN RELATIONSHIP FOR BOTH TENSION AND COMPRESSION C C THE INPUT IS READ FROM A FILE ASCRIBED TO 'WPCIN' AND THE OUTPUT C IS READ INTO FILES ASCRIBED TO 'WPCOUT' AND 'DATA'. C C EACH LAYER IS ASSIGNED A STRAIN FOUND FROM A SET STRAIN AT THE C OUTERMOST COMPRESSIVE FIBER AND AN ASSUMED SLOPE OF THE STRAIN C DISTRIBUTIONS. CARBON FIBER REINFORCING IS ASSIGNED A STRAIN C ACCORDING TO LOCATION IN THE DEPTH. C C FROM THESE STRAINS THE LAYER FORCES ARE FOUND. AN EQUILIBRIUM C CHECK C IS PERFORMED AND THE SLOPE OF THE STRAIN DISTRIBUTION IS ADJUSTED C UNTIL EQUILIBRIUM IS SATISFIED. THEN THE MOMENT AND CURVATURE ARE C CALCULATED AND STORED. THE STRESS DISTRIBUTION IN THE WPC AND THE C STRESS, STRAIN, AND FORCE IN THE FIBER LAYERS ARE WRITTEN TO THE C WPCOUT C OUTPUT FILE FOR EACH STRAIN INCREMENT. THE OUTER FIBER COMP. STRAIN C IS C THEN INCREMENTED AND THE PROCESS IS REPEATED UNTIL ALL STRAINS C BETWEEN C 0.0 AND ULTIMATE ARE ACCOUNTED FOR. C C INPUT VARIABLE DEFINITION: C
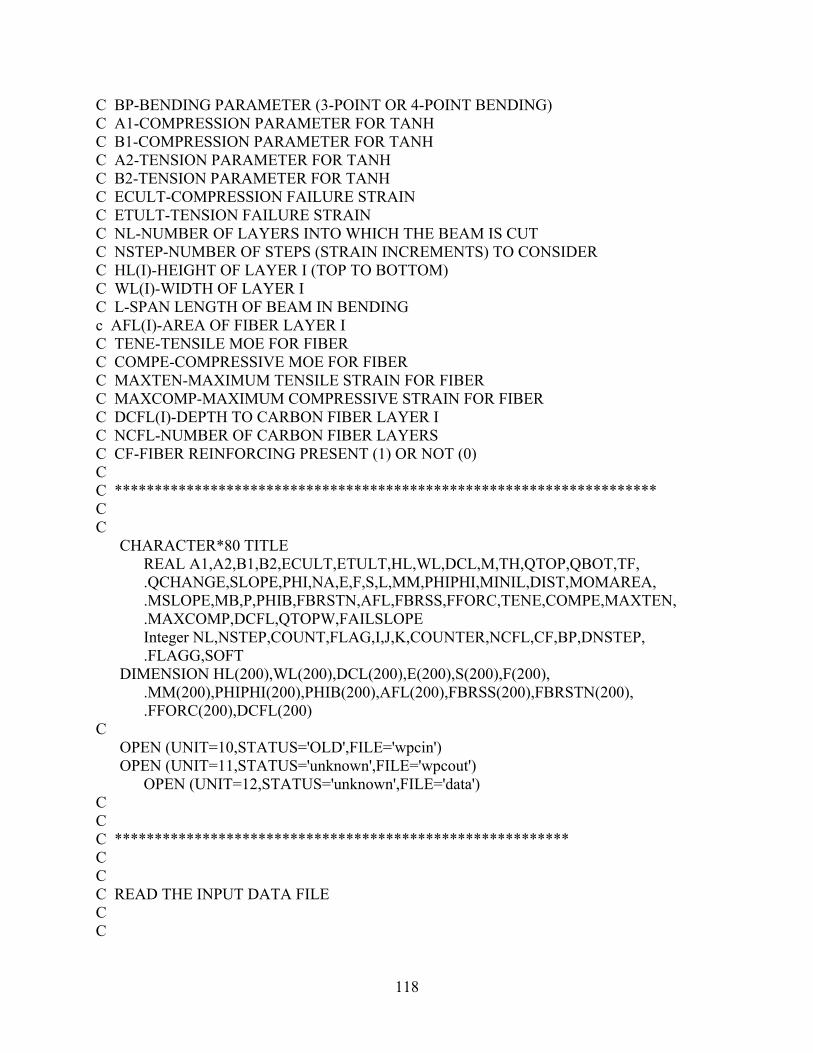
118
C BP-BENDING PARAMETER (3-POINT OR 4-POINT BENDING) C A1-COMPRESSION PARAMETER FOR TANH C B1-COMPRESSION PARAMETER FOR TANH C A2-TENSION PARAMETER FOR TANH C B2-TENSION PARAMETER FOR TANH C ECULT-COMPRESSION FAILURE STRAIN C ETULT-TENSION FAILURE STRAIN C NL-NUMBER OF LAYERS INTO WHICH THE BEAM IS CUT C NSTEP-NUMBER OF STEPS (STRAIN INCREMENTS) TO CONSIDER C HL(I)-HEIGHT OF LAYER I (TOP TO BOTTOM) C WL(I)-WIDTH OF LAYER I C L-SPAN LENGTH OF BEAM IN BENDING c AFL(I)-AREA OF FIBER LAYER I C TENE-TENSILE MOE FOR FIBER C COMPE-COMPRESSIVE MOE FOR FIBER C MAXTEN-MAXIMUM TENSILE STRAIN FOR FIBER C MAXCOMP-MAXIMUM COMPRESSIVE STRAIN FOR FIBER C DCFL(I)-DEPTH TO CARBON FIBER LAYER I C NCFL-NUMBER OF CARBON FIBER LAYERS C CF-FIBER REINFORCING PRESENT (1) OR NOT (0) C C ******************************************************************** C C CHARACTER*80 TITLE REAL A1,A2,B1,B2,ECULT,ETULT,HL,WL,DCL,M,TH,QTOP,QBOT,TF, .QCHANGE,SLOPE,PHI,NA,E,F,S,L,MM,PHIPHI,MINIL,DIST,MOMAREA, .MSLOPE,MB,P,PHIB,FBRSTN,AFL,FBRSS,FFORC,TENE,COMPE,MAXTEN, .MAXCOMP,DCFL,QTOPW,FAILSLOPE Integer NL,NSTEP,COUNT,FLAG,I,J,K,COUNTER,NCFL,CF,BP,DNSTEP, .FLAGG,SOFT DIMENSION HL(200),WL(200),DCL(200),E(200),S(200),F(200), .MM(200),PHIPHI(200),PHIB(200),AFL(200),FBRSS(200),FBRSTN(200), .FFORC(200),DCFL(200) C OPEN (UNIT=10,STATUS='OLD',FILE='wpcin') OPEN (UNIT=11,STATUS='unknown',FILE='wpcout') OPEN (UNIT=12,STATUS='unknown',FILE='data') C C C ********************************************************* C C C READ THE INPUT DATA FILE C C

119
C READ THE NUMBER OF LAYERS, ULTIMATE COMP AND TEN STRAINS, C NUMBER OF STRAIN INCREMENTS, AND HYPERBOLIC TAN PARAMETERS C Read (10,1) Title 1 Format (A80) Read (10,*) NL,L,BP READ(10,*)ECULT,ETULT,NSTEP,SOFT READ(10,*)A1,B1,A2,B2 C Write (11,*) Title WRITE (11,*) C C READ IN REINFORCING INFORMATION; IF NO REINFORCING PRESENT C THEN SKIP TO WPC LAYER DIMENSIONS C READ (10,*) CF IF (CF.EQ.0) THEN GOTO 5 END IF C C READ (10,*) NCFL,TENE,COMPE,MAXTEN,MAXCOMP C WRITE (11,*) 'Fiber Reinforcement Information' WRITE (11,*) 'NO.LYRS TEN.MOE COMP.MOE MAXT STRN MAXC STRN' WRITE (11,3) NCFL,TENE,COMPE,MAXTEN,MAXCOMP 3 FORMAT (1X,I3,2X,F14.2,2X,F14.2,1X,F6.4,2X,F6.4) WRITE (11,*) WRITE (11,*) C C READ IN CARBON FIBER LAYER DEPTHS AND AREAS C DO 4 I=1,NCFL READ(10,*) DCFL(I), AFL(I) 4 CONTINUE c c Read in WPC layer dimensions c 5 DO 6 I=1,NL READ(10,*) HL(I), WL(I) 6 CONTINUE C C CALCULATE DEPTH TO CENTROID FOR EACH LAYER (FROM TOP) C DO 8 I=1,NL IF(I.EQ.1) THEN

120
DCL(I)=(HL(I))/2 ELSE DCL(I)=DCL(I-1)+((HL(I-1)+HL(I))/2) END IF 8 CONTINUE C WRITE (11,10) L Write (11,11) NL Write (11,12) ECult Write (11,13) Etult Write (11,14) NSTEP Write (11,15) Write (11,15) WRITE (11,17) 10 FORMAT (1X,'Span length of beam',F6.2) 11 Format (1x,16HNumber of layers,I5) 12 Format (1x,'Maximum Compressive Strain (WPC)',F8.4) 13 Format (1x,'Maximum Tensile Strain (WPC)',F8.4) 14 Format (1x,'Number of compressive strain increments',I5) 15 Format (1x) 17 FORMAT (4x,'Moment',5x,'Curvature',5x,'Depth of N.A.',1x, .'Top Strain',2x,'Bottom Strain') C C INITIALIZE MOMENT AND TOTAL HEIGHT C M=0.0 TH=0.0 C C STEPSIZE=ECULT/NSTEP C DO 18 I=1,NL TH=TH+HL(I) 18 CONTINUE C C CHECK FOR FIBER REINFORCEMENT OUTSIDE OF THE SECTION; IF SO THEN C GET OUT AND PRINT ERROR MESSAGE C DO 19 I=1,NCFL IF (DCFL(I).GT.TH) THEN WRITE (11,*) WRITE (11,*) 'REINFORCEMENT OUTSIDE OF SECTION...' WRITE (11,*) 'HAVE SOME MORE COFFEE AND TRY AGAIN' GOTO 1001 END IF 19 CONTINUE
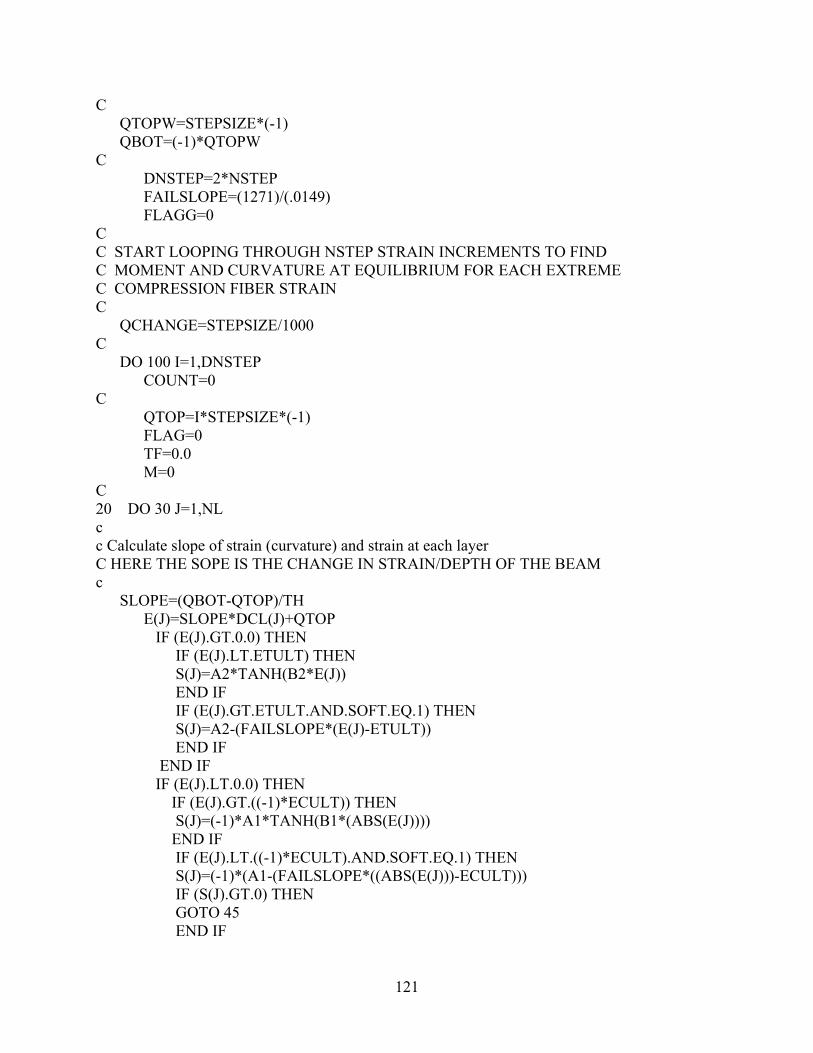
121
C QTOPW=STEPSIZE*(-1) QBOT=(-1)*QTOPW C DNSTEP=2*NSTEP FAILSLOPE=(1271)/(.0149) FLAGG=0 C C START LOOPING THROUGH NSTEP STRAIN INCREMENTS TO FIND C MOMENT AND CURVATURE AT EQUILIBRIUM FOR EACH EXTREME C COMPRESSION FIBER STRAIN C QCHANGE=STEPSIZE/1000 C DO 100 I=1,DNSTEP COUNT=0 C QTOP=I*STEPSIZE*(-1) FLAG=0 TF=0.0 M=0 C 20 DO 30 J=1,NL c c Calculate slope of strain (curvature) and strain at each layer C HERE THE SOPE IS THE CHANGE IN STRAIN/DEPTH OF THE BEAM c SLOPE=(QBOT-QTOP)/TH E(J)=SLOPE*DCL(J)+QTOP IF (E(J).GT.0.0) THEN IF (E(J).LT.ETULT) THEN S(J)=A2*TANH(B2*E(J)) END IF IF (E(J).GT.ETULT.AND.SOFT.EQ.1) THEN S(J)=A2-(FAILSLOPE*(E(J)-ETULT)) END IF END IF IF (E(J).LT.0.0) THEN IF (E(J).GT.((-1)*ECULT)) THEN S(J)=(-1)*A1*TANH(B1*(ABS(E(J)))) END IF IF (E(J).LT.((-1)*ECULT).AND.SOFT.EQ.1) THEN S(J)=(-1)*(A1-(FAILSLOPE*((ABS(E(J)))-ECULT))) IF (S(J).GT.0) THEN GOTO 45 END IF
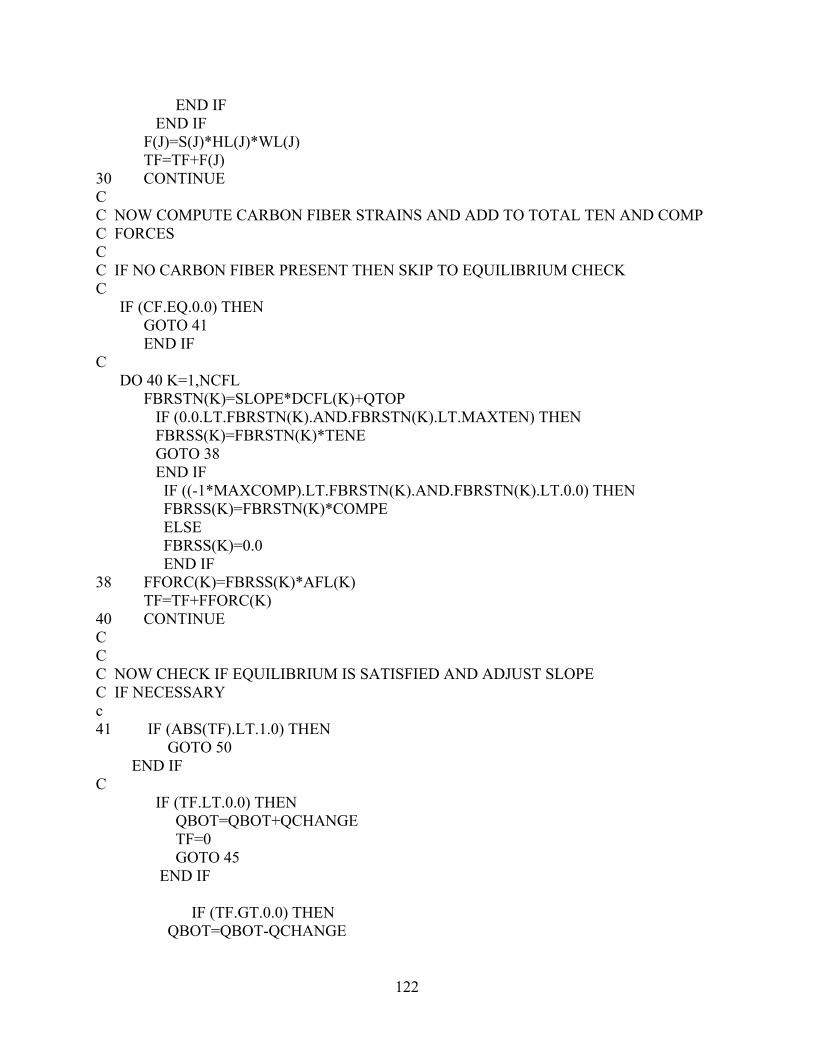
122
END IF END IF F(J)=S(J)*HL(J)*WL(J) TF=TF+F(J) 30 CONTINUE C C NOW COMPUTE CARBON FIBER STRAINS AND ADD TO TOTAL TEN AND COMP C FORCES C C IF NO CARBON FIBER PRESENT THEN SKIP TO EQUILIBRIUM CHECK C IF (CF.EQ.0.0) THEN GOTO 41 END IF C DO 40 K=1,NCFL FBRSTN(K)=SLOPE*DCFL(K)+QTOP IF (0.0.LT.FBRSTN(K).AND.FBRSTN(K).LT.MAXTEN) THEN FBRSS(K)=FBRSTN(K)*TENE GOTO 38 END IF IF ((-1*MAXCOMP).LT.FBRSTN(K).AND.FBRSTN(K).LT.0.0) THEN FBRSS(K)=FBRSTN(K)*COMPE ELSE FBRSS(K)=0.0 END IF 38 FFORC(K)=FBRSS(K)*AFL(K) TF=TF+FFORC(K) 40 CONTINUE C C C NOW CHECK IF EQUILIBRIUM IS SATISFIED AND ADJUST SLOPE C IF NECESSARY c 41 IF (ABS(TF).LT.1.0) THEN GOTO 50 END IF C IF (TF.LT.0.0) THEN QBOT=QBOT+QCHANGE TF=0 GOTO 45 END IF IF (TF.GT.0.0) THEN QBOT=QBOT-QCHANGE
123
TF=0 GOTO 45 END IF C C 45 FLAG=1 Count = Count +1 If (count.eq.100000) then Write (11,*) Write (11,*) 'No convergence... Program terminated' WRITE (11,*) WRITE (11,*) 'TRY INCREASING NO. OF STEPS (NSTEP)' Goto 130 End if GOTO 20 c C CALCULATE MOMENT, CURVATURE, NUETRAL AXIS DEPTH, AND C EXTREME FIBER STRAINS C 50 DO 55 J=1,NL M=M+F(J)*DCL(J) 55 CONTINUE C IF (CF.EQ.0) THEN GOTO 57 END IF C DO 56 J=1,NCFL M=M+FFORC(J)*DCFL(J) 56 CONTINUE C 57 PHI=SLOPE NA=(-1)*QTOP*(1/SLOPE) Write (11,58) M,PHI,NA,QTOP,QBOT 58 FORMAT (1X,F10.1,8X,F6.5,8X,F6.4,6X,F8.5,6X,F8.5) C MM(I)=M PHIPHI(I)=PHI c C WRITE THE STRESS DISTRIBUTION AND FIBER STRESSES FOR EACH MOMENT C TO THE DATA FILE C WRITE (12,*) WRITE (12,75) M 75 FORMAT (1X,F10.4) Write (12,*) 'Layer Number Layer Depth Stress'
124
Do 80 J=1,NL Write (12,82) J,DCL(J),s(J) 80 Continue 82 Format (1x,i5,6x,F10.2,8x,F10.2) C C WRITE (12,*) WRITE (12,*) 'LAYER DEPTH STRAIN STRESS FORCE' DO 90 J=1,NCFL WRITE (12,92) J,DCFL(J),FBRSTN(J),FBRSS(J),FFORC(J) 90 CONTINUE 92 FORMAT (1X,I3,2X,F8.4,2X,F8.4,4X,F12.2,2X,F12.2) C C CHECK FOR TENSION FAILURE. IF TENSION FAILURE OCCURS C THEN ITERATION IS halted and program terminated C C COUNTER=I IF (QBOT.GT.ETULT.AND.FLAGG.EQ.0) THEN Write (11,*) Write (11,*) 'TENSION FAILURE' WRITE (11,*) FLAGG=1 ELSE GOTO 95 END IF IF (QTOP.LT.((-1)*ECULT).AND.FLAGG.EQ.0) THEN WRITE (11,*) WRITE (11,*) 'COMPRESSION FAILURE' WRITE (11,*) FLAGG=1 ELSE GOTO 95 END IF C 95 IF (SOFT.EQ.0) THEN IF (QBOT.GT.ETULT) THEN GOTO 130 END IF END IF C IF (SOFT.EQ.0) THEN IF (QTOP.GT.ECULT) THEN GOTO 120 END IF END IF

125
C IF (QBOT.GT.(8*ETULT)) THEN GOTO 130 END IF C IF (QTOP.LT.((-2)*ECULT)) THEN GOTO 120 END IF C 100 CONTINUE C C C 120 WRITE (11,*) WRITE (11,*) 'COMPRESSION FAILURE' C C C C LOAD-DEFLECTION CALCULATIONS C C CURVATURE IS DEFINED ALONG THE LENGTH OF THE BEAM AND THE C MOMENT AREA METHOD IS USED TO FIND THE MIDSPAN DEFLECTION C C 130 DIST=0 P=0 MOMAREA=0 MSLOPE=0 MB=0 PHIB=0 MINIL=L/60 WRITE (11,*) 'LOAD (LBS) DEFLECTION (IN)' WRITE (11,*) DO 150 I=1,COUNTER IF (BP.EQ.4) THEN P=6*MM(I)/L END IF IF (BP.EQ.3) THEN P=4*MM(I)/L END IF C C THE BEAM IS CUT INTO 60 SEGMENTS AND CURVATURE IS CALCULATED C FOR EACH SEGMENT C DO 140 J=1,30 DIST=L*(J)/60
126
IF (BP.EQ.4) THEN IF (DIST.LT.L/3) THEN MSLOPE=P/2 MB=DIST*MSLOPE ELSE MB=P*L/6 END IF END IF IF (BP.EQ.3) THEN IF (DIST.LE.L/2) THEN MSLOPE=P/2 MB=DIST*MSLOPE END IF END IF C C STEP UP MOM-PHI CURVE TO FIND PHI AT EACH SEGMENT BY INTERPOLATING C BETWEEN THE NEAREST TWO POINTS C DO 135 K=1,200 IF (MB.GT.MM(K)) THEN GOTO 135 ELSE GOTO 133 133 IF (K.EQ.1) THEN PHIB(J)=(MB/MM(K))*PHIPHI(K) GOTO 140 ELSE PHIB(J)=PHIPHI(K-1)+((MB-MM(K-1))/(MM(K)-MM(K-1)))* . (PHIPHI(K)-PHIPHI(K-1)) GOTO 140 END IF END IF 135 CONTINUE C C 140 CONTINUE C C C NOW SUM MOMENTS TO DETERMINE DEFLECTION AT MIDSPAN C DO 145 K=1,30 MOMAREA=MOMAREA+PHIB(K)*MINIL*MINIL*(K) 145 CONTINUE C WRITE (11,146) P,MOMAREA 146 FORMAT (1X,F10.2,6X,F8.4)
127
C P=0 MOMAREA=0 MSLOPE=0 MB=0 DIST=0 PHIB=0 C 150 CONTINUE C ************************************************* 1001 STOP END