performance and calibration of h2rg detectors and .... all together, these components comprise...
TRANSCRIPT

Performance and Calibration of H2RG Detectors and SIDECAR ASICs for the RATIR Camera
Ori D. Foxa, Alexander S. Kutyreva,b, David A. Rapchuna,c, Christopher R. Klein d, Nathaniel R. Butlere, Josh Bloomd, Jos A. de Diegof, Alejandro D. Simn Farah!, Neil A. Gehrelsa,
Leonid Georgiev!, J. Jess Gonzlez-Hernandezf, William H. Leef, Markus Loose9, Gennadiy Lotkina,c, Samuel H. Moseley a, J. Xavier Prochaskah, Enrico Ramirez-Ruiz\ Michael G. Richer!, Frederick D. Robinsona,i, Carlos Romn-Zuniga!, Mathew V. Samuela,c, Leroy M.
Sparra, Alan M. Watson!
aNASA Goddard Space Flight Center, MS 665, Greenbelt, MD, USA bUniversity of Maryland, College Park, MD, USA
cGST dUC Berkeley
eASU !UNAM
9Markury hUCSC iOrbital
ABSTRACT
The Reionization And Transient Infra,.Red (RATIR) camera has been built for rapid Gamma,.Ray Burst (GRE) followup and will provide simultaneous optical and infrared photometric capabilities. The infrared portion of this camera incorporates two Teledyne HgCdTe HAWAII-2RG detectors, controlled by Teledyne's SIDECAR ASICs. While other ground-based systems have used the SIDECAR before, this system also utilizes Teledyne's JADE2 interface card and IDE development environment. Together, this setup comprises Teledyne's Development Kit, which is a bundled solution that can be efficiently integrated into future ground-based systems. In this presentation, we characterize the system's read noise, dark current, and conversion gain.
Keywords: IR Detectors, HgCdTe, Hawaii-2RG, ASIC, SIDECAR, JADE2, Noise
1. INTRODUCTION
The Reionization And Transients InfraRed (RATIR) camera is a joint project between NASA Goddard Space Flight Center (GSFC), University of California - Berkeley, and the Universidad Nacional Autonoma de Mexico (UNAM). The instrument will support the Swift Space Telescope over a two year period by providing rapid photometric identification of high-redshift GREs (z > 8). Designed to efficiently acquire a photometric spectral energy distribution (SED) across optical and infrared (IR) wavelengths, the instrument will utilize four cameras (2 optical and 2 IR) to achieve simultaneous multi-wavelength capabilities.
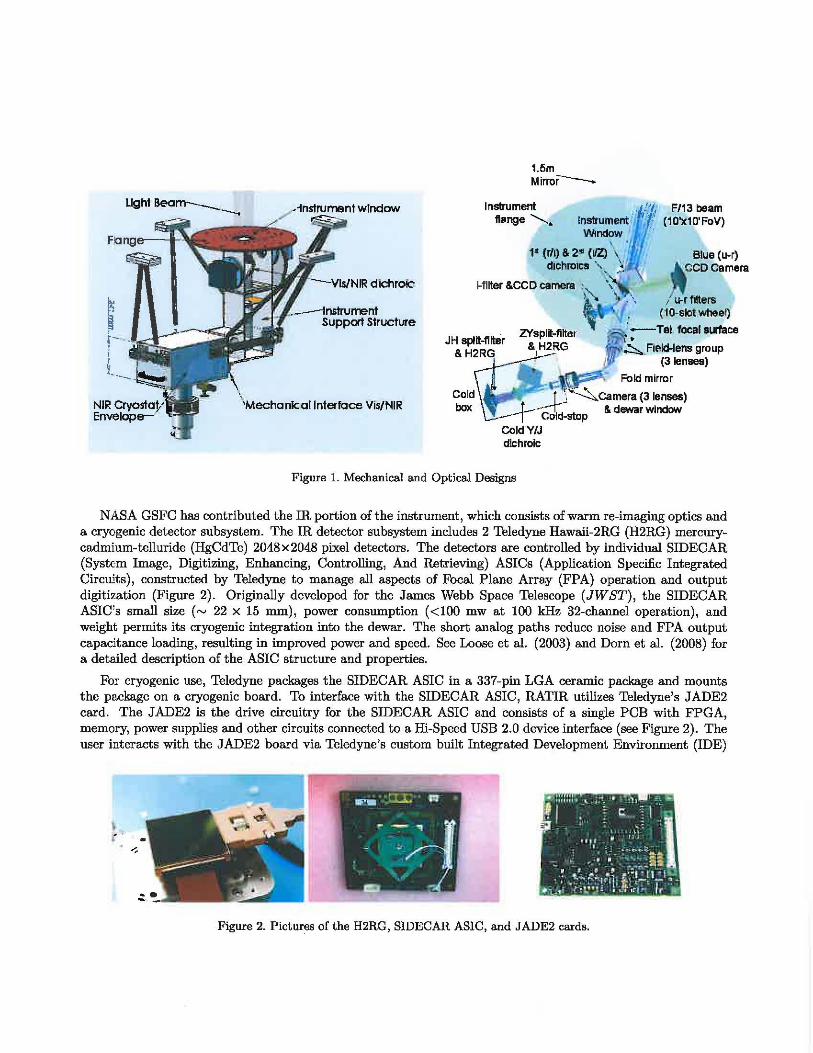
Commissioned in April, 2012, the instrument is located at the San Pedro Martir Observatory's 1.5-m telescope in Baja, Mexico. Althongh the telescope is modest in size, the site has several distinct advantages, including 1) outstanding weather and seeing, 2) full automation and quick-response capabilities, and 3) 100% dedication to the RATIR instrument. Figure 1 shows RATIR's mechanical and optical designs. A full description of mechanical, optical, electrical, and cryogenic components, as well as the telescope automation and first light results are described elsewhere (see Butler et aI. 2012, Farah et aI. 2012, Gonzalez-Hernandez et aI. 2012, Klein et aI. 2012, Kutyrev et aI. 2012, Watson et aI. 2012).
Author Email: [email protected]
https://ntrs.nasa.gov/search.jsp?R=20120009967 2018-05-27T08:57:40+00:00Z
NIR
'---'>IIsINIR d ichroic
Support Structure
'Mechankallntertace Vis/NIR
105m Mirror---
Instrument ,N, F/13 beam
WIndow " nong_ '---. Instrument ' r":' (10'xl0'FoV)
, ./ 1< (rll) & 2~ (lIZ) \ Blue (u-r)
dichroIC. ,_ .\ I A GCD camera
!-fllter &CCD camera .'";" \ "-~ 'It. I u-r fitters
(10-slot Wheery
~ I" f'lte -Tel local surface JH .pltt-fi~r L' sp ,,- I I •
& H2RG &,H2RG ':::"FI.lcl-lens group (3 lenses)
~ . . Fold mirror Cold \~ t '~~camera (3 lenses) box ~+c;t;:stoP &deworwindow
ColdY/J dichroic
Figure L Mechanical and Optical Designs
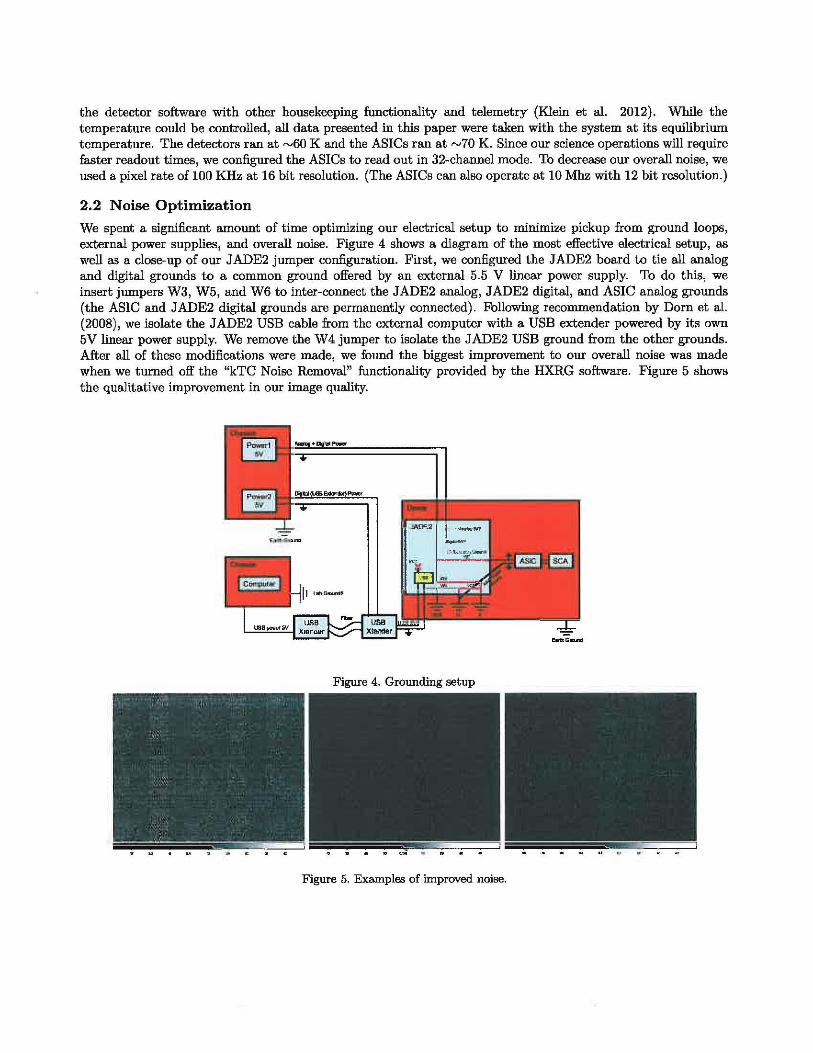
NASA GSFC has contributed the IR portion of the instrument, which consists of warm re-imaging optics and a cryogenic detector subsystem, The IR detector subsystem includes 2 Teledyne Hawaii-2RG (H2RG) mercurycadmium-telluride (HgCdTe) 2048x2048 pixel detectors. The detectors are controlled by individual SIDECAR (System Image, Digitizing, Enhancing, Controlling, And Retrieving) ASICs (Application Specific Integrated Circuits), constructed by Teledyne to manage all aspects of Focal Plane Array (FPA) operation and output digitization (Figure 2), Originally developed for the James Webb Space Telescope (JWST), the SIDECAR ASIC's small size (~ 22 x 15 mm), power consumption «100 mw at 100 kHz 32-channel operation), and weight permits its cryogenic integration into the dewar. The short analog paths reduce noise and FPA output capacitance loading, resuiting in improved power and speed. See Loose et al. (2003) and Dorn et al, (2008) for a detailed description of the ASIC structure and properties.
For cryogenic use, Teledyne packages the SIDECAR ASIC in a 337-pin LGA ceramic package and mounts the package on a cryogenic board. To interface with the SIDECAR ASIC, RATIR utilizes Teledyne's JADE2 card. The JADE2 is the drive circuitry for the SIDECAR ASIC and consists of a single PCB with FPGA, memory, power supplies and other circuits connected to a Hi-Speed USB 2.0 device interface (see Figure 2). The user interacts with the JADE2 board via Teledyne's custom built Integrated Development Environment (IDE)
"
Figure 2. Pictures of the H2RG, SIDECAR ASIC, and JADE2 cards.

software. All together, these components comprise Teledyne's SIDECAR ASIC Cryogenic-Development Kit. In this paper, we provide a detailed look at the performance of our detector subsystem. Section 2 describes our hardware and test setup in more details. Section 3 presents our data and results. Finally, Section 4 summarizes our capabilities.
2. HARDWARE SETUP
Figure 3 pictures the hardware setup for our detector subsystem, which is enclosed in a dewar that is mechanically cooled by a gaseous helium cryo-pump with a cold head that reaches 30 K. The light arrives through the window of the dewar after having passed from the telescope through the optical portion of the instrument and the IR warm re-imaging optics. A dichroic splits the light between a longer (2.5 I'm) and shorter (1. 7 I'm) wavelength cutoff H2RG.
Aluminum structures house each detector, which sits on a molybdenum plate thermally connected to the dewar base-plate via copper straps. Small diodes attached to back of each molybdenum plate serve as heaters for temperature control capabilities. The aluminum structures both baffle stray light and hold two fixed filters (J H) and (Y Z) in front of the 2.5 I'm and 1.7 I'm detectors, respectively. Aluminum structures thermally connected to the dewar base-plate also house each SIDECAR ASIC to shield the detectors from any thermal radiation. A 2" cryogenic flex cable connects each detector to the SIDECAR ASIC, and a 15" cryogenic flex cable connects the SIDECAR ASIC to the JADE2 interface card. The JADE2 cards are housed in a structure that is attached to the dewar in such a way that it remains under vacuum but thermally isolated (at room temperature) from the rest of the dewar. A hermetically sealed USB 2.0 interface provides access between the JADE2 cards and an external computer.
2.1 Software
The external computer communicates with the JADE2 cards via Teledyne's IDE software, which offers the user a GUI capability to configure and control the 20 programmable bias voltages and currents, as well as other analog and digital settings of the SIDECAR ASIC. Teledyne also developed a shell script in IDL, known as the HXRG software, to provide a more user-friendly environment. The HXRG software performs it's own reference pixel subtraction for each row by subtracting the average reference pixel value in columns 0-3 and 2044-2047 from the pixel values in each row.
A final layer of software named the Remote Telescope System (RTS2; Kubanek 2008,2009) offers an integrated open source package for remote observatory control under the Linux operating system. We use RTS2 to integrate
Figure 3. Cryogenic hardware setup.
the detector software with other housekeeping functionality and telemetry (Klein et al. 2012). While the temperature could be controlled, all data presented in this paper were taken with the system at its equilibrium temperature. The detectors ran at ~60 K and the ASICs ran at ~70 K. Since our science operations will require faster readout times, we configured the ASICs to read out in 32-channel mode. To decrease our overall noise, we used a pixel rate of 100 KHz at 16 bit resolution. (The ASICs can also operate at 10 Mhz with 12 bit resolution.)
2.2 Noise Optimization
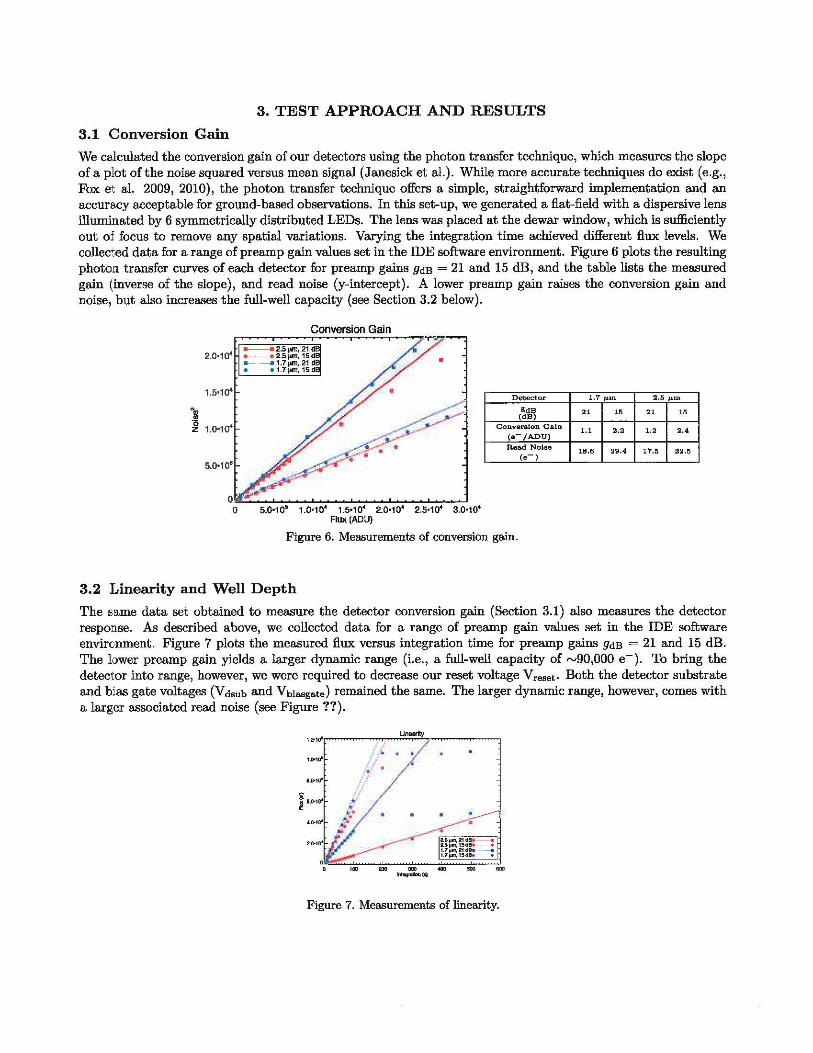
We spent a significant amount of time optimizing our electrical setup to minimize pickup from ground loops, external power supplies, and overall noise. Figure 4 shows a diagram of the most effective electrical setup, as well as a close-up of our JADE2 jumper configuration. First, we configured the JADE2 board to tie all analog and digital grounds to a common ground offered by an external 5.5 V linear power supply. To do this, we insert jumpers W3, W5, and W6 to inter-connect the JADE2 analog, JADE2 digital, and ASIC analog grounds (the ASIC and JADE2 digital grounds are permanently connected). Following recommendation by Dorn et al. (2008), we isolate the JADE2 USB cable from the external computer with a USB extender powered by its own 5V linear power supply. We remove the W4 jumper to isolate the JADE2 USB ground from the other grounds. After all of these modifications were made, we found the biggest improvement to our overall noise was made when we turned off the "kTC Noise Removal" functionality provided by the HXRG software. Figure 5 shows the qualitative improvement in our image quality.
Figure 4. Grounding setup
Figure 5. Examples of improved noise.
3. TEST APPROACH AND RESULTS
3.1 Conversion Gain
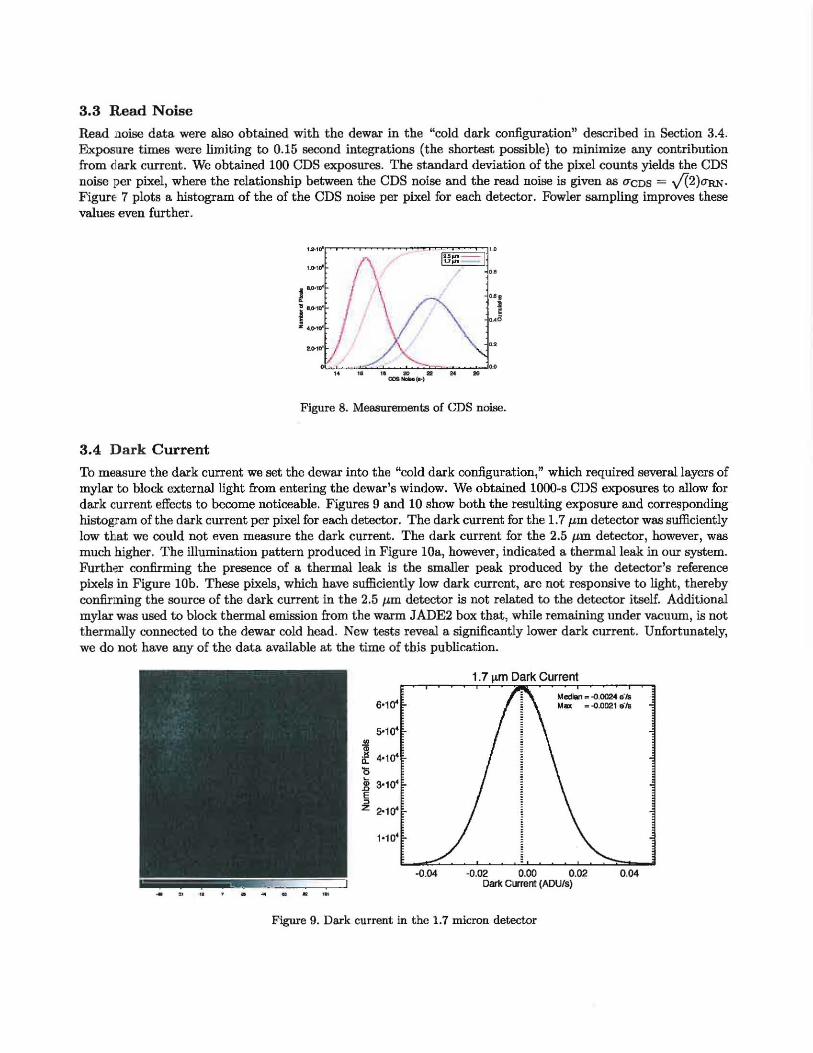
We calculated the conversion gain of our detectors using the photon transfer technique, which measures the slope of a plot of the noise squared versus mean signal (Janesick et al.). While more accurate techniques do exist (e.g., Fox et al. 2009, 2010), the photon transfer technique offers a simple, straightforward implementation and an accuracy acceptable for ground-based observations. In this set-up, we generated a flat-field with a dispersive lens illuminated by 6 symmetrically distributed LEDs. The lens was placed at the dewar window, which is sufficiently out of focus to remove any spatial variations. Varying the integration time achieved different flux levels. We collected data for a range of preamp gain values set in the IDE software environment. Figure 6 plots the resulting photon transfer curves of each detector for preamp gains gdB = 21 and 15 dB, and the table lists the measured gain (inverse of the slope), and read noise (y-intercept). A lower preamp gain raises the conversion gain and noise, but also increases the full-well capacity (see Section 3.2 below).
2.0·10"
1.5·1ct
1 1.o'l{f
Conversion Gain
_ 2.5j.11Tl,21d • 8 2.51J1T1,15d __ 1.7j.11Tl,21d • • 1.7j.11ll,15d
•
•
O ~
~.' .'
l ~l
o 5.0'103 1.a·HI" 1.5'104 2.0'10- 2.5·10" 3.0'104
Rux (ADU)
Detector
(~'b~ Converllion Gain
(.- /ADU)
Read Nol.1 (e-)
Figure 6. Measurements of conversion gain.
3.2 Linearity and Well Depth
1.7~m 2.5 Jl.m
" " " " L> 2.2 L2 2.'
18.6 211.4 17.5 22.15
The same data set obtained to measure the detector conversion gain (Section 3.1) also measures the detector response. As described above, we collected data for a range of preamp gain values set in the IDE software environment. Figure 7 plots the measured flux versus integration time for preamp gains gdB = 21 and 15 dB. The lower preamp gain yields a larger dynamic range (i.e., a full-well capacity of ~90,000 e-). To bring the detector into range, however, we were required to decrease our reset voltage Vreset. Both the detector substrate and bias gate voltages (Vd,ub and Vbi .... ,e) remained the same. The larger dynamic range, however, comes with a larger associated read noise (see Figure ??).
1 .0-10'
• i • ,
2.& ~"" 21 dB ______ 2.S~1I\ 15dB. • 1.T~m,21do. _ 1.7!'11\ 15d~. •
Figure 7. Measurements of linearity.
3.3 Read Noise
Read noise data were also obtained with the dewar in the "cold dark configuration" described in Section 3.4. Exposure times were limiting to 0.15 second integrations (the shortest possible) to minimize any contribution from dark current. We obtained 100 CDS exposures. The standard deviation of the pixel counts yields the CDS noise per pixel, where the relationship between the CDS noise and the read noise is given as O"CDS = J(2)0JtN. Figure 7 plots a histogram of the of the CDS noise per pixel for each detector. Fowler sampling improves these values even further.
Figure 8. Measurements of CDS noise.
3.4 Dark Current
'Ib measure the dark current we set the dewar into the "cold dark configuration," which required severai layers of mylar to block external light from entering the dewar's window. We obtained 1000-s CDS exposures to allow for dark current effects to become noticeable. Figures 9 and lO show both the resulting exposure and corresponding histog~am of the dark current per pixel for each detector. The dark current for the 1. 7 11m deteetor was sufficiently low that we could not even measure the dark current. The dark current for the 2.5 11m detector, however, was much higher. The illumination pattern produced in Figure lOa, however, indicated a thermal leak in our system. Further confirming the presence of a thermal leak is the smaller peak produced by the detector's reference pixels in Figure lOb. These pixels, which have sufficiently low dark current, are not responsive to light, thereby confirming the source of the dark current in the 2.5 11m detector is not related to the detector itself. Additional mylar was used to block thermal emission from the warm JADE2 box that , while remaining under vacuum, is not thermally connected to the dewar cold head. New tests reveal a significantly lower dark current. Unfortunately, we do not have any of the data available at the time of this publication.
6'10' Median . ~.002-4 e'" Mn • .().0021 . '"
5·10'
il if 4·10' 15
Z 3.104
E £ 2·10'
1'10'
-0.04 -0.02 0.00 0.02 0.04 Da'k Ctnerrt (ADU/s)
Figure 9. Dark current in the 1.7 micron detector

--... =
- - ~ - - - ~ ~ -
6000
~ 15 4000
j 2000
0.0
2.5 I'IIl Dark Current
Median . OJ" a'Js Max :0."1 e'"
~5 1~ 1. Dart Current (ADU/s)
Figure 10. Dark current in the 2.5 micron detector.
4. SUMMARY
2.0
We report on the performance of two H2RG infrared detectors being read out by Teledyne's SIDECAR ASICs UBing the JADE2 interace card and IDE development environment. We characterize the conversion gain, linearity, dark current, and read noise of each detector. The pre-amp conversion gain provides a tradeoff between welldepth and read noise. We discuss changes to the bias voltages the user must take to compensate for changing the conversion gain. These tests will ease the integration of the SIDECAR ASIC into future ground-based astronomical instrumentation.
ACKNOWLEDGMENTS
For their time, expertise, hardware, and advice given to optimize our detector functionality, we would like to thank a number of people: James Beletic, Richard Blank, and Craig Cabelli from Teledyne Imaging Sensors; Nick Collins, Eliot Malumuth, and Bernard Rauscher from NASA Goddard; Lantrinh Degumbia., Gregory Delo, Brent Mott, Augustyn Waczynski, Yiting Wen, and Donna. Wilson from NASA Goddard's Detector Characterization Laboratory (DCL) .