perceived triad distance
DESCRIPTION
Artigo cognição musical KrumhanslTRANSCRIPT

Yale University Department of Music
Perceived Triad Distance: Evidence Supporting the Psychological Reality of Neo-RiemannianTransformationsAuthor(s): Carol L. KrumhanslSource: Journal of Music Theory, Vol. 42, No. 2, Neo-Riemannian Theory (Autumn, 1998), pp.265-281Published by: Duke University Press on behalf of the Yale University Department of MusicStable URL: http://www.jstor.org/stable/843878 .
Accessed: 03/04/2013 14:34
Your use of the JSTOR archive indicates your acceptance of the Terms & Conditions of Use, available at .http://www.jstor.org/page/info/about/policies/terms.jsp
.JSTOR is a not-for-profit service that helps scholars, researchers, and students discover, use, and build upon a wide range ofcontent in a trusted digital archive. We use information technology and tools to increase productivity and facilitate new formsof scholarship. For more information about JSTOR, please contact [email protected].
.
Duke University Press and Yale University Department of Music are collaborating with JSTOR to digitize,preserve and extend access to Journal of Music Theory.
http://www.jstor.org
This content downloaded from 128.84.127.82 on Wed, 3 Apr 2013 14:34:27 PMAll use subject to JSTOR Terms and Conditions

PERCEIVED TRIAD DISTANCE:
EVIDENCE SUPPORTING
THE PSYCHOLOGICAL
REALITY OF NEO-RIEMANNIAN
TRANSFORMATIONS
Carol L. Krumhansl
This article examines two sets of empirical data for the psychological reality of neo-Riemannian transformations. Previous research (summa- rized, for example, in Krumhansl 1990) has established the influence of parallel, P, relative, R, and dominant, D, transformations on cognitive representations of musical pitch. The present article considers whether empirical data also support the psychological reality of the Leitton- weschsel, L, transformation. Lewin (1982, 1987) began working with the D P R L family to which were added a few other diatonic operations. Subsequently, Hyer (1989) reduced the transformations to the family consisting of only the D P R L transformations. Cohn (1996, 1997) has provided an extensive theoretical analysis of neo-Riemannian transfor- mations excluding the dominant, D, transformation. Thus, one of the issues that arises out of this literature is whether the D transformation is needed given that, as will be shown next, it is equivalent to a combina- tion of R and L transformations.
265
This content downloaded from 128.84.127.82 on Wed, 3 Apr 2013 14:34:27 PMAll use subject to JSTOR Terms and Conditions

The parallel, P, relative, R, and Leittonwechsel, L, transformations move between major and minor triads with a minimal change of one tone. The P transformation shifts the third of a major or minor triad by one chro- matic step holding constant the tones related by a perfect fifth (e.g., C E G to C Eb G). The R transformation shifts the fifth of a major triad (or root of a minor triad) by two chromatic steps holding constant the tones related by a major third (e.g., C E G to C E A). The L transformation shifts the root of the major triad (or fifth of a minor triad) by one chromatic step holding constant the tones related by a minor third (e.g., C E G to B E G). The dominant, D, transformation, shifts a major or minor triad up or down a fifth (e.g., C E G to G B D or FA C, and C Eb G to G Bb D or FAb C); in this sense it is ambiguous. The D transformation can also be written as a combination of R and L transformations (e.g. applying the L transfor- mation to C E G produces B E G, that is, E G B; then applying the R trans- formation to E G B produces D G B, that is, G B D). Thus, the D trans- formation might be redundant.
Psychological considerations, namely numerous psychological results showing the effect of pitch proximity (see summaries in Bigand, Parn- cutt, and Lerdahl 1996; Krumhansl 1990), also suggest that the P, R, and L transformations might have priority over the D transformation because the latter requires more than a minimal change of one tone. Given this, the first three of these transformations, P, R, and L, might provide a good model of triad distance as measured in empirical studies. The empirical measures to be examined come from an experiment deriving indirect mea- sures of triad distance from probe-tone ratings (Krumhansl and Kessler 1982). That study also produced a geometric representation, in the form of a torus, that will be used to represent various structures related to the neo-Riemannian transformations. The second set of empirical measures come from an experiment that collected judgments of chord tension in a fixed tonal context (Bigand, Parncutt, and Lerdahl 1996).
Derivation of the torus from probe-tone ratings
The toroidal configuration was derived from probe-tone ratings (Krum- hansl and Kessler 1982) through the following steps:1
1. Ten subjects (average years musical instruction 10.9) were pre- sented with the following contexts in both major and minor keys: I triad, IV V I cadence, VI V I cadence, and II V I cadence. Each con- text was followed on successive trials with each tone of the chro- matic scale (in random order); the final tone is called a probe tone (Krumhansl and Shepard 1979). (For example, the sequence con- sisting of F-, G-, and C-major triads was followed by some order-
266
This content downloaded from 128.84.127.82 on Wed, 3 Apr 2013 14:34:27 PMAll use subject to JSTOR Terms and Conditions
ing of the tones C, CO, D,.....B.) The subjects rated on a scale from 1 to 7 how well each probe tone "fit into or went with" the musical context just heard. The ratings were shifted to a common tonic for the different major keys and the different minor keys used in the study. Because the four context types produced similar results, they were averaged. This yielded a probe-tone profile for major contexts and for minor contexts (the numerical values appear in Krumhansl 1990, 37).
2. The probe-tone profiles were then shifted and correlated with one another. This yields an indirect measure of the distances between keys, which will be taken here to be approximately equal to the dis- tances between their tonic triads.2 For example, to obtain the dis- tance from C major to F minor, the major profile was shifted to tonic of C, the minor profile was shifted to tonic of F, and the two sets of twelve ratings (for the chromatic scale tones) were corre- lated. A correlation has a value between -1 and 1, where 1 is the maximum degree of similarity between the probe-tone profiles. In the present context, the correlations considered are those between C major and all other major and minor triads, denoted KKcor (the numerical values appear in Krumhansl 1990, 38).
3. The correlations between probe-tone profiles were entered into an analysis program called multidimensional scaling (MDS, Shepard 1962, available in statistical packages such as SYSTAT and SPSS). This analysis produces a configuration of points such that distances are inversely related to the KKcor values. In other words, probe- tone profiles that are similar (highly correlated) are represented by points that are close together in the space. The analysis found an excellent fit to the KKcor values with a 4-dimensional configuration in which the points fall on the surface of a torus (the coordinates appear in Krumhansl 1990, 42). The interpoint distances, measured by a Euclidean 4-dimensional metric, will be denoted KKdist.3
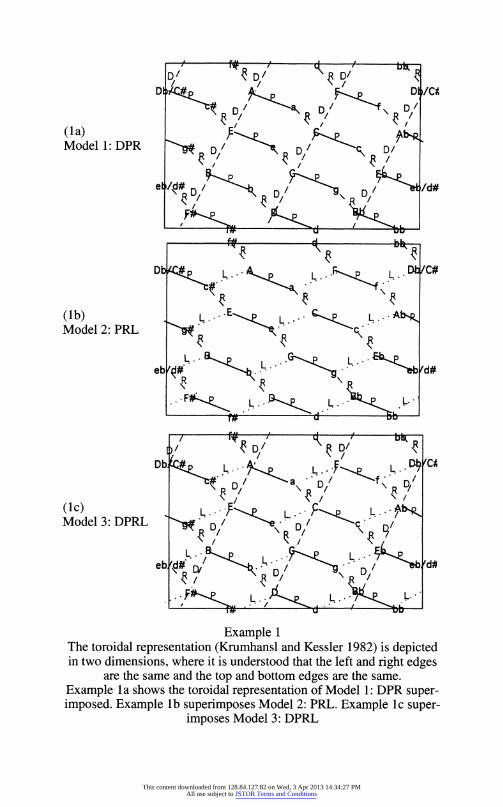
4. Because a torus is the cross-product of a circle with another circle, S' X S1, it can be depicted in two dimensions as shown in Example 1. The horizontal axis represents the angular distance around one of the circles and the vertical axis represents the angular distance around the other circle. In this representation, it is understood that the right edge is the same as the left edge, and the top edge is the same as the bottom edge.
The configuration was originally interpreted in terms of the three more familiar transformations shown in Example la: dominant, D, parallel major/minor, P, and relative major/minor, R.4 The question to be consid- ered next is whether the KKcor and KKdist values are better modeled if
267
This content downloaded from 128.84.127.82 on Wed, 3 Apr 2013 14:34:27 PMAll use subject to JSTOR Terms and Conditions
9 P All !D/I '
DI/ bi• D o
D I/C
D/ D/
/ D/ (la)
. '. Model 1: DPR D/ D D/
et /id# D/ /d#
K d
D
#••...LC# •. ,L.? ... (lb) L... E.. L..
Model 2: PRL
eb (d#
,C e• ,•# D,,•. ?
P - -1 'd
D• f. ... L..." . .. L. . . I J C
\R / I\
\ t Oc/
(Ic) L. / LL J' L.../b,4 Model 3: DPRL
// , /
eb 'd# I OW
/tl 'L?R /
D.C?_ .
Example 1 The toroidal representation (Krumhansl and Kessler 1982) is depicted in two dimensions, where it is understood that the left and right edges
are the same and the top and bottom edges are the same. Example 1 a shows the toroidal representation of Model 1: DPR super- imposed. Example lb superimposes Model 2: PRL. Example Ic super-
imposes Model 3: DPRL
This content downloaded from 128.84.127.82 on Wed, 3 Apr 2013 14:34:27 PMAll use subject to JSTOR Terms and Conditions

the Leittonwechsel transformation, L, is added to the model or is substi- tuted for the dominant transformation, D (because D can be expressed in terms of L and R).
Modeling triad distances with D, P, R, and L transformations
All models to be considered use the shortest-path distances. In other words, the distance between one triad and another will be taken to be the smallest number of transformations needed to move from one triad to the other. Three models will be compared:
Model 1. The model with D, P, and R transformations, that is, the orig- inal model, shown in Example 1a.
Model 2. The model with P, R, and L transformations, shown in Example lb.
Model 3. The model with D, P, R, and L transformations, shown in Example Ic.
Tables 1 and 2 show the number of each type of transformation for each model. The values shown are the transformations from C major to all major triads (Table 1) and from C major to all minor triads (Table 2). Under the number of transformations for each triad is an example of a shortest path.5 There can be alternative shortest-paths with the same num- ber of transformations. In most cases these have the same number of each kind of transformation (for example, to go from the C-major triad to the F-minor triad, there are two possibilities: RLP or PLR, both of which have one R, one L, and one P). In a few cases, two possible shortest-paths exist with different numbers of each of the transformations (for example, mov- ing from the C-major triad to the Db-major triad can be accomplished by PLRL, with one P, one R, and two Ls, or by RPLP, with two Ps, one R and one L). The values in parentheses indicate alternative shortest-path routes; the data analysis showed these produced slightly less clear results and will not be considered further.
All three models were tested using multiple regression which finds the best-fitting linear function predicting the dependent variable from a num- ber of independent variables. For example, in testing how well KKcor can be predicted by Model 1, KKcor is the dependent variable that is modeled as a weighted sum of the three variables D, P, and R (shown in the first three columns of Tables 1 and 2). The analysis returns a multiple correlation value, R, indicating how well the dependent variable is mod- eled, with 1 indicating that a perfect fit is obtained. R values are evalu- ated in terms of statistical significance, denoted p, an estimate of the probability of the result for random data. By convention, if p < .05, the result is considered statistically significant.
Table 3 summarizes the results of the multiple regression analyses for
269
This content downloaded from 128.84.127.82 on Wed, 3 Apr 2013 14:34:27 PMAll use subject to JSTOR Terms and Conditions
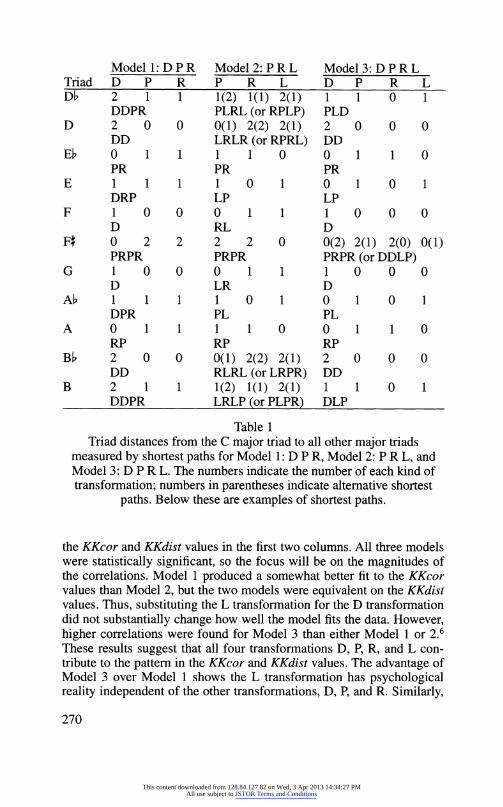
Model 1: DPR Model 2: PR L Model 3: DPRL Triad D P R P R L D P R L Db 2 1 1 1(2) 1(1) 2(1) 1 1 0 1
DDPR PLRL (or RPLP) PLD D 2 0 0 0(1) 2(2) 2(1) 2 0 0 0
DD LRLR (or RPRL) DD Eb 0 1 1 1 1 0 0 1 1 0
PR PR PR E 1 1 1 1 0 1 0 1 0 1
DRP LP LP F 1 0 0 0 1 1 1 0 0 0
D RL D F# 0 2 2 2 2 0 0(2) 2(1) 2(0) 0(1)
PRPR PRPR PRPR (or DDLP) G 1 0 0 0 1 1 1 0 0 0
D LR D Ab 1 1 1 1 0 1 0 1
DPR PL PL A 0 1 1 1 1 0 0 1 1 0
RP RP RP Bb 2 0 0 0(1) 2(2) 2(1) 2 0 0 0
DD RLRL (or LRPR) DD B 2 1 1 1(2) 1(1) 2(1) 1 1 0 1
DDPR LRLP (or PLPR) DLP
Table 1 Triad distances from the C major triad to all other major triads
measured by shortest paths for Model 1: D P R, Model 2: P R L, and Model 3: D P R L. The numbers indicate the number of each kind of transformation; numbers in parentheses indicate alternative shortest
paths. Below these are examples of shortest paths.
the KKcor and KKdist values in the first two columns. All three models were statistically significant, so the focus will be on the magnitudes of the correlations. Model 1 produced a somewhat better fit to the KKcor values than Model 2, but the two models were equivalent on the KKdist values. Thus, substituting the L transformation for the D transformation did not substantially change how well the model fits the data. However, higher correlations were found for Model 3 than either Model 1 or 2.6 These results suggest that all four transformations D, P, R, and L con- tribute to the pattern in the KKcor and KKdist values. The advantage of Model 3 over Model 1 shows the L transformation has psychological reality independent of the other transformations, D, P, and R. Similarly,
270
This content downloaded from 128.84.127.82 on Wed, 3 Apr 2013 14:34:27 PMAll use subject to JSTOR Terms and Conditions
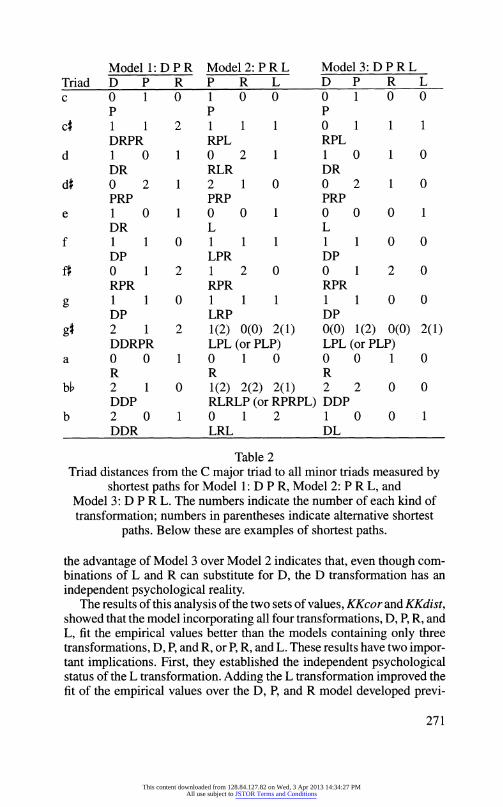
Model 1: DPR Model 2: PRL Model 3: DPRL Triad D P R P R L D P R L c 0 1 0 1 0 0 0 1 0 0
P P P c 1 1 2 1 1 1 0 1 1
DRPR RPL RPL d 1 0 1 0 2 1 1 0 1 0
DR RLR DR d 0 0 2 1 2 1 0 0 2 1 0
PRP PRP PRP e 1 0 1 0 0 1 0 0 0 1
DR L L f 1 1 0 1 1 1 1 1 0 0
DP LPR DP ft 0 1 2 1 2 0 0 1 2 0
RPR RPR RPR g 1 1 0 1 1 1 1 1 0 0
DP LRP DP g# 2 1 2 1(2) 0(0) 2(1) 0(0) 1(2) 0(0) 2(1)
DDRPR LPL (or PLP) LPL (or PLP) a 0 0 1 0 1 0 0 0 1 0
R R R bb 2 1 0 1(2) 2(2) 2(1) 2 2 0 0
DDP RLRLP (or RPRPL) DDP b 2 0 1 0 1 2 1 0 0 1
DDR LRL DL
Table 2 Triad distances from the C major triad to all minor triads measured by
shortest paths for Model 1: D P R, Model 2: P R L, and Model 3: D P R L. The numbers indicate the number of each kind of transformation; numbers in parentheses indicate alternative shortest
paths. Below these are examples of shortest paths.
the advantage of Model 3 over Model 2 indicates that, even though com- binations of L and R can substitute for D, the D transformation has an independent psychological reality.
The results of this analysis of the two sets of values, KKcor and KKdist, showed that the model incorporating all four transformations, D, P, R, and L, fit the empirical values better than the models containing only three transformations, D, P, and R, or P, R, and L. These results have two impor- tant implications. First, they established the independent psychological status of the L transformation. Adding the L transformation improved the fit of the empirical values over the D, P, and R model developed previ-
271
This content downloaded from 128.84.127.82 on Wed, 3 Apr 2013 14:34:27 PMAll use subject to JSTOR Terms and Conditions

KKcor KKdist BPLmus BPLnonmus
Model 1: D P R R = .94, p < .0001 R = .91, p < .0001 R = .74, p = .0009 R = .77, p = .0003
Model 2: PR L R = .90, p < .0001 R= .91, p < .0001 R= .74, p= .0011 R= .78, p= .0002
Model 3: DPRL R = .97, p < .0001 R = .96, p < .0001 R = .83, p < .0001 R = .87, p < .0001
Tonal Pitch Space R =.90, p < .0001 R = .89, p < .0001 R =.82, p < .0001 R = .73, p < .0001
Pitch Commonality R =.85, p < .0001 R = .88, p < .0001 R = .81, p < .0001 R = .83, p < .0001
Horizontal Motion R =.35, n.s. R = .41, p < .05 R = .47, p = .02 R = .78, p < .0001
Table 3 Statistical results of the models tested. The four sets of empirical values from the studies by Krumhansl and Kessler (1982) and Bigand, Parn- cutt, and Lerdahl (1996) were fit by Model 1: D P R, Model 2: P R L,
and Model 3: D P R L as shown in the first three rows of statistics. Three additional models were also tested: the tonal pitch space model
(Lerdahl 1988), pitch commonality (Parncutt, 1989), and the actual pitch distances in the chord tension study (Bigand et al. 1996).
ously (Krumhansl and Kessler 1982). Psychologically, this can be ex- plained by the importance of pitch proximity and the fact that the L trans- formation involves shifting a single tone by just one chromatic step. Sec- ond, these results established the independent psychological status of the D transformation, indicating that combinations of R and L transforma- tions cannot substitute for the D transformation. This is consistent with empirical results showing that the dominant relation is an important underlying principle in psychological representations of pitch. Before examining whether these results extend to two other sets of empirical val- ues, some structures on the toroidal representation will be described.
Structures on the toroidal representation
Examples 2a, b, and c show the subgroups generated by P R, P L, and R L, respectively, on the toroidal representation (Krumhansl and Kessler 1982). Cohn (1997) calls these 'binary-generated' subgroups. The trans- formation pair P R generates three subgroups of order 8 that cut diago- nally across the toroidal representation from upper left to lower right; tonics are separated by minor thirds. The shortest-path distance used in
272
This content downloaded from 128.84.127.82 on Wed, 3 Apr 2013 14:34:27 PMAll use subject to JSTOR Terms and Conditions

Db f Db/C#
(2a) • PR Subgroups Order 8
eb K
d#
u ..L.../C#
(2b) PL Subgroups Order 6
Lt.. .
L G L. d# e d# d#
S..F L
Db/C# L.. A LF.. L.
Dt/C# D .
A\LR \
RR L .E L- L ..Ab
(2c) RL Group R R R Order 24 L8 G Eb
ebl: L
9\ el/d# \R ,R
L .D b
Example 2 Neo-Riemannian structures shown on the toroidal representation
(Krumhansl and Kessler 1982). Example 2a shows the three PR subgroups of order 8. Example 2b shows the four PL subgroups of order 6. Example 2c shows the RL
group of order 24.
273
This content downloaded from 128.84.127.82 on Wed, 3 Apr 2013 14:34:27 PMAll use subject to JSTOR Terms and Conditions

f#, d bb...... .
Db/ A EDb/#
c+• "
•. A•.K•f (• C#6 A #bAl
E T"
"Ebb E CAb
"-..g#.,"-e "" 0..0
B G Eb
eb/d 0 "b b
"gD
D
C, IV, \A
F*? D 13bb
. -. ,.X. FLIP-LA Example 3
The P, R, and L transformations are superimposed on the toroidal representation (Krumhansl and Kessler 1982). The tones indicated in outline letters at each vertex are the tones that exchange between that
vertex and neighboring vertices. Each hexagon has a common exchanging tone, indicated in the center of the hexagon surrounded
by the small hexagon.
Model 1: D P R can be conceptualized as distance along the P R subgroup with the D transformation (the other transformation in the model) used to move from the reference C major to the appropriate P R subgroup. The transformation pair P L generates four subgroups of order 6 that cut across the toroidal representation horizontally. Tonics are separated by major thirds. The shortest-path distance used in Model 2: P R L can be concep- tualized as distance along the P L subgroup with the R transformation (the other transformation in the model) used to move from the reference C
274
This content downloaded from 128.84.127.82 on Wed, 3 Apr 2013 14:34:27 PMAll use subject to JSTOR Terms and Conditions

major to the appropriate P L subgroup. The transformation pair R L gen- erates one complete group of order 24; it is the circle of fifths, with minor keys interspersed between their R and L related major keys.
Example 3 shows the Model 2: P R L representation (see also Dou- thett and Steinbach 1998). The exchanging notes are added at each ver- tex in outline letters. For example, the vertex C major has C exchanging with B (E minor), E exchanging with Eb (C minor), and G exchanging with A (A minor) with the L, P, R transformations, respectively. As can be seen, the six vertices of each hexagon have a common exchanging tone. For example, the hexagon with the vertices C major, C minor, Ab major, F minor, F major, and A minor share the common exchanging tone of C. The common exchanging tone is indicated at the center of each hexagon (outlined by the small hexagon). Going along the diagonals from lower left to upper right, the circle of fifths appears in the exchanging tones. Going along the diagonals from upper left to lower right, three subgroups of order 4 separated by minor thirds appear in the exchanging tones. Thus, the representation derived from the exchanging tones replicates the D transformation and the P R subgroups (Example 2a) found in the toroidal representation. Moreover, the representation of exchanging tones sug- gests that in regions of the space certain tones might be psychologically primed as potential exchanging tones. This would account, for example, for the readiness with which listeners assimilate modulations to closely related keys (Krumhansl and Kessler 1982).
The discussion so far has focused on only four transformations: D, P, R, and L. It might be of interest to consider the geometric representation of some of the other Riemannian transformations. Example 4 shows the six Riemannian Schritte described by Klumpenhouwer (1994). These take a major triad to another major triad (Example 4a), and a minor triad to another minor triad (Example 4b). The transformations are: Quint- schritt, (Q), Gegenquintschritt (-Q), Terzschritt (T), Leittonschritt (L, to be distinguished from the use of L above and below as meaning Leitton- wechsel), Ganztonschritt (G), and Kleinterzschritt (K). Comparing the two figures makes clear the complementary nature of the transformations for major and minor triads. In principle, it would be possible to ascertain using the above method whether any of these transformations has an independent psychological reality from the other transformations con- sidered here.7
Judgments of chord tension
An independent set of empirical data on triad distances comes from a study of musical tension (Bigand et al. 1996).8 The essential details of the methodology are:
275
This content downloaded from 128.84.127.82 on Wed, 3 Apr 2013 14:34:27 PMAll use subject to JSTOR Terms and Conditions

Riemannian Schritts for Major Triads
(4a)
D b
)
C # A F D
b
)C
#
c# f
-Q T C Ab
g# c
B GEb
eb)d# b G eb d#
F# D Bb
Riemannian Schritts for Minor Triads
(4b) f# d bb
Db C# A F Db C# G
c# a f
E c Q Ab
g# e-Q K
B G Eb eb'd# b g eb d#
F# D Bb
f# dbb
Example 4 Shows Riemannian Schritts (Klumpenhouwer 1994) superimposed on
the toroidal representation (Krumhansl and Kessler 1982). Example 4a shows the Schritte for major triads; Example 4b shows the
Schritte for minor triads.
276
This content downloaded from 128.84.127.82 on Wed, 3 Apr 2013 14:34:27 PMAll use subject to JSTOR Terms and Conditions

1. Two groups of subjects participated, fourteen music conservatory students and fourteen musically naive students. The data from the two groups of students will be denoted BPLmus and BPLnonmus, respectively.
2. Each trial began with a short sequence in C major, followed by three chords: C major, X, C major. The X chord was any of the twelve pos- sible major, minor, major-minor seventh, or minor seventh chords. Only the data for the major and minor triads will be considered because these can be compared directly with the KKcor and KKdist values analyzed above.
3. The subject's task was to rate the tension produced by the second chord of each trial on a 12-point scale. The tension ratings will be taken as an indirect measure of psychological distance from C major.9
Before turning to other models considered in Bigand et al. 1996, the BPLmus and BPLnonmus data will be analyzed with Models 1, 2, and 3. The correlation values for these three models are shown in the two right- hand columns of Table 2. As before, Models 1 and 2 achieved approxi- mately equally good fits to the data, but Model 3 provided a better fit then either of the other models.' The advantage of Model 3 over Model 1 shows the independent psychological status of the L transformation, while the advantage of Model 3 over Model 2 shows the independent psycho- logical status of the D transformation. Compared with the model fits to KKcor and KKdist, the present correlations were somewhat lower, and the optimal weights for the linear model were somewhat different. However, again, the best fitting model was Model 3: D P R L. In general, the musi- cians' data were the least well fit by any of the three models, suggesting that further analysis is needed to understand musicians' cognitive repre- sentation of triad distances, with an eye toward understanding the rela- tionships between the different models.
Other models of triad distance
The original article (Bigand et al. 1996) tested a number of other mod- els. The first model was Lerdahl's (1988) tonal pitch space theory which consists of three components. The first component is pitch-class proxim- ity, which measures the number of distinctive elements in the basic pitch space. The basic pitch space consists of five levels: chromatic, diatonic, triadic, fifth, and root. In a given key region, the root is represented at five levels, the fifth above the root at four levels, the third above the root at three levels, other scale tones at two levels, and nonscale tones at one level. Pitch-class proximity is the number of distinctive elements of the second triad compared with the first (in this case, C major). The second
277
This content downloaded from 128.84.127.82 on Wed, 3 Apr 2013 14:34:27 PMAll use subject to JSTOR Terms and Conditions

component is triad proximity within a key, measured as distance around the diatonic circle of fifths (C-G-D-A-E-B-F-C). The third space is the distances between keys or regions, measured on the chromatic circle of fifths (C-G-D-A-E-B-F#-Db-Ab-Eb-Bb-F-C). The distances measured in all three spaces are summed to give the predicted distances from C major to each triad. Any triad can, of course, be represented in a number of dif- ferent key regions, so Lerdahl uses a shortest-path criterion. For exam- ple, the shortest path from C major to A major is V/d.
Table 3 shows the correlations between the tonal pitch space predic- tions and the four data sets considered here. For all except BPLmus, Model 3: D P R L gives a better account of the data; the two models are essentially equivalent for the BPLmus data. This result suggests that, compared to nonmusicians, musicians more strongly weigh a hierarchi- cal model of embedded tone, triad, and key (region) distances in judging chord tension. In summary, of the various music-theoretic models of triad distance, the strongest empirical support is for Model 3: D P R L, with the exception just noted of the judgments of chord tension made by musi- cians.
A psychoacoustically-based model of chord tension was also tested (Bigand et al. 1996). It is based on known properties of sensory process- ing, independent of cognitive representations that are acquired through learning. The model, called pitch commonality, was developed from pre- vious work on virtual pitch (Terhardt 1974; Parncutt 1989). According to this approach, the perceived pitches of a triad are not limited to the notated pitches and their harmonics. Virtual pitches are also perceived to the extent that the spectral (physically present) pitches approximate a har- monic series above the virtual pitch. So, for example, an Eb-major triad weakly implies the pitch C. The pitch commonality model computes the predicted pitch salience of each X chord and compares these (by correla- tion) with the predicted pitch salience of the reference C-major triad. The resulting pitch commonality predictions were correlated with the four sets of empirical values, as shown in the next line of Table 3. The results were very similar to those for the tonal pitch space model (Lerdahl 1988). That is, for all except BPLmus, Model 3: D P R L gave a better account of the data; the two models were essentially equivalent for the BPLmus data. Overall, Model 3: D P R L provided the most accurate predictions for the data.
The final analysis considered the voicing of the chords in the Bigand et al. (1996) experiment. The independent variable used in this model, horizontal motion, is the sum of the sizes of the intervals covered by each voice when passing from the C-major chord to the X chord. This is com- puted from actual pitches, not abstract pitch classes. The horizontal motion values, when correlated with the four empirical sets of values, pro- duced the results shown in the last row of Table 3. As would be expected,
278
This content downloaded from 128.84.127.82 on Wed, 3 Apr 2013 14:34:27 PMAll use subject to JSTOR Terms and Conditions

given that these values are based on the particulars of the Bigand et al. (1996) experiment, the correlations were low for the KKcor and KKdist values. The correlation between horizontal motion and the BPLnonmus data was relatively high, although lower than Model 3: D P R L. This is interesting in the present context because it shows a direct effect of tone distance on the chord tension judgments. Horizontal motion added to Model 3: D P R L resulted in a very good fit of the BPLnonmus data,11 suggesting that tone distance measured both in terms of actual pitches and abstract pitch classes (as embodied in Model 3: D P R L ) are psycho- logically highly salient for nonmusicians.
The analysis of the data from the Bigand et al. (1996) study found dif- ferent results for musicians and the nonmusicians. For the musicians, three models performed approximately equally: the D, P, R, and L model, the tonal pitch space model, and the pitch commonality model. That the tonal pitch space model performed relatively well for these data suggests that musicians employ a hierarchical model of embedded tone, triad, and key (region) distances in judging chord tension. That the pitch common- ality model also performed well reinforces Parncutt's (1989) claim that music-theoretic constructs such as those tested in the D, P, R, and L and tonal pitch space models have a psychoacoustic basis.12 For the nonmu- sicians, the model using the four transformations, D, P, R, and L, provided the best fit of the empirical values, as it had for the Krumhansl and Kes- sler (1982) values. In addition, the nonmusicians' data correlated quite strongly with the Bigand et al. (1996) measure of horizontal motion. This suggests that nonmusicians are especially sensitive to pitch proximity, the principle underlying the neo-Riemannian transformations, measured in both actual and abstract pitch class distances.13
279
This content downloaded from 128.84.127.82 on Wed, 3 Apr 2013 14:34:27 PMAll use subject to JSTOR Terms and Conditions
NOTES
1. Only the directly relevant aspects of the methods will be described. 2. This is justified given the similar ratings for the tonic triads and the cadences,
although it might be objected that this confuses tonic triads with the keys schemat- ically represented by the cadences. The similarity between the probe-tone profiles for triads and cadences can be understood, however, because the latter all ended on the tonic triad.
3. The differences between KKcor and KKdist, although minor, may be important because the latter are distances in a geometric representation that abstracts the pat- terns underlying the correlations.
4. The dominant transformation, D, is shown only for major triads; it applies equally to minor triads.
5. The convention will be used that the left-most transformation is the first transfor- mation applied.
6. The following analysis was done to demonstrate that the improvement of Model 3 was not simply a matter of adding one more independent variable (and thus reduc- ing the degrees of freedom by one). For Model 1, 2, and 3, the unweighted sum of the independent variables was correlated with the KKcor and KKdist values. All these correlations have the same number of degrees of freedom. This produced the following results: Model 1, correlation of SUM(D,P,R) = .91 and .88 for KKcor and KKdist, respectively. Model 2, correlation of SUM(P,R,L) = .73 and .78 for KKcor and KKdist, respectively. Model 3, correlation of SUM(D,P,R,L) = .95 and .95 for KKcor and KKdist, respectively. Again, by this measure Model 3 fit the val- ues consistently better than the other two models.
7. Kopp (1995) criticized Lewin for privileging the P, R, and L transformations, and emphasized instead the third-related triads of the same mode (shown in Example 4).
8. I am grateful to Emmanuel Bigand for providing the data for the musicians and nonmusicians in the study (Bigand et al. 1996).
9. This is supported by the significant correlations between BPLmus and BPLnon- mus data, on the one hand, and the KKcor and KKdist values, on the other. The correlations for the BPLmus were r = .81 and .83 for KKcor and KKdist values, respectively; the corresponding correlations for the BPLnonmus were r = .73 and .77. These significant correlations show that these different empirical measures tap into the same or similar cognitive representations of triad distance.
10. To demonstrate that the improvement of Model 3 was not simply a matter of adding one more independent variable (and thus reducing the degrees of freedom by one), the unweighted sum of the independent variables was correlated with the BPLmus and BPLnonmus values for Model 1, 2, and 3. This produced the follow- ing results: Model 1, correlation of SUM(D,P,R) = .74 and .75 for BPLmus and BPLnonmus, respectively. Model 2, correlation of SUM(P,R,L) = .68 and .78 for BPLmus and BPLnonmus, respectively. Model 3, correlation of SUM(D,P,R,L) = .82 and .78 for BPLmus and BPLnonmus, respectively. Again, by this measure Model 3 fit the values better than the other two models except for the equal fits of Model 2 and Model 3 for the BPLnonmus data.
11. The multiple correlation predicting BPLnonmus using Model 3 D P R L and hor- izontal motion was R = .95, p < .0001
280
This content downloaded from 128.84.127.82 on Wed, 3 Apr 2013 14:34:27 PMAll use subject to JSTOR Terms and Conditions

12. That these three models have strong underlying commonalities is supported by the fact that the tonal pitch space and the pitch commonality models can be quite well accounted for by Model 3 D P R L, with multiple correlations of R = .94 and .91, respectively.
13. I am grateful to Richard Cohn, Fred Lerdahl, and John Clough for comments on an earlier version of this manuscript.
281
This content downloaded from 128.84.127.82 on Wed, 3 Apr 2013 14:34:27 PMAll use subject to JSTOR Terms and Conditions