pepsico, inc. - stockproinfo inc filed this form 8 k on 04/18/2016 entire document > united...
TRANSCRIPT
19/4/2016 PepsiCo SEC Filings
http://phx.corporateir.net/phoenix.zhtml?c=78265&p=irolSECText&TEXT=aHR0cDovL2FwaS50ZW5rd2l6YXJkLmNvbS9maWxpbmcueG1sP2lwYWdl… 1/34
Print Page Close Window
SEC Filings
8K
PEPSICO INC filed this Form 8K on 04/18/2016
Entire Document
<< Previous Page | Next Page >>
UNITED STATESSECURITIES AND EXCHANGE COMMISSION
WASHINGTON, D.C. 20549
FORM 8KCURRENT REPORT
Pursuant to Section 13 or 15(d) of theSecurities Exchange Act of 1934
Date of Report (Date of earliest event reported): April 18, 2016
PepsiCo, Inc.(Exact name of registrant as specified in its charter)
North Carolina 11183 131584302(State or other jurisdiction
of incorporation) (CommissionFile Number)
(IRS EmployerIdentification No.)
700 Anderson Hill RoadPurchase, New York 10577
(Address of principal executive offices)
Registrant’s telephone number, including area code: (914) 2532000
N/A(Former name or former address, if changed since last report)
Check the appropriate box below if the Form 8K filing is intended to simultaneously satisfy the filingobligation of the registrant under any of the following provisions:
Written communications pursuant to Rule 425 under the Securities Act (17 CFR 230.425)
Soliciting material pursuant to Rule 14a12 under the Exchange Act (17 CFR 240.14a12)
Precommencement communications pursuant to Rule 14d2(b) under the Exchange Act (17 CFR 240.14d2(b))
19/4/2016 PepsiCo SEC Filings
http://phx.corporateir.net/phoenix.zhtml?c=78265&p=irolSECText&TEXT=aHR0cDovL2FwaS50ZW5rd2l6YXJkLmNvbS9maWxpbmcueG1sP2lwYWdl… 2/34
Precommencement communications pursuant to Rule 13e4(c) under the Exchange Act (17 CFR 240.13e4(c))

19/4/2016 PepsiCo SEC Filings
http://phx.corporateir.net/phoenix.zhtml?c=78265&p=irolSECText&TEXT=aHR0cDovL2FwaS50ZW5rd2l6YXJkLmNvbS9maWxpbmcueG1sP2lwYWdl… 3/34
Item 2.02. Results of Operations and Financial Condition.The information in this Item 2.02, including Exhibit 99.1 attached hereto, is being furnished and shall not bedeemed “filed” for the purposes of Section 18 of the Securities Exchange Act of 1934, as amended(“Exchange Act”), or otherwise subject to the liabilities of that Section and shall not be incorporated byreference into any registration statement or other document pursuant to the Securities Act of 1933, asamended, or the Exchange Act, except as otherwise expressly stated in such filing.
Attached as Exhibit 99.1 and incorporated by reference into this Item 2.02 is a copy of the press releaseissued by PepsiCo, Inc. (“PepsiCo”), dated April 18, 2016, reporting PepsiCo’s financial results for the 12weeks ended March 19, 2016.
Item 9.01. Financial Statements and Exhibits.(d) Exhibits99.1 Press Release issued by PepsiCo, Inc., dated April 18, 2016.

19/4/2016 PepsiCo SEC Filings
http://phx.corporateir.net/phoenix.zhtml?c=78265&p=irolSECText&TEXT=aHR0cDovL2FwaS50ZW5rd2l6YXJkLmNvbS9maWxpbmcueG1sP2lwYWdl… 4/34
SIGNATURES
Pursuant to the requirements of the Securities Exchange Act of 1934, the registrant has duly causedthis report to be signed on its behalf by the undersigned hereunto duly authorized.
PEPSICO, INC.
Date: April 18, 2016 By: /s/ Tony West Name: Tony West
Title: Executive Vice President, Government Affairs,
General Counsel and Corporate Secretary
19/4/2016 PepsiCo SEC Filings
http://phx.corporateir.net/phoenix.zhtml?c=78265&p=irolSECText&TEXT=aHR0cDovL2FwaS50ZW5rd2l6YXJkLmNvbS9maWxpbmcueG1sP2lwYWdl… 5/34
INDEX TO EXHIBITS
Exhibit No. Description99.1 Press Release issued by PepsiCo, Inc., dated April 18, 2016.
Exhibit 99.1
Purchase, New York Telephone: 9142532000 www.pepsico.com
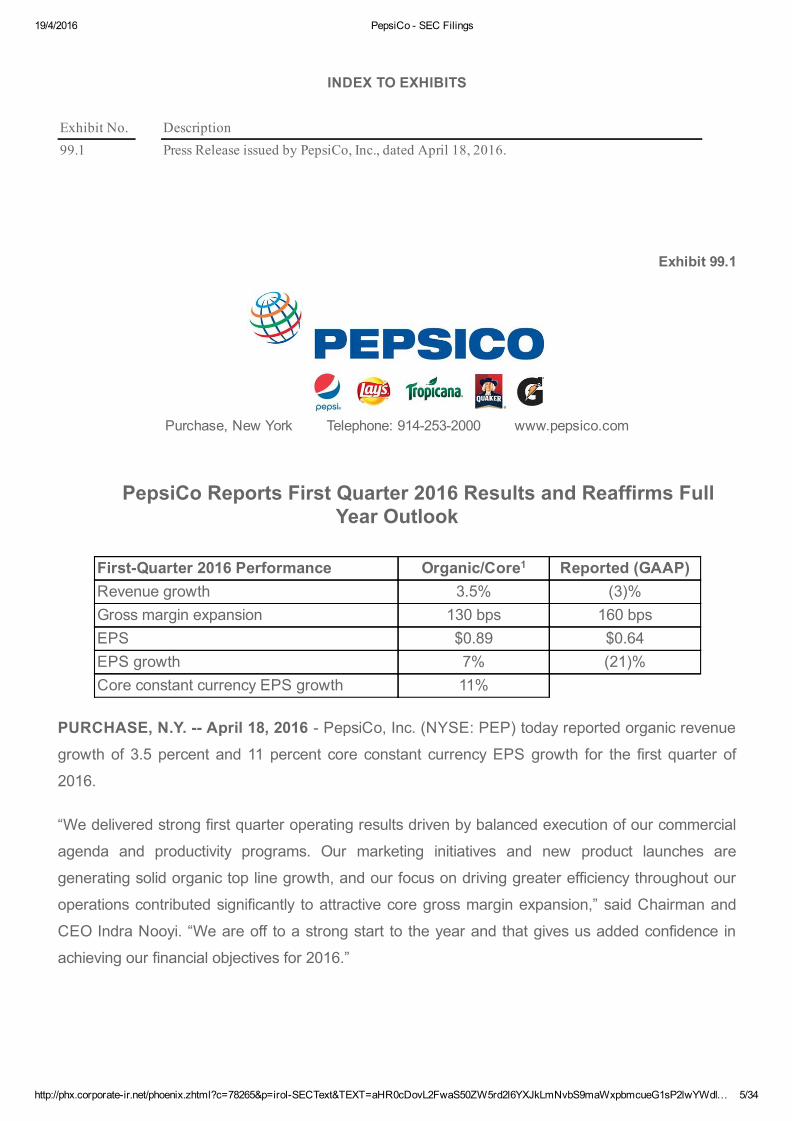
PepsiCo Reports First Quarter 2016 Results and Reaffirms FullYear Outlook
FirstQuarter 2016 Performance Organic/Core1 Reported (GAAP)Revenue growth 3.5% (3)%Gross margin expansion 130 bps 160 bpsEPS $0.89 $0.64EPS growth 7% (21)%Core constant currency EPS growth 11%
PURCHASE, N.Y. April 18, 2016 PepsiCo, Inc. (NYSE: PEP) today reported organic revenuegrowth of 3.5 percent and 11 percent core constant currency EPS growth for the first quarter of2016.
“We delivered strong first quarter operating results driven by balanced execution of our commercialagenda and productivity programs. Our marketing initiatives and new product launches aregenerating solid organic top line growth, and our focus on driving greater efficiency throughout ouroperations contributed significantly to attractive core gross margin expansion,” said Chairman andCEO Indra Nooyi. “We are off to a strong start to the year and that gives us added confidence inachieving our financial objectives for 2016.”
19/4/2016 PepsiCo SEC Filings
http://phx.corporateir.net/phoenix.zhtml?c=78265&p=irolSECText&TEXT=aHR0cDovL2FwaS50ZW5rd2l6YXJkLmNvbS9maWxpbmcueG1sP2lwYWdl… 6/34
1 Unless otherwise indicated, the reference to revenue is organic and the remaining metrics are on a core basis.Please refer to the Glossary for the definitions of NonGAAP financial measures including core, constant currency,organic and free cash flow.
1
19/4/2016 PepsiCo SEC Filings
http://phx.corporateir.net/phoenix.zhtml?c=78265&p=irolSECText&TEXT=aHR0cDovL2FwaS50ZW5rd2l6YXJkLmNvbS9maWxpbmcueG1sP2lwYWdl… 7/34
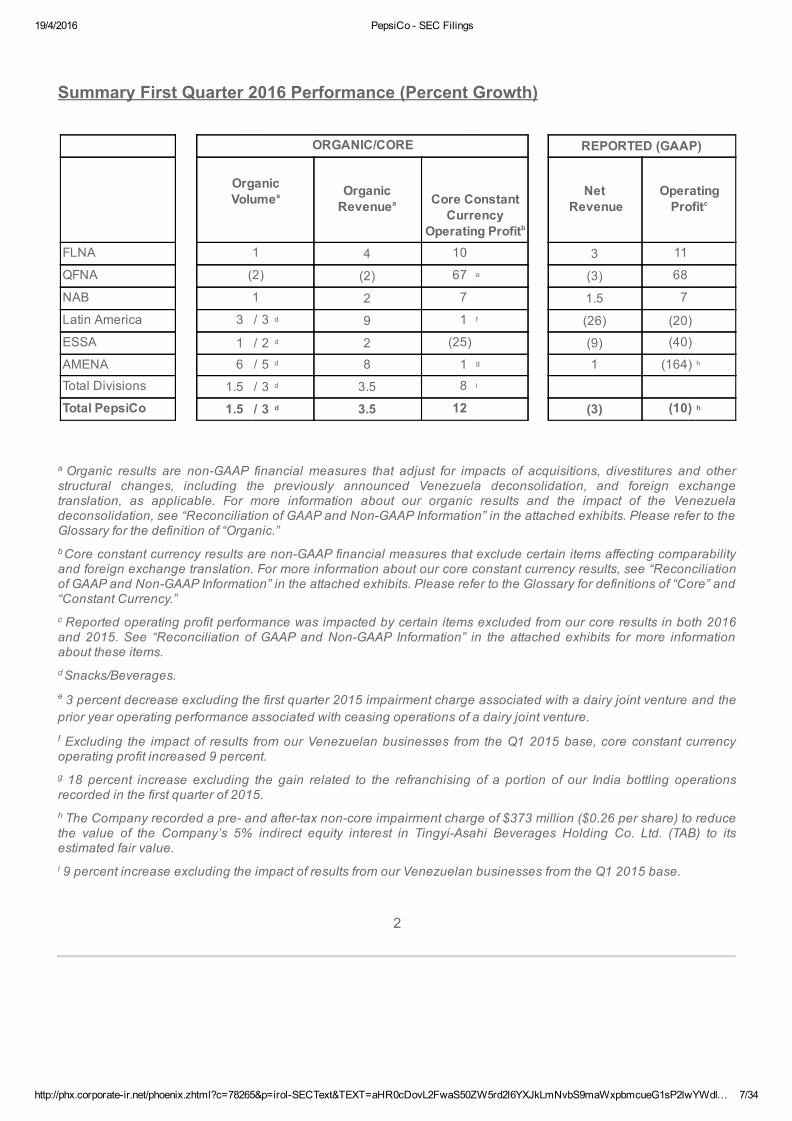
Summary First Quarter 2016 Performance (Percent Growth)
ORGANIC/CORE REPORTED (GAAP)
OrganicVolumea Organic
Revenuea Core ConstantCurrency
Operating Profitb
Net Revenue
OperatingProfitc
FLNA 1 4 10 3 11 QFNA (2) (2) 67 e (3) 68 NAB 1 2 7 1.5 7 Latin America 3 / 3 d 9 1 f (26) (20) ESSA 1 / 2 d 2 (25) (9) (40) AMENA 6 / 5 d 8 1 g 1 (164) h
Total Divisions 1.5 / 3 d 3.5 8 i Total PepsiCo 1.5 / 3 d 3.5 12 (3) (10) h
a Organic results are nonGAAP financial measures that adjust for impacts of acquisitions, divestitures and otherstructural changes, including the previously announced Venezuela deconsolidation, and foreign exchangetranslation, as applicable. For more information about our organic results and the impact of the Venezueladeconsolidation, see “Reconciliation of GAAP and NonGAAP Information” in the attached exhibits. Please refer to theGlossary for the definition of “Organic.”b Core constant currency results are nonGAAP financial measures that exclude certain items affecting comparabilityand foreign exchange translation. For more information about our core constant currency results, see “Reconciliationof GAAP and NonGAAP Information” in the attached exhibits. Please refer to the Glossary for definitions of “Core” and“Constant Currency.”c Reported operating profit performance was impacted by certain items excluded from our core results in both 2016and 2015. See “Reconciliation of GAAP and NonGAAP Information” in the attached exhibits for more informationabout these items.d Snacks/Beverages.e 3 percent decrease excluding the first quarter 2015 impairment charge associated with a dairy joint venture and theprior year operating performance associated with ceasing operations of a dairy joint venture.f Excluding the impact of results from our Venezuelan businesses from the Q1 2015 base, core constant currencyoperating profit increased 9 percent.g 18 percent increase excluding the gain related to the refranchising of a portion of our India bottling operationsrecorded in the first quarter of 2015.h The Company recorded a pre and aftertax noncore impairment charge of $373 million ($0.26 per share) to reducethe value of the Company’s 5% indirect equity interest in TingyiAsahi Beverages Holding Co. Ltd. (TAB) to itsestimated fair value.i 9 percent increase excluding the impact of results from our Venezuelan businesses from the Q1 2015 base.
2

19/4/2016 PepsiCo SEC Filings
http://phx.corporateir.net/phoenix.zhtml?c=78265&p=irolSECText&TEXT=aHR0cDovL2FwaS50ZW5rd2l6YXJkLmNvbS9maWxpbmcueG1sP2lwYWdl… 8/34
Summary of First Quarter Financial Performance:
• Organic revenue grew 3.5 percent and reported net revenue declined 3 percent. Foreignexchange translation had a 4.5percentagepoint unfavorable impact and the Venezueladeconsolidation had a 2percentagepoint unfavorable impact on reported net revenue.
• Core gross margin expanded 130 basis points and core operating margin increased 165 basispoints. Margin expansion reflects the implementation of effective revenue managementstrategies and previously announced productivity initiatives, partially offset by a 65 basis pointincrease in advertising and marketing expense as a percentage of sales. Reported grossmargin expanded 160 basis points, while reported operating margin contracted 105 basispoints reflecting a $373 million noncore impairment charge related to our 5% indirect equityinterest in TAB.
• Core constant currency operating profit increased 12 percent. Reported operating profitdecreased 10 percent reflecting the noncore impairment charge mentioned above.
• The Company’s core effective tax rate was 24.7 percent, which compares to 23.0 percent inthe prioryear quarter. The reported effective tax rate of 31.9 percent compares to 23.1percent in the prior year quarter and was impacted by the noncore impairment chargereferred to above, which had no tax benefit.
• Core EPS was $0.89 and reported EPS was $0.64. Core EPS excludes a $0.26 per sharenoncore impairment charge related to our 5% indirect equity interest in TAB.
• Cash flow provided by operating activities was $131 million.
3
19/4/2016 PepsiCo SEC Filings
http://phx.corporateir.net/phoenix.zhtml?c=78265&p=irolSECText&TEXT=aHR0cDovL2FwaS50ZW5rd2l6YXJkLmNvbS9maWxpbmcueG1sP2lwYWdl… 9/34
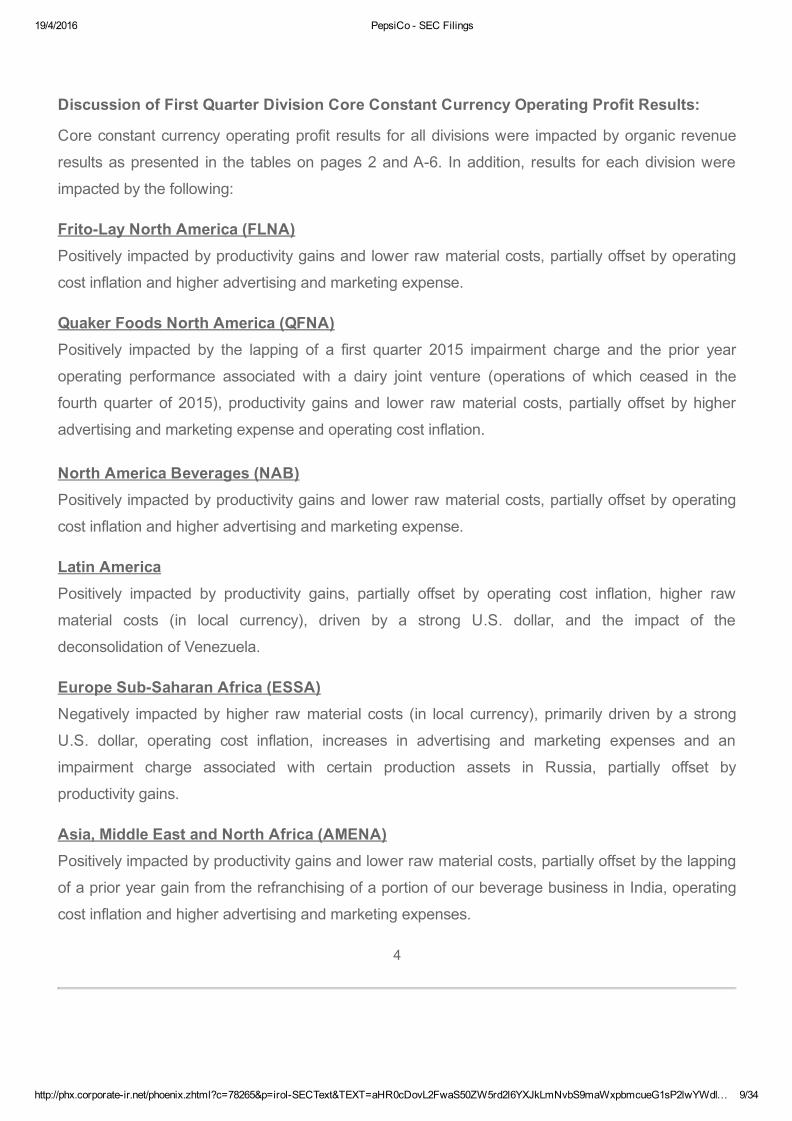
Discussion of First Quarter Division Core Constant Currency Operating Profit Results:
Core constant currency operating profit results for all divisions were impacted by organic revenueresults as presented in the tables on pages 2 and A6. In addition, results for each division wereimpacted by the following:
FritoLay North America (FLNA)Positively impacted by productivity gains and lower raw material costs, partially offset by operatingcost inflation and higher advertising and marketing expense.
Quaker Foods North America (QFNA)Positively impacted by the lapping of a first quarter 2015 impairment charge and the prior yearoperating performance associated with a dairy joint venture (operations of which ceased in thefourth quarter of 2015), productivity gains and lower raw material costs, partially offset by higheradvertising and marketing expense and operating cost inflation.
North America Beverages (NAB)Positively impacted by productivity gains and lower raw material costs, partially offset by operatingcost inflation and higher advertising and marketing expense.
Latin AmericaPositively impacted by productivity gains, partially offset by operating cost inflation, higher rawmaterial costs (in local currency), driven by a strong U.S. dollar, and the impact of thedeconsolidation of Venezuela.
Europe SubSaharan Africa (ESSA)Negatively impacted by higher raw material costs (in local currency), primarily driven by a strongU.S. dollar, operating cost inflation, increases in advertising and marketing expenses and animpairment charge associated with certain production assets in Russia, partially offset byproductivity gains.
Asia, Middle East and North Africa (AMENA)Positively impacted by productivity gains and lower raw material costs, partially offset by the lappingof a prior year gain from the refranchising of a portion of our beverage business in India, operatingcost inflation and higher advertising and marketing expenses.
4
19/4/2016 PepsiCo SEC Filings
http://phx.corporateir.net/phoenix.zhtml?c=78265&p=irolSECText&TEXT=aHR0cDovL2FwaS50ZW5rd2l6YXJkLmNvbS9maWxpbmcueG1sP2lwYWd… 10/34
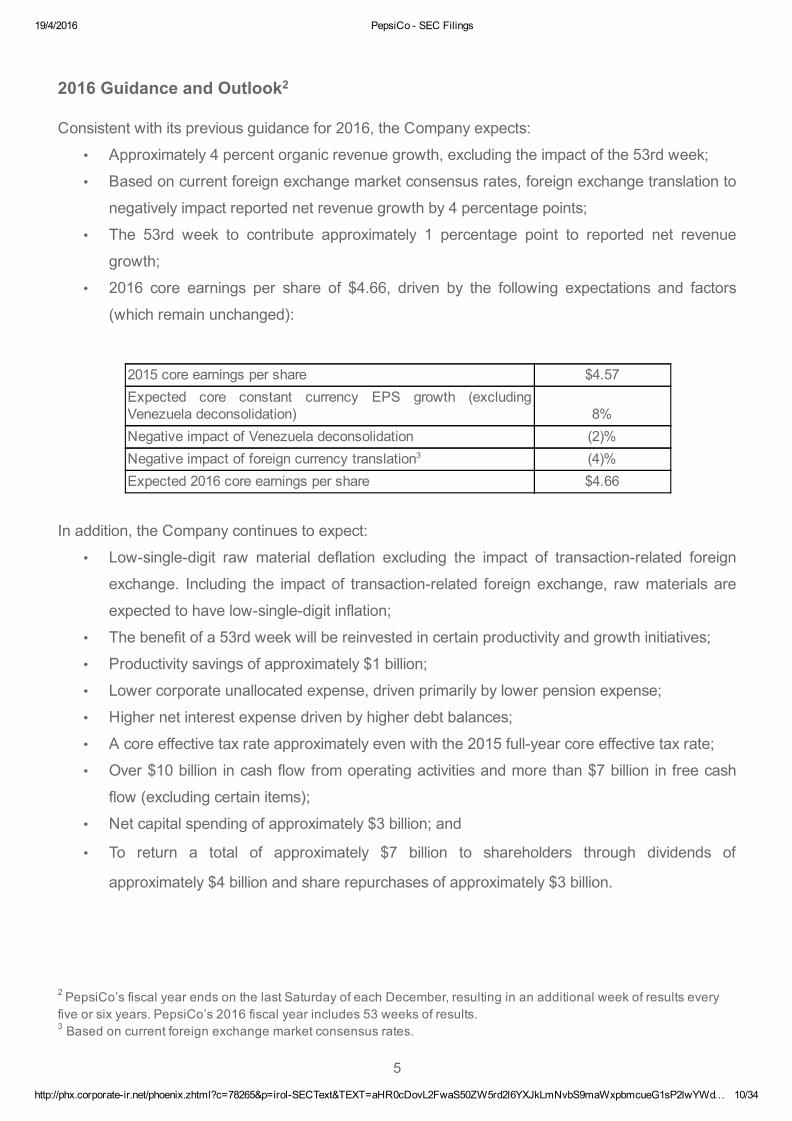
2016 Guidance and Outlook2
Consistent with its previous guidance for 2016, the Company expects:• Approximately 4 percent organic revenue growth, excluding the impact of the 53rd week;• Based on current foreign exchange market consensus rates, foreign exchange translation to
negatively impact reported net revenue growth by 4 percentage points;• The 53rd week to contribute approximately 1 percentage point to reported net revenue
growth;• 2016 core earnings per share of $4.66, driven by the following expectations and factors
(which remain unchanged):
2015 core earnings per share $4.57Expected core constant currency EPS growth (excludingVenezuela deconsolidation) 8%Negative impact of Venezuela deconsolidation (2)%Negative impact of foreign currency translation3 (4)%Expected 2016 core earnings per share $4.66
In addition, the Company continues to expect:• Lowsingledigit raw material deflation excluding the impact of transactionrelated foreign
exchange. Including the impact of transactionrelated foreign exchange, raw materials areexpected to have lowsingledigit inflation;
• The benefit of a 53rd week will be reinvested in certain productivity and growth initiatives;• Productivity savings of approximately $1 billion;• Lower corporate unallocated expense, driven primarily by lower pension expense;• Higher net interest expense driven by higher debt balances;• A core effective tax rate approximately even with the 2015 fullyear core effective tax rate;• Over $10 billion in cash flow from operating activities and more than $7 billion in free cash
flow (excluding certain items);• Net capital spending of approximately $3 billion; and
• To return a total of approximately $7 billion to shareholders through dividends of
approximately $4 billion and share repurchases of approximately $3 billion.
2 PepsiCo’s fiscal year ends on the last Saturday of each December, resulting in an additional week of results everyfive or six years. PepsiCo’s 2016 fiscal year includes 53 weeks of results.3 Based on current foreign exchange market consensus rates.
5

19/4/2016 PepsiCo SEC Filings
http://phx.corporateir.net/phoenix.zhtml?c=78265&p=irolSECText&TEXT=aHR0cDovL2FwaS50ZW5rd2l6YXJkLmNvbS9maWxpbmcueG1sP2lwYWd… 11/34

19/4/2016 PepsiCo SEC Filings
http://phx.corporateir.net/phoenix.zhtml?c=78265&p=irolSECText&TEXT=aHR0cDovL2FwaS50ZW5rd2l6YXJkLmNvbS9maWxpbmcueG1sP2lwYWd… 12/34
Conference Call:At 8 a.m. (Eastern Time) today, the Company will host a conference call with investors and financialanalysts to discuss first quarter 2016 results and the outlook for 2016. Further details will beaccessible on the Company’s website at www.pepsico.com/investors.
Contacts: Investors Media Jamie Caulfield Jay Cooney Senior Vice President, Investor Relations Vice President, Communications 9142533035 9142532777 [email protected] [email protected]
6
19/4/2016 PepsiCo SEC Filings
http://phx.corporateir.net/phoenix.zhtml?c=78265&p=irolSECText&TEXT=aHR0cDovL2FwaS50ZW5rd2l6YXJkLmNvbS9maWxpbmcueG1sP2lwYWd… 13/34
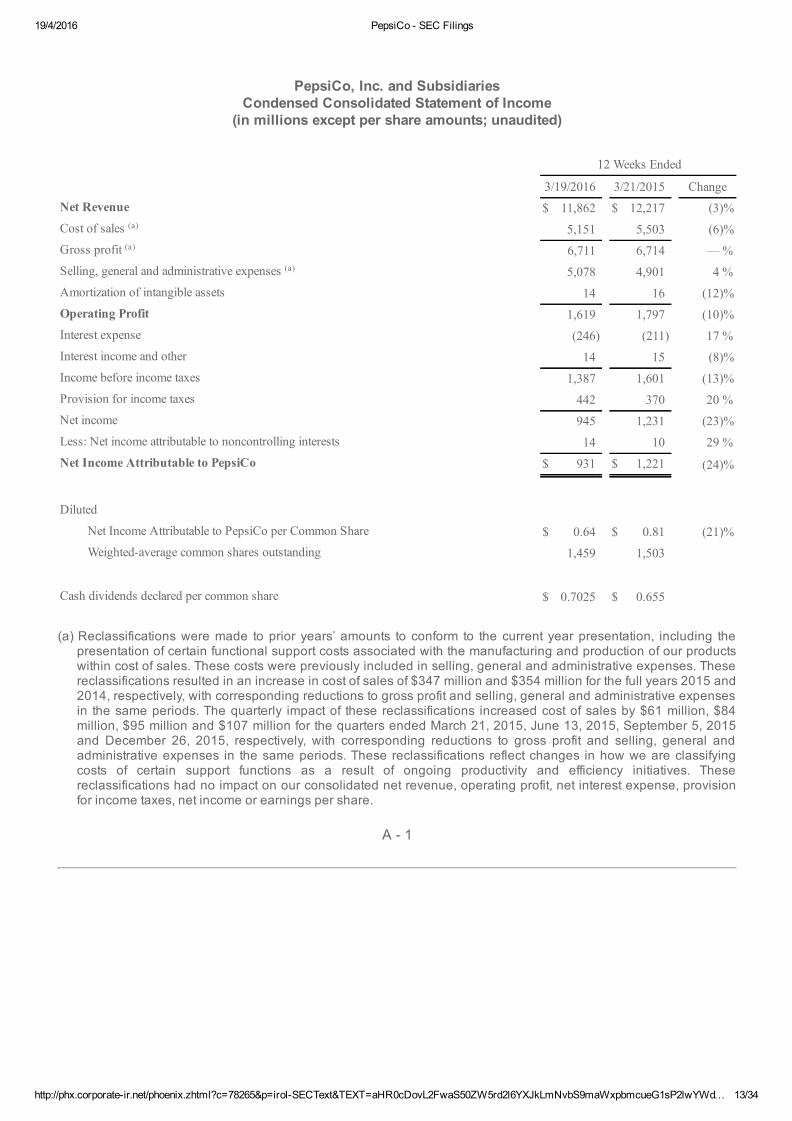
PepsiCo, Inc. and SubsidiariesCondensed Consolidated Statement of Income
(in millions except per share amounts; unaudited)
12 Weeks Ended
3/19/2016 3/21/2015 ChangeNet Revenue $ 11,862 $ 12,217 (3)%Cost of sales (a) 5,151 5,503 (6)%Gross profit (a) 6,711 6,714 — %Selling, general and administrative expenses (a) 5,078 4,901 4 %Amortization of intangible assets 14 16 (12)%Operating Profit 1,619 1,797 (10)%Interest expense (246) (211) 17 %Interest income and other 14 15 (8)%Income before income taxes 1,387 1,601 (13)%Provision for income taxes 442 370 20 %Net income 945 1,231 (23)%Less: Net income attributable to noncontrolling interests 14 10 29 %Net Income Attributable to PepsiCo $ 931 $ 1,221 (24)%
Diluted
Net Income Attributable to PepsiCo per Common Share $ 0.64 $ 0.81 (21)%Weightedaverage common shares outstanding 1,459 1,503
Cash dividends declared per common share $ 0.7025 $ 0.655
(a) Reclassifications were made to prior years’ amounts to conform to the current year presentation, including thepresentation of certain functional support costs associated with the manufacturing and production of our productswithin cost of sales. These costs were previously included in selling, general and administrative expenses. Thesereclassifications resulted in an increase in cost of sales of $347 million and $354 million for the full years 2015 and2014, respectively, with corresponding reductions to gross profit and selling, general and administrative expensesin the same periods. The quarterly impact of these reclassifications increased cost of sales by $61 million, $84million, $95 million and $107 million for the quarters ended March 21, 2015, June 13, 2015, September 5, 2015and December 26, 2015, respectively, with corresponding reductions to gross profit and selling, general andadministrative expenses in the same periods. These reclassifications reflect changes in how we are classifyingcosts of certain support functions as a result of ongoing productivity and efficiency initiatives. Thesereclassifications had no impact on our consolidated net revenue, operating profit, net interest expense, provisionfor income taxes, net income or earnings per share.
A 1

19/4/2016 PepsiCo SEC Filings
http://phx.corporateir.net/phoenix.zhtml?c=78265&p=irolSECText&TEXT=aHR0cDovL2FwaS50ZW5rd2l6YXJkLmNvbS9maWxpbmcueG1sP2lwYWd… 14/34
PepsiCo, Inc. and SubsidiariesSupplemental Financial Information
(in millions and unaudited)
12 Weeks Ended
3/19/2016 3/21/2015 ChangeNet Revenue FritoLay North America $ 3,418 $ 3,319 3 %Quaker Foods North America 617 639 (3)%North America Beverages 4,361 4,298 1.5 %Latin America 1,042 1,414 (26)%Europe SubSaharan Africa 1,359 1,496 (9)%Asia, Middle East and North Africa 1,065 1,051 1 %Total Net Revenue $ 11,862 $ 12,217 (3)%
Operating Profit/(Loss) FritoLay North America $ 1,018 $ 920 11 %Quaker Foods North America 166 99 68 %North America Beverages 485 453 7 %Latin America 175 219 (20)%Europe SubSaharan Africa 67 112 (40)%Asia, Middle East and North Africa (148) 230 (164)%Division Operating Profit 1,763 2,033 (13)%Corporate Unallocated
Commodity MarktoMarket Net Impact 46 (1) Restructuring and Impairment Charges (3) (6) Other (187) (229)
(144) (236) (39)%Total Operating Profit $ 1,619 $ 1,797 (10)%
A 2
19/4/2016 PepsiCo SEC Filings
http://phx.corporateir.net/phoenix.zhtml?c=78265&p=irolSECText&TEXT=aHR0cDovL2FwaS50ZW5rd2l6YXJkLmNvbS9maWxpbmcueG1sP2lwYWd… 15/34
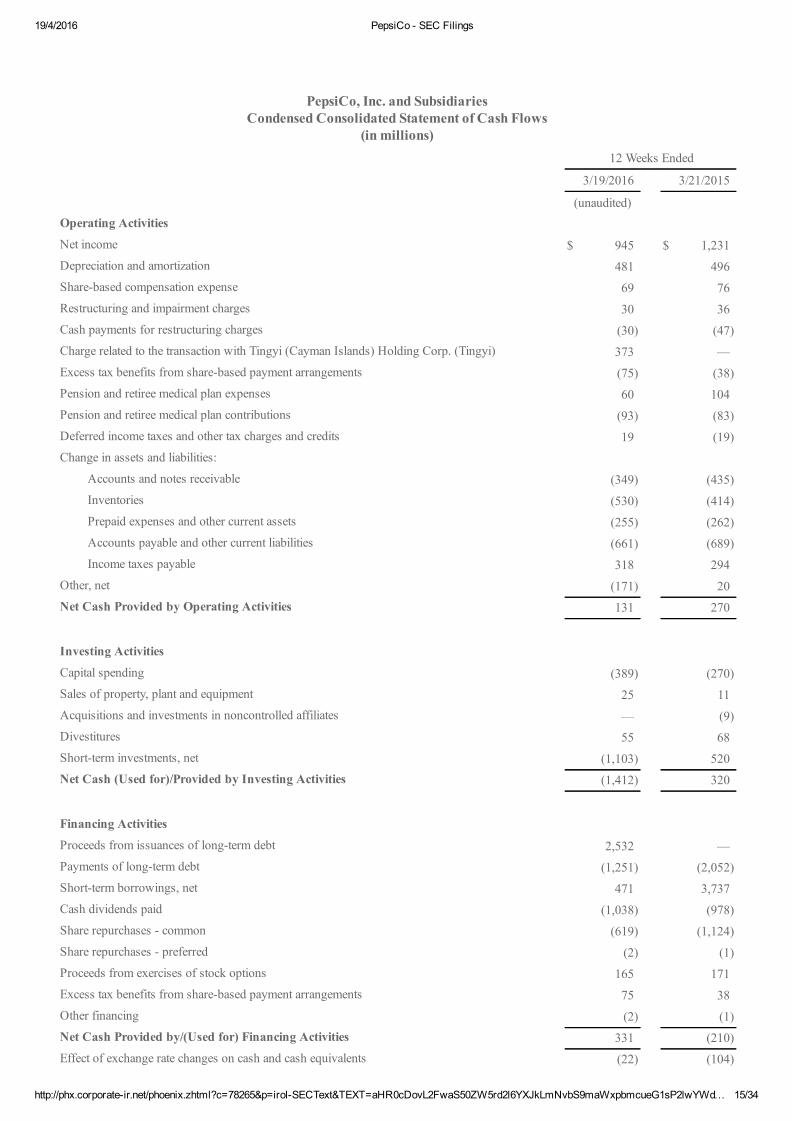
PepsiCo, Inc. and SubsidiariesCondensed Consolidated Statement of Cash Flows
(in millions) 12 Weeks Ended
3/19/2016 3/21/2015
(unaudited) Operating Activities Net income $ 945 $ 1,231Depreciation and amortization 481 496Sharebased compensation expense 69 76Restructuring and impairment charges 30 36Cash payments for restructuring charges (30) (47)Charge related to the transaction with Tingyi (Cayman Islands) Holding Corp. (Tingyi) 373 —Excess tax benefits from sharebased payment arrangements (75) (38)Pension and retiree medical plan expenses 60 104Pension and retiree medical plan contributions (93) (83)Deferred income taxes and other tax charges and credits 19 (19)Change in assets and liabilities:
Accounts and notes receivable (349) (435)Inventories (530) (414)Prepaid expenses and other current assets (255) (262)Accounts payable and other current liabilities (661) (689)Income taxes payable 318 294
Other, net (171) 20Net Cash Provided by Operating Activities 131 270
Investing Activities Capital spending (389) (270)Sales of property, plant and equipment 25 11Acquisitions and investments in noncontrolled affiliates — (9)Divestitures 55 68Shortterm investments, net (1,103) 520Net Cash (Used for)/Provided by Investing Activities (1,412) 320
Financing Activities Proceeds from issuances of longterm debt 2,532 —Payments of longterm debt (1,251) (2,052)Shortterm borrowings, net 471 3,737Cash dividends paid (1,038) (978)Share repurchases common (619) (1,124)Share repurchases preferred (2) (1)Proceeds from exercises of stock options 165 171Excess tax benefits from sharebased payment arrangements 75 38Other financing (2) (1)Net Cash Provided by/(Used for) Financing Activities 331 (210)Effect of exchange rate changes on cash and cash equivalents (22) (104)
19/4/2016 PepsiCo SEC Filings
http://phx.corporateir.net/phoenix.zhtml?c=78265&p=irolSECText&TEXT=aHR0cDovL2FwaS50ZW5rd2l6YXJkLmNvbS9maWxpbmcueG1sP2lwYWd… 16/34
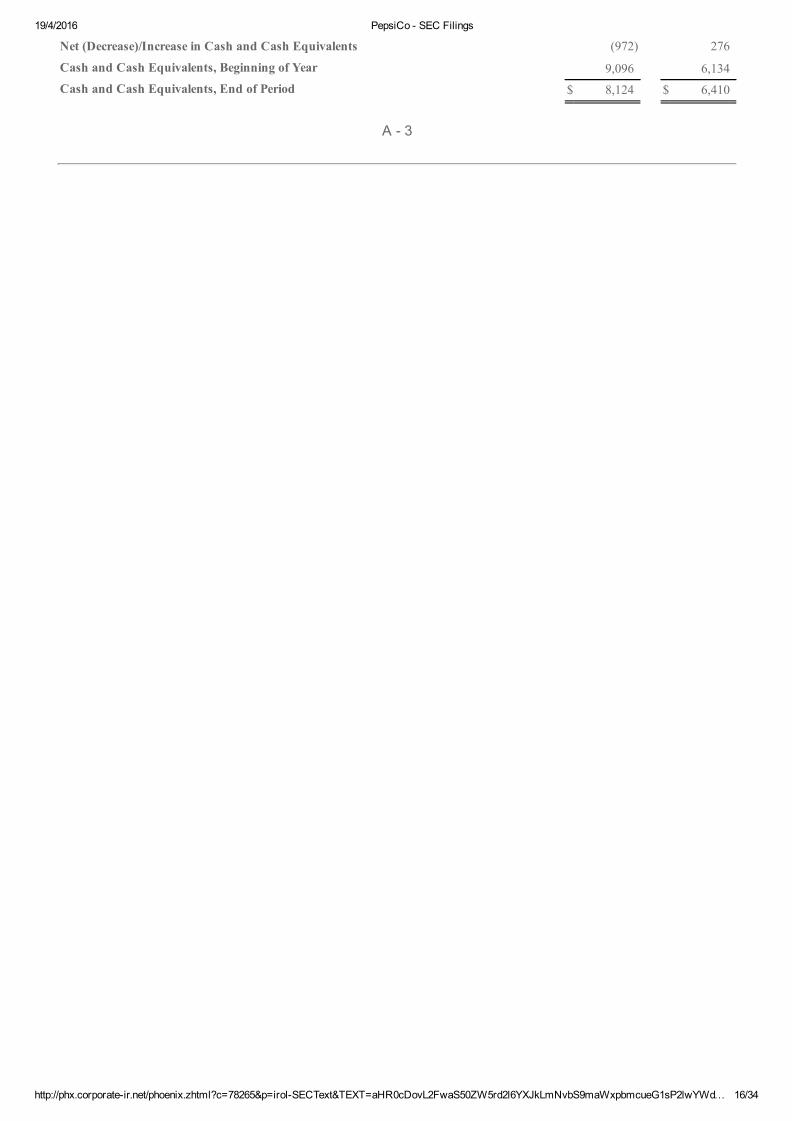
Net (Decrease)/Increase in Cash and Cash Equivalents (972) 276
Cash and Cash Equivalents, Beginning of Year 9,096 6,134Cash and Cash Equivalents, End of Period $ 8,124 $ 6,410
A 3

19/4/2016 PepsiCo SEC Filings
http://phx.corporateir.net/phoenix.zhtml?c=78265&p=irolSECText&TEXT=aHR0cDovL2FwaS50ZW5rd2l6YXJkLmNvbS9maWxpbmcueG1sP2lwYWd… 17/34
PepsiCo, Inc. and SubsidiariesCondensed Consolidated Balance Sheet(in millions except per share amounts)
3/19/2016 12/26/2015
(unaudited) Assets Current Assets Cash and cash equivalents $ 8,124 $ 9,096Shortterm investments 4,020 2,913Accounts and notes receivable, net 6,707 6,437Inventories:
Raw materials 1,418 1,312Workinprocess 277 161Finished goods 1,524 1,247
3,219 2,720Prepaid expenses and other current assets 1,896 1,865
Total Current Assets 23,966 23,031Property, plant and equipment, net 16,105 16,317Amortizable intangible assets, net 1,266 1,270Goodwill 14,132 14,177Other nonamortizable intangible assets 11,783 11,811
Nonamortizable Intangible Assets 25,915 25,988Investments in noncontrolled affiliates 1,935 2,311Other assets 832 750
Total Assets $ 70,019 $ 69,667
Liabilities and Equity Current Liabilities Shortterm obligations $ 4,018 $ 4,071Accounts payable and other current liabilities 12,824 13,507
Total Current Liabilities 16,842 17,578Longterm debt obligations 31,068 29,213Other liabilities 5,811 5,887Deferred income taxes 5,067 4,959
Total Liabilities 58,788 57,637
Commitments and Contingencies Preferred stock, no par value 41 41Repurchased preferred stock (187) (186)PepsiCo Common Shareholders’ Equity Common stock, par value 12/3¢ per share (authorized 3,600 shares, issued, net of repurchasedcommon stock at par value: 1,446 and 1,448 shares, respectively) 24 24
Capital in excess of par value 3,906 4,076Retained earnings 50,383 50,472Accumulated other comprehensive loss (13,569) (13,319)
19/4/2016 PepsiCo SEC Filings
http://phx.corporateir.net/phoenix.zhtml?c=78265&p=irolSECText&TEXT=aHR0cDovL2FwaS50ZW5rd2l6YXJkLmNvbS9maWxpbmcueG1sP2lwYWd… 18/34
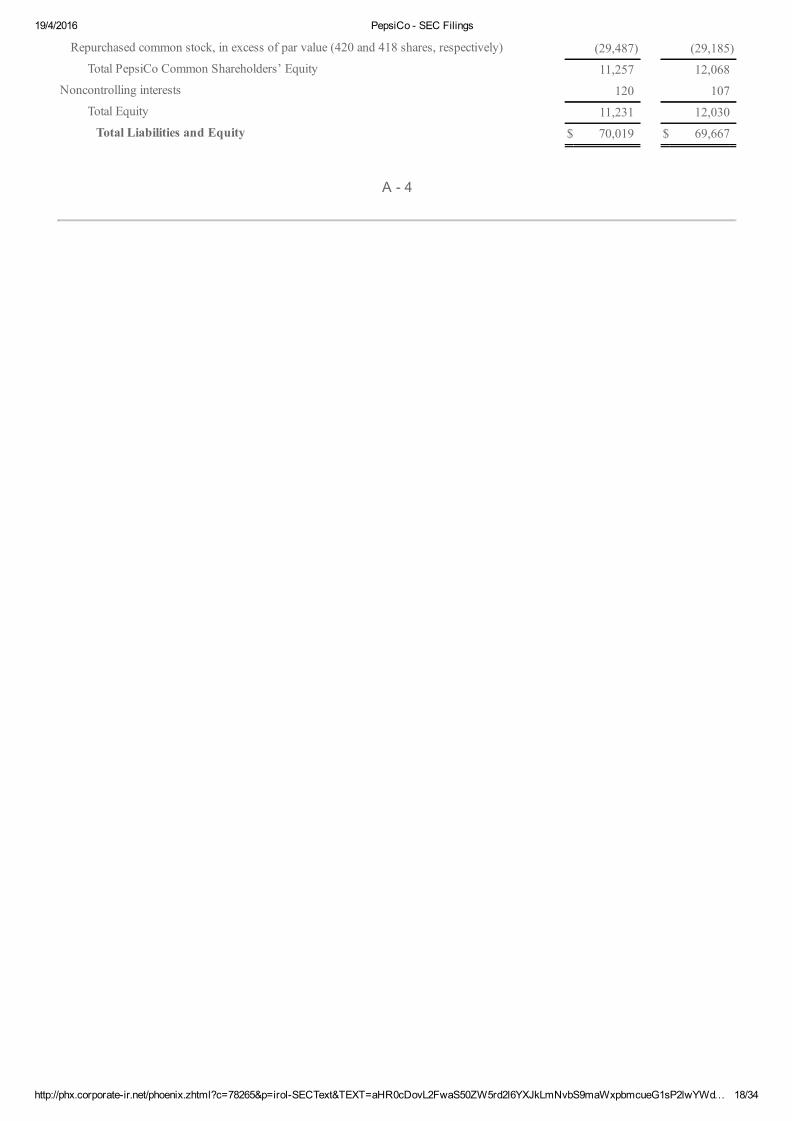
Repurchased common stock, in excess of par value (420 and 418 shares, respectively) (29,487) (29,185)Total PepsiCo Common Shareholders’ Equity 11,257 12,068
Noncontrolling interests 120 107Total Equity 11,231 12,030Total Liabilities and Equity $ 70,019 $ 69,667
A 4
19/4/2016 PepsiCo SEC Filings
http://phx.corporateir.net/phoenix.zhtml?c=78265&p=irolSECText&TEXT=aHR0cDovL2FwaS50ZW5rd2l6YXJkLmNvbS9maWxpbmcueG1sP2lwYWd… 19/34
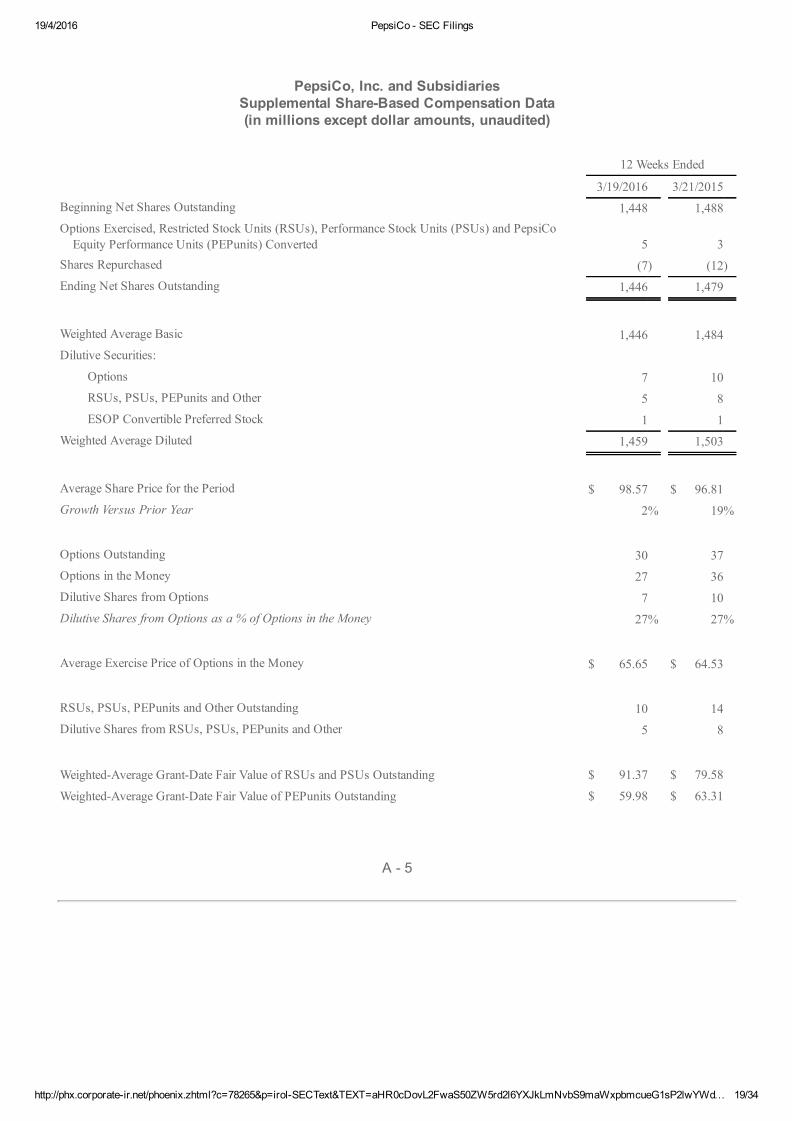
PepsiCo, Inc. and SubsidiariesSupplemental ShareBased Compensation Data(in millions except dollar amounts, unaudited)
12 Weeks Ended
3/19/2016 3/21/2015Beginning Net Shares Outstanding 1,448 1,488Options Exercised, Restricted Stock Units (RSUs), Performance Stock Units (PSUs) and PepsiCoEquity Performance Units (PEPunits) Converted 5 3
Shares Repurchased (7) (12)Ending Net Shares Outstanding 1,446 1,479
Weighted Average Basic 1,446 1,484Dilutive Securities:
Options 7 10RSUs, PSUs, PEPunits and Other 5 8ESOP Convertible Preferred Stock 1 1
Weighted Average Diluted 1,459 1,503
Average Share Price for the Period $ 98.57 $ 96.81Growth Versus Prior Year 2% 19%
Options Outstanding 30 37Options in the Money 27 36Dilutive Shares from Options 7 10Dilutive Shares from Options as a % of Options in the Money 27% 27%
Average Exercise Price of Options in the Money $ 65.65 $ 64.53
RSUs, PSUs, PEPunits and Other Outstanding 10 14Dilutive Shares from RSUs, PSUs, PEPunits and Other 5 8
WeightedAverage GrantDate Fair Value of RSUs and PSUs Outstanding $ 91.37 $ 79.58
WeightedAverage GrantDate Fair Value of PEPunits Outstanding $ 59.98 $ 63.31
A 5
19/4/2016 PepsiCo SEC Filings
http://phx.corporateir.net/phoenix.zhtml?c=78265&p=irolSECText&TEXT=aHR0cDovL2FwaS50ZW5rd2l6YXJkLmNvbS9maWxpbmcueG1sP2lwYWd… 20/34
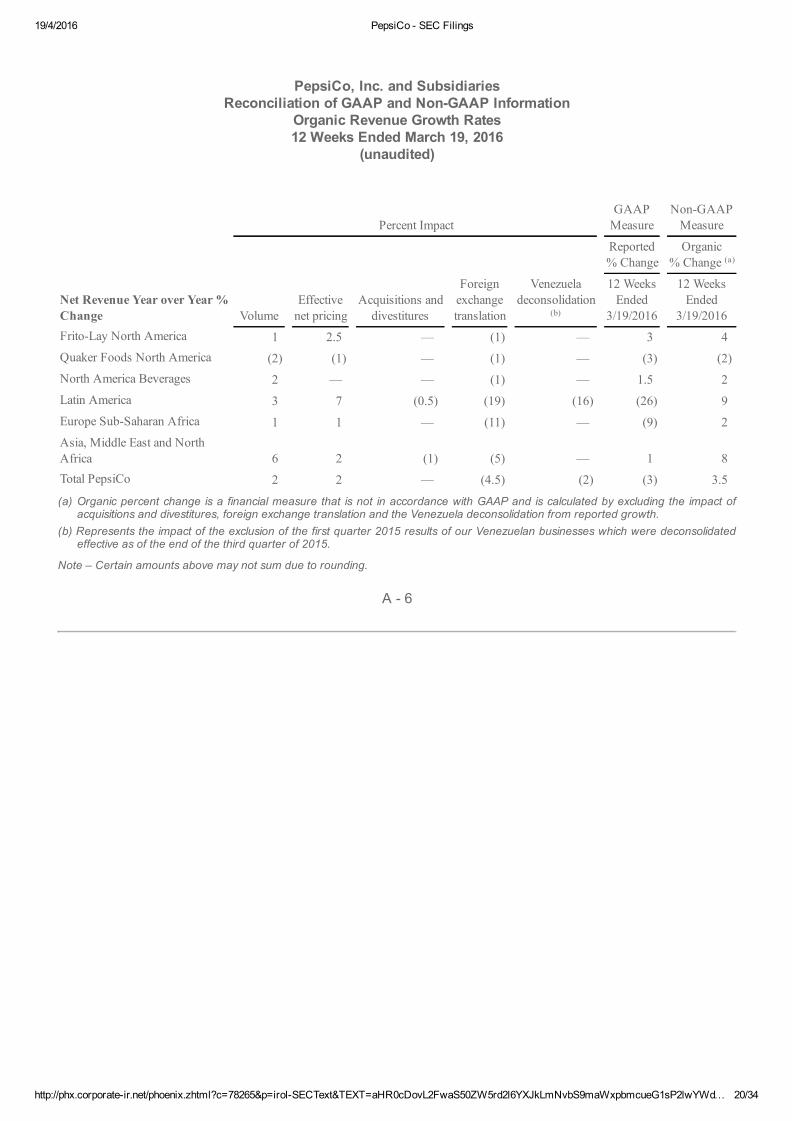
PepsiCo, Inc. and SubsidiariesReconciliation of GAAP and NonGAAP Information
Organic Revenue Growth Rates12 Weeks Ended March 19, 2016
(unaudited)
Percent Impact GAAPMeasure
NonGAAPMeasure
Reported% Change
Organic% Change (a)
Net Revenue Year over Year %Change Volume
Effectivenet pricing
Acquisitions anddivestitures
Foreignexchangetranslation
Venezueladeconsolidation
(b)
12 WeeksEnded
3/19/2016
12 WeeksEnded
3/19/2016FritoLay North America 1 2.5 — (1) — 3 4Quaker Foods North America (2) (1) — (1) — (3) (2)North America Beverages 2 — — (1) — 1.5 2Latin America 3 7 (0.5) (19) (16) (26) 9Europe SubSaharan Africa 1 1 — (11) — (9) 2Asia, Middle East and NorthAfrica 6 2 (1) (5) — 1 8Total PepsiCo 2 2 — (4.5) (2) (3) 3.5
(a) Organic percent change is a financial measure that is not in accordance with GAAP and is calculated by excluding the impact ofacquisitions and divestitures, foreign exchange translation and the Venezuela deconsolidation from reported growth.
(b) Represents the impact of the exclusion of the first quarter 2015 results of our Venezuelan businesses which were deconsolidatedeffective as of the end of the third quarter of 2015.
Note – Certain amounts above may not sum due to rounding.
A 6

19/4/2016 PepsiCo SEC Filings
http://phx.corporateir.net/phoenix.zhtml?c=78265&p=irolSECText&TEXT=aHR0cDovL2FwaS50ZW5rd2l6YXJkLmNvbS9maWxpbmcueG1sP2lwYWd… 21/34
PepsiCo, Inc. and SubsidiariesReconciliation of GAAP and NonGAAP Information (cont.)
Year over Year Growth Rates12 Weeks Ended March 19, 2016
(unaudited)
GAAPMeasure
NonGAAPMeasure
NonGAAPMeasure
Reported % Change Percent Impact of NonCore Adjustments
Core (a)% Change
PercentImpact of
CoreConstant Currency
(a)
% Change
Operating Profit Year over Year % Change
12 WeeksEnded
3/19/2016
Commoditymarktomarket netimpact
Restructuringand
impairmentcharges (b)
Chargerelated to
thetransaction
withTingyi
12 WeeksEnded
3/19/2016 Foreignexchangetranslation
12 WeeksEnded
3/19/2016FritoLay North America 11 — (1) — 10 1 10Quaker Foods North America 68 — (2) — 66 1 67North America Beverages 7 — — — 7 — 7Latin America (20) — (1) — (21) 22 1Europe SubSaharan Africa (40) — 10 — (30) 4 (25)Asia, Middle East and North Africa (164) — 1 162 (1) 2.5 1Division Operating Profit (13) — — 18 5 3 8Impact of Corporate Unallocated 3 (3) — 3 3 — 3Total Operating Profit (10) (3) — 21 8 4 12
Net Income Attributable to PepsiCo (24) 4 4 8
Net Income Attributable to PepsiCo per common share diluted (21) 7 4 11
(a) Core results and core constant currency results are financial measures that are not in accordance with GAAP and exclude theabove noncore adjustments. See A13 through A16 for a discussion of each of these adjustments.
(b) Restructuring and impairment charges for the 12 weeks ended March 19, 2016 include costs associated with the 2014 MultiYearProductivity Plan. Restructuring and impairment charges for the 12 weeks ended March 21, 2015 include costs associated with the2014 and 2012 MultiYear Productivity Plans. See A14 through A15 for a discussion of these plans.
Note – Certain amounts above may not sum due to rounding.
A 7
19/4/2016 PepsiCo SEC Filings
http://phx.corporateir.net/phoenix.zhtml?c=78265&p=irolSECText&TEXT=aHR0cDovL2FwaS50ZW5rd2l6YXJkLmNvbS9maWxpbmcueG1sP2lwYWd… 22/34
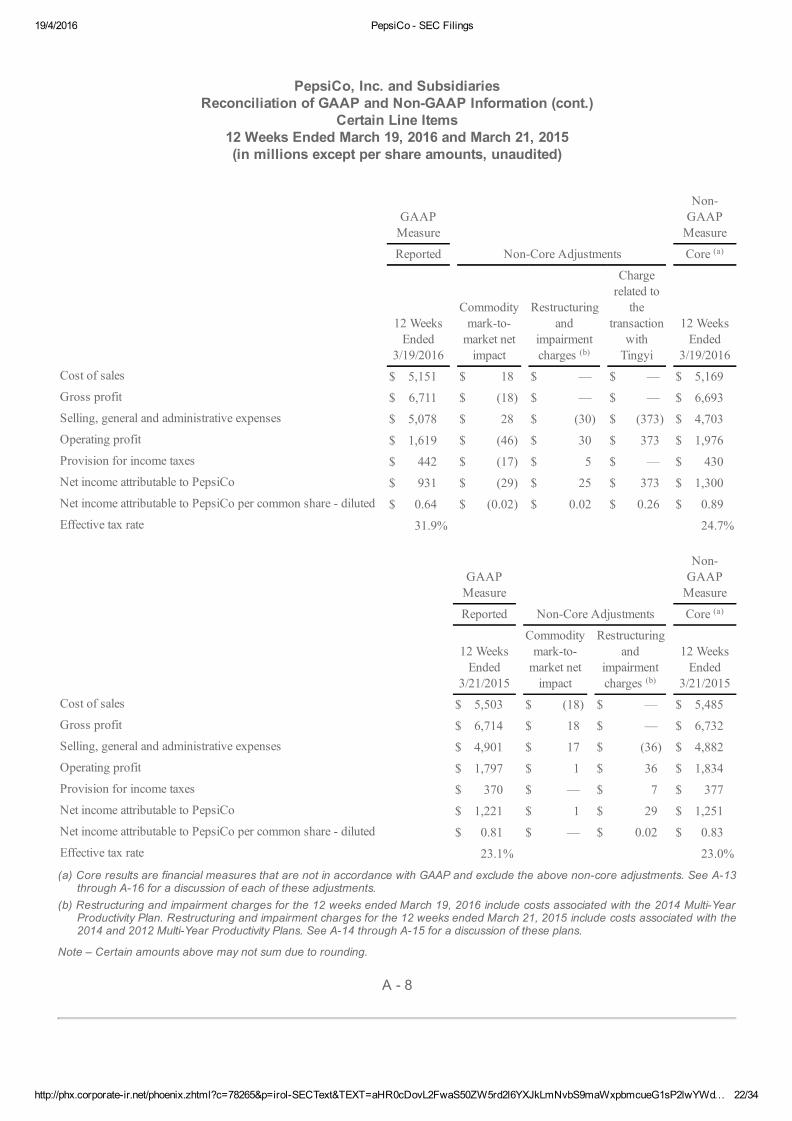
PepsiCo, Inc. and SubsidiariesReconciliation of GAAP and NonGAAP Information (cont.)
Certain Line Items12 Weeks Ended March 19, 2016 and March 21, 2015(in millions except per share amounts, unaudited)
GAAP Measure
NonGAAPMeasure
Reported NonCore Adjustments Core (a)
12 WeeksEnded
3/19/2016
Commoditymarkto market net impact
Restructuringand
impairmentcharges (b)
Chargerelated to
thetransaction
withTingyi
12 WeeksEnded
3/19/2016 Cost of sales $ 5,151 $ 18 $ — $ — $ 5,169Gross profit $ 6,711 $ (18) $ — $ — $ 6,693Selling, general and administrative expenses $ 5,078 $ 28 $ (30) $ (373) $ 4,703Operating profit $ 1,619 $ (46) $ 30 $ 373 $ 1,976Provision for income taxes $ 442 $ (17) $ 5 $ — $ 430Net income attributable to PepsiCo $ 931 $ (29) $ 25 $ 373 $ 1,300Net income attributable to PepsiCo per common share diluted $ 0.64 $ (0.02) $ 0.02 $ 0.26 $ 0.89Effective tax rate 31.9% 24.7%
GAAPMeasure
NonGAAPMeasure
Reported NonCore Adjustments Core (a)
12 WeeksEnded
3/21/2015
Commoditymarkto market net impact
Restructuringand
impairmentcharges (b)
12 WeeksEnded
3/21/2015 Cost of sales $ 5,503 $ (18) $ — $ 5,485Gross profit $ 6,714 $ 18 $ — $ 6,732Selling, general and administrative expenses $ 4,901 $ 17 $ (36) $ 4,882Operating profit $ 1,797 $ 1 $ 36 $ 1,834Provision for income taxes $ 370 $ — $ 7 $ 377Net income attributable to PepsiCo $ 1,221 $ 1 $ 29 $ 1,251Net income attributable to PepsiCo per common share diluted $ 0.81 $ — $ 0.02 $ 0.83Effective tax rate 23.1% 23.0%
(a) Core results are financial measures that are not in accordance with GAAP and exclude the above noncore adjustments. See A13through A16 for a discussion of each of these adjustments.
(b) Restructuring and impairment charges for the 12 weeks ended March 19, 2016 include costs associated with the 2014 MultiYearProductivity Plan. Restructuring and impairment charges for the 12 weeks ended March 21, 2015 include costs associated with the2014 and 2012 MultiYear Productivity Plans. See A14 through A15 for a discussion of these plans.
Note – Certain amounts above may not sum due to rounding.
A 8
19/4/2016 PepsiCo SEC Filings
http://phx.corporateir.net/phoenix.zhtml?c=78265&p=irolSECText&TEXT=aHR0cDovL2FwaS50ZW5rd2l6YXJkLmNvbS9maWxpbmcueG1sP2lwYWd… 23/34
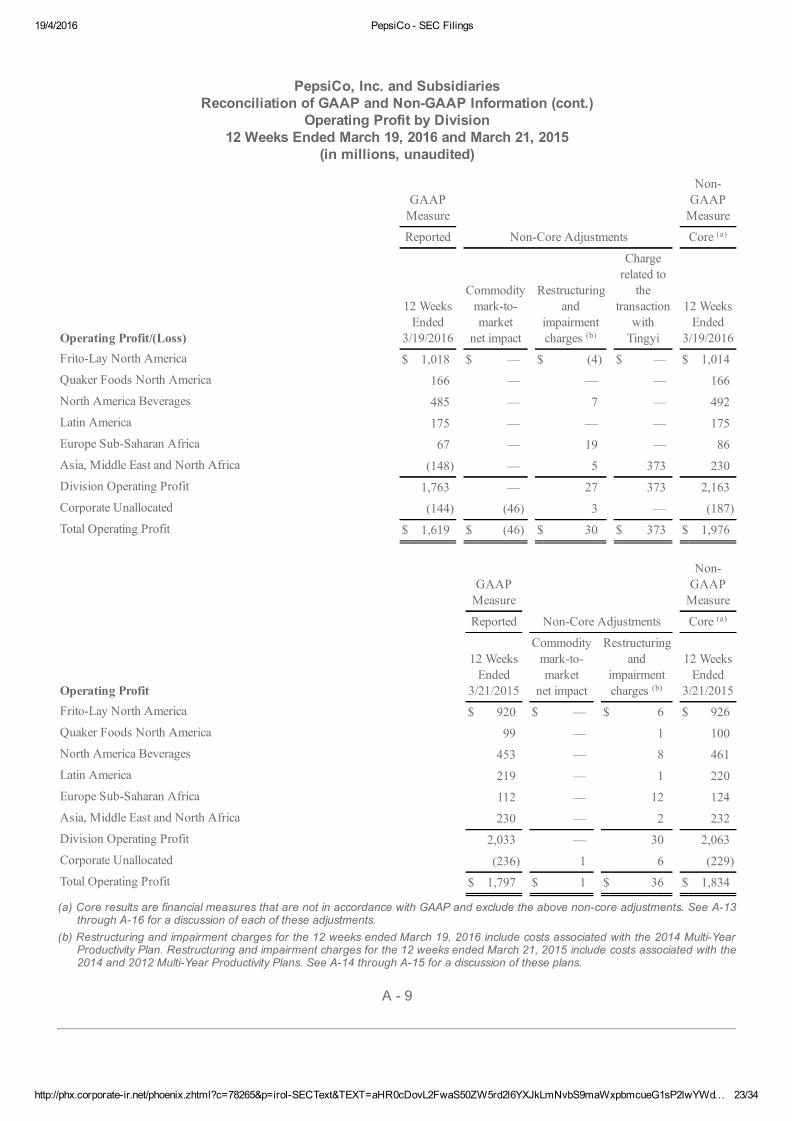
PepsiCo, Inc. and SubsidiariesReconciliation of GAAP and NonGAAP Information (cont.)
Operating Profit by Division12 Weeks Ended March 19, 2016 and March 21, 2015
(in millions, unaudited)
GAAPMeasure
NonCore Adjustments
NonGAAPMeasure
Reported Core (a)
Operating Profit/(Loss)
12 WeeksEnded
3/19/2016
Commoditymarktomarket
net impact
Restructuringand
impairmentcharges (b)
Chargerelated to
thetransaction
withTingyi
12 WeeksEnded
3/19/2016FritoLay North America $ 1,018 $ — $ (4) $ — $ 1,014Quaker Foods North America 166 — — — 166North America Beverages 485 — 7 — 492Latin America 175 — — — 175Europe SubSaharan Africa 67 — 19 — 86Asia, Middle East and North Africa (148) — 5 373 230Division Operating Profit 1,763 — 27 373 2,163Corporate Unallocated (144) (46) 3 — (187)Total Operating Profit $ 1,619 $ (46) $ 30 $ 373 $ 1,976
GAAPMeasure
NonCore Adjustments
NonGAAPMeasure
Reported Core (a)
Operating Profit
12 WeeksEnded
3/21/2015
Commoditymarktomarket
net impact
Restructuringand
impairmentcharges (b)
12 WeeksEnded
3/21/2015FritoLay North America $ 920 $ — $ 6 $ 926Quaker Foods North America 99 — 1 100North America Beverages 453 — 8 461Latin America 219 — 1 220Europe SubSaharan Africa 112 — 12 124Asia, Middle East and North Africa 230 — 2 232Division Operating Profit 2,033 — 30 2,063Corporate Unallocated (236) 1 6 (229)Total Operating Profit $ 1,797 $ 1 $ 36 $ 1,834
(a) Core results are financial measures that are not in accordance with GAAP and exclude the above noncore adjustments. See A13through A16 for a discussion of each of these adjustments.
(b) Restructuring and impairment charges for the 12 weeks ended March 19, 2016 include costs associated with the 2014 MultiYearProductivity Plan. Restructuring and impairment charges for the 12 weeks ended March 21, 2015 include costs associated with the2014 and 2012 MultiYear Productivity Plans. See A14 through A15 for a discussion of these plans.
A 9
19/4/2016 PepsiCo SEC Filings
http://phx.corporateir.net/phoenix.zhtml?c=78265&p=irolSECText&TEXT=aHR0cDovL2FwaS50ZW5rd2l6YXJkLmNvbS9maWxpbmcueG1sP2lwYWd… 24/34
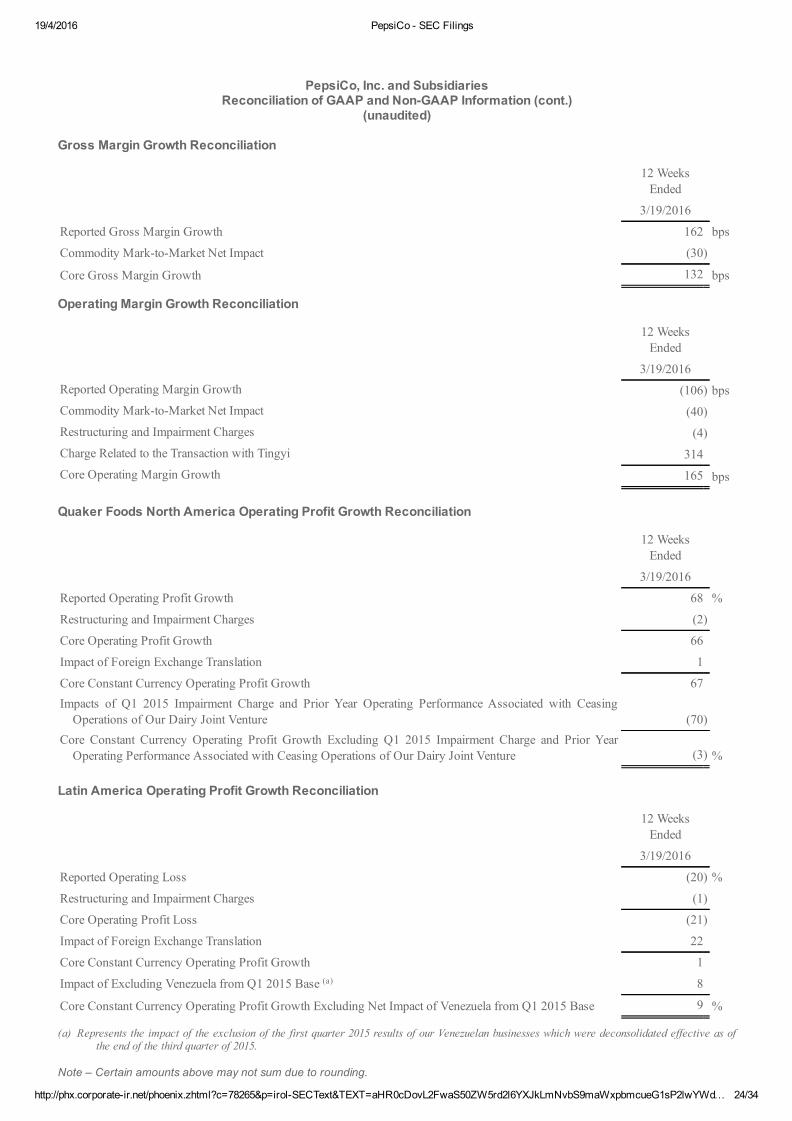
PepsiCo, Inc. and SubsidiariesReconciliation of GAAP and NonGAAP Information (cont.)
(unaudited)
Gross Margin Growth Reconciliation
12 WeeksEnded
3/19/2016 Reported Gross Margin Growth 162 bps
Commodity MarktoMarket Net Impact (30) Core Gross Margin Growth 132 bps
Operating Margin Growth Reconciliation
12 WeeksEnded
3/19/2016 Reported Operating Margin Growth (106) bpsCommodity MarktoMarket Net Impact (40) Restructuring and Impairment Charges (4) Charge Related to the Transaction with Tingyi 314 Core Operating Margin Growth 165 bps
Quaker Foods North America Operating Profit Growth Reconciliation
12 WeeksEnded
3/19/2016 Reported Operating Profit Growth 68 %
Restructuring and Impairment Charges (2) Core Operating Profit Growth 66 Impact of Foreign Exchange Translation 1 Core Constant Currency Operating Profit Growth 67 Impacts of Q1 2015 Impairment Charge and Prior Year Operating Performance Associated with CeasingOperations of Our Dairy Joint Venture (70)
Core Constant Currency Operating Profit Growth Excluding Q1 2015 Impairment Charge and Prior YearOperating Performance Associated with Ceasing Operations of Our Dairy Joint Venture (3) %
Latin America Operating Profit Growth Reconciliation
12 WeeksEnded
3/19/2016 Reported Operating Loss (20) %
Restructuring and Impairment Charges (1) Core Operating Profit Loss (21) Impact of Foreign Exchange Translation 22 Core Constant Currency Operating Profit Growth 1 Impact of Excluding Venezuela from Q1 2015 Base (a) 8 Core Constant Currency Operating Profit Growth Excluding Net Impact of Venezuela from Q1 2015 Base 9 %
(a) Represents the impact of the exclusion of the first quarter 2015 results of our Venezuelan businesses which were deconsolidated effective as ofthe end of the third quarter of 2015.
Note – Certain amounts above may not sum due to rounding.

19/4/2016 PepsiCo SEC Filings
http://phx.corporateir.net/phoenix.zhtml?c=78265&p=irolSECText&TEXT=aHR0cDovL2FwaS50ZW5rd2l6YXJkLmNvbS9maWxpbmcueG1sP2lwYWd… 25/34
A 10
19/4/2016 PepsiCo SEC Filings
http://phx.corporateir.net/phoenix.zhtml?c=78265&p=irolSECText&TEXT=aHR0cDovL2FwaS50ZW5rd2l6YXJkLmNvbS9maWxpbmcueG1sP2lwYWd… 26/34
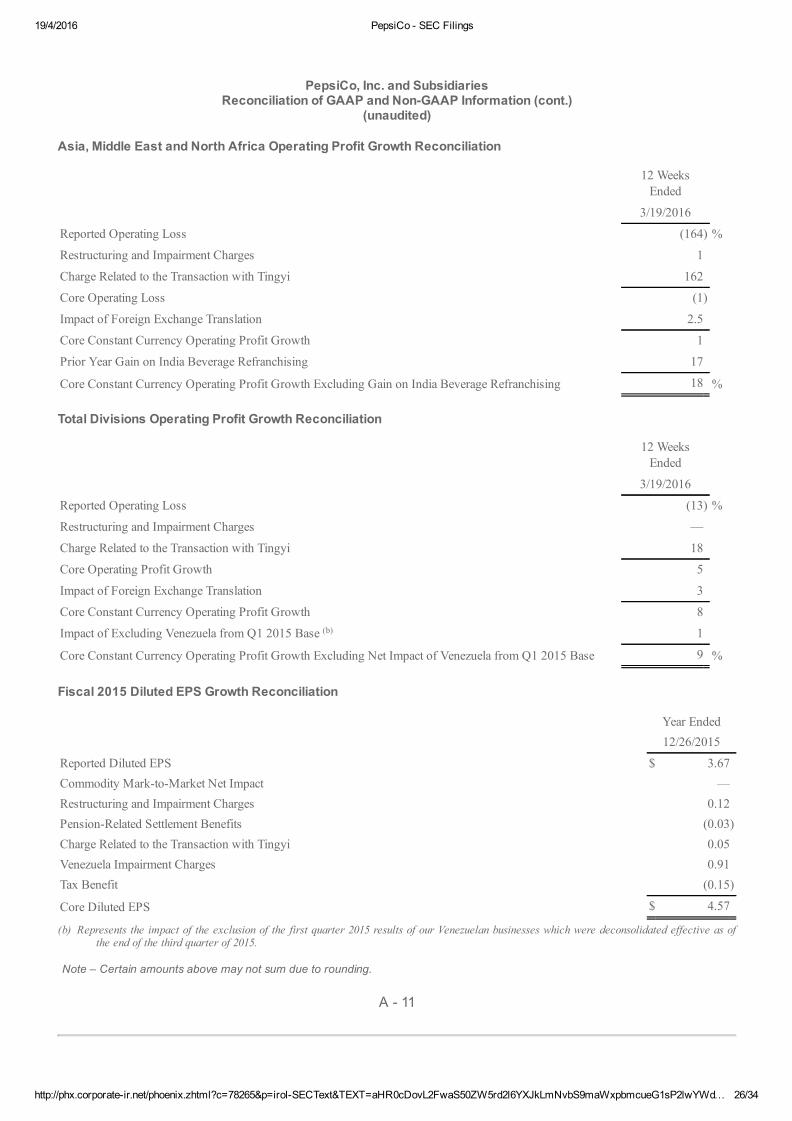
PepsiCo, Inc. and SubsidiariesReconciliation of GAAP and NonGAAP Information (cont.)
(unaudited)
Asia, Middle East and North Africa Operating Profit Growth Reconciliation
12 WeeksEnded
3/19/2016 Reported Operating Loss (164) %
Restructuring and Impairment Charges 1 Charge Related to the Transaction with Tingyi 162 Core Operating Loss (1) Impact of Foreign Exchange Translation 2.5 Core Constant Currency Operating Profit Growth 1 Prior Year Gain on India Beverage Refranchising 17 Core Constant Currency Operating Profit Growth Excluding Gain on India Beverage Refranchising 18 %
Total Divisions Operating Profit Growth Reconciliation
12 WeeksEnded
3/19/2016 Reported Operating Loss (13) %
Restructuring and Impairment Charges — Charge Related to the Transaction with Tingyi 18 Core Operating Profit Growth 5 Impact of Foreign Exchange Translation 3 Core Constant Currency Operating Profit Growth 8 Impact of Excluding Venezuela from Q1 2015 Base (b) 1 Core Constant Currency Operating Profit Growth Excluding Net Impact of Venezuela from Q1 2015 Base 9 %
Fiscal 2015 Diluted EPS Growth Reconciliation
Year Ended 12/26/2015
Reported Diluted EPS $ 3.67Commodity MarktoMarket Net Impact —Restructuring and Impairment Charges 0.12PensionRelated Settlement Benefits (0.03)Charge Related to the Transaction with Tingyi 0.05Venezuela Impairment Charges 0.91Tax Benefit (0.15)
Core Diluted EPS $ 4.57
(b) Represents the impact of the exclusion of the first quarter 2015 results of our Venezuelan businesses which were deconsolidated effective as ofthe end of the third quarter of 2015.
Note – Certain amounts above may not sum due to rounding.
A 11
19/4/2016 PepsiCo SEC Filings
http://phx.corporateir.net/phoenix.zhtml?c=78265&p=irolSECText&TEXT=aHR0cDovL2FwaS50ZW5rd2l6YXJkLmNvbS9maWxpbmcueG1sP2lwYWd… 27/34
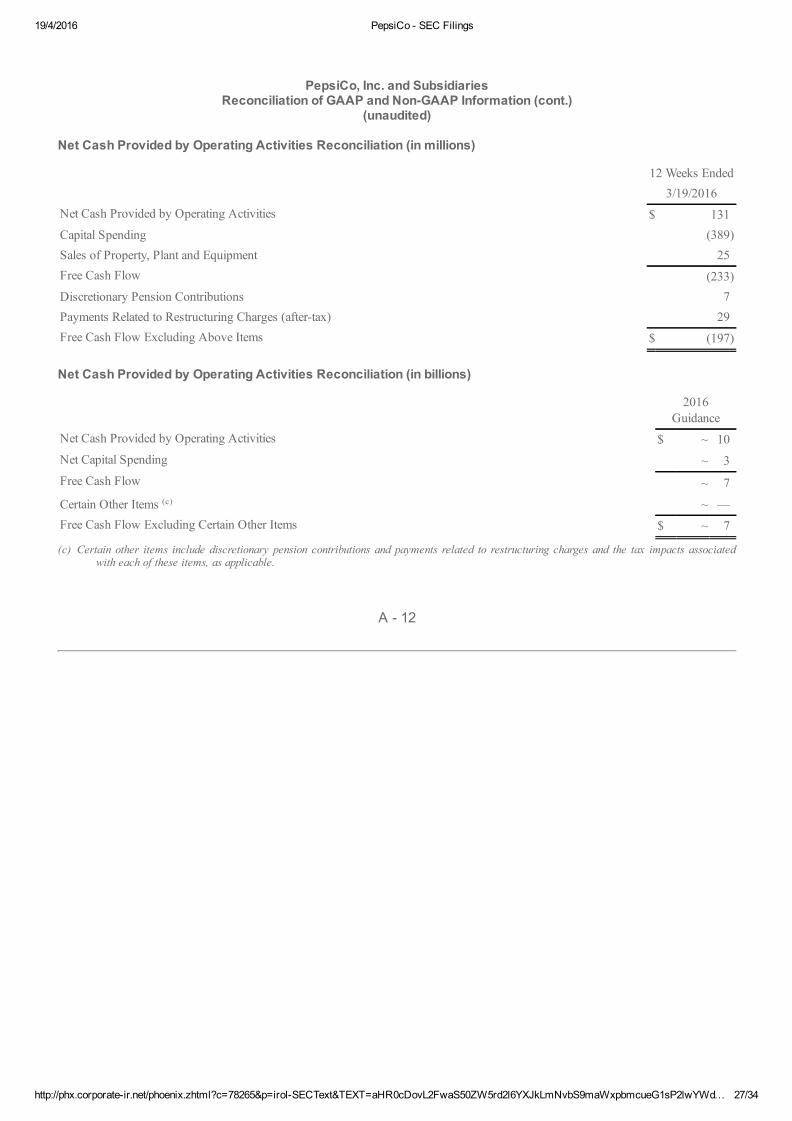
PepsiCo, Inc. and SubsidiariesReconciliation of GAAP and NonGAAP Information (cont.)
(unaudited)
Net Cash Provided by Operating Activities Reconciliation (in millions)
12 Weeks Ended 3/19/2016
Net Cash Provided by Operating Activities $ 131Capital Spending (389)Sales of Property, Plant and Equipment 25Free Cash Flow (233)Discretionary Pension Contributions 7Payments Related to Restructuring Charges (aftertax) 29Free Cash Flow Excluding Above Items $ (197)
Net Cash Provided by Operating Activities Reconciliation (in billions)
2016
GuidanceNet Cash Provided by Operating Activities $ ~ 10Net Capital Spending ~ 3Free Cash Flow ~ 7
Certain Other Items (c) ~ —Free Cash Flow Excluding Certain Other Items $ ~ 7
(c) Certain other items include discretionary pension contributions and payments related to restructuring charges and the tax impacts associatedwith each of these items, as applicable.
A 12
19/4/2016 PepsiCo SEC Filings
http://phx.corporateir.net/phoenix.zhtml?c=78265&p=irolSECText&TEXT=aHR0cDovL2FwaS50ZW5rd2l6YXJkLmNvbS9maWxpbmcueG1sP2lwYWd… 28/34
Cautionary StatementStatements in this communication that are “forwardlooking statements,” including our 2016 guidance, arebased on currently available information, operating plans and projections about future events and trends.Terminology such as “aim,” “anticipate,” “believe,” “drive,” “estimate,” “expect,” “expressed confidence,”“forecast,” “future,” “goal,” “guidance,” “intend,” “may,” “objective,” “outlook,” “plan,” “position,” “potential,”“project,” “seek,” “should,” “strategy,” “target,” “will” or similar statements or variations of such terms areintended to identify forwardlooking statements, although not all forwardlooking statements contain suchterms. Forwardlooking statements inherently involve risks and uncertainties that could cause actual resultsto differ materially from those predicted in such forwardlooking statements. Such risks and uncertaintiesinclude, but are not limited to: changes in demand for PepsiCo’s products, as a result of changes inconsumer preferences or otherwise; changes in, or failure to comply with, applicable laws and regulations;imposition of new taxes, disagreements with tax authorities or additional tax liabilities; PepsiCo’s ability tocompete effectively; PepsiCo’s ability to grow its business in developing and emerging markets or unstablepolitical conditions, civil unrest or other developments and risks in the markets where PepsiCo’s products aremade, manufactured, distributed or sold; unfavorable economic conditions in the countries in which PepsiCooperates; increased costs, disruption of supply or shortages of raw materials and other supplies; failure torealize anticipated benefits from PepsiCo’s productivity initiatives or global operating model; businessdisruptions; product contamination or tampering or issues or concerns with respect to product quality, safetyand integrity; damage to PepsiCo’s reputation or brand image; failure to successfully complete or integrateacquisitions and joint ventures into PepsiCo’s existing operations or to complete or manage divestitures orrefranchisings; changes in estimates and underlying assumptions regarding future performance that couldresult in an impairment charge; PepsiCo’s ability to recruit, hire or retain key employees or a highly skilledand diverse workforce; loss of any key customer or changes to the retail landscape; any downgrade orpotential downgrade of PepsiCo’s credit ratings; the ability to protect information systems against, oreffectively respond to, cyber attacks or other cyber incidents or other disruption; PepsiCo’s ability toimplement shared services or utilize information technology systems and networks effectively; fluctuations orother changes in exchange rates; climate change or water scarcity, or legal, regulatory or market measures toaddress climate change or water scarcity; failure to successfully negotiate collective bargaining agreements,or strikes or work stoppages; infringement of intellectual property rights; potential liabilities and costs fromlitigation or legal proceedings; and other factors that may adversely affect the price of PepsiCo’s commonstock and financial performance.
For additional information on these and other factors that could cause PepsiCo’s actual results to materiallydiffer from those set forth herein, please see PepsiCo’s filings with the Securities and ExchangeCommission, including its most recent annual report on Form 10K and subsequent reports on Forms 10Qand 8K. Investors are cautioned not to place undue reliance on any such forwardlooking statements, whichspeak only as of the date they are made. PepsiCo undertakes no obligation to update any forwardlookingstatements, whether as a result of new information, future events or otherwise.
Miscellaneous DisclosuresIn discussing financial results and guidance, the company may refer to certain measures not in accordancewith Generally Accepted Accounting Principles (GAAP). Reconciliations of any such nonGAAP measures tothe most directly comparable financial measures in accordance with GAAP can be found in the attachedexhibits, as well as on the company’s website at www.pepsico.com in the “Investors” section under “Events& Presentations.” Our nonGAAP measures exclude from reported results those items that managementbelieves are not indicative of our ongoing performance and reflect how management evaluates our operatingresults and trends.
GlossaryAcquisitions and divestitures: All merger and acquisition activity, including the impact of acquisitions,divestitures and changes in ownership or control in consolidated subsidiaries and nonconsolidated equityinvestees.
Beverage volume: Volume shipped to retailers and independent distributors from both PepsiCo and ourbottlers. Constant currency: Financial results assuming constant foreign currency exchange rates used for translationbased on the rates in effect for the comparable prioryear period. In order to compute our constant currency

19/4/2016 PepsiCo SEC Filings
http://phx.corporateir.net/phoenix.zhtml?c=78265&p=irolSECText&TEXT=aHR0cDovL2FwaS50ZW5rd2l6YXJkLmNvbS9maWxpbmcueG1sP2lwYWd… 29/34
results, we multiply or divide, as appropriate, our current year U.S. dollar results by the current year averageforeign exchange rates and then multiply or divide, as appropriate, those amounts by the prior year averageforeign exchange rates.
Core: Core results are nonGAAP financial measures which exclude certain items from our historical results.In 2016, core results exclude the commodity marktomarket net impact included in corporate unallocatedexpenses, restructuring and impairment charges and a charge related to the transaction with Tingyi. In 2015,core results exclude the commodity marktomarket net impact included in corporate unallocated expenses,restructuring and impairment charges, pensionrelated settlement benefits, a charge related to the transactionwith Tingyi, Venezuela impairment charges and a noncash tax benefit. See “Reconciliation of GAAP andNonGAAP Information” for additional information.
A 13

19/4/2016 PepsiCo SEC Filings
http://phx.corporateir.net/phoenix.zhtml?c=78265&p=irolSECText&TEXT=aHR0cDovL2FwaS50ZW5rd2l6YXJkLmNvbS9maWxpbmcueG1sP2lwYWd… 30/34
Division operating profit: The aggregation of the operating profit for each of our reportable segments, whichexcludes the impact of corporate unallocated expenses.
Effective net pricing: Reflects the yearoveryear impact of discrete pricing actions, sales incentive activitiesand mix resulting from selling varying products in different package sizes and in different countries.
Free cash flow: Net cash provided by operating activities less capital spending plus sales of property, plantand equipment. See above for a reconciliation of this nonGAAP financial measure to the most directlycomparable financial measure in accordance with GAAP (operating cash flow).
Free cash flow, excluding certain items: Free cash flow, excluding: (1) payments related to restructuringcharges, (2) discretionary pension and retiree medical contributions, and (3) the tax impacts associated witheach of these items, as applicable. This nonGAAP financial measure is our primary measure used to monitorcash flow performance. Also referred to as “core free cash flow.” See above for a reconciliation of this nonGAAP financial measure to the most directly comparable financial measure in accordance with GAAP(operating cash flow). See “Reconciliation of GAAP and NonGAAP Information” for additional information.
Marktomarket gain or loss or net impact: Change in market value for commodity contracts that we purchaseto mitigate the volatility in costs of energy and raw materials that we consume. The market value isdetermined based on average prices on national exchanges and recently reported transactions in themarketplace.
Net capital spending: Capital spending less cash proceeds from sales of property, plant and equipment. Organic: A measure that adjusts for impacts of acquisitions, divestitures and other structural changes,including the Venezuela deconsolidation, and foreign exchange translation. This measure excludes the firstquarter 2015 results of our Venezuelan businesses, which were deconsolidated effective as of the end of thethird quarter of 2015. This measure also excludes the impact of the 53rd reporting week in 2016. In excludingthe impact of foreign exchange translation, we assume constant foreign exchange rates used for translationbased on the rates in effect for the comparable prioryear period. See the definition of “Constant currency” foradditional information.
Raw material costs: Raw materials include the principal ingredients we use in our beverage, food and snackproducts, our key packaging materials and energy costs.
Reconciliation of GAAP and NonGAAP Information (unaudited)Division operating profit, core results, core constant currency results and organic results are nonGAAPfinancial measures as they exclude certain items noted below. These measures are not in accordance withGAAP. However, we believe investors should consider these measures as they are indicative of our ongoingperformance and reflect how management evaluates our operational results and trends. These measures arenot, and should not be viewed as, substitutes for GAAP reporting measures.
Commodity marktomarket net impact
In the 12 weeks ended March 19, 2016, we recognized $46 million of marktomarket net gains on commodityhedges in corporate unallocated expenses. In the 12 weeks ended March 21, 2015, we recognized $1 millionof marktomarket net losses on commodity hedges in corporate unallocated expenses. In the year endedDecember 26, 2015, we recognized $11 million of marktomarket net gains on commodity hedges incorporate unallocated expenses. We centrally manage commodity derivatives on behalf of our divisions.These commodity derivatives include agricultural products, metals and energy. Commodity derivatives thatdo not qualify for hedge accounting treatment are marked to market each period with the resulting gains andlosses recorded in corporate unallocated expenses, as either cost of sales or selling, general andadministrative expenses, depending on the underlying commodity. These gains and losses are subsequentlyreflected in division results when the divisions recognize the cost of the underlying commodity in operatingprofit.
Restructuring and impairment charges
2014 MultiYear Productivity Plan
19/4/2016 PepsiCo SEC Filings
http://phx.corporateir.net/phoenix.zhtml?c=78265&p=irolSECText&TEXT=aHR0cDovL2FwaS50ZW5rd2l6YXJkLmNvbS9maWxpbmcueG1sP2lwYWd… 31/34
In the 12 weeks ended March 19, 2016, we incurred restructuring charges of $30 million in conjunctionwith the multiyear productivity plan we publicly announced in 2014 (2014 Productivity Plan). In the 12weeks ended March 21, 2015, we incurred restructuring charges of $30 million in conjunction with our2014 Productivity Plan. In the year ended December 26, 2015, we incurred restructuring charges of $169million in conjunction with our 2014 Productivity Plan. The 2014 Productivity Plan includes the nextgeneration of productivity initiatives that we believe will strengthen our food, snack and beveragebusinesses by: accelerating our investment in manufacturing automation; further optimizing our globalmanufacturing footprint, including
A 14
19/4/2016 PepsiCo SEC Filings
http://phx.corporateir.net/phoenix.zhtml?c=78265&p=irolSECText&TEXT=aHR0cDovL2FwaS50ZW5rd2l6YXJkLmNvbS9maWxpbmcueG1sP2lwYWd… 32/34
closing certain manufacturing facilities; reengineering our gotomarket systems in developed markets;expanding shared services; and implementing simplified organization structures to drive efficiency. The2014 Productivity Plan is in addition to the productivity plan we began implementing in 2012 and isexpected to continue the benefits of that plan.
2012 MultiYear Productivity PlanIn the 12 weeks ended March 21, 2015, we incurred restructuring charges of $6 million in conjunction withthe multiyear productivity plan we publicly announced in 2012 (2012 Productivity Plan). In the year endedDecember 26, 2015, we incurred restructuring charges of $61 million in conjunction with our 2012Productivity Plan. The 2012 Productivity Plan included actions in every aspect of our business that webelieved would strengthen our complementary food, snack and beverage businesses by: leveraging newtechnologies and processes across PepsiCo’s operations, gotomarket and information systems;heightening the focus on best practice sharing across the globe; consolidating manufacturing, warehouseand sales facilities; and implementing simplified organization structures, with wider spans of control andfewer layers of management. The 2012 Productivity Plan has enhanced PepsiCo’s costcompetitivenessand provided a source of funding for future brandbuilding and innovation initiatives.
Charge related to the transaction with TingyiIn the 12 weeks ended March 19, 2016, we recorded a pre and aftertax impairment charge of $373 million toreduce the value of our 5% indirect equity interest in TingyiAsahi Beverages Holding Co. Ltd. (TAB) to itsestimated fair value.
In the year ended December 26, 2015, we recorded a charge of $73 million related to a writeoff of therecorded value of a call option to increase our holding in TAB to 20%.
Pensionrelated settlements
In the year ended December 26, 2015, we recorded pensionrelated settlement benefits of $67 millionassociated with the settlement of pensionrelated liabilities from previous acquisitions.
Venezuela impairment charges
In the year ended December 26, 2015, we recorded pre and aftertax charges of $1.4 billion related to theimpairment of investments in our whollyowned Venezuelan subsidiaries and beverage joint venture.
Venezuela deconsolidation
Conditions in Venezuela, including restrictive exchange control regulations and lack of access to U.S. dollarsthrough official currency exchange markets, have resulted in an otherthantemporary lack of exchangeabilitybetween the Venezuelan bolivar and the U.S. dollar. The exchange restrictions and other conditions havesignificantly impacted our ability to effectively manage our businesses in Venezuela, including limiting ourability to import certain raw materials and to settle U.S. dollardenominated obligations, and have restrictedour ability to realize the earnings generated out of our Venezuelan businesses. We expect these conditionswill continue for the foreseeable future.
As a result of these factors, we concluded that, effective as of the end of the third quarter of 2015, we did notmeet the accounting criteria for control over our whollyowned Venezuelan subsidiaries and we no longer hadsignificant influence over our beverage joint venture with our franchise bottler in Venezuela. Therefore,effective at the end of the third quarter of 2015, we deconsolidated our Venezuelan subsidiaries and beganaccounting for our investments in our Venezuelan subsidiaries and joint venture using the cost method ofaccounting. We reduced the value of the cost method investments to their estimated fair values, resulting in afull impairment. The factors that led to our conclusions at the end of the third quarter of 2015 continued toexist through the end of the first quarter of 2016.
Beginning with the fourth quarter of 2015, our financial results have not included the results of our Venezuelanbusinesses. We do not have any guarantees related to our Venezuelan entities, and our ongoing contractualcommitments to our Venezuelan businesses are not material. We will recognize income from dividends andsales of inventory to our Venezuelan entities, which have not been and are not expected to be material, to the
19/4/2016 PepsiCo SEC Filings
http://phx.corporateir.net/phoenix.zhtml?c=78265&p=irolSECText&TEXT=aHR0cDovL2FwaS50ZW5rd2l6YXJkLmNvbS9maWxpbmcueG1sP2lwYWd… 33/34
extent cash in U.S. dollars is received. We did not receive any cash in U.S. dollars from our Venezuelanentities in the first quarter of 2016. We will continue to monitor the conditions in Venezuela and their impacton our accounting and disclosure.
Tax benefit
In the year ended December 26, 2015, we recognized a noncash tax benefit of $230 million associated withour agreement with the IRS resolving substantially all open matters related to the audits for taxable years2010 through 2011, which reduced our reserve for uncertain tax positions for the tax years 2010 through 2011.
A 15
19/4/2016 PepsiCo SEC Filings
http://phx.corporateir.net/phoenix.zhtml?c=78265&p=irolSECText&TEXT=aHR0cDovL2FwaS50ZW5rd2l6YXJkLmNvbS9maWxpbmcueG1sP2lwYWd… 34/34
Free cash flow, excluding certain items
Free cash flow (excluding the items noted in the Net Cash Provided by Operating Activities Reconciliationtable) is the primary measure management uses to monitor cash flow performance. This is not a measuredefined by GAAP. Since net capital spending is essential to our product innovation initiatives and maintainingour operational capabilities, we believe that it is a recurring and necessary use of cash. As such, we believeinvestors should also consider net capital spending when evaluating our cash from operating activities.Additionally, we consider certain other items (included in the Net Cash Provided by Operating ActivitiesReconciliation table) in evaluating free cash flow that we believe investors should consider in evaluating ourfree cash flow results.
2016 guidance
Our 2016 core tax rate guidance and our 2016 core constant currency EPS growth guidance exclude thecommodity marktomarket net impact included in corporate unallocated expenses and restructuring andimpairment charges. Our 2016 organic revenue growth guidance excludes the impact of acquisitions,divestitures and other structural changes, including the Venezuela deconsolidation, and foreign exchangetranslation. Our 2016 organic revenue growth guidance also excludes the impact of a 53rd reporting week in2016. In addition, our 2016 organic revenue growth guidance and our 2016 core constant currency EPSgrowth guidance exclude the impact of foreign exchange. We are not able to reconcile our full year projected2016 core tax rate to our full year projected 2016 reported tax rate and our full year projected 2016 coreconstant currency EPS growth to our full year projected 2016 reported EPS growth because we are unable topredict the 2016 impact of foreign exchange or the marktomarket net impact on commodity hedges due tothe unpredictability of future changes in foreign exchange rates and commodity prices. We are also unable toreconcile our full year projected 2016 organic revenue growth to our full year projected 2016 reported netrevenue growth because we are unable to predict the 2016 impact of foreign exchange due to theunpredictability of future changes in foreign exchange rates. Therefore, we are unable to provide areconciliation of these measures.
A 16
<< Previous Page | Next Page >>