mcdonald's corporation - stockproinfo
TRANSCRIPT

UNITED STATESSECURITIES AND EXCHANGE COMMISSION
Washington, DC 20549
FORM 10-K
T ANNUAL REPORT PURSUANT TO SECTION 13 OR 15(d) OF THE SECURITIES EXCHANGE ACT OF 1934For the fiscal year ended December 31, 2012
or£ TRANSITION REPORT PURSUANT TO SECTION 13 OR 15(d) OF THE SECURITIES EXCHANGE ACT OF 1934
For the transition period from to
Commission File Number 1-5231
McDONALD’S CORPORATION(Exact name of registrant as specified in its charter)
Delaware(State or other jurisdiction ofincorporation or organization)
36-2361282(I.R.S. EmployerIdentification No.)
One McDonald’s PlazaOak Brook, Illinois(Address of principal executive offices)
60523(Zip code)
Registrant’s telephone number, including area code: (630) 623-3000
Securities registered pursuant to Section 12(b) of the Act:
Title of each class Name of each exchange
on which registeredCommon stock, $.01 par value New York Stock Exchange
Securities registered pursuant to Section 12(g) of the Act: None (Title of class)
Indicate by check mark if the registrant is a well-known seasoned issuer, as defined in Rule 405 of the Securities Act. Yes T No £Indicate by check mark if the registrant is not required to file reports pursuant to Section 13 or Section 15(d) of the Act. Yes £ No TIndicate by check mark whether the registrant (1) has filed all reports required to be filed by Section 13 or 15(d) of the Securities Exchange Act of 1934 during thepreceding 12 months (or for such shorter period that the registrant was required to file such reports), and (2) has been subject to such filing requirements for thepast 90 days. Yes T No ¨Indicate by check mark whether the registrant has submitted electronically and posted on its corporate Web site, if any, every Interactive Data File required to besubmitted and posted pursuant to Rule 405 of Regulation S-T during the preceding 12 months (or for such shorter period that the registrant was required to submitand post such files). Yes T No ¨Indicate by check mark if disclosure of delinquent filers pursuant to Item 405 of Regulation S-K is not contained herein, and will not be contained, to the best ofregistrant’s knowledge, in definitive proxy or information statements incorporated by reference in Part III of this Form 10-K or any amendment to this Form 10-K. ¨Indicate by check mark whether the registrant is a large accelerated filer, an accelerated filer, a non-accelerated filer, or a smaller reporting company. See thedefinitions of “large accelerated filer,” “accelerated filer” and “smaller reporting company” in Rule 12b-2 of the Exchange Act.(Check one):Large accelerated filer T Accelerated filer ¨Non-accelerated filer ¨ (do not check if a smaller reporting company) Smaller reporting company ¨Indicate by check mark whether the registrant is a shell company (as defined in Rule 12b-2 of the Exchange Act). Yes ¨ No TThe aggregate market value of common stock held by non-affiliates of the registrant as of June 30, 2012 was $89,222,241,655.The number of shares outstanding of the registrant’s common stock as of January 31, 2013 was 1,002,791,769.
DOCUMENTS INCORPORATED BY REFERENCEPart III of this Form 10-K incorporates information by reference from the registrant’s 2013 definitive proxy statement which will be filed no later than 120 days afterDecember 31, 2012

McDONALD’S CORPORATION
INDEX
Page reference Part I. Item 1 Business 1 Item 1A Risk Factors and Cautionary Statement Regarding Forward-Looking Statements 3 Item 1B Unresolved Staff Comments 5 Item 2 Properties 5 Item 3 Legal Proceedings 6 Item 4 Mine Safety Disclosures 6 Part II. Item 5 Market for Registrant’s Common Equity, Related Shareholder Matters and Issuer Purchases of Equity Securities 8
Item 6 Selected Financial Data 9
Item 7 Management’s Discussion and Analysis of Financial Condition and Results of Operations 10 Item 7A Quantitative and Qualitative Disclosures About Market Risk 26 Item 8 Financial Statements and Supplementary Data 26 Item 9 Changes in and Disagreements with Accountants on Accounting and Financial Disclosure 47 Item 9A Controls and Procedures 47 Item 9B Other Information 47 Part III. Item 10 Directors, Executive Officers and Corporate Governance 47 Item 11 Executive Compensation 47 Item 12 Security Ownership of Certain Beneficial Owners and Management and Related Shareholder Matters 47 Item 13 Certain Relationships and Related Transactions, and Director Independence 48 Item 14 Principal Accountant Fees and Services 48 Part IV. Item 15 Exhibits and Financial Statement Schedules 48 Signatures 51 Exhibits
All trademarks used herein are the property of their respective owners.

PART I ITEM 1. Business McDonald’s Corporation, the registrant, together with its sub-sidiaries,is referred to herein as the “Company.”
a. General development of businessDuring 2012, there have been no material changes to the Company’scorporate structure or in its method of conducting business. In 2012,the Company has continued the process it began in 2005 to realigncertain subsidiaries to develop a corporate structure within itsgeographic segments that better reflects the operation of theMcDonald’s worldwide business.
b. Financial information about segmentsSegment data for the years ended December 31, 2012, 2011, and2010 are included in Part II, Item 8, page 40 of this Form 10-K.
c. Narrative description of business
▪ GeneralThe Company franchises and operates McDonald’s restaurants in theglobal restaurant industry. These restaurants serve a broad menu(see Products) at various price points providing value in 119 countriesaround the world.
All restaurants are operated either by the Company or byfranchisees, including conventional franchisees under franchisearrangements, and developmental licensees and foreign affiliatedmarkets under license agreements.
The Company’s operations are designed to assure consistencyand high quality at every restaurant. When granting franchises orlicenses, the Company is selective and generally is not in the practiceof franchising to passive investors.
Under the conventional franchise arrangement, franchiseesprovide a portion of the capital required by initially investing in theequipment, signs, seating and décor of their restaurant businesses,and by reinvesting in the business over time. The Company owns theland and building or secures long-term leases for both Company-operated and conventional franchised restaurant sites. In certaincircumstances, the Company participates in reinvestment forconventional franchised restaurants. A discussion regarding siteselection is included in Part I, Item 2, page 5 of this Form 10-K.
Conventional franchisees contribute to the Company’s revenuestream through the payment of rent and royalties based upon apercent of sales, with specified minimum rent payments, along withinitial fees received upon the opening of a new restaurant or thegranting of a new franchise term. The conventional franchisearrangement typically lasts 20 years, and franchising practices aregenerally consistent throughout the world. Over 70% of franchisedrestaurants operate under conventional franchise arrangements.
Under a developmental license arrangement, licensees providecapital for the entire business, including the real estate interest.While the Company has no capital invested, it receives a royaltybased on a percent of sales, as well as initial fees. The largest of thesedevelopmental license arrangements operates over 1,900 restaurantsacross 19 countries in Latin America and the Caribbean.
The Company has an equity investment in a limited number offoreign affiliated markets, referred to as "affiliates." The largest ofthese affiliates is Japan, where there are nearly 3,300 restaurants.The Company receives a royalty based on a percent of sales in thesemarkets and records its share of net results in Equity in earnings ofunconsolidated affiliates.
The Company and its franchisees purchase food, packaging,equipment and other goods from numerous independent suppliers.The Company has established and strictly enforces high qualitystandards and product specifications. The Company has qualitycenters around the world to ensure that its high standards areconsistently met. The quality assurance process not only involvesongoing product reviews, but also on-site supplier visits. A qualityleadership board, composed of the Company’s technical, safety andsupply chain specialists, provides strategic global leadership for allaspects of food quality and safety. In addition, the Company worksclosely with suppliers to encourage innovation, assure best practicesand drive continuous improvement. Leveraging scale, supply chaininfrastructure and risk management strategies, the Company alsocollaborates with suppliers toward a goal of achieving competitive,predictable food and paper costs over the long term.
Independently owned and operated distribution centers, approvedby the Company, distribute products and supplies to most McDonald’srestaurants. In addition, restaurant personnel are trained in theproper storage, handling and preparation of products and in thedelivery of customer service.
McDonald’s global brand is well known. Marketing, promotionaland public relations activities are designed to promote McDonald’sbrand image and differentiate the Company from competitors.Marketing and promotional efforts focus on value, food taste, menuchoice, nutrition, convenience and the customer experience. TheCompany continuously endeavors to improve its social responsibilityand environmental practices to achieve long-term sustainability,which benefits McDonald’s and the communities it serves. ▪ ProductsMcDonald’s restaurants offer a substantially uniform menu, althoughthere are geographic variations to suit local consumer preferences andtastes. In addition, McDonald’s tests new products on an ongoingbasis.
McDonald’s menu includes hamburgers and cheeseburgers, BigMac, Quarter Pounder with Cheese, Filet-O-Fish, several chickensandwiches, Chicken McNuggets, Snack Wraps, french fries, salads,oatmeal, shakes, McFlurry desserts, sundaes, soft serve cones, pies,soft drinks, coffee, McCafé beverages and other beverages. Inaddition, the restaurants sell a variety of other products duringlimited-time promotions.
McDonald’s restaurants in the U.S. and many internationalmarkets offer a full or limited breakfast menu. Breakfast offerings mayinclude Egg McMuffin, Sausage McMuffin with Egg, McGriddles,biscuit and bagel sandwiches and hotcakes. ▪ Intellectual propertyThe Company owns or is licensed to use valuable intellectual propertyincluding trademarks, service marks, patents, copyrights, tradesecrets and other proprietary information. The Company considers thetrademarks “McDonald’s” and “The Golden Arches Logo” to be ofmaterial importance to its business. Depending on the jurisdiction,trademarks and service marks generally are valid as long as they areused and/or registered. Patents, copyrights and licenses are ofvarying remaining durations. ▪ Seasonal operations
The Company does not consider its operations to be seasonal to anymaterial degree. ▪ Working capital practicesInformation about the Company’s working capital practices isincorporated herein by reference to Management’s discussion andanalysis of financial condition and results of operations for the
McDonald's Corporation 2012 Annual Report 1

years ended December 31, 2012, 2011, and 2010 in Part II, Item 7,pages 10 through 26, and the Consolidated statement of cash flows forthe years ended December 31, 2012, 2011, and 2010 in Part II,Item 8, page 30 of this Form 10-K. ▪ CustomersThe Company’s business is not dependent upon either a singlecustomer or small group of customers. ▪ BacklogCompany-operated restaurants have no backlog orders. ▪ Government contractsNo material portion of the business is subject to renegotiation of profitsor termination of contracts or subcontracts at the election of the U.S.government. ▪ CompetitionMcDonald’s restaurants compete with international, national, regionaland local retailers of food products. The Company competes on thebasis of price, convenience, service, menu variety and productquality in a highly fragmented global restaurant industry.
In measuring the Company’s competitive position, managementreviews data compiled by Euromonitor International, a leading sourceof market data with respect to the global restaurant industry. TheCompany’s primary competition, which management refers to as theInformal Eating Out ("IEO") segment, includes the followingrestaurant categories defined by Euromonitor International: quick-service eating establishments, casual dining full-service restaurants,100% home delivery/takeaway providers, street stalls or kiosks,specialist coffee shops, juice/smoothie bars and self-service cafeterias.The IEO segment excludes establishments that primarily servealcohol and full-service restaurants other than casual dining.
Based on data from Euromonitor International, the global IEOsegment was composed of approximately 7.0 million outlets andgenerated $1.05 trillion in annual sales in 2011, the most recent yearfor which data is available. McDonald’s Systemwide 2011 restaurantbusiness accounted for approximately 0.5% of those outlets and about8% of the sales.
Management also on occasion benchmarks McDonald’s againstthe entire restaurant industry, including the IEO segment definedabove and all other full-service restaurants. Based on data fromEuromonitor International, the restaurant industry was composed ofapproximately 14.8 million outlets and generated about $2.11 trillion inannual sales in 2011. McDonald’s Systemwide restaurant businessaccounted for approximately 0.2% of those outlets and about 4% of thesales.
▪ Research and developmentThe Company operates research and development facilities in theU.S., Europe and Asia. While research and development activities areimportant to the Company’s business, these expenditures are notmaterial. Independent suppliers also conduct research activities thatbenefit the Company, its franchisees and suppliers (collectivelyreferred to as the "System"). ▪ Environmental mattersIncreased focus by U.S. and overseas governmental authorities onenvironmental matters is likely to lead to new governmentalinitiatives, particularly in the area of climate change. While wecannot predict the precise nature of these initiatives, we expect thatthey may impact our business both directly and indirectly. Althoughthe impact would likely vary by world region and/or market, webelieve that adoption of new regulations may increase
costs, including for the Company, its franchisees and suppliers. Also,there is a possibility that governmental initiatives, or actual orperceived effects of changes in weather patterns or climate, couldhave a direct impact on the operations of our restaurants or theoperations of our suppliers in ways which we cannot predict at thistime.
The Company monitors developments related to environmentalmatters and plans to respond to governmental initiatives in a timelyand appropriate manner. At this time, the Company has alreadybegun to undertake its own initiatives relating to preservation of theenvironment, including the development of a means to monitor andreduce energy use, in many of its markets. ▪ Number of employeesThe Company’s number of employees worldwide, including Company-operated restaurant employees, was approximately 440,000 as ofyear-end 2012.
d. Financial information about geographic areasFinancial information about geographic areas is incorporated hereinby reference to Management’s discussion and analysis of financialcondition and results of operations in Part II, Item 7, pages 10 through26 and Segment and geographic information in Part II, Item 8, page40 of this Form 10-K.
e. Available informationThe Company is subject to the informational requirements of theSecurities Exchange Act of 1934 ("Exchange Act"). The Companytherefore files periodic reports, proxy statements and other informationwith the U.S. Securities and Exchange Commission ("SEC"). Suchreports may be obtained by visiting the Public Reference Room of theSEC at 100 F Street, NE, Washington, DC 20549, or by calling theSEC at (800) SEC-0330. In addition, the SEC maintains an Internetsite (www.sec.gov) that contains reports, proxy and informationstatements and other information.
Financial and other information can also be accessed on theinvestor section of the Company’s website atwww.aboutmcdonalds.com. The Company makes available, free ofcharge, copies of its annual report on Form 10-K, quarterly reports onForm 10-Q, current reports on Form 8-K, and amendments to thosereports filed or furnished pursuant to Section 13(a) or 15(d) of theExchange Act as soon as reasonably practicable after filing suchmaterial electronically or otherwise furnishing it to the SEC. Copies offinancial and other information are also available free of charge bycalling (800) 228-9623 or by sending a request to McDonald’sCorporation Shareholder Services, Department 720, One McDonald’sPlaza, Oak Brook, Illinois 60523.
Also posted on McDonald’s website are the Company’s CorporateGovernance Principles; the charters for each of the Committees of theBoard of Directors, including the Audit Committee, CompensationCommittee and Governance Committee; the Company’s Standards ofBusiness Conduct; the Code of Ethics for Chief Executive Officer andSenior Financial Officers; and the Code of Conduct for the Board ofDirectors. Copies of these documents are also available free of chargeby calling (800) 228-9623 or by sending a request to McDonald’sCorporation Shareholder Services, Department 720, One McDonald’sPlaza, Oak Brook, Illinois 60523.
Information on the Company’s website is not incorporated into thisForm 10-K or the Company’s other securities filings and is not a part ofthem.
2 McDonald's Corporation 2012 Annual Report

ITEM 1A. Risk Factors and Cautionary StatementRegarding Forward-Looking Statements The information on this report includes forward-looking statementsabout our plans and future performance, including those underOutlook for 2013. These statements use such words as “may,” “will,”“expect,” “believe” and “plan.” They reflect our expectations andspeak only as of the date of this report. We do not undertake to updatethem. Our expectations (or the underlying assumptions) may changeor not be realized, and you should not rely unduly on forward-lookingstatements.
Our business and execution of our strategic plan, the Plan toWin, are subject to risks. The most important of these is whether wecan remain relevant to our customers and a brand they trust. Meetingcustomer expectations is complicated by the risks inherent in ourglobal operating environment. The IEO segment of the restaurantindustry, although largely mature in our major markets, is highlyfragmented and competitive. The IEO segment has been flat orcontracting in many of our markets, including some of our majormarkets, due to unfavorable global economic conditions, and thisenvironment is expected to continue. Persistently highunemployment rates in many of these markets, and decliningeconomic growth rates or recessionary conditions in some of them,have also increased consumer focus on value and heightened pricingsensitivity. Combined with pressure on labor and occupancy costs andvolatility in commodity prices, as well as aggressive competitiveactivity, these circumstances affect restaurant sales and are expectedto continue to pressure margins during 2013 in all of our geographicsegments. We have the added challenge of the cultural andregulatory differences that exist within and among the more than 100countries where we operate. Initiatives we undertake may not haveuniversal appeal among different segments of our customer base andcan drive unanticipated changes in guest counts and customerperceptions. Our operations, plans and results are also affected byregulatory and similar initiatives around the world, notably the focuson nutritional content and the production, processing and preparationof food “from field to front counter,” as well as industry marketingpractices.
These risks can have an impact both in the near- and long-termand are reflected in the following considerations and factors that webelieve are most likely to affect our performance.
Our ability to remain a relevant and trusted brand and toincrease sales and profits depends largely on how well weexecute the Plan to Win and our global priorities.
The Plan to Win addresses the key drivers of our business andresults - people, products, place, price and promotion - and we arefocused on our three global priorities that represent the greatestopportunities under our Plan to Win: optimizing our menu, modernizingthe customer experience and broadening accessibility to our Brand.The quality of our execution depends mainly on the following:▪ Our ability to anticipate and respond effectively to trends or other
factors that affect the IEO segment and our competitive positionin the diverse markets we serve, such as spending patterns,demographic changes, trends in food preparation, consumerpreferences and publicity about us, all of which can drivepopular perceptions of our business or affect the willingness ofother companies to enter into site, supply or other arrangementsor alliances with us;
▪ The risks associated with our franchise business model,including whether our franchisees and developmental licenseeswill have the experience and financial resources to be effectiveoperators and remain aligned with us on
operating, promotional and capital-intensive initiatives and thepotential impact on us if they experience food safety or otheroperational problems or project a brand image inconsistent withour values, particularly if our contractual and other rights andremedies are limited by law or otherwise, costly to exercise orsubject to litigation;
▪ The success of our tiered approach to menu offerings and ourability to introduce new offerings, as well as the impact of ourcompetitors' actions, including in response to our menu changes,and our ability to continue robust menu development andmanage the complexity of our restaurant operations;
▪ Our ability to differentiate the McDonald's experience in a waythat balances consumer value with margin levels, particularly inmarkets where pricing or cost pressures are significant or havebeen exacerbated by the current challenging economic andoperating environment;
▪ The impact of pricing, marketing and promotional plans on salesand margins and our ability to adjust these plans to respondquickly to changing economic and heightened competitiveconditions;
▪ Our ability to drive restaurant improvements that achieveoptimal capacity, particularly during peak mealtime hours, and tomotivate our restaurant personnel and our franchisees toachieve consistency and high service levels so as to improveconsumer perceptions of our ability to meet expectations forquality food served in clean and friendly environments;
▪ Whether we can complete our restaurant reimaging andrebuilding plans as projected, and whether we are able toidentify and develop restaurant sites consistent with our plans fornet growth of Systemwide restaurants, as well as sales andprofitability targets;
▪ The costs and risks associated with our increasing reliance oninformation systems (e.g., point-of-sale and other in-store systemsor platforms) that support our restaurants and that we makeavailable to franchisees along with related services, includingthe risk that we will not realize fully the benefits of thesignificant investments we are making, which are intended toenhance the customer experience; the potential for systemfailures, programming errors, security breaches involving oursystems or those of third-party system operators; legal and taxrisks associated with providing these services to franchisees,including those relating to data protection and management; andlitigation risk involving intellectual property rights or our rightsand obligations to others under related contractualarrangements;
▪ The success of our initiatives to support menu choice, physicalactivity and nutritional awareness and to address these andother matters of social responsibility in a way that communicatesour values effectively and inspires trust and confidence;
▪ Our ability to respond effectively to adverse perceptions aboutthe quick-service category of the IEO segment or about our food(including its nutritional content and preparation), promotionsand premiums, such as Happy Meal toys (collectively, our"products"), how we source the commodities we use, and ourability to manage the potential impact on McDonald's of food-borne illnesses or product safety issues;
▪ The impact of campaigns by labor organizations and activists orthe use of social media and other mobile communications andapplications to promote adverse perceptions of our operations orthose of our suppliers, or to promote or
McDonald's Corporation 2012 Annual Report 3

threaten boycotts or other actions involving us or our suppliers;▪ The impact of events such as boycotts or protests, labor strikes
and supply chain interruptions (including due to lack of supplyor price increases) that can adversely affect us or the vendors,franchisees and others that are also part of the McDonald'sSystem and whose performance has a material impact on ourresults;
▪ Our ability to recruit and retain qualified personnel to manageour operations and growth; and
▪ Our ability to leverage promotional or operating successes inindividual markets into other markets in a timely and cost-effective way.
Our results and financial condition are affected by global andlocal market conditions, and the prolonged challengingeconomic environment can be expected to continue to pressureour results.
Our results of operations are substantially affected by economicconditions, both globally and in local markets, and conditions can alsovary substantially by market. The current global environment has beencharacterized by persistently weak economies, high unemploymentrates, inflationary pressures and volatility in financial markets. Manymajor economies, both advanced and developing, are also facingsignificant economic issues. These include, in the U.S., concernsabout the federal deficit and the potential adverse effects of theautomatic spending cuts that will become effective in early 2013 absentfurther legislation. The Eurozone debt crisis continues to depressconsumer and business confidence and spending in many markets.Important markets in Asia, which have been key drivers of globalgrowth, have been experiencing declining growth rates. Uncertaintyabout the long-term investment environment could further depresscapital investment and economic activity.
These conditions are adversely affecting sales and/or guestcounts in many of our markets, including some of our major markets.To mitigate their impact, we have intensified our focus on value as adriver of guest counts through menu, pricing and promotional actions.These actions have adversely affected our margin percent, andmargins will remain under pressure. The key factors that can affect ouroperations, plans and results in this environment are the following:▪ Whether our strategies will be effective in enabling the
continued market share gains that we have included in ourplans, while at the same time enabling us to achieve ourtargeted operating income growth despite the current adverseeconomic conditions, resurgent competitors and a more costly andcompetitive advertising environment;
▪ The effectiveness of our supply chain management to assurereliable and sufficient product supply on favorable terms;
▪ The impact on consumer disposable income levels and spendinghabits of governmental actions to manage national economicmatters, whether through austerity or stimulus measures andinitiatives intended to control wages, unemployment, creditavailability, inflation, taxation and other economic drivers;
▪ The impact on restaurant sales and margins of ongoingcommodity price volatility, and the effectiveness of pricing,hedging and other actions taken to address this environment;
▪ The impact on our margins of labor costs and the long-term trendtoward higher wages and social expenses in both mature anddeveloping markets;
▪ The impact of foreign exchange and interest rates on ourfinancial condition and results;
▪ The challenges and uncertainties associated with operating indeveloping markets, which may entail a relatively higher risk ofpolitical instability, economic volatility, crime, corruption andsocial and ethnic unrest, all of which are exacerbated in manycases by a lack of an independent and experienced judiciaryand uncertainties in how local law is applied and enforced,including in areas most relevant to commercial transactions andforeign investment;
▪ The nature and timing of decisions about underperformingmarkets or assets, including decisions that result in impairmentcharges that reduce our earnings;
▪ The increasing focus on workplace practices and conditions,which may drive changes in practices or in the generalcommercial and regulatory environment that affect perceptions ofour business or our cost of doing business;
▪ The impact of changes in our debt levels on our credit ratings,interest expense, availability of acceptable counterparties, abilityto obtain funding on favorable terms or our operating or financialflexibility, especially if lenders impose new operating or financialcovenants; and
▪ The impact of an exit from the Eurozone by any of the EUMember States, which could entail disruption to our business asthe exiting Member State establishes a new currency and we,along with our suppliers, franchisees and others, address thechallenges associated with redenomination.
Increasing legal and regulatory complexity will continue toaffect our operations and results in material ways.
Our legal and regulatory environment worldwide exposes us tocomplex compliance, litigation and similar risks that affect ouroperations and results in material ways. In many of our markets,including the United States and Europe, we are subject to increasingregulation, which has increased our cost of doing business. Indeveloping markets, we face the risks associated with new anduntested laws and judicial systems. Among the more importantregulatory and litigation risks we face and must manage are thefollowing:▪ The cost, compliance and other risks associated with the often
conflicting and highly prescriptive regulations we face,especially in the United States where inconsistent standardsimposed by local, state and federal authorities can adverselyaffect popular perceptions of our business and increase ourexposure to litigation or governmental investigations orproceedings;
▪ The impact of new, potential or changing regulations that canaffect our business plans, such as those relating to productpackaging, marketing and the nutritional content and safety ofour food and other products, as well as the risks and costs of ourlabeling and other disclosure practices, particularly givenvarying legal requirements and practices for testing anddisclosure within our industry, ordinary variations in foodpreparation among our own restaurants, and the need to rely onthe accuracy and completeness of information from third-partysuppliers;
▪ The impact of nutritional, health and other scientific inquiriesand conclusions, which constantly evolve and often havecontradictory implications, but nonetheless drive popularopinion, litigation and regulation, including taxation, in waysthat could be material to our business;
▪ The impact of litigation trends, particularly in our major markets,including class actions, labor, employment and personal injuryclaims, franchisee litigation, landlord/tenant disputes andintellectual property claims (including often aggressive oropportunistic attempts to enforce patents used in informationtechnology systems); the relative level of our
4 McDonald's Corporation 2012 Annual Report

defense costs, which vary from period to period depending on thenumber, nature and procedural status of pending proceedings;the cost and other effects of settlements or judgments, which mayrequire us to make disclosures or take other actions that mayaffect perceptions of our brand and products; and the scope andterms of insurance or indemnification protections that we mayhave;
▪ Adverse results of pending or future litigation, includinglitigation challenging the composition and preparation of ourproducts, or the appropriateness or accuracy of our marketing orother communication practices;
▪ The risks and costs to us, our franchisees and our supply chainof the effects of climate change, as well as of increased focus byU.S. and overseas governmental and non-governmentalorganizations on environmental sustainability matters (e.g.,climate change, land use, energy and water resources,packaging and waste, and animal health and welfare) and theincreased pressure to make commitments or set targets and takeactions to meet them, which could expose the Company tomarket, operational and execution costs or risks, particularlywhen actions are undertaken Systemwide;
▪ The increasing costs and other effects of compliance with U.S.and overseas regulations affecting our workforce and laborpractices, including regulations relating to wage and hourpractices, workplace conditions, healthcare, immigration,retirement and other employee benefits and unlawful workplacediscrimination;
▪ Disruptions in our operations or price volatility in a market thatcan result from governmental actions, such as price, foreignexchange or import-export controls, increased tariffs orgovernment-mandated closure of our or our vendors' operations,and the cost and disruption of responding to governmentalinvestigations or proceedings, whether or not they have merit;
▪ The legal and compliance risks and costs associated with privacy,consumer data protection and similar laws, particularly as theyapply to children, the potential costs (including the loss ofconsumer confidence) arising from alleged security breaches ofour information systems, and the risk of criminal penalties or civilliability to consumers, employees or franchisees whose data isalleged to have been collected or used inappropriately; and
▪ The impact of changes in financial reporting requirements,accounting principles or practices, including with respect to ourcritical accounting estimates, changes in tax accounting or taxlaws (or related authoritative interpretations), particularly ifcorporate tax reform becomes a key component of budgetaryinitiatives in the United States and elsewhere, and the impact ofsettlements of pending or any future adjustments proposed bythe IRS or other taxing authorities in connection with our taxaudits, all of which will depend on their timing, nature andscope.
The trading volatility and price of our common stock may beaffected by many factors.
Many factors affect the volatility and price of our common stock inaddition to our operating results and prospects. The most important ofthese, some of which are outside our control, are the following:▪ The continuing unfavorable global economic and volatile market
conditions;▪ Governmental action or inaction in light of key indicators of
economic activity or events that can significantly influencefinancial markets, particularly in the United States which is
the principal trading market for our common stock, and mediareports and commentary about economic or other matters, evenwhen the matter in question does not directly relate to ourbusiness;
▪ Changes in financial or tax reporting and accounting principlesor practices that materially affect our reported financial conditionand results and investor perceptions of our performance;
▪ Trading activity in our common stock or trading activity inderivative instruments with respect to our common stock or debtsecurities, which can reflect market commentary (includingcommentary that may be unreliable or incomplete in some cases)or expectations about our business, our creditworthiness orinvestor confidence generally; actions by shareholders andothers seeking to influence our business strategies; portfoliotransactions in our stock by significant shareholders; or tradingactivity that results from the ordinary course rebalancing of stockindices in which McDonald's may be included, such as the S&P500 Index and the Dow Jones Industrial Average;
▪ The impact of our stock repurchase program or dividend rate; and▪ The impact on our results of other corporate actions, such as
those we may take from time to time as part of our continuousreview of our corporate structure in light of business, legal andtax considerations.
Our results and prospects can be adversely affected by eventssuch as severe weather conditions, natural disasters, hostilitiesand social unrest, among others.
Severe weather conditions, natural disasters, hostilities and socialunrest, terrorist activities, health epidemics or pandemics (orexpectations about them) can adversely affect consumer spendingand confidence levels or other factors that affect our results andprospects, such as commodity costs. Our receipt of proceeds underany insurance we maintain with respect to certain of these risks maybe delayed or the proceeds may be insufficient to offset our lossesfully.
ITEM 1B. Unresolved Staff Comments None.
ITEM 2. Properties The Company owns and leases real estate primarily in connectionwith its restaurant business. The Company identifies and developssites that offer convenience to customers and long-term sales andprofit potential to the Company. To assess potential, the Companyanalyzes traffic and walking patterns, census data and other relevantdata. The Company’s experience and access to advanced technologyaid in evaluating this information. The Company generally owns theland and building or secures long-term leases for restaurant sites,which ensures long-term occupancy rights and helps control relatedcosts. Restaurant profitability for both the Company and franchisees isimportant; therefore, ongoing efforts are made to control averagedevelopment costs through construction and design efficiencies,standardization and by leveraging the Company’s global sourcingnetwork. Additional information about the Company’s properties isincluded in Management’s discussion and analysis of financialcondition and results of operations in Part II, Item 7, pages 10 through26 and in Financial statements and supplementary data in Part II,Item 8, pages 26 through 43 of this Form 10-K.
McDonald's Corporation 2012 Annual Report 5

ITEM 3. Legal Proceedings The Company has pending a number of lawsuits that have been filedin various jurisdictions. These lawsuits cover a broad variety ofallegations spanning the Company’s entire business. The following isa brief description of the more significant types of lawsuits. In addition,the Company is subject to various federal, state and local regulationsthat impact various aspects of its business, as discussed below. Whilethe Company does not believe that any such claims, lawsuits orregulations will have a material adverse effect on its financialcondition or results of operations, unfavorable rulings could occur.Were an unfavorable ruling to occur, there exists the possibility of amaterial adverse impact on net income for the period in which theruling occurs or for future periods. ▪ FranchisingA substantial number of McDonald’s restaurants are franchised toindependent entrepreneurs operating under contractualarrangements with the Company. In the course of the franchiserelationship, occasional disputes arise between the Company and itsfranchisees relating to a broad range of subjects including, but notlimited to, quality, service and cleanliness issues, contentionsregarding grants or terminations of franchises, delinquent paymentsof rents and fees, and franchisee claims for additional franchises orrewrites of franchises. Additionally, occasional disputes arise betweenthe Company and individuals who claim they should have beengranted a McDonald’s franchise.
▪ SuppliersThe Company and its affiliates and subsidiaries generally do notsupply food, paper or related items to any McDonald’s restaurants.The Company relies upon numerous independent suppliers that arerequired to meet and maintain the Company’s high standards andspecifications. On occasion, disputes arise between the Company andits suppliers which include, by way of example, compliance withproduct specifications and the Company’s business relationship withsuppliers. In addition, disputes occasionally arise on a number ofissues between the Company and individuals or entities who claimthat they should be (or should have been) granted the opportunity tosupply products or services to the Company’s restaurants.
▪ EmployeesHundreds of thousands of people are employed by the Company andin restaurants owned and operated by subsidiaries of the Company. Inaddition, thousands of people from time to time seek employment insuch restaurants. In the ordinary course of business, disputes ariseregarding hiring, firing, promotion and pay practices, including wageand hour disputes, alleged discrimination and compliance withemployment laws. ▪ CustomersRestaurants owned by subsidiaries of the Company regularly serve abroad segment of the public. In so doing, disputes arise as to products,service, incidents, advertising, nutritional and other disclosures, aswell as other matters common to an extensive restaurant businesssuch as that of the Company. ▪ Intellectual PropertyThe Company has registered trademarks and service marks, patentsand copyrights, some of which are of material importance to theCompany’s business. From time to time, the Company may becomeinvolved in litigation to protect its intellectual property and defendagainst the alleged use of third party intellectual property. ▪ Government RegulationsLocal, state and federal governments have adopted laws andregulations involving various aspects of the restaurant businessincluding, but not limited to, advertising, franchising, health, safety,environment, zoning and employment. The Company strives tocomply with all applicable existing statutory and administrative rulesand cannot predict the effect on its operations from the issuance ofadditional requirements in the future.
ITEM 4. Mine Safety Disclosures Not applicable.
6 McDonald's Corporation 2012 Annual Report

The following are the Executive Officers of our Company (asof the date of this filing):
Jose Armario, 53, is Corporate Executive Vice President—GlobalSupply Chain, Development and Franchising, a position he has heldsince October 2011. He previously served as Group President,McDonald’s Canada and Latin America from February 2008 throughSeptember 2011 and President, McDonald’s Latin America fromDecember 2003 to February 2008. Mr. Armario has been with theCompany for 16 years.
Peter J. Bensen, 50, is Corporate Executive Vice President andChief Financial Officer, a position he has held since January 2008.From April 2007 through December 2007, he served as CorporateSenior Vice President—Controller. Prior to that time, Mr. Bensenserved as Corporate Vice President–Assistant Controller fromFebruary 2002 through March 2007. Mr. Bensen has been with theCompany for 16 years.
Timothy J. Fenton, 55, is Chief Operating Officer, a position hehas held since July 2012. From January 2005 through June 2012, heheld the position of President, McDonald's Asia/Pacific, Middle Eastand Africa and he served as President, East Division for McDonald’sUSA from May 2003 to January 2005. Mr. Fenton has been with theCompany for 39 years.
Richard Floersch, 55, is Corporate Executive Vice President andChief Human Resources Officer. Mr. Floersch joined the Company inNovember 2003. He previously served as Senior Vice President ofHuman Resources for Kraft Foods from 1998 through 2003.Mr. Floersch has been with the Company for nine years.
Douglas M. Goare, 60, is President, McDonald’s Europe, aposition he has held since October 2011. From February 2011 throughSeptember 2011, he served as Corporate Executive Vice President ofSupply Chain and Development. From June 2007 through November2010, he held the position of Corporate Senior Vice President ofSupply Chain. In addition to this role, Mr. Goare assumedresponsibility for Development in December 2010 and served asCorporate Senior Vice President of Supply Chain and Developmentthrough January 2011. Mr. Goare has been with the Company for 34years.
David L. Hoffmann, 45, is President of Asia/Pacific, Middle Eastand Africa, a position he has held since July 2012. From January2012 through June 2012, he held the position of Senior VicePresident and Restaurant Support Officer for Asia/Pacific, Middle Eastand Africa. Prior to that time, he held the position of Vice President ofStrategy, Insights and Development for Asia/Pacific, Middle East andAfrica from May 2011 through December 2011. From November 2008through April 2011, he held the position of Executive Vice President ofMcDonald's Japan. He held the position of Senior Vice President—Strategy and Franchising of
McDonald's Japan from August 2007 through October 2008. Mr.Hoffmann has been with the Company for 16 years.
Kenneth M. Koziol, 53, became Corporate Executive VicePresident—Chief Restaurant Officer in February 2013. From July2006 through January 2013, he held the position of Corporate SeniorVice President—Innovation. Prior to that time, Mr. Koziol served asCorporate Vice President Restaurant Solutions Group WorldwideInnovation from June 2004 to July 2006. Mr. Koziol has been with theCompany for 24 years.
Kevin L. Newell, 55, is Corporate Executive Vice President andGlobal Chief Brand Officer, a position he has held since February2011. Effective March 1, 2013, Mr. Newell will have a new role asU.S. Chief Brand and Strategy Officer. From September2009 through January 2011, he served as U.S. Senior Vice Presidentand Restaurant Support Officer for the West Division. Prior to thattime, Mr. Newell served as U.S. Vice President & General Manager ofthe Great Southern Region from November 2006 through August2009. Mr. Newell has been with the Company for 23 years.
Kevin M. Ozan, 49, is Corporate Senior Vice President–Controller,a position he has held since February 2008. From May 2007 throughJanuary 2008, he served as Corporate Vice President—AssistantController. He previously served as a Senior Director in InvestorRelations from May 2006 to April 2007. Mr. Ozan has been with theCompany for 15 years.
Gloria Santona, 62, is Corporate Executive Vice President,General Counsel and Secretary, a position she has held sinceJuly 2003. From June 2001 to July 2003, she served as CorporateSenior Vice President, General Counsel and Secretary. Ms. Santonahas been with the Company for 35 years.
Jeffrey P. Stratton, 57, is President, McDonald's USA, a positionhe has held since December 2012. He previously served as CorporateExecutive Vice President–Chief Restaurant Officer fromJanuary 2005 through November 2012 and prior to that, served asU.S. Executive Vice President, Chief Restaurant Officer from January2004 through December 2004. Preceding this, he served as SeniorVice President, Chief Restaurant Officer of McDonald’s USA fromMay 2002 to January 2004. Mr. Stratton has been with the Companyfor 39 years.
Donald Thompson, 49, is President and Chief Executive Officer, aposition he has held since July 2012. He served as President andChief Operating Officer from January 2010 through June 2012. Mr.Thompson was also elected a Director in January 2011. Prior to that heserved as President, McDonald’s USA, from August 2006 to January2010, and as Executive Vice President and Chief Operations Officerfor McDonald’s USA from January 2005 to August 2006. Mr. Thompsonhas been with the Company for 22 years.
McDonald's Corporation 2012 Annual Report 7

PART II
ITEM 5. Market for Registrant’s Common Equity, Related Shareholder Matters and Issuer Purchases of EquitySecurities MARKET INFORMATION AND DIVIDEND POLICYThe Company’s common stock trades under the symbol MCD and is listed on the New York Stock Exchange in the U.S. The following table setsforth the common stock price ranges on the New York Stock Exchange and dividends declared per common share:
2012 2011 Dollars per share High Low Dividend High Low Dividend Quarter: First 102.22 95.13 0.70 77.59 72.14 0.61 Second 99.50 85.92 0.70 84.91 75.66 0.61 Third 94.00 86.15 1.47 * 91.22 82.01 1.31 *Fourth 94.16 83.31 101.00 83.74 Year 102.22 83.31 2.87 101.00 72.14 2.53 * Includes a $0.70 and $0.61 per share dividend declared and paid in third quarter of 2012 and 2011, respectively, and a $0.77 and $0.70 per share dividend declared in
third quarter and paid in fourth quarter of 2012 and 2011, respectively.The number of shareholders of record and beneficial owners of the Company’s common stock as of January 31, 2013 was estimated to be
1,811,000.Given the Company’s returns on equity, incremental invested capital and assets, management believes it is prudent to reinvest in the
business in markets with acceptable returns and/or opportunity for long-term growth and use excess cash flow to return cash to shareholdersthrough dividends and share repurchases. The Company has paid dividends on common stock for 37 consecutive years through 2012 and hasincreased the dividend amount at least once every year. As in the past, future dividend amounts will be considered after reviewing profitabilityexpectations and financing needs, and will be declared at the discretion of the Company’s Board of Directors.
ISSUER PURCHASES OF EQUITY SECURITIESThe following table presents information related to repurchases of common stock the Company made during the quarter ended December 31,2012*:
PeriodTotal Number of
Shares Purchased Average Price
Paid per Share
Total Number ofShares Purchased as
Part of PubliclyAnnounced Plans or
Programs(1)
Approximate DollarValue of Shares
that May YetBe Purchased Under
the Plans or Programs (1) October 1-31, 2012 2,196,461 90.03 2,196,461 $ 9,403,831,013November 1-30, 2012 1,586,118 85.83 1,586,118 9,267,690,809December 1-31, 2012 176,500 88.73 176,500 9,252,029,146 Total 3,959,079 88.29 3,959,079 * Subject to applicable law, the Company may repurchase shares directly in the open market, in privately negotiated transactions, or pursuant to derivative
instruments and plans complying with Rule 10b5-1, among other types of transactions and arrangements.(1) On July 19, 2012, the Company's Board of Directors approved a share repurchase program, effective August 1, 2012, that authorizes the purchase of up to
$10 billion of the Company's outstanding common stock with no specified expiration date.
8 McDonald's Corporation 2012 Annual Report

ITEM 6. Selected Financial Data 6-Year Summary Dollars in millions, except per share data 2012 2011 2010 2009 2008 2007
Company-operated sales $ 18,603 18,293 16,233 15,459 16,561 16,611 Franchised revenues $ 8,964 8,713 7,842 7,286 6,961 6,176 Total revenues $ 27,567 27,006 24,075 22,745 23,522 22,787Operating income $ 8,605 8,530 7,473 6,841 (1) 6,443 3,879 (4) Income from continuing operations $ 5,465 5,503 4,946 4,551 (1,2) 4,313 (3) 2,335 (4,5) Net income $ 5,465 5,503 4,946 4,551 (1,2) 4,313 (3) 2,395 (4,5,6)
Cash provided by operations $ 6,966 7,150 6,342 5,751 5,917 4,876 Cash used for investing activities $ 3,167 2,571 2,056 1,655 1,625 1,150 Capital expenditures $ 3,049 2,730 2,135 1,952 2,136 1,947 Cash used for financing activities $ 3,850 4,533 3,729 4,421 4,115 3,996 Treasury stock purchases(7) $ 2,605 3,373 2,648 2,854 3,981 3,949 Common stock cash dividends $ 2,897 2,610 2,408 2,235 1,823 1,766 Financial position at year end: Total assets $ 35,386 32,990 31,975 30,225 28,462 29,392 Total debt $ 13,633 12,500 11,505 10,578 10,218 9,301 Total shareholders’ equity $ 15,294 14,390 14,634 14,034 13,383 15,280 Shares outstanding in millions 1,003 1,021 1,054 1,077 1,115 1,165 Per common share: Income from continuing operations-diluted $ 5.36 5.27 4.58 4.11 (1,2) 3.76 (3) 1.93 (4,5) Earnings-diluted $ 5.36 5.27 4.58 4.11 (1,2) 3.76 (3) 1.98 (4,5,6) Dividends declared $ 2.87 2.53 2.26 2.05 1.63 1.50
Market price at year end $ 88.21 100.33 76.76 62.44 62.19 58.91
Company-operated restaurants 6,598 6,435 6,399 6,262 6,502 6,906
Franchised restaurants 27,882 27,075 26,338 26,216 25,465 24,471
Total Systemwide restaurants 34,480 33,510 32,737 32,478 31,967 31,377Franchised sales (8) $ 69,687 67,648 61,147 56,928 54,132 46,943
(1) Includes pretax income due to Impairment and other charges (credits), net of $61.1 million ($91.4 million after tax or $0.08 per share) primarily related to the resolutionof certain liabilities retained in connection with the 2007 Latin America developmental license transaction.
(2) Includes income of $58.8 million ($0.05 per share) for gain on sale of investment related to the sale of the Company’s minority ownership interest in RedboxAutomated Retail, LLC.
(3) Includes income of $109.0 million ($0.09 per share) for gain on sale of investment from the sale of the Company’s minority ownership interest in U.K.- based Pret AManger.
(4) Includes pretax operating charges of $1.7 billion ($1.32 per share) due to Impairment and other charges (credits), net primarily as a result of the Company’s sale of itsbusinesses in 18 Latin American and Caribbean markets to a developmental licensee.
(5) Includes a tax benefit of $316.4 million ($0.26 per share) resulting from the completion of an Internal Revenue Service examination of the Company’s 2003-2004 U.S.federal tax returns.
(6) Includes income of $60.1 million ($0.05 per share) related to discontinued operations primarily from the sale of the Company’s investment in Boston Market.(7) Represents treasury stock purchases as reflected in Shareholders' equity.(8) While franchised sales are not recorded as revenues by the Company, management believes they are important in understanding the Company's financial performance
because these sales are the basis on which the Company calculates and records franchised revenues and are indicative of the financial health of the franchisee base.Franchised restaurants represent more than 80% of McDonald's restaurants worldwide.
McDonald's Corporation 2012 Annual Report 9

ITEM 7. Management’s Discussion and Analysis ofFinancial Condition and Results of Operations OverviewDESCRIPTION OF THE BUSINESSThe Company franchises and operates McDonald’s restaurants. Ofthe 34,480 restaurants in 119 countries at year-end 2012, 27,882 werefranchised or licensed (including 19,869 franchised to conventionalfranchisees, 4,350 licensed to developmental licensees and 3,663licensed to foreign affiliates ("affiliates")—primarily Japan) and 6,598were operated by the Company. Under our conventional franchisearrangement, franchisees provide a portion of the capital required byinitially investing in the equipment, signs, seating and décor of theirrestaurant business, and by reinvesting in the business over time.The Company owns the land and building or secures long-term leasesfor both Company-operated and conventional franchised restaurantsites. This maintains long-term occupancy rights, helps control relatedcosts and assists in alignment with franchisees. In certaincircumstances, the Company participates in reinvestment forconventional franchised restaurants. Under our developmentallicense arrangement, licensees provide capital for the entirebusiness, including the real estate interest, and the Company has nocapital invested. In addition, the Company has an equity investmentin a limited number of affiliates that invest in real estate and operateor franchise restaurants within a market.
We view ourselves primarily as a franchisor and believefranchising is important to delivering great, locally-relevant customerexperiences and driving profitability. However, directly operatingrestaurants is paramount to being a credible franchisor and isessential to providing Company personnel with restaurant operationsexperience. In our Company-operated restaurants, and incollaboration with franchisees, we further develop and refineoperating standards, marketing concepts and product and pricingstrategies, so that only those that we believe are most beneficial areintroduced in the restaurants. We continually review, and asappropriate adjust, our mix of Company-operated and franchised orlicensed (conventional franchised, developmental licensed andforeign affiliated) restaurants to help optimize overall performance.
The Company’s revenues consist of sales by Company-operatedrestaurants and fees from restaurants operated by franchisees.Revenues from conventional franchised restaurants include rent androyalties based on a percent of sales along with minimum rentpayments, and initial fees. Revenues from restaurants licensed toaffiliates and developmental licensees include a royalty based on apercent of sales, and generally include initial fees. Fees vary by typeof site, amount of Company investment, if any, and local businessconditions. These fees, along with occupancy and operating rights,are stipulated in franchise/license agreements that generally have20-year terms.
The business is managed as distinct geographic segments.Significant reportable segments include the United States ("U.S."),Europe, and Asia/Pacific, Middle East and Africa ("APMEA"). Inaddition, throughout this report we present “Other Countries &Corporate” that includes operations in Canada and Latin America, aswell as Corporate activities. The U.S., Europe and APMEA segmentsaccount for 32%, 39% and 23% of total revenues, respectively. TheUnited Kingdom ("U.K."), France and Germany, collectively, accountfor 51% of Europe’s revenues; and China, Australia and Japan (a50%-owned affiliate accounted for under the equity method),collectively, account for 56% of APMEA’s revenues. These six marketsalong with the U.S. and Canada are referred to as “major markets”throughout this report and comprise 70% of total revenues.
In analyzing business trends, management considers a variety ofperformance and financial measures, including
comparable sales and comparable guest count growth, Systemwidesales growth and returns.
▪ Constant currency results exclude the effects of foreign currencytranslation and are calculated by translating current year resultsat prior year average exchange rates. Management reviews andanalyzes business results in constant currencies and basescertain incentive compensation plans on these results becausewe believe this better represents the Company’s underlyingbusiness trends.
▪ Comparable sales and comparable guest counts are keyperformance indicators used within the retail industry and areindicative of acceptance of the Company’s initiatives as well aslocal economic and consumer trends. Increases or decreases incomparable sales and comparable guest counts represent thepercent change in sales and transactions, respectively, from thesame period in the prior year for all restaurants, whetheroperated by the Company or franchisees, in operation at leastthirteen months, including those temporarily closed. Some of thereasons restaurants may be temporarily closed includereimaging or remodeling, rebuilding, road construction andnatural disasters. Comparable sales exclude the impact ofcurrency translation. Comparable sales are driven by changes inguest counts and average check, which is affected by changesin pricing and product mix. Generally, the goal is to achieve abalanced contribution from both guest counts and average check.
McDonald’s reports on a calendar basis and therefore thecomparability of the same month, quarter and year with thecorresponding period of the prior year will be impacted by the mixof days. The number of weekdays and weekend days in a giventimeframe can have a positive or negative impact on comparablesales and guest counts. The Company refers to these impacts ascalendar shift/trading day adjustments. In addition, the timing ofholidays can impact comparable sales and guest counts. Theseimpacts vary geographically due to consumer spending patternsand have the greatest effect on monthly comparable sales andguest counts while the annual impacts are typically minimal.
▪ Systemwide sales include sales at all restaurants. Whilefranchised sales are not recorded as revenues by the Company,management believes the information is important inunderstanding the Company’s financial performance becausethese sales are the basis on which the Company calculates andrecords franchised revenues and are indicative of the financialhealth of the franchisee base.
▪ Return on incremental invested capital ("ROIIC") is a measurereviewed by management over one-year and three-year timeperiods to evaluate the overall profitability of the business units,the effectiveness of capital deployed and the future allocation ofcapital. The return is calculated by dividing the change inoperating income plus depreciation and amortization (numerator)by the cash used for investing activities (denominator), primarilycapital expenditures. The calculation uses a constant averageforeign exchange rate over the periods included in thecalculation.
STRATEGIC DIRECTION AND FINANCIAL PERFORMANCEThe strength of the alignment between the Company, its franchiseesand suppliers (collectively referred to as the "System") has been keyto McDonald's success. This business model enables McDonald's toconsistently deliver locally-relevant restaurant experiences tocustomers and be an integral part of the communities we serve. Inaddition, it facilitates our ability to identify, implement and scaleinnovative ideas that meet customers' changing needs andpreferences.
10 McDonald's Corporation 2012 Annual Report

McDonald's customer-focused Plan to Win ("Plan") provides acommon framework for our global business while allowing for localadaptation. Through the execution of multiple initiatives surroundingthe five pillars of our Plan—People, Products, Place, Price andPromotion—we have enhanced the restaurant experience forcustomers worldwide and grown global comparable sales and guestcounts in each of the last nine years. This Plan, combined withfinancial discipline, has delivered strong results for our shareholderssince its inception. To measure our performance as we continue tobuild the business, we have the following long-term, average annualconstant currency financial targets:
▪ Systemwide sales growth of 3% to 5%;
▪ Operating income growth of 6% to 7%;
▪ ROIIC in the high teens.
Prior to 2012, we exceeded each of these financial targets everyyear since the Plan's implementation in 2003, after adjusting for theloss in 2007 from the Latin America developmental licensetransaction. These targets have enabled us to make the best decisionsfor the long-term benefit of our shareholders, and we believe theyremain realistic and sustainable for a company of our size.
In 2012, Systemwide sales growth was 3% (5% in constantcurrencies), operating income growth was 1% (4% in constantcurrencies), one-year ROIIC was 15.4% and three-year ROIIC was28.6% (see reconciliation on page 24). Persistent global economicheadwinds, heightened competitive activity and inflationary costsimpacted results. In addition, planned strategic decisions, such as the2012 London Olympics sponsorship, investing in technology and thebiennial Worldwide Owner/Operator convention, also impactedresults.
In 2012, we continued to focus on customers' needs and remainedaligned on our Plan and the three global growth priorities of optimizingour menu, modernizing the customer experience, and broadeningaccessibility to our brand. We believe these priorities are relevant andactionable, and combined with our competitive advantages, will drivelong-term sustainable growth. Initiatives supporting these prioritiesresonated with customers and drove increases in global comparablesales and guest counts of 3.1% and 1.6%, respectively, despitechallenging economies and a relatively flat or declining InformalEating Out ("IEO") segment in most markets. In 2012, we continued togrow market share in the U.S., Europe and APMEA, amid a morecompetitive global environment and a slight decline in our fourthquarter comparable guest counts.
Comparable sales are impacted by guest counts, product mixshifts and menu pricing. Specific menu pricing actions across oursystem reflect local market conditions as well as other factors, notablyfood away from home and food at home inflation indices. In ourCompany-operated restaurants, we manage menu board prices toensure value at all price points, increase profitability and mitigateinflation, all while trying to grow guest counts. In order to accomplishthese objectives, we utilize a strategic pricing tool that balances priceand product mix. Franchisees also have access to, and many utilize,this strategic pricing tool. In general, we believe franchisees employ asimilar pricing strategy. We look to optimize product mix by utilizing amenu with entry-point value, core, premium and promotionalofferings. We also introduce new products to meet customers' needs,which can expand average check and increase guest counts. In2012, average prices increased at Company-operated restaurants ineach area of the world, although increases varied by market andregion.
U.S.In the U.S., comparable sales increased for the tenth consecutiveyear, rising 3.3% in 2012, while comparable guest counts rose
1.9%. These results were achieved despite only modest growth in theIEO segment and heightened competitive activity. In the second halfof the year, we experienced softer performance; therefore, weadjusted our plans to re-energize our all-day everyday value offeringswhile providing the menu variety customers expect from McDonald's.
In 2012, we continued to highlight beverages, value, breakfast,and our classic core favorites. We expanded our McCafé beverageofferings with the Chocolate Chip Frappé and Cherry Berry Chiller.Limited-time offers, such as Chicken McBites and the Cheddar BaconOnion premium sandwiches, complemented our core menu offerings.
Modernizing the customer experience continued through ourmajor remodeling initiative, which provides contemporary restaurantdesigns and retailing efforts. The enhanced appearance andfunctionality of our restaurants deliver a more relevant experience forour customers. Over 900 existing restaurants were remodeled during2012 with the majority adding drive-thru capacity to capture additionalguest counts.
We broadened the accessibility of our convenient locationsthrough extended hours and efficient drive-thru service. More thanhalf of our restaurants use some form of multiple order points tomaximize drive-thru capacity, including 1,500 with hand-held ordertakers to help improve customer service times. To further build on ourcompetitive advantage, we focused on operations excellenceinitiatives to drive customer satisfaction as we strive to deliver fast,accurate and friendly service with every order.
EuropeIn Europe, comparable sales rose 2.4%, marking the ninthconsecutive year of comparable sales increases, while guest countsdeclined 0.5%. While low consumer confidence continues tonegatively affect overall retail sales and the IEO segment, weoutperformed the market and grew market share. Major contributors tocomparable sales were the U.K. and Russia. Despite ongoingeconomic challenges, the segment's priority remains growing theoverall business by balancing a strong focus on our unique valueofferings, ongoing premium product innovation, and new products.
Europe continued to see the benefit of providing a relevant,contemporary customer experience and completed almost 750restaurant reimages. By the end of 2012, over 90% of restaurantinteriors and approximately 50% of exteriors had been reimaged.Europe also invested in a roll-out of a new point-of-sale system, whichallows us to continue to expand our menu offerings and improve orderaccuracy. By the end of 2012, over 2,200 restaurants had deployedthis system.
We expanded our coffee business and have over 1,600 McCafélocations, which in Europe are generally separate areas inside therestaurants that serve specialty coffees, desserts and snacks. Inaddition, we increased our accessibility and convenience withextended operating hours, self-order kiosks, optimized drive-thrus,and opened over 250 new restaurants.
APMEAIn APMEA, comparable sales rose 1.4% and comparable guest countsrose 2.2%, despite a challenging year of economic pressures, partlydue to Japan's uneven recovery and China's slower economic growth.Positive performance was driven by China, Australia and many othermarkets. Unique value platforms, great tasting premium menuselections, locally-relevant menu variety, and convenience andservice enhancements differentiated the McDonald's experience.Australia launched the “Loose Change Menu,” which is a brandedaffordability menu, while China focused on breakfast, lunch, anddinner value platforms. Value initiatives were balanced with mid-tieroffers, such as Bubble Tea in China, and premium limited-time offers,such as the Serious Lamb Burger and Wrap in Australia.
McDonald's Corporation 2012 Annual Report 11

Our breakfast business has expanded and is offered inapproximately 75% of APMEA restaurants. Desserts continued to playa meaningful role, particularly in China, where we remain one of thelargest ice cream retailers.
We opened over 750 new restaurants in APMEA, of which over250 were in China, where we have made significant progress towardour goal of 2,000 restaurants by the end of 2013. Nearly two-thirds ofAPMEA restaurants are offering some form of extended operatinghours and over 5,400 restaurants are open 24 hours. Delivery isoffered in many APMEA markets and is now available in over 1,700restaurants, including nearly 550 in China.
Since Japan's natural disaster in March of 2011, the economyremains a challenge. Despite a declining IEO segment, McDonald's isgaining market share through a value platform of 100, 250, and 500YEN offerings, and family sharing boxes, such as 15-piece ChickenMcNuggets. Japan augmented its value platform with strategiccouponing to encourage add-on and Extra Value Meal purchases.
ConsolidatedGlobally, our approach to offering affordable value to our customers iscomplemented by a focus on driving operating efficiencies andleveraging our scale, supply chain infrastructure and our suppliers'risk management practices to manage costs. We were able to executeour strategies in every area of the world, grow comparable sales andcontrol selling, general and administrative expenses. However, in2012 we faced top- and bottom-line pressures, some a result ofplanned strategic decisions, and others driven by the externalenvironment. As a result, combined operating margin (operatingincome as a percent of total revenues) was 31.2% in 2012, down 0.4percentage points as compared to 2011.
In 2012, cash from operations was nearly $7.0 billion. Oursubstantial cash flow, strong credit rating and continued access tocredit provide us flexibility to fund capital expenditures as well asreturn cash to shareholders. Capital expenditures of approximately$3.0 billion were invested in our business primarily to reimageexisting restaurants and open new restaurants. Across the System,over 1,400 restaurants were opened and about 2,400 existinglocations were reimaged. In addition, we returned $5.5 billion toshareholders consisting of $2.9 billion in dividends and $2.6 billion inshare repurchases.
Cash from operations continues to benefit from our heavilyfranchised business model as the rent and royalty income receivedfrom owner/operators is a stable revenue stream that has relativelylow costs. In addition, the franchise business model is less capitalintensive than the Company-owned model. We believe locally-ownedand operated restaurants maximize brand performance and are at thecore of our competitive advantages, making McDonald's not just aglobal brand but also a locally– relevant one.
HIGHLIGHTS FROM THE YEAR INCLUDED:▪ Comparable sales grew 3.1% and guest counts rose 1.6%,
building on 2011 increases of 5.6% and 3.7%, respectively.
▪ Revenues increased 2% (5% in constant currencies).
▪ Operating income increased 1% (4% in constant currencies).
▪ Diluted earnings per share was $5.36, an increase of 2% (5% inconstant currencies).
▪ Cash provided by operations was nearly $7.0 billion.
▪ One-year ROIIC was 15.4% and three-year ROIIC was 28.6% forthe period ended December 31, 2012.
▪ The Company increased the quarterly cash dividend per share10% to $0.77 for the fourth quarter—bringing our currentannual dividend to $3.08 per share.
▪ The Company returned $5.5 billion to shareholders throughdividends and share repurchases.
OUTLOOK FOR 2013We will continue to build the business in 2013 and beyond byenhancing the customer experience across all pillars of our Plan andour three global growth priorities to optimize our menu, modernize thecustomer experience and broaden accessibility to our brand. Weremain focused on seizing the long-term opportunities in the $1 trillionIEO segment by leveraging our competitive advantages. We have abrand advantage in convenience, menu variety and value, aresilient business model, and the experience and alignmentthroughout the McDonald's System to navigate the currentenvironment.
Our number one priority continues to be satisfying our customers'needs by serving great-tasting, high-quality food in contemporaryrestaurants. This focus on our customers is particularly critical in thisuncertain environment, where ongoing volatility continues tonegatively impact consumer sentiment and spending. We anticipate acontinued flat to declining IEO segment in many of the markets wherewe operate. Growing market share will remain our focus to attainsustainable and profitable long-term growth.
We will highlight promotions of our core menu favorites, whilestrategically expanding our menu with relevant new offerings acrossall dayparts, including premium products that can deliver a higheraverage check. We will place an even greater emphasis on scalingsuccess quickly around the globe. For example, in many markets wewill expand our innovative McBites line-up, introduce existingproducts like our blended ice beverages and large McWraps into newmarkets, and offer even more of the unique, flavor-based promotionalfood events that have been successful. We will emphasize ourdayparts—like breakfast and extended hours—that are still growingglobally in both established and emerging markets. We will enhancethe customer experience by continuing to reimage our buildinginteriors and exteriors and by providing our restaurant teams with theappropriate tools, training, and technology. The accessibility effortswill include increasing the level and variety of conveniences providedto our customers through new restaurant openings, extendedoperating hours, stronger value platforms, and faster, more accurateservice through innovative order taking. With operational andfinancial discipline, we will execute these priorities to increaseMcDonald's brand relevance.
We will continue to build customer trust through our commitmentto sustainability—including nutrition and well-being, a sustainablesupply chain, environmental responsibility, employee experience,and the community.
U.S.In 2013, the U.S. business will focus on driving sales and guestcounts by enhancing the entire customer experience through thepillars of the Plan and the three global priorities. Our menu pipelineis more balanced in 2013, with a continued focus on great taste,quality ingredients and variety. We will satisfy our customers' needswith the food they crave by balancing core favorites with limited timeoffers and innovative new products across the menu. Menu news willbe augmented with brand messages that highlight our quality foodingredients, efforts around promoting children's well-being andcommunity involvement. We will enhance our Dollar Menu andintroduce new products to highlight McDonald's value at every pricepoint, across all menu categories. We are continuing our majorremodel program by updating about 800 locations in 2013. At the sametime, we are continuing to improve
12 McDonald's Corporation 2012 Annual Report

restaurant operations through appropriate staffing and a focus onfriendly, accurate service as well as innovative order taking. Inaddition, we will increase the number of restaurants that operate 24hours a day and strive to be our customers' favorite eating-outdestination.
EuropeIn Europe, we see growth opportunities in breakfast, core menu items,beverages, and extended hours. Our business plans are focused onbuilding market share by emphasizing value across all dayparts andnew restaurant growth. In some markets, our value offerings willevolve from a low-end entry price to multiple entry prices across ourmenu. This value menu evolution is intended to grow guest countswith compelling affordability and enhanced trade-up opportunitiesthrough an extended range of options. In 2013, we will reimageapproximately 450 restaurants as we progress towards our goal ofhaving 100% of our interiors and over 85% of our exteriors reimagedby the end of 2015. We will also open nearly 300 restaurants. We willleverage production and service enhancements by optimizing kitchenplatforms and accelerating the deployment of technologies, such asupdating the point-of-sale system and rolling out multiple order pointsvia self-order kiosks, hand-held order devices and side-by-side drive-thrus. These initiatives will enhance the customer experience, helpdrive guest counts and improve labor efficiency. We will also continueto reduce our impact on the environment with energy managementtools. Despite the near-term headwinds due to economic uncertaintyand government-initiated austerity measures implemented in manycountries, Europe offers significant long-term opportunity, and we arewell-positioned to capitalize on this segment's potential.
APMEAIn APMEA, we will advance efforts to become our customers' favoriteplace and way to eat and drink by reinvigorating our long-term valueplatforms, accelerating growth at breakfast, and focusing on menuvariety and convenience. Value will continue to be a key strategy andgrowth driver to build traffic with a focus across the menu at alldayparts, combined with trade-up strategies to build average check.For example, Australia will evolve its Loose Change Menu, andJapan will focus on building average check through trade-upopportunities with promotional products and a focus on breakfast. Weplan to grow breakfast traffic in APMEA through increased marketingefforts, value, accessibility and operations excellence. The marketswill continue to balance core and limited-time offers and will execute aseries of exciting food events that celebrate our core menu and thesegment's all-time favorite product offerings. At the same time, we willcontinue to leverage the diversity of the segment to identify and scalenew products and platforms. Convenience initiatives will focus onoptimizing our drive-thru and delivery services through operationefficiencies and online capabilities. In China, for example, a newweb-ordering system will enhance the customer experience and drivenew demand through delivery. We will grow our business by openingapproximately 850 new restaurants and reimaging about 225 existingrestaurants while elevating our focus on service and operations. InChina, we will continue to build a foundation for long-term growth byopening over 300 restaurants, consistent with our goal of reaching2,000 restaurants by the end of 2013.
ConsolidatedGlobally, we will maintain financial discipline by effectivelymanaging spending. In making capital allocation decisions, our goal isto make investments that elevate the McDonald's experience anddrive sustainable growth in sales and market share. We focus onmarkets that generate acceptable returns or have opportunities forlong-term growth. We remain committed to returning all of our freecash flow (cash from operations less
capital expenditures) to shareholders over the long-term via dividendsand share repurchases.
McDonald's does not provide specific guidance on dilutedearnings per share. The following information is provided to assist inanalyzing the Company's results:
▪ Changes in Systemwide sales are driven by comparable salesand net restaurant unit expansion. The Company expects netrestaurant additions to add approximately 2.5 percentage pointsto 2013 Systemwide sales growth (in constant currencies), mostof which will be due to the 1,135 net traditional restaurantsadded in 2012.
▪ The Company does not generally provide specific guidance onchanges in comparable sales. However, as a perspective,assuming no change in cost structure, a 1 percentage pointincrease in comparable sales for either the U.S. or Europe wouldincrease annual diluted earnings per share by about 4 cents.
▪ With about 75% of McDonald's grocery bill comprised of 10different commodities, a basket of goods approach is the mostcomprehensive way to look at the Company's commodity costs.For the full year 2013, the total basket of goods cost is expected toincrease 1.5-2.5% in the U.S. and 3-4% in Europe.
▪ The Company expects full-year 2013 selling, general andadministrative expenses to increase approximately 2-3% inconstant currencies, with fluctuations expected between thequarters.
▪ Based on current interest and foreign currency exchange rates,the Company expects interest expense for the full year 2013 toincrease approximately 4-6% compared with 2012.
▪ A significant part of the Company's operating income isgenerated outside the U.S., and about 35% of its total debt isdenominated in foreign currencies. Accordingly, earnings areaffected by changes in foreign currency exchange rates,particularly the Euro, British Pound, Australian Dollar andCanadian Dollar. Collectively, these currencies representapproximately 65% of the Company's operating income outsidethe U.S. If all four of these currencies moved by 10% in thesame direction, the Company's annual diluted earnings pershare would change by about 25 cents.
▪ The Company expects the effective income tax rate for the full-year 2013 to be 31% to 33%. Some volatility may be experiencedbetween the quarters resulting in a quarterly tax rate that isoutside the annual range. As a result of the American TaxpayerRelief Act of 2012, our income tax provision for the first quarter of2013 will include a tax benefit of about $50 million reflecting theretroactive impact of certain tax benefits, which may result in afirst quarter effective tax rate below the full year range.
▪ The Company expects capital expenditures for 2013 to beapproximately $3.2 billion. Over half of this amount will be usedto open new restaurants. The Company expects to open between1,500 - 1,600 restaurants including about 500 restaurants inaffiliated and developmental licensee markets, such as Japanand Latin America, where the Company does not fund anycapital expenditures. The Company expects net additions ofbetween 1,200 - 1,300 traditional restaurants. The remainingcapital will be used to reinvest in existing locations, in partthrough reimaging. More than 1,600 restaurants worldwide areexpected to be reimaged, including locations in affiliated anddevelopmental licensee markets that require no capitalinvestment from the Company.
McDonald's Corporation 2012 Annual Report 13

Consolidated Operating Results
Operating results 2012 2011 2010
Dollars in millions, except per share data Amount Increase/
(decrease) Amount Increase/
(decrease) AmountRevenues Sales by Company-operated restaurants $18,603 2% $ 18,293 13% $16,233Revenues from franchised restaurants 8,964 3 8,713 11 7,842
Total revenues 27,567 2 27,006 12 24,075Operating costs and expenses Company-operated restaurant expenses 15,224 3 14,838 14 13,060Franchised restaurants-occupancy expenses 1,527 3 1,481 8 1,378Selling, general & administrative expenses 2,455 3 2,394 3 2,333Impairment and other charges (credits), net 8 nm (4) nm 29Other operating (income) expense, net (252) ( 8) (233) (18) (198)
Total operating costs and expenses 18,962 3 18,476 11 16,602Operating income 8,605 1 8,530 14 7,473Interest expense 517 5 493 9 451Nonoperating (income) expense, net 9 (64) 25 13 22Income before provision for income taxes 8,079 1 8,012 14 7,000Provision for income taxes 2,614 4 2,509 22 2,054Net income $ 5,465 ( 1% ) $ 5,503 11% $ 4,946Earnings per common share—diluted $ 5.36 2% $ 5.27 15% $ 4.58Weighted-average common shares outstanding—diluted 1,020.2 ( 2% ) 1,044.9 (3%) 1,080.3nm Not meaningful
IMPACT OF FOREIGN CURRENCY TRANSLATION ON REPORTED RESULTSWhile changes in foreign currency exchange rates affect reported results, McDonald’s mitigates exposures, where practical, by financing in localcurrencies, hedging certain foreign-denominated cash flows, and purchasing goods and services in local currencies.
In 2012, foreign currency translation had a negative impact on consolidated operating results primarily due to the weaker Euro, along withmost other currencies. In 2011, foreign currency translation had a positive impact on consolidated operating results driven by the stronger Euroand Australian Dollar, as well as most other currencies. In 2010, foreign currency translation had a positive impact on consolidated operatingresults driven by stronger global currencies, primarily the Australian Dollar and Canadian Dollar, partly offset by the weaker Euro.
Impact of foreign currency translation on reported results
Reported amount Currency translation
benefit/(cost) In millions, except per share data 2012 2011 2010 2012 2011 2010Revenues $ 27,567 $ 27,006 $24,075 $ (726) $ 944 $ 188Company-operated margins 3,379 3,455 3,173 (97) 134 35Franchised margins 7,437 7,232 6,464 (204) 213 (14)
Selling, general & administrative expenses 2,455 2,394 2,333 40 (55) (12)
Operating income 8,605 8,530 7,473 (261) 301 13Net income 5,465 5,503 4,946 (178) 195 13Earnings per common share—diluted 5.36 5.27 4.58 (0.17) 0.19 0.01
14 McDonald's Corporation 2012 Annual Report

NET INCOME AND DILUTED EARNINGS PER COMMON SHAREIn 2012, net income decreased 1% (increased 3% in constantcurrencies) to $5.5 billion and diluted earnings per common shareincreased 2% (5% in constant currencies) to $5.36. Foreign currencytranslation had a negative impact of $0.17 per share on dilutedearnings per share. Net income and diluted earnings per sharegrowth in constant currencies were positively impacted by growth infranchised margin dollars, partly offset by a higher effective incometax rate and higher selling, general and administrative expenses. Adecrease of 2% in diluted weighted average shares outstanding alsocontributed to the diluted earnings per share growth in 2012.
In 2011, net income increased 11% (7% in constant currencies) to$5.5 billion and diluted earnings per common share increased
15% (11% in constant currencies) to $5.27. Foreign currencytranslation had a positive impact of $0.19 per share on dilutedearnings per share. Net income and diluted earnings per sharegrowth in 2011 in constant currencies were positively impacted bygrowth in franchised margin dollars, and to a lesser extent, Company-operated margin dollars, partly offset by a higher effective income taxrate. A decrease of 3% in diluted weighted average sharesoutstanding also contributed to the diluted earnings per share growthin 2011.
The Company repurchased 28.1 million shares of its stock for $2.6billion in 2012 and 41.9 million shares of its stock for $3.4 billion in2011, driving reductions in weighted average shares outstanding on adiluted basis in both periods.
REVENUESThe Company’s revenues consist of sales by Company-operated restaurants and fees from restaurants operated by franchisees. Revenues fromconventional franchised restaurants include rent and royalties based on a percent of sales along with minimum rent payments, and initial fees.Revenues from franchised restaurants that are licensed to foreign affiliates and developmental licensees include a royalty based on a percent ofsales, and generally include initial fees.
In 2012 and 2011, constant currency revenue growth was driven primarily by positive comparable sales as well as expansion.
Revenues
Amount Increase/(decrease) Increase/(decrease) excluding
currency translation Dollars in millions 2012 2011 2010 2012 2011 2012 2011Company-operated sales: U.S. $ 4,530 $ 4,433 $ 4,229 2% 5% 2% 5%Europe 7,850 7,852 6,932 0 13 6 8
APMEA 5,350 5,061 4,297 6 18 5 11Other Countries & Corporate 873 947 775 ( 8) 22 (7) 17
Total $18,603 $ 18,293 $16,233 2% 13% 4% 8%Franchised revenues: U.S. $ 4,284 $ 4,096 $ 3,883 5% 5% 5% 5%Europe 2,977 3,034 2,637 ( 2) 15 5 9
APMEA 1,041 958 769 9 25 9 14Other Countries & Corporate 662 625 553 6 13 11 8
Total $ 8,964 $ 8,713 $ 7,842 3% 11% 6% 8%Total revenues: U.S. $ 8,814 $ 8,529 $ 8,112 3% 5% 3% 5%Europe 10,827 10,886 9,569 ( 1) 14 6 8
APMEA 6,391 6,019 5,066 6 19 6 11Other Countries & Corporate 1,535 1,572 1,328 ( 2) 18 0 14
Total $ 27,567 $27,006 $24,075 2% 12% 5% 8%
In the U.S., the increase in revenues in 2012 was primarily due topositive comparable sales. Everyday value offerings, menu varietyand the enhanced customer experience due to reimaging contributedpositively to results, despite broad competitive activity. Revenues in2011 were positively impacted by the ongoing appeal of our iconic coreproducts and the success of new products, including additions to theMcCafé beverage line, as well as continued focus on everyday value,convenience and modernizing the customer experience.
Europe’s constant currency increases in revenues in 2012 and2011 were primarily driven by positive comparable sales in the U.K.and Russia, the segment's two largest Company-operated restaurantmarkets, as well as expansion in Russia. Revenues in 2011 alsobenefited from comparable sales increases in France and Germany.
In APMEA, the constant currency increase in revenues in 2012was driven by positive comparable sales in China, Australia andmany other markets. The constant currency increase in revenues in2011 was primarily driven by comparable sales increases in Chinaand most other markets. Expansion, primarily in China, alsocontributed to revenue growth in both periods.
McDonald's Corporation 2012 Annual Report 15

The following tables present comparable sales, comparable guest counts and Systemwide sales increases/(decreases):
Comparable sales and guest count increases/(decreases) 2012 2011 2010
Sales Guest
Counts Sales Guest
Counts Sales Guest
CountsU.S. 3.3% 1.9% 4.8% 3.3% 3.8% 5.3%Europe 2.4 (0.5) 5.9 3.4 4.4 2.7APMEA 1.4 2.2 4.7 4.3 6.0 4.9Other Countries & Corporate 7.7 3.0 10.1 4.5 11.3 8.3
Total 3.1% 1.6% 5.6% 3.7% 5.0% 4.9%
Systemwide sales increases/(decreases)
Excluding currencytranslation
2012 2011 2012 2011U.S. 4% 5% 4% 5%Europe ( 2) 14 5 9
APMEA 5 16 6 7Other Countries & Corporate 4 17 10 12
Total 3% 11% 5% 7%
Franchised sales are not recorded as revenues by the Company, but are the basis on which the Company calculates and records franchisedrevenues and are indicative of the financial health of the franchisee base. The following table presents franchised sales and the relatedincreases/(decreases):
Franchised sales
Amount Increase/(decrease) Increase excluding
currency translation Dollars in millions 2012 2011 2010 2012 2011 2012 2011U.S. $ 31,063 $ 29,739 $ 28,166 4% 6% 4% 6%Europe 16,857 17,243 15,049 ( 2) 15 5 9
APMEA 13,723 13,041 11,373 5 15 6 6Other Countries & Corporate 8,044 7,625 6,559 5 16 1 2 12
Total $ 69,687 $67,648 $61,147 3% 11% 6% 7% RESTAURANT MARGINS▪ Franchised marginsFranchised margin dollars represent revenues from franchisedrestaurants less the Company’s occupancy costs (rent anddepreciation) associated with those sites. Franchised margin dollarsrepresented about two-thirds of the combined restaurant margins in2012, 2011 and 2010. Franchised margin dollars increased $205million or 3% (6% in constant currencies) in 2012 and $768 million or12% (9% in constant currencies) in 2011. Positive comparable saleswere the primary driver of the constant currency growth in franchisedmargin dollars in both years.
Franchised margins
In millions 2012 2011 2010U.S. $ 3,594 $ 3,436 $ 3,239Europe 2,352 2,400 2,063APMEA 924 858 686Other Countries & Corporate 567 538 476
Total $ 7,437 $ 7,232 $ 6,464 Percent of revenues U.S. 83.9% 83.9% 83.4%Europe 79.0 79.1 78.2APMEA 88.8 89.5 89.3Other Countries & Corporate 85.6 86.1 86.0
Total 83.0% 83.0% 82.4%
In the U.S., the franchised margin percent was flat in 2012 ascomparable sales performance was offset by higher depreciationrelated to reimaging. The increase in 2011 was primarily due topositive comparable sales, partly offset by higher occupancyexpenses.
In Europe, the franchised margin percent decrease in 2012reflected positive comparable sales and higher occupancy costs. Theincrease in 2011 was primarily due to positive comparable sales,partly offset by higher occupancy expenses.

16 McDonald's Corporation 2012 Annual Report
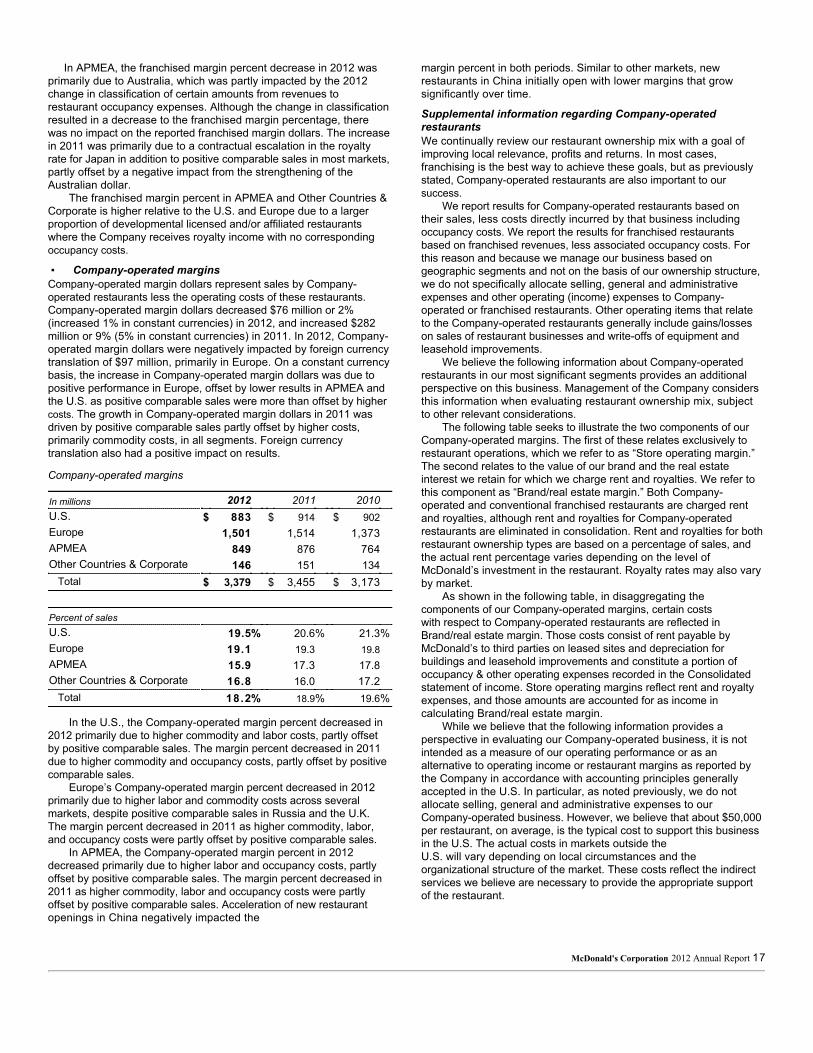
In APMEA, the franchised margin percent decrease in 2012 wasprimarily due to Australia, which was partly impacted by the 2012change in classification of certain amounts from revenues torestaurant occupancy expenses. Although the change in classificationresulted in a decrease to the franchised margin percentage, therewas no impact on the reported franchised margin dollars. The increasein 2011 was primarily due to a contractual escalation in the royaltyrate for Japan in addition to positive comparable sales in most markets,partly offset by a negative impact from the strengthening of theAustralian dollar.
The franchised margin percent in APMEA and Other Countries &Corporate is higher relative to the U.S. and Europe due to a largerproportion of developmental licensed and/or affiliated restaurantswhere the Company receives royalty income with no correspondingoccupancy costs.
▪ Company-operated marginsCompany-operated margin dollars represent sales by Company-operated restaurants less the operating costs of these restaurants.Company-operated margin dollars decreased $76 million or 2%(increased 1% in constant currencies) in 2012, and increased $282million or 9% (5% in constant currencies) in 2011. In 2012, Company-operated margin dollars were negatively impacted by foreign currencytranslation of $97 million, primarily in Europe. On a constant currencybasis, the increase in Company-operated margin dollars was due topositive performance in Europe, offset by lower results in APMEA andthe U.S. as positive comparable sales were more than offset by highercosts. The growth in Company-operated margin dollars in 2011 wasdriven by positive comparable sales partly offset by higher costs,primarily commodity costs, in all segments. Foreign currencytranslation also had a positive impact on results.
Company-operated margins
In millions 2012 2011 2010U.S. $ 883 $ 914 $ 902Europe 1,501 1,514 1,373APMEA 849 876 764Other Countries & Corporate 146 151 134
Total $ 3,379 $ 3,455 $ 3,173 Percent of sales U.S. 19.5% 20.6% 21.3%Europe 19.1 19.3 19.8APMEA 15.9 17.3 17.8Other Countries & Corporate 16.8 16.0 17.2
Total 18.2% 18.9% 19.6%
In the U.S., the Company-operated margin percent decreased in2012 primarily due to higher commodity and labor costs, partly offsetby positive comparable sales. The margin percent decreased in 2011due to higher commodity and occupancy costs, partly offset by positivecomparable sales.
Europe’s Company-operated margin percent decreased in 2012primarily due to higher labor and commodity costs across severalmarkets, despite positive comparable sales in Russia and the U.K.The margin percent decreased in 2011 as higher commodity, labor,and occupancy costs were partly offset by positive comparable sales.
In APMEA, the Company-operated margin percent in 2012decreased primarily due to higher labor and occupancy costs, partlyoffset by positive comparable sales. The margin percent decreased in2011 as higher commodity, labor and occupancy costs were partlyoffset by positive comparable sales. Acceleration of new restaurantopenings in China negatively impacted the
margin percent in both periods. Similar to other markets, newrestaurants in China initially open with lower margins that growsignificantly over time.
Supplemental information regarding Company-operatedrestaurantsWe continually review our restaurant ownership mix with a goal ofimproving local relevance, profits and returns. In most cases,franchising is the best way to achieve these goals, but as previouslystated, Company-operated restaurants are also important to oursuccess.
We report results for Company-operated restaurants based ontheir sales, less costs directly incurred by that business includingoccupancy costs. We report the results for franchised restaurantsbased on franchised revenues, less associated occupancy costs. Forthis reason and because we manage our business based ongeographic segments and not on the basis of our ownership structure,we do not specifically allocate selling, general and administrativeexpenses and other operating (income) expenses to Company-operated or franchised restaurants. Other operating items that relateto the Company-operated restaurants generally include gains/losseson sales of restaurant businesses and write-offs of equipment andleasehold improvements.
We believe the following information about Company-operatedrestaurants in our most significant segments provides an additionalperspective on this business. Management of the Company considersthis information when evaluating restaurant ownership mix, subjectto other relevant considerations.
The following table seeks to illustrate the two components of ourCompany-operated margins. The first of these relates exclusively torestaurant operations, which we refer to as “Store operating margin.”The second relates to the value of our brand and the real estateinterest we retain for which we charge rent and royalties. We refer tothis component as “Brand/real estate margin.” Both Company-operated and conventional franchised restaurants are charged rentand royalties, although rent and royalties for Company-operatedrestaurants are eliminated in consolidation. Rent and royalties for bothrestaurant ownership types are based on a percentage of sales, andthe actual rent percentage varies depending on the level ofMcDonald’s investment in the restaurant. Royalty rates may also varyby market.
As shown in the following table, in disaggregating thecomponents of our Company-operated margins, certain costswith respect to Company-operated restaurants are reflected inBrand/real estate margin. Those costs consist of rent payable byMcDonald’s to third parties on leased sites and depreciation forbuildings and leasehold improvements and constitute a portion ofoccupancy & other operating expenses recorded in the Consolidatedstatement of income. Store operating margins reflect rent and royaltyexpenses, and those amounts are accounted for as income incalculating Brand/real estate margin.
While we believe that the following information provides aperspective in evaluating our Company-operated business, it is notintended as a measure of our operating performance or as analternative to operating income or restaurant margins as reported bythe Company in accordance with accounting principles generallyaccepted in the U.S. In particular, as noted previously, we do notallocate selling, general and administrative expenses to ourCompany-operated business. However, we believe that about $50,000per restaurant, on average, is the typical cost to support this businessin the U.S. The actual costs in markets outside theU.S. will vary depending on local circumstances and theorganizational structure of the market. These costs reflect the indirectservices we believe are necessary to provide the appropriate supportof the restaurant.
McDonald's Corporation 2012 Annual Report 17

U.S. Europe Dollars in millions 2012 2011 2010 2012 2011 2010As reported Number of Company-operated restaurants at year end
1,552 1,552 1,550 2,017 1,985 2,005Sales by Company-operated restaurants $ 4,530 $4,433 $4,229 $ 7,850 $7,852 $ 6,932Company-operated margin $ 883 $ 914 $ 902 $1,501 $1,514 $1,373Store operating margin Company-operated margin $ 883 $ 914 $ 902 $1,501 $1,514 $1,373Plus:
Outside rent expense (1) 59 56 60 245 242 223 Depreciation—buildings & leasehold improvements (1) 77 69 65 123 118 105
Less: Rent & royalties (2) (668) (651) (619) (1,603) (1,598) (1,409)
Store operating margin $ 351 $ 388 $ 408 $ 266 $ 276 $ 292Brand/real estate margin Rent & royalties (2) $ 668 $ 651 $ 619 $ 1,603 $ 1,598 $ 1,409Less:
Outside rent expense (1) (59) (56) (60) (245) (242) (223)
Depreciation—buildings & leasehold improvements (1)
(77) (69) (65) (123) (118) (105)
Brand/real estate margin $ 532 $ 526 $ 494 $1,235 $1,238 $ 1,081(1) Represents certain costs recorded as occupancy & other operating expenses in the Consolidated statement of income – rent payable by McDonald’s to third parties
on leased sites and depreciation for buildings and leasehold improvements. This adjustment is made to reflect these occupancy costs in Brand/real estate margin.The relative percentage of sites that are owned versus leased varies by country.
(2) Reflects average Company-operated rent and royalties (as a percent of sales: U.S.: 2012 – 14.7%; 2011 – 14.7%; 2010 – 14.6%; Europe: 2012 – 20.4%; 2011 –20.4%; 2010 – 20.3%). This adjustment is made to reflect expense in Store operating margin and income in Brand/real estate margin. Countries within Europe havevarying economic profiles and a wide range of rent and royalty rates as a percentage of sales.
SELLING, GENERAL & ADMINISTRATIVE EXPENSESConsolidated selling, general and administrative expenses increased 3% (4% in constant currencies) in 2012 and increased 3% (flat in constantcurrencies) in 2011. The growth rate for 2012 was primarily due to higher employee costs, the 2012 London Olympics sponsorship, highertechnology related costs and the 2012 Worldwide Owner/Operator Convention, partly offset by lower incentive-based compensation. The growthrate for 2011 was flat as higher employee and other costs were offset by lower incentive-based compensation and costs in 2010 related to theVancouver Olympics and the Company’s 2010 Worldwide Owner/Operator Convention.
Selling, general & administrative expenses
Amount Increase/(decrease)
Increase/(decrease)excluding currency
translation Dollars in millions 2012 2011 2010 2012 2011 2012 2011U.S. $ 782 $ 779 $ 781 0% 0% 0% 0%Europe 695 699 653 ( 1) 7 5 2APMEA 353 341 306 4 12 3 5Other Countries & Corporate (1) 625 575 593 9 (3) 9 (4)
Total $2,455 $2,394 $2,333 3% 3% 4% 0%(1) Included in Other Countries & Corporate are home office support costs in areas such as facilities, finance, human resources, information technology, legal, marketing,
restaurant operations, supply chain and training.
Selling, general and administrative expenses as a percent of revenues were 8.9% in 2012 and 2011, and 9.7% in 2010. Selling, general andadministrative expenses as a percent of Systemwide sales were 2.8% in 2012 and 2011, and 3.0% in 2010. Management believes that analyzingselling, general and administrative expenses as a percent of Systemwide sales, as well as revenues, is meaningful because these costs areincurred to support the overall McDonald's business.
18 McDonald's Corporation 2012 Annual Report

IMPAIRMENT AND OTHER CHARGES (CREDITS), NET
Impairment and other charges (credits), net
In millions 2012 2011 2010 Europe $ 7 $ 1APMEA $ (4) 49Other Countries & Corporate 1 (21)
Total $ 8 $ (4) $ 29
In 2010, the Company recorded expense of $29 million primarilyrelated to its share of restaurant closing costs in McDonald’s Japan inconjunction with the strategic review of the market’s restaurantportfolio, partly offset by income related to the resolution of certainliabilities retained in connection with the 2007 Latin Americadevelopmental license transaction.
OTHER OPERATING (INCOME) EXPENSE, NET
Other operating (income) expense, net
In millions 2012 2011 2010Gains on sales of restaurantbusinesses $ (152) $ (82) $ (79)
Equity in earnings of unconsolidated affiliates (144) (178) (164)
Asset dispositions and other expense 44 27 45Total $ (252) $ (233) $ (198)
▪ Gains on sales of restaurant businessesGains on sales of restaurant businesses include gains from sales ofCompany-operated restaurants. The Company’s purchases and salesof businesses with its franchisees are aimed at achieving an optimalownership mix in each market. Resulting gains or losses
are recorded in operating income because the transactions are arecurring part of our business. Gains on sales of restaurantbusinesses increased in 2012 due primarily to sales of restaurants inChina to developmental licensees, as well as sales of restaurants inEurope and Canada.
▪ Equity in earnings of unconsolidated affiliatesUnconsolidated affiliates and partnerships are businesses in whichthe Company actively participates, but does not control. TheCompany records equity in earnings from these entities representingMcDonald’s share of results. For foreign affiliated markets—primarilyJapan—results are reported after interest expense and income taxes.McDonald’s share of results for partnerships in certain consolidatedmarkets such as the U.S. is reported before income taxes. Thesepartnership restaurants are operated under conventional franchisearrangements and, therefore, are classified as conventionalfranchised restaurants. Equity in earnings of unconsolidated affiliatesdecreased in 2012 due to lower operating results, primarily in Japan.Results in 2011 reflected a benefit from stronger foreign currencies,partly offset by the decline in the number of unconsolidatedpartnerships in the U.S.
▪ Asset dispositions and other expenseAsset dispositions and other expense consists of gains or losses onexcess property and other asset dispositions, provisions for restaurantclosings and uncollectible receivables, asset write-offs due torestaurant reinvestment, and other miscellaneous income andexpenses. Asset dispositions and other expense increased in 2012primarily due to lower gains on unconsolidated partnershipdissolutions in the U.S. Results in 2011 reflected higher gains onunconsolidated partnership dissolutions in the U.S.
OPERATING INCOME
Operating income
Amount Increase/(decrease) Increase excluding
currency translation Dollars in millions 2012 2011 2010 2012 2011 2012 2011U.S. $3,751 $3,666 $ 3,446 2% 6% 2% 6%Europe 3,196 3,227 2,797 ( 1) 15 6 10APMEA 1,566 1,526 1,200 3 27 3 17Other Countries & Corporate 92 111 30 (17) nm 9 nm
Total $8,605 $8,530 $7,473 1% 14% 4% 10%nm Not meaningful
In the U.S., results for 2012 increased due to higher franchisedmargin dollars, partly offset by lower other operating income andCompany-operated margin dollars. Results for 2011 increasedprimarily due to higher combined restaurant margin dollars, mostlyfrom franchised margin dollars.
In Europe, results for 2012 were driven by strong operatingperformance in Russia and the U.K. The segment's constant currencyoperating results benefited from higher franchised margin dollars,and to a lesser extent, Company-operated margin dollars. Theseresults also benefited from higher gains on sales of restaurants,primarily in France and Germany, partly offset by incrementalselling, general and administrative expenses related to the 2012London Olympics. Results for 2011 were driven by stronger operatingperformance in France, the U.K., Russia and Germany, and highercombined restaurant margin dollars, primarily franchised margindollars.
In APMEA, results for 2012 increased primarily due to higherfranchised margin dollars and gains on sales of restaurants in Chinato developmental licensees, partly offset by lower Company-operatedmargin dollars and lower operating results in Japan. Results for 2011increased due to stronger operating results in many markets.Impairment charges in 2010 also positively impacted the constantcurrency growth rate for 2011 by 4 percentage points.
▪ Combined operating marginCombined operating margin is defined as operating income as apercent of total revenues. Combined operating margin for 2012, 2011and 2010 was 31.2%, 31.6% and 31.0%, respectively.
McDonald's Corporation 2012 Annual Report 19

INTEREST EXPENSEInterest expense increased 5% and 9% in 2012 and 2011,respectively, primarily due to higher average debt balances, partlyoffset by lower average interest rates. Stronger foreign currencies alsocontributed to the increase in 2011.
NONOPERATING (INCOME) EXPENSE, NET
Nonoperating (income) expense, net
In millions 2012 2011 2010 Interest income $ ( 2 8) $ (39) $ (20)
Foreign currency and hedging activity 9 9 (2)
Other expense 2 8 55 44Total $ 9 $ 25 $ 22
Interest income consists primarily of interest earned on short-termcash investments. Foreign currency and hedging activity includesnet gains or losses on certain hedges that reduce the exposure tovariability on certain intercompany foreign currency cash flowstreams.
PROVISION FOR INCOME TAXESIn 2012, 2011 and 2010, the reported effective income tax rates were32.4%, 31.3% and 29.3%, respectively.
In 2012, the effective income tax rate reflected the negativeimpact of certain tax benefits in the U.S. that had expired atDecember 31, 2011. In January 2013, the United States enacted theAmerican Taxpayer Relief Act of 2012 ("Act"). The Act reinstated,retroactive to January 1, 2012, certain tax benefits that hadpreviously expired. However, in accordance with the financialaccounting standards for income taxes, the Company is required toaccount for the effects of changes in tax laws in the period thelegislation is enacted.
In 2011, the effective income tax rate reflected lower tax benefitsrelated to certain foreign tax credits, partially offset by nonrecurringdeferred tax benefits related to certain foreign operations.
Consolidated net deferred tax liabilities included tax assets, net ofvaluation allowance, of $1.5 billion in 2012 and 2011. Substantiallyall of the net tax assets are expected to be realized in the U.S. andother profitable markets.
ACCOUNTING CHANGES
▪ Fair value measurementsIn May 2011, the Financial Accounting Standards Board ("FASB")issued an update to Topic 820 – Fair Value Measurement of theAccounting Standards Codification ("ASC"). This update providesguidance on how fair value accounting should be applied where itsuse is already required or permitted by other standards and does notextend the use of fair value accounting. The Company adopted thisguidance effective January 1, 2012, as required, and it did not havea significant impact on its consolidated financial statements. ▪ Comprehensive IncomeIn June 2011, the FASB issued an update to Topic 220 –Comprehensive Income of the ASC. The update is intended toincrease the prominence of other comprehensive income in thefinancial statements. The guidance requires that the Companypresents components of comprehensive income in either onecontinuous statement or two separate consecutive statements. TheCompany adopted this new guidance in 2012, as required, andincluded a separate Consolidated statement of comprehensive incomein this Form 10-K.
Cash Flows The Company generates significant cash from its operations and hassubstantial credit availability and capacity to fund operating anddiscretionary spending such as capital expenditures, debtrepayments, dividends and share repurchases.
Cash provided by operations totaled $7.0 billion and exceededcapital expenditures by $3.9 billion in 2012, while cash provided byoperations totaled $7.2 billion and exceeded capital expenditures by$4.4 billion in 2011. In 2012, cash provided by operations decreased$184 million or 3% compared with 2011 despite increased operatingresults, primarily due to higher income tax payments and thenegative impact of foreign currency translation on operating results. In2011, cash provided by operations increased $808 million or 13%compared with 2010 primarily due to higher operating results.
Cash used for investing activities totaled $3.2 billion in 2012, anincrease of $596 million compared with 2011. The increase primarilyreflected higher capital expenditures, an increase in other investingactivities related to short-term time deposits, and lower proceeds fromsales of restaurant businesses. Cash used for investing activitiestotaled $2.6 billion in 2011, an increase of $515 million compared with2010. This reflected higher capital expenditures, partly offset byhigher proceeds from sales of restaurant businesses.
Cash used for financing activities totaled $3.8 billion in 2012, adecrease of $683 million compared with 2011, primarily due to lowertreasury stock purchases and higher net debt issuances, partly offsetby higher dividend payments. Cash used for financing activitiestotaled $4.5 billion in 2011, an increase of $804 million compared with2010, primarily due to higher treasury stock purchases, higherdividend payments and lower proceeds from stock option exercises,partly offset by higher net debt issuances.
The Company’s cash and equivalents balance was $2.3 billion atyear end 2012 and 2011. In addition to cash and equivalents on handand cash provided by operations, the Company can meet short-termfunding needs through its continued access to commercial paperborrowings and line of credit agreements.
RESTAURANT DEVELOPMENT AND CAPITAL EXPENDITURESIn 2012, the Company opened 1,404 traditional restaurants and 35satellite restaurants (small, limited-menu restaurants for which theland and building are generally leased), and closed 269 traditionalrestaurants and 200 satellite restaurants. In 2011, the Companyopened 1,118 traditional restaurants and 32 satellite restaurants, andclosed 246 traditional restaurants and 131 satellite restaurants. Themajority of restaurant openings and closings occurred in the majormarkets in both years. The Company closes restaurants for a variety ofreasons, such as existing sales and profit performance or loss of realestate tenure.
Systemwide restaurants at year end (1)
2012 2011 2010U.S. 14,157 14,098 14,027Europe 7,368 7,156 6,969APMEA 9,454 8,865 8,424Other Countries & Corporate 3,501 3,391 3,317
Total 34,480 33,510 32,737(1) Includes satellite units at December 31, 2012, 2011 and 2010 as follows:
U.S.—997, 1,084, 1,112; Europe—246, 240, 239; APMEA (primarily Japan)—871, 949, 1,010; Other Countries & Corporate—453, 459, 470.
20 McDonald's Corporation 2012 Annual Report

Approximately 65% of Company-operated restaurants and over75% of franchised restaurants were located in the major markets atthe end of 2012. Over 80% of the restaurants at year-end 2012 werefranchised.
Capital expenditures increased $319 million or 12% in 2012, andincreased $595 million or 28% in 2011, primarily due to higherreinvestment in existing restaurants and higher investment in newrestaurants. The higher reinvestment reflects the Company'scommitment to grow sales through initiatives such as reimaging inmany markets around the world. The increase related to newrestaurants reflects our commitment to broaden accessibility to ourbrand.
Capital expenditures invested in major markets, excludingJapan, represented about 70% of the total in 2012, 2011 and 2010.Japan is accounted for under the equity method, and accordingly itscapital expenditures are not included in consolidated amounts.
Capital expenditures
In millions 2012 2011 2010New restaurants $ 1,340 $ 1,193 $ 968Existing restaurants 1,615 1,432 1,089Other(1) 94 105 78
Total capital expenditures $ 3,049 $ 2,730 $ 2,135Total assets $ 35,386 $ 32,990 $ 31,975
(1) Primarily corporate equipment and other office-related expenditures.
New restaurant investments in all years were concentrated inmarkets with acceptable returns or opportunities for long-term growth.Average development costs vary widely by market depending on thetypes of restaurants built and the real estate and construction costswithin each market. These costs, which include land, buildings andequipment, are managed through the use of optimally-sizedrestaurants, construction and design efficiencies, and leveraging bestpractices. Although the Company is not responsible for all costs forevery restaurant opened, total development costs (consisting of land,buildings and equipment) for new traditional McDonald’s restaurantsin the U.S. averaged approximately $2.9 million in 2012.
The Company owned approximately 45% of the land and about70% of the buildings for restaurants in its consolidated markets atyear-end 2012 and 2011.
SHARE REPURCHASES AND DIVIDENDSFor the last three years, the Company returned a total of $16.5 billionto shareholders through a combination of share repurchases anddividends.
Shares repurchased and dividends
In millions, except per share data 2012 2011 2010Number of shares repurchased 28.1 41.9 37.8Shares outstanding at year end 1,003 1,021 1,054Dividends declared per share $ 2.87 $ 2.53 $ 2.26 Treasury stock purchases (inShareholders' equity) $ 2,605 $ 3,373 $ 2,648Dividends paid 2,897 2,610 2,408
Total returned to shareholders $ 5,502 $ 5,983 $ 5,056
In September 2009, the Company’s Board of Directors approved a
$10 billion share repurchase program with no specified expirationdate ("2009 Program"). As most of the amount authorized under the2009 Program was utilized, the Company’s Board of Directorsterminated the 2009 Program and replaced it with a new sharerepurchase program, effective August 1, 2012, that authorizes thepurchase of up to $10 billion of the Company’s outstanding commonstock with no specified expiration date. In 2012, approximately 8.4million shares were repurchased for $ 748 million under the newprogram.
The Company has paid dividends on its common stock for 37consecutive years and has increased the dividend amount everyyear. The 2012 full year dividend of $2.87 per share reflects thequarterly dividend paid for each of the first three quarters of $0.70 pershare, with an increase to $0.77 per share paid in the fourth quarter.This 10% increase in the quarterly dividend equates to a $3.08 pershare annual dividend and reflects the Company’s confidence in theongoing strength and reliability of its cash flow. As in the past, futuredividend amounts will be considered after reviewing profitabilityexpectations and financing needs, and will be declared at thediscretion of the Company’s Board of Directors.
Financial Position and Capital Resources TOTAL ASSETS AND RETURNSTotal assets increased $2.4 billion or 7% in 2012. Excluding the effectof changes in foreign currency exchange rates, total assets increased$2.0 billion in 2012. Over 75% of total assets were in major markets atyear-end 2012. Net property and equipment increased $1.8 billion in2012 and represented about 70% of total assets at year end.Excluding the effect of changes in foreign currency exchange rates,net property and equipment increased $1.4 billion primarily due tocapital expenditures, partly offset by depreciation.
Operating income is used to compute return on average assets,while net income is used to calculate return on average commonequity. Month-end balances are used to compute both average assetsand average common equity.
2012 2011 2010Return on average assets 25.4% 26.0% 24.7%Return on average commonequity 37.5 37.7 35.3
In 2012, return on average assets and return on average commonequity decreased due to the negative impact of foreign currencytranslation primarily on operating income and net income. In 2011,return on average assets and return on average common equitybenefited from strong global operating results and the positive impactof foreign currency translation. Operating income, as reported, doesnot include interest income; however, cash balances are included inaverage assets. The inclusion of cash balances in average assetsreduced return on average assets by about two percentage points forall years presented.
McDonald's Corporation 2012 Annual Report 21

FINANCING AND MARKET RISKThe Company generally borrows on a long-term basis and is exposedto the impact of interest rate changes and foreign currencyfluctuations. Debt obligations at December 31, 2012 totaled $13.6billion, compared with $12.5 billion at December 31, 2011. The netincrease in 2012 was primarily due to net issuances of $1.2 billion.
Debt highlights(1)
2012 2011 2010Fixed-rate debt as a percent of totaldebt(2,3) 74% 69% 66%Weighted-average annual interest rateof total debt(3) 4.0 4.2 4.3Foreign currency-denominated debt as apercent of total debt (2) 36 40 41Total debt as a percent of total Capitalization (total debt and total Shareholders' equity) (2)
47 46 44Cash provided by operations as apercent of total debt (2) 51 57 55(1) All percentages are as of December 31, except for the weighted-average
annual interest rate, which is for the year.(2) Based on debt obligations before the effect of fair value hedging adjustments.
This effect is excluded as these adjustments have no impact on theobligation at maturity. See Debt financing note to the consolidated financialstatements.
(3) Includes the effect of interest rate swaps.
Fitch, Standard & Poor’s and Moody’s currently rate, with a stableoutlook, the Company’s commercial paper F1, A-1 and P-1,respectively; and its long-term debt A, A and A2, respectively.
Certain of the Company’s debt obligations contain cross-acceleration provisions and restrictions on Company and subsidiarymortgages and the long-term debt of certain subsidiaries. There are noprovisions in the Company’s debt obligations that would acceleraterepayment of debt as a result of a change in credit ratings or amaterial adverse change in the Company’s business. Under existingauthorization from the Company’s Board of Directors, at December 31,2012, the Company had $5.4 billion of authority remaining to borrowfunds, including through (i) public or private offering of debtsecurities; (ii) direct borrowing from banks or other financialinstitutions; and (iii) other forms of indebtedness. In addition to debtsecurities available through a medium-term notes program registeredwith the U.S. Securities and Exchange Commission ("SEC") and aGlobal Medium-Term Notes program, the Company has $1.5 billionavailable under committed line of credit agreements as well asauthority to issue commercial paper in the U.S. and global markets(see Debt Financing note to the consolidated financial statements inthis Form 10-K). Debt maturing in 2013 is approximately $690 millionof long-term corporate debt. In 2013, the Company expects to issuecommercial paper and long-term debt to refinance this maturing debt.As of December 31, 2012, the Company also had $581 million offoreign currency borrowings outstanding primarily under uncommittedline of credit agreements.
The Company uses major capital markets, bank financings andderivatives to meet its financing requirements and reduce interestexpense. The Company manages its debt portfolio in response tochanges in interest rates and foreign currency rates by periodicallyretiring, redeeming and repurchasing debt, terminating swaps andusing derivatives. The Company does not use derivatives with a levelof complexity or with a risk higher than the exposures to be hedgedand does not hold or issue derivatives for trading purposes. All swapsare over-the-counter instruments.
In managing the impact of interest rate changes and foreigncurrency fluctuations, the Company uses interest rate swaps andfinances in the currencies in which assets are denominated. TheCompany uses foreign currency debt and derivatives to hedge theforeign currency risk associated with certain royalties, intercompanyfinancings and long-term investments in foreign subsidiaries andaffiliates. This reduces the impact of fluctuating foreign currencies oncash flows and shareholders’ equity. Total foreign currency-denominated debt was $4.9 billion and $5.0 billion for the years endedDecember 31, 2012 and 2011, respectively. In addition, wherepractical, the Company’s restaurants purchase goods and services inlocal currencies resulting in natural hedges. See Summary ofsignificant accounting policies note to the consolidated financialstatements related to financial instruments and hedging activities foradditional information regarding the accounting impact and use ofderivatives.
The Company does not have significant exposure to anyindividual counterparty and has master agreements that containnetting arrangements. Certain of these agreements also require eachparty to post collateral if credit ratings fall below, or aggregateexposures exceed, certain contractual limits. At December 31, 2012,neither the Company nor its counterparties were required to postcollateral on any derivative position, other than on hedges of certain ofthe Company’s supplemental benefit plan liabilities where ourcounterparty was required to post collateral on its liability position.
The Company’s net asset exposure is diversified among a broadbasket of currencies. The Company’s largest net asset exposures(defined as foreign currency assets less foreign currency liabilities) atyear end were as follows:
Foreign currency net asset exposures
In millions of U.S. Dollars 2012 2011Euro $ 6,692 $ 5,905Australian Dollars 2,450 2,409Canadian Dollars 1,319 1,224British Pounds Sterling 1,117 726Russian Ruble 651 594
The Company prepared sensitivity analyses of its financialinstruments to determine the impact of hypothetical changes ininterest rates and foreign currency exchange rates on the Company’sresults of operations, cash flows and the fair value of its financialinstruments. The interest rate analysis assumed a one percentagepoint adverse change in interest rates on all financial instruments,but did not consider the effects of the reduced level of economicactivity that could exist in such an environment. The foreign currencyrate analysis assumed that each foreign currency rate would changeby 10% in the same direction relative to the U.S. Dollar on allfinancial instruments; however, the analysis did not include thepotential impact on revenues, local currency prices or the effect offluctuating currencies on the Company’s anticipated foreign currencyroyalties and other payments received in the U.S. Based on theresults of these analyses of the Company’s financial instruments,neither a one percentage point adverse change in interest rates from2012 levels nor a 10% adverse change in foreign currency rates from2012 levels would materially affect the Company’s results ofoperations, cash flows or the fair value of its financial instruments.
LIQUIDITYThe Company has significant operations outside the United Stateswhere we earn over 60% of our operating income. A significant portionof these historical earnings are considered to be indefinitelyreinvested in foreign jurisdictions where the Company
22 McDonald's Corporation 2012 Annual Report

has made, and will continue to make, substantial investments tosupport the ongoing development and growth of our internationaloperations. Accordingly, no U.S. federal or state income taxes havebeen provided on the undistributed foreign earnings. The Company'scash and equivalents held by our foreign subsidiaries totaledapproximately $2.1 billion as of December 31, 2012. We do not intend,nor do we foresee a need, to repatriate these funds.
Consistent with prior years, we expect existing domestic cash andequivalents, domestic cash flows from operations, annual repatriationof a portion of the current period's foreign earnings, and the issuanceof domestic debt to continue to be sufficient to fund our domesticoperating, investing, and financing activities. We also continue toexpect existing foreign cash and equivalents and foreign cash flowsfrom operations to be sufficient to fund our foreign operating,investing, and financing activities.
In the future, should we require more capital to fund activities inthe United States than is generated by our domestic operations and isavailable through the issuance of domestic debt, we could elect torepatriate a greater portion of future periods' earnings from foreignjurisdictions. This could also result in a higher effective tax rate in thefuture.
While the likelihood is remote, to the extent foreign cash isavailable, the Company could also elect to repatriate earnings fromforeign jurisdictions that have previously been considered to beindefinitely reinvested. Upon distribution of those earnings in the formof dividends or otherwise, the Company may be subject to additionalU.S. income taxes (net of an adjustment for foreign tax credits) whichcould result in a use of cash. This could also result in a highereffective tax rate in the period in which such a determination is madeto repatriate prior period foreign earnings. Refer to the Income Taxesnote to the consolidated financial statements in this Form 10-K forfurther information related to our income taxes and the undistributedearnings of the Company's foreign subsidiaries.
CONTRACTUAL OBLIGATIONS AND COMMITMENTSThe Company has long-term contractual obligations primarily in theform of lease obligations (related to both Company-operated andfranchised restaurants) and debt obligations. In addition, theCompany has long-term revenue and cash flow streams that relate toits franchise arrangements. Cash provided by operations (includingcash provided by these franchise arrangements) along with theCompany’s borrowing capacity and other sources of cash will be usedto satisfy the obligations. The following table summarizes theCompany’s contractual obligations and their aggregate maturities aswell as future minimum rent payments due to the Company underexisting franchise arrangements as of December 31, 2012. Seediscussions of cash flows and financial position and capital resourcesas well as the Notes to the consolidated financial statements in thisForm 10-K for further details.
Contractual cash outflows Contractual cash inflows
In millionsOperating
leases Debt
obligations(1) Minimum rent under
franchise arrangements 2013 $ 1,352 $ 2,5622014 1,259 $ 659 2,4842015 1,130 1,168 2,3822016 1,020 2,437 2,2612017 918 1,053 2,130
Thereafter 6,844 8,273 17,047Total $ 12,523 $ 13,590 $ 28,866
(1) The maturities reflect reclassifications of short-term obligations to long-termobligations of $1.5 billion, as they are supported by a long-term line of creditagreement expiring in November 2016. Debt obligations do not include $42million of noncash fair value hedging adjustments or $217 million of accruedinterest.
The Company maintains certain supplemental benefit plans that
allow participants to (i) make tax-deferred contributions and (ii) receiveCompany-provided allocations that cannot be made under thequalified benefit plans because of IRS limitations. At December 31,2012, total liabilities for the supplemental plans were $493 million,and total liabilities for gross unrecognized tax benefits were $482million.
There are certain purchase commitments that are not recognizedin the consolidated financial statements and are primarily related toconstruction, inventory, energy, marketing and other service relatedarrangements that occur in the normal course of business. Theamounts related to these commitments are not significant to theCompany’s financial position. Such commitments are generallyshorter term in nature and will be funded from operating cash flows.
Other Matters CRITICAL ACCOUNTING POLICIES AND ESTIMATESManagement’s discussion and analysis of financial condition andresults of operations is based upon the Company’s consolidatedfinancial statements, which have been prepared in accordance withaccounting principles generally accepted in the U.S. The preparationof these financial statements requires the Company to make estimatesand judgments that affect the reported amounts of assets, liabilities,revenues and expenses as well as related disclosures. On an ongoingbasis, the Company evaluates its estimates and judgments based onhistorical experience and various other factors that are believed to bereasonable under the circumstances. Actual results may differ fromthese estimates under various assumptions or conditions.
The Company reviews its financial reporting and disclosurepractices and accounting policies quarterly to ensure that they provideaccurate and transparent information relative to the current economicand business environment. The Company believes that of itssignificant accounting policies, the following involve a higher degreeof judgment and/or complexity:
▪ Property and equipmentProperty and equipment are depreciated or amortized on a straight-line basis over their useful lives based on management’s estimates ofthe period over which the assets will generate revenue (not to exceedlease term plus options for leased property). The useful lives areestimated based on historical experience with similar assets, takinginto account anticipated technological or other changes. The Companyperiodically reviews these lives relative to physical factors, economicfactors and industry trends. If there are changes in the planned use ofproperty and equipment, or if technological changes occur morerapidly than anticipated, the useful lives assigned to these assetsmay need to be shortened, resulting in the accelerated recognition ofdepreciation and amortization expense or write-offs in future periods.
▪ Share-based compensationThe Company has a share-based compensation plan which authorizesthe granting of various equity-based incentives including stockoptions and restricted stock units ("RSUs") to employees andnonemployee directors. The expense for these equity-basedincentives is based on their fair value at date of grant and generallyamortized over their vesting period.
The fair value of each stock option granted is estimated on thedate of grant using a closed-form pricing model. The pricing modelrequires assumptions, which impact the assumed fair value,including the expected life of the stock option, the risk-free interestrate, expected volatility of the Company’s stock over the expected
McDonald's Corporation 2012 Annual Report 23

life and the expected dividend yield. The Company uses historicaldata to determine these assumptions and if these assumptions changesignificantly for future grants, share-based compensation expense willfluctuate in future years. The fair value of each RSU granted is equalto the market price of the Company’s stock at date of grant less thepresent value of expected dividends over the vesting period.
▪ Long-lived assets impairment reviewLong-lived assets (including goodwill) are reviewed for impairmentannually in the fourth quarter and whenever events or changes incircumstances indicate that the carrying amount of an asset may notbe recoverable. In assessing the recoverability of the Company’s long-lived assets, the Company considers changes in economic conditionsand makes assumptions regarding estimated future cash flows andother factors. Estimates of future cash flows are highly subjectivejudgments based on the Company’s experience and knowledge of itsoperations. These estimates can be significantly impacted by manyfactors including changes in global and local business and economicconditions, operating costs, inflation, competition, and consumer anddemographic trends. A key assumption impacting estimated futurecash flows is the estimated change in comparable sales. If theCompany’s estimates or underlying assumptions change in thefuture, the Company may be required to record impairment charges.Based on the annual goodwill impairment test, conducted in thefourth quarter, the Company does not have any reporting units(defined as each individual country) with goodwill currently at risk ofimpairment.
▪ Litigation accrualsIn the ordinary course of business, the Company is subject toproceedings, lawsuits and other claims primarily related tocompetitors, customers, employees, franchisees, governmentagencies, intellectual property, shareholders and suppliers. TheCompany is required to assess the likelihood of any adversejudgments or outcomes to these matters as well as potential ranges ofprobable losses. A determination of the amount of accrual required, ifany, for these contingencies is made aftercareful analysis of each matter. The required accrual may change inthe future due to new developments in each matter or changes inapproach such as a change in settlement strategy in dealing withthese matters. The Company does not believe that any such mattercurrently being reviewed will have a material adverse effect on itsfinancial condition or results of operations.
▪ Income taxesThe Company records a valuation allowance to reduce its deferred taxassets if it is more likely than not that some portion or all of thedeferred assets will not be realized. While the Company hasconsidered future taxable income and ongoing prudent and feasibletax strategies, including the sale of appreciated assets, in assessingthe need for the valuation allowance, if these estimates andassumptions change in the future, the Company may be required toadjust its valuation allowance. This could result in a charge to, or anincrease in, income in the period such determination is made.
The Company operates within multiple taxing jurisdictions and issubject to audit in these jurisdictions. The Company records accrualsfor the estimated outcomes of these audits, and the accruals maychange in the future due to new developments in each matter. In2012, the Internal Revenue Service ("IRS") completed itsexamination of the Company's U.S. federal income tax returns for2007 and 2008. The Company and the IRS reached an agreement onadjustments that had been previously proposed by the IRS. Theagreement did not have a material impact on the Company's cashflows, results of operations or financial position. The Company's 2009and 2010 U.S. federal income tax returns
are currently under examination and the completion of the fieldexamination is expected in 2013.
Deferred U.S. income taxes have not been recorded for temporarydifferences totaling $14.8 billion related to investments in certainforeign subsidiaries and corporate affiliates. The temporary differencesconsist primarily of undistributed earnings that are consideredpermanently invested in operations outside the U.S. If management'sintentions change in the future, deferred taxes may need to beprovided.
EFFECTS OF CHANGING PRICES—INFLATIONThe Company has demonstrated an ability to manage inflationary costincreases effectively. This ability is because of rapid inventoryturnover, the ability to adjust menu prices, cost controls andsubstantial property holdings, many of which are at fixed costs andpartly financed by debt made less expensive by inflation.
RECONCILIATION OF RETURNS ON INCREMENTAL INVESTED CAPITALROIIC is a measure reviewed by management over one-year andthree-year time periods to evaluate the overall profitability of thebusiness units, the effectiveness of capital deployed and the futureallocation of capital. This measure is calculated using operatingincome and constant foreign exchange rates to exclude the impact offoreign currency translation. The numerator is the Company’sincremental operating income plus depreciation and amortization fromthe base period.
The denominator is the weighted-average cash used for investingactivities during the applicable one-or three-year period. Theweighted-average cash used for investing activities is based on aweighting applied on a quarterly basis. These weightings are used toreflect the estimated contribution of each quarter’s investing activitiesto incremental operating income. For example, fourth quarter 2012investing activities are weighted less because the assets purchasedhave only recently been deployed and would have generated littleincremental operating income (12.5% of fourth quarter 2012 investingactivities are included in the one-year and three-year calculations). Incontrast, fourth quarter 2011 is heavily weighted because the assetspurchased were deployed more than 12 months ago, and thereforehave a full-year impact on 2012 operating income, with little or noimpact to the base period (87.5% and 100.0% of fourth quarter 2011investing activities are included in the one-year and three-yearcalculations, respectively). Management believes that weighting cashused for investing activities provides a more accurate reflection of therelationship between its investments and returns than a simpleaverage.
The reconciliations to the most comparable measurements, inaccordance with accounting principles generally accepted in the U.S.,for the numerator and denominator of the one-year and three-yearROIIC are as follows:
24 McDonald's Corporation 2012 Annual Report

One-year ROIIC calculation (dollars in millions):
Years ended December 31, 2012 2011 Incremental
change NUMERATOR: Operating income $ 8,604.6 $ 8,529.7 $ 74.9Depreciation and amortization 1,488.5 1,415.0 73.5
Currency translation (1) 286.1Incremental operating income plus depreciation and amortization (at constant foreign exchange rates)
$ 434.5DENOMINATOR: Weighted-average cash used forinvesting activities (2) $ 2,826.3Currency translation (1) 3.0Weighted-average cash used for investing activities (at constant foreign exchange rates)
$ 2,829.3One-year ROIIC 15.4%
(1) Represents the effect of foreign currency translation by translating results atan average exchange rate for the periods measured.
(2) Represents one-year weighted-average cash used for investing activities,determined by applying the weightings below to the cash used for investingactivities for each quarter in the two-year period ended December 31, 2012.
Years ended December 31, 2012 2011
Cash used for investingactivities $ 3,167.3 $ 2,570.9AS A PERCENT Quarters ended: March 31 87.5% 12.5%June 30 62.5 37.5September 30 37.5 62.5December 31 12.5 87.5
Three-year ROIIC calculation (dollars in millions):
Years ended December 31, 2012 2009 Incremental
change NUMERATOR: Operating income $ 8,604.6 $ 6,841.0 $ 1,763.6Depreciation and amortization 1,488.5 1,216.2 272.3Currency translation (3) (65.3)
Incremental operating income plus depreciation and amortization (at constant foreign exchange rates)
$ 1,970.6DENOMINATOR: Weighted-average adjusted cashused for investing activities (4) $ 6,959.1
Currency translation (3) (70.0)
Weighted-average cash used for investing activities (at constant foreign exchange rates) $ 6,889.1Three-year ROIIC 28.6%
(3) Represents the effect of foreign currency translation by translating results atan average exchange rate for the periods measured.
(4) Represents three-year weighted-average adjusted cash used for investingactivities, determined by applying the weightings below to the adjusted cashused for investing activities for each quarter in the four-year period endedDecember 31, 2012.
Years ended December 31, 2012 2011 2010 2009
Cash used for investingactivities
$ 3,167.3 $ 2,570.9 $ 2,056.0 $ 1,655.3Less: Cash generated from investing activities related to
Redbox transaction (144.9)
Adjusted cashused for investing activities
$ 3,167.3 $ 2,570.9 $ 2,056.0 $ 1,800.2AS A PERCENT Quarters ended: March 31 87.5% 100.0% 100.0% 12.5%June 30 62.5 100.0 100.0 37.5September 30 37.5 100.0 100.0 62.5December 31 12.5 100.0 100.0 87.5
McDonald's Corporation 2012 Annual Report 25

RISK FACTORS AND CAUTIONARY STATEMENT ABOUT FORWARD-LOOKING INFORMATIONThis report includes forward-looking statements about our plans and future performance, including those under Outlook for 2013. Thesestatements use such words as “may,” “will,” “expect,” “believe” and “plan.” They reflect our expectations and speak only as of the date of thisreport. We do not undertake to update them. Our expectations (or the underlying assumptions) may change or not be realized, and you should notrely unduly on forward-looking statements. We have identified the principal risks and uncertainties that affect our performance elsewhere in thisreport, and investors are urged to consider these risks and uncertainties when evaluating our historical and expected performance.
ITEM 7A. Quantitative and Qualitative Disclosures About Market Risk Quantitative and qualitative disclosures about market risk are included in Part II, Item 7, page 22 of the Form 10-K.
ITEM 8. Financial Statements and Supplementary Data Index to consolidated financial statements Page reference Consolidated statement of income for each of the three years in the period ended December 31, 2012 27Consolidated statement of comprehensive income for each of the three years in the period ended December 31, 2012 28Consolidated balance sheet at December 31, 2012 and 2011 29Consolidated statement of cash flows for each of the three years in the period ended December 31, 2012 30Consolidated statement of shareholders’ equity for each of the three years in the period ended December 31, 2012 31Notes to consolidated financial statements 32Quarterly results (unaudited) 43Management’s assessment of internal control over financial reporting 44Report of independent registered public accounting firm 45Report of independent registered public accounting firm on internal control over financial reporting 46
26 McDonald's Corporation 2012 Annual Report

Consolidated Statement of Income
In millions, except per share data Years ended December 31, 2012 2011 2010REVENUES Sales by Company-operated restaurants $ 18,602.5 $ 18,292.8 $ 16,233.3Revenues from franchised restaurants 8,964.5 8,713.2 7,841.3
Total revenues 27,567.0 27,006.0 24,074.6OPERATING COSTS AND EXPENSES Company-operated restaurant expenses
Food & paper 6,318.2 6,167.2 5,300.1Payroll & employee benefits 4,710.3 4,606.3 4,121.4Occupancy & other operating expenses 4,195.2 4,064.4 3,638.0
Franchised restaurants-occupancy expenses 1,527.0 1,481.5 1,377.8Selling, general & administrative expenses 2,455.2 2,393.7 2,333.3Impairment and other charges (credits), net 8.0 (3.9) 29.1Other operating (income) expense, net (251.5) (232.9) (198.2)
Total operating costs and expenses 18,962.4 18,476.3 16,601.5Operating income 8,604.6 8,529.7 7,473.1Interest expense-net of capitalized interest of $15.9, $14.0 and $12.0 516.6 492.8 450.9Nonoperating (income) expense, net 9.0 24.7 21.9Income before provision for income taxes 8,079.0 8,012.2 7,000.3Provision for income taxes 2,614.2 2,509.1 2,054.0Net income $ 5,464.8 $ 5,503.1 $ 4,946.3Earnings per common share–basic $ 5.41 $ 5.33 $ 4.64Earnings per common share–diluted $ 5.36 $ 5.27 $ 4.58Dividends declared per common share $ 2.87 $ 2.53 $ 2.26Weighted-average shares outstanding–basic 1,010.1 1,032.1 1,066.0Weighted-average shares outstanding–diluted 1,020.2 1,044.9 1,080.3
See Notes to consolidated financial statements.
McDonald's Corporation 2012 Annual Report 27

Consolidated Statement of Comprehensive Income
In millions Years ended December 31, 2012 2011 2010Net income $ 5,464.8 $ 5,503.1 $4,946.3Other comprehensive income (loss), net of tax
Foreign currency translation adjustments: Gain (loss) recognized in accumulated other comprehensiveincome (AOCI), including net investment hedges 274.7 (310.5) (3.0)
Reclassification of (gain) loss to net income (0.1) 25.4 Foreign currency translation adjustments-net of taxbenefit (expense) of $(47.9), $61.0 and $52.2 274.6 (285.1) (3.0)
Cash flow hedges: Gain (loss) recognized in AOCI 19.8 (12.2) 6.5Reclassification of (gain) loss to net income 10.8 1.8 (8.0)
Cash flow hedges-net of tax benefit (expense) of $(8.8), $5.8 and $1.1 30.6 (10.4) (1.5)
Defined benefit pension plans: Gain (loss) recognized in AOCI 33.1 (8.1) 9.3Reclassification of (gain) loss to net income 8.4 0.4 0.7
Defined benefit pension plans-net of tax benefit (expense) of $(16.6), $2.9 and $(3.5) 41.5 (7.7) 10.0
Total other comprehensive income (loss), net of tax 346.7 (303.2) 5.5 Comprehensive income $ 5,811.5 $ 5,199.9 $ 4,951.8 See Notes to consolidated financial statements.
28 McDonald's Corporation 2012 Annual Report

Consolidated Balance Sheet
In millions, except per share data December 31, 2012 2011ASSETS Current assets Cash and equivalents $ 2,336.1 $ 2,335.7Accounts and notes receivable 1,375.3 1,334.7Inventories, at cost, not in excess of market 121.7 116.8Prepaid expenses and other current assets 1,089.0 615.8
Total current assets 4,922.1 4,403.0Other assets Investments in and advances to affiliates 1,380.5 1,427.0Goodwill 2,804.0 2,653.2Miscellaneous 1,602.7 1,672.2
Total other assets 5,787.2 5,752.4Property and equipment Property and equipment, at cost 38,491.1 35,737.6Accumulated depreciation and amortization (13,813.9) (12,903.1)
Net property and equipment 24,677.2 22,834.5Total assets $ 35,386.5 $32,989.9LIABILITIES AND SHAREHOLDERS’ EQUITY Current liabilities Accounts payable $ 1,141.9 $ 961.3Income taxes 298.7 262.2Other taxes 370.7 338.1Accrued interest 217.0 218.2Accrued payroll and other liabilities 1,374.8 1,362.8Current maturities of long-term debt 366.6
Total current liabilities 3,403.1 3,509.2Long-term debt 13,632.5 12,133.8Other long-term liabilities 1,526.2 1,612.6Deferred income taxes 1,531.1 1,344.1Shareholders’ equity Preferred stock, no par value; authorized – 165.0 million shares; issued – none Common stock, $.01 par value; authorized – 3.5 billion shares; issued – 1,660.6 million shares 16.6 16.6Additional paid-in capital 5,778.9 5,487.3Retained earnings 39,278.0 36,707.5Accumulated other comprehensive income 796.4 449.7Common stock in treasury, at cost; 657.9 and 639.2 million shares (30,576.3) (28,270.9)
Total shareholders’ equity 15,293.6 14,390.2Total liabilities and shareholders’ equity $ 35,386.5 $32,989.9
See Notes to consolidated financial statements.
McDonald's Corporation 2012 Annual Report 29

Consolidated Statement of Cash Flows
In millions Years ended December 31, 2012 2011 2010Operating activities Net income $ 5,464.8 $ 5,503.1 $ 4,946.3Adjustments to reconcile to cash provided by operations
Charges and credits: Depreciation and amortization 1,488.5 1,415.0 1,276.2Deferred income taxes 134.5 188.4 (75.7)
Impairment and other charges (credits), net 8.0 (3.9) 29.1Share-based compensation 93.4 86.2 83.1Other (100.0) (78.7) 211.6
Changes in working capital items: Accounts receivable (29.4) (160.8) (50.1)
Inventories, prepaid expenses and other current assets (27.2) (52.2) (50.8)
Accounts payable 124.1 35.8 (39.8)
Income taxes (74.0) 198.5 54.9Other accrued liabilities (116.6) 18.7 (43.2)
Cash provided by operations 6,966.1 7,150.1 6,341.6Investing activities Capital expenditures (3,049.2) (2,729.8) (2,135.5)
Purchases of restaurant businesses (158.5) (186.4) (183.4)
Sales of restaurant businesses and property 394.7 511.4 377.9Other (354.3) (166.1) (115.0)
Cash used for investing activities (3,167.3) (2,570.9) (2,056.0)
Financing activities Net short-term borrowings (117.5) 260.6 3.1Long-term financing issuances 2,284.9 1,367.3 1,931.8Long-term financing repayments (962.8) (624.0) (1,147.5)
Treasury stock purchases (2,615.1) (3,363.1) (2,698.5)
Common stock dividends (2,896.6) (2,609.7) (2,408.1)
Proceeds from stock option exercises 328.6 334.0 463.1Excess tax benefit on share-based compensation 142.3 112.5 128.7Other (13.6) (10.6) (1.3)
Cash used for financing activities (3,849.8) (4,533.0) (3,728.7)
Effect of exchange rates on cash and equivalents 51.4 (97.5) 34.1Cash and equivalents increase (decrease) 0.4 (51.3) 591.0Cash and equivalents at beginning of year 2,335.7 2,387.0 1,796.0Cash and equivalents at end of year $ 2,336.1 $ 2,335.7 $ 2,387.0Supplemental cash flow disclosures Interest paid $ 533.7 $ 489.3 $ 457.9Income taxes paid 2,447.8 2,056.7 1,708.5
See Notes to consolidated financial statements.
30 McDonald's Corporation 2012 Annual Report

Consolidated Statement of Shareholders’ Equity
Common stock
issued Accumulated other
comprehensive income (loss) Common stock in
treasury Total
shareholders’equity
Additionalpaid-incapital
Retainedearnings Pensions
Cash flowhedges
Foreigncurrency
translation In millions, except per share data Shares Amount Shares AmountBalance at December 31, 2009 1,660.6 $ 16.6 $ 4,853.9 $ 31,270.8 $ (134.6) $ 16.5 $ 865.5 (583.9) $ (22,854.8) $ 14,033.9Net income 4,946.3 4,946.3Other comprehensive income(loss),net of tax 10.0 (1.5) (3.0) 5.5
Comprehensive income 4,951.8Common stock cash dividends($2.26 per share) (2,408.1) (2,408.1)
Treasury stock purchases (37.8) (2,648.5) (2,648.5)
Share-based compensation 83.1 83.1Stock option exercises and other(including tax benefits of $146.1) 259.4 2.7 14.7 359.9 622.0Balance at December 31, 2010 1,660.6 16.6 5,196.4 33,811.7 (124.6) 15.0 862.5 (607.0) (25,143.4) 14,634.2Net income 5,503.1 5,503.1Other comprehensive income(loss),net of tax (7.7) (10.4) (285.1) (303.2)
Comprehensive income 5,199.9Common stock cash dividends($2.53 per share) (2,609.7) (2,609.7)
Treasury stock purchases (41.9) (3,372.9) (3,372.9)
Share-based compensation 86.2 86.2Stock option exercises and other(including tax benefits of $116.7) 204.7 2.4 9.7 245.4 452.5Balance at December 31, 2011 1,660.6 16.6 5,487.3 36,707.5 (132.3) 4.6 577.4 (639.2) (28,270.9) 14,390.2Net income 5,464.8 5,464.8Other comprehensive income(loss),net of tax 41.5 30.6 274.6 346.7
Comprehensive income 5,811.5Common stock cash dividends($2.87 per share) (2,896.6) (2,896.6)Treasury stock purchases (28.1) (2,605.4) (2,605.4)Share-based compensation 93.4 93.4
Stock option exercises and other(including tax benefits of $150.8) 198.2 2.3 9.4 300.0 500.5
Balance at December 31, 2012 1,660.6 $ 16.6 $ 5,778.9 $ 39,278.0 $ (90.8) $ 35.2 $ 852.0 (657.9) $ (30,576.3) $ 15,293.6
See Notes to consolidated financial statements.
McDonald's Corporation 2012 Annual Report 31

Notes to Consolidated Financial Statements Summary of Significant Accounting PoliciesNATURE OF BUSINESSThe Company franchises and operates McDonald’s restaurants in theglobal restaurant industry. All restaurants are operated either by theCompany or by franchisees, including conventional franchiseesunder franchise arrangements, and foreign affiliates anddevelopmental licensees under license agreements.
The following table presents restaurant information by ownershiptype:
Restaurants at December 31, 2012 2011 2010Conventional franchised 19,869 19,527 19,279Developmental licensed 4,350 3,929 3,485Foreign affiliated 3,663 3,619 3,574Franchised 27,882 27,075 26,338Company-operated 6,598 6,435 6,399Systemwide restaurants 34,480 33,510 32,737
The results of operations of restaurant businesses purchased andsold in transactions with franchisees were not material eitherindividually or in the aggregate to the consolidated financialstatements for periods prior to purchase and sale.
CONSOLIDATIONThe consolidated financial statements include the accounts of theCompany and its subsidiaries. Investments in affiliates owned 50% orless (primarily McDonald’s Japan) are accounted for by the equitymethod.
On an ongoing basis, the Company evaluates its businessrelationships such as those with franchisees, joint venture partners,developmental licensees, suppliers, and advertising cooperatives toidentify potential variable interest entities. Generally, thesebusinesses qualify for a scope exception under the variable interestentity consolidation guidance. The Company has concluded thatconsolidation of any such entity is not appropriate for the periodspresented.
ESTIMATES IN FINANCIAL STATEMENTSThe preparation of financial statements in conformity with accountingprinciples generally accepted in the U.S. requires management tomake estimates and assumptions that affect the amounts reported inthe financial statements and accompanying notes. Actual results coulddiffer from those estimates.
REVENUE RECOGNITIONThe Company’s revenues consist of sales by Company-operatedrestaurants and fees from franchised restaurants operated byconventional franchisees, developmental licensees and foreignaffiliates.
Sales by Company-operated restaurants are recognized on a cashbasis. The Company presents sales net of sales tax and other sales-related taxes. Revenues from conventional franchised restaurantsinclude rent and royalties based on a percent of sales with minimumrent payments, and initial fees. Revenues from restaurants licensedto foreign affiliates and developmental licensees include a royaltybased on a percent of sales, and may include initial fees. Continuingrent and royalties are recognized in the period earned. Initial fees arerecognized upon opening of a restaurant or granting of a newfranchise term, which is when the Company has performedsubstantially all initial services required by the franchisearrangement.
FOREIGN CURRENCY TRANSLATIONGenerally, the functional currency of operations outside the U.S. isthe respective local currency.
ADVERTISING COSTSAdvertising costs included in operating expenses of Company-operated restaurants primarily consist of contributions to advertisingcooperatives and were (in millions): 2012–$787.5; 2011–$768.6;2010–$687.0. Production costs for radio and television advertising areexpensed when the commercials are initially aired. These productioncosts, primarily in the U.S., as well as other marketing-relatedexpenses included in Selling, general & administrative expenseswere (in millions): 2012–$113.5; 2011–$74.4; 2010–$94.5. Costsrelated to the Olympics sponsorship are included in these expensesfor 2012 and 2010. In addition, significant advertising costs areincurred by franchisees through contributions to advertisingcooperatives in individual markets.
SHARE-BASED COMPENSATIONShare-based compensation includes the portion vesting of all share-based awards granted based on the grant date fair value.
Share-based compensation expense and the effect on dilutedearnings per common share were as follows:
In millions, except per share data 2012 2011 2010Share-based compensation expense $ 93.4 $ 86.2 $ 83.1After tax $ 63.2 $ 59.2 $ 56.2Earnings per common share-diluted $ 0.06 $ 0.05 $ 0.05
Compensation expense related to share-based awards isgenerally amortized on a straight-line basis over the vesting period inSelling, general & administrative expenses. As of December 31,2012, there was $94.6 million of total unrecognized compensation costrelated to nonvested share-based compensation that is expected to berecognized over a weighted-average period of 2.1 years.
The fair value of each stock option granted is estimated on thedate of grant using a closed-form pricing model. The following tablepresents the weighted-average assumptions used in the option pricingmodel for the 2012, 2011 and 2010 stock option grants. The expectedlife of the options represents the period of time the options areexpected to be outstanding and is based on historical trends. Expectedstock price volatility is generally based on the historical volatility of theCompany’s stock for a period approximating the expected life. Theexpected dividend yield is based on the Company’s most recentannual dividend rate. The risk-free interest rate is based on the U.S.Treasury yield curve in effect at the time of grant with a term equal tothe expected life. Weighted-average assumptions
2012 2011 2010Expected dividend yield 2.8% 3.2% 3.5%Expected stock pricevolatility 20.8% 21.5% 22.1%Risk-free interest rate 1.1% 2.8% 2.8%Expected life of options Inyears 6.1 6.3 6.2Fair value per optiongranted $ 13.65 $ 12.18 $ 9.90
PROPERTY AND EQUIPMENTProperty and equipment are stated at cost, with depreciation andamortization provided using the straight-line method over the followingestimated useful lives: buildings–up to 40 years; leaseholdimprovements–the lesser of useful lives of assets or lease terms ,which generally include option periods; and equipment– three to 12years.
32 McDonald's Corporation 2012 Annual Report


GOODWILLGoodwill represents the excess of cost over the net tangible assets andidentifiable intangible assets of acquired restaurant businesses. TheCompany's goodwill primarily results from purchases of McDonald'srestaurants from franchisees and ownership increases in subsidiariesor affiliates, and it is generally assigned to the reporting unit expectedto benefit from the synergies of the combination. If a Company-operated restaurant is sold within 24 months of acquisition, thegoodwill associated with the acquisition is written off in its entirety. If arestaurant is sold beyond 24 months from the acquisition, the amountof goodwill written off is based on the relative fair value of thebusiness sold compared to the reporting unit (defined as eachindividual country).
The Company conducts goodwill impairment testing in the fourthquarter of each year or whenever an indicator of impairment exists. Ifan indicator of impairment exists (e.g., estimated earnings multiplevalue of a reporting unit is less than its carrying value), the goodwillimpairment test compares the fair value of a reporting unit, generallybased on discounted future cash flows, with its carrying amountincluding goodwill. If the carrying amount of a reporting unit exceedsits fair value, an impairment loss is measured as the differencebetween the implied fair value of the reporting unit's goodwill and thecarrying amount of goodwill. Historically, goodwill impairment has notsignificantly impacted the consolidated financial statements.
The following table presents the 2012 activity in goodwill bysegment:
In millions U.S. Europe APMEA(1) Other Countries
& Corporate(2) Consolidated Balance at December 31, 2011 $ 1,254.4 $ 801.6 $ 405.4 $ 191.8 $ 2,653.2Net restaurant purchases (sales) 39.8 54.2 21.3 (2.7) 112.6Ownership changes and other (3.5) (3.5)
Currency translation 25.6 12.0 4.1 41.7Balance at December 31, 2012 $ 1,294.2 $881.4 $ 438.7 $ 189.7 $ 2,804.0 (1) APMEA represents Asia/Pacific, Middle East and Africa.(2) Other Countries & Corporate represents Canada, Latin America and Corporate. LONG-LIVED ASSETSLong-lived assets are reviewed for impairment annually in the fourthquarter and whenever events or changes in circumstances indicatethat the carrying amount of an asset may not be recoverable. Forpurposes of annually reviewing McDonald’s restaurant assets forpotential impairment, assets are initially grouped together at atelevision market level in the U.S. and at a country level for each ofthe international markets. The Company manages its restaurants as agroup or portfolio with significant common costs and promotionalactivities; as such, an individual restaurant’s cash flows are notgenerally independent of the cash flows of others in a market. If anindicator of impairment (e.g., negative operating cash flows for themost recent trailing 24-month period) exists for any grouping of assets,an estimate of undiscounted future cash flows produced by eachindividual restaurant within the asset grouping is compared to itscarrying value. If an individual restaurant is determined to beimpaired, the loss is measured by the excess of the carrying amountof the restaurant over its fair value as determined by an estimate ofdiscounted future cash flows.
Losses on assets held for disposal are recognized whenmanagement and the Board of Directors, as required, have approvedand committed to a plan to dispose of the assets, the assets areavailable for disposal, the disposal is probable of occurring within 12months, and the net sales proceeds are expected to be less than itsnet book value, among other factors. Generally, such losses relate torestaurants that have closed and ceased operations as well as otherassets that meet the criteria to be considered “available for sale”.
FAIR VALUE MEASUREMENTSThe Company measures certain financial assets and liabilities at fairvalue on a recurring basis, and certain non-financial assets andliabilities on a nonrecurring basis. Fair value is defined as the pricethat would be received to sell an asset or paid to transfer a liability inthe principal or most advantageous market in an orderly transactionbetween market participants on the measurement date. Fair valuedisclosures are reflected in a three-level hierarchy, maximizing theuse of observable inputs and minimizing the use of unobservableinputs.
The valuation hierarchy is based upon the transparency of inputsto the valuation of an asset or liability on the measurement date. Thethree levels are defined as follows:▪ Level 1 – inputs to the valuation methodology are quoted prices
(unadjusted) for an identical asset or liability in an active market.▪ Level 2 – inputs to the valuation methodology include quoted
prices for a similar asset or liability in an active market or model-derived valuations in which all significant inputs are observablefor substantially the full term of the asset or liability.
▪ Level 3 – inputs to the valuation methodology are unobservableand significant to the fair value measurement of the asset orliability.
Certain of the Company’s derivatives are valued using variouspricing models or discounted cash flow analyses that incorporateobservable market parameters, such as interest rate yield curves,option volatilities and currency rates, classified as Level 2 within thevaluation hierarchy. Derivative valuations incorporate credit riskadjustments that are necessary to reflect the probability of default bythe counterparty or the Company.
McDonald's Corporation 2012 Annual Report 33

▪ Certain Financial Assets and Liabilities Measured at FairValue
The following tables present financial assets and liabilities measuredat fair value on a recurring basis by the valuation hierarchy asdefined in the fair value guidance:
December 31, 2012
In millions Level 1 Level 2 Level 3 Carrying
ValueCash equivalents $ 670.8 $ 670.8Investments 155.1 * 155.1Derivative assets 132.3 * $ 86.1 218.4Total assets at fair value $ 958.2 $ 86.1 $ 1,044.3Derivative payables $ (42.6) $ (42.6)
Total liabilities at fair value $ (42.6) $ (42.6)
December 31, 2011
In millions Level 1 Level 2 Level 3 Carrying
ValueCash equivalents $ 581.7 $ 581.7Investments 132.4 * 132.4Derivative assets 154.5 * $ 71.1 225.6Total assets at fair value $ 868.6 $ 71.1 $ 939.7Derivative payables $ (15.6) $ (15.6)
Total liabilities at fair value $ (15.6) $ (15.6) * Includes investments and derivatives that hedge market driven changes in
liabilities associated with the Company’s supplemental benefit plan.
▪ Non-Financial Assets and Liabilities Measured at Fair Valueon a Nonrecurring Basis
Certain assets and liabilities are measured at fair value on anonrecurring basis; that is, the assets and liabilities are not measuredat fair value on an ongoing basis, but are subject to fair valueadjustments in certain circumstances (e.g., when there is evidence ofimpairment). For the year ended December 31, 2012, no material fairvalue adjustments or fair value measurements were required for non-financial assets or liabilities.
▪ Certain Financial Assets and Liabilities not Measured at FairValue
At December 31, 2012, the fair value of the Company’s debtobligations was estimated at $15.6 billion, compared to a carryingamount of $13.6 billion. The fair value was based on quoted marketprices, Level 2 within the valuation hierarchy. The carrying amountfor both cash equivalents and notes receivable approximate fair value.
FINANCIAL INSTRUMENTS AND HEDGING ACTIVITIESThe Company is exposed to global market risks, including the effect ofchanges in interest rates and foreign currency fluctuations. TheCompany uses foreign currency denominated debt and derivativeinstruments to mitigate the impact of these changes. The Companydoes not use derivatives with a level of complexity or with a riskhigher than the exposures to be hedged and does not hold or issuederivatives for trading purposes.
The Company documents its risk management objective andstrategy for undertaking hedging transactions, as well as allrelationships between hedging instruments and hedged items. TheCompany’s derivatives that are designated as hedging instrumentsconsist mainly of interest rate swaps, foreign currency forwards andforeign currency options, cross-currency swaps, and commodityforwards, further explained in the "Fair Value," "Cash Flow" and "NetInvestment" hedge sections.
The Company also enters into certain derivatives that are notdesignated as hedging instruments. The Company has entered intoequity derivative contracts to hedge market-driven changes in certainof its supplemental benefit plan liabilities. Changes in the fair valueof these derivatives are recorded in Selling, general & administrativeexpenses together with the changes in the supplemental benefit planliabilities. In addition, the Company uses foreign currency forwards tomitigate the change in fair value of certain foreign currencydenominated assets and liabilities. Since these derivatives are notdesignated for hedge accounting, the changes in the fair value ofthese derivatives are recognized immediately in nonoperating(income) expense together with the currency gain or loss from thehedged balance sheet position. A portion of the Company’s foreigncurrency options (more fully described in the "Cash Flow Hedges"section) are undesignated as hedging instruments as the underlyingforeign currency royalties are earned.
All derivative instruments designated as hedging instruments areclassified as fair value, cash flow or net investment hedges. Allderivatives (including those not designated for hedge accounting) arerecognized on the Consolidated balance sheet at fair value andclassified based on the instruments’ maturity dates. Changes in thefair value measurements of the derivative instruments are reflectedas adjustments to other comprehensive income ("OCI") and/or currentearnings.
34 McDonald's Corporation 2012 Annual Report

The following table presents the fair values of derivative instruments included on the Consolidated balance sheet as of December 31, 2012and 2011:
Derivative Assets Derivative LiabilitiesIn millions Balance Sheet Classification 2012 2011 Balance Sheet Classification 2012 2011Derivatives designated as hedging instruments
Foreign currency Prepaid expenses and othercurrent assets $ 5.0 $ 6.7
Accrued payroll and otherliabilities $ (3.5) $ (0.3)
Interest rate Prepaid expenses and othercurrent assets 4.2 9.4
Commodity Miscellaneous other assets 35.3 Other long-term liabilities (0.2) Foreign currency Miscellaneous other assets 2.5 0.7 Other long-term liabilities (32.1) (0.3)
Interest rate Miscellaneous other assets 38.1 46.0 Other long-term liabilities (14.0)
Total derivatives designated as hedging instruments $ 85.1 $ 62.8 $(35.8) $ (14.6)
Derivatives not designated as hedging instruments Equity Prepaid expenses and other
current assets $ 132.3 Foreign currency Prepaid expenses and other
current assets 1.0 $ 8.3 Accrued payroll and otherliabilities $ (6.8) $ (1.0)
Equity Miscellaneous other assets 154.5 Total derivatives not designated as hedging instruments $ 133.3 $ 162.8 $ (6.8) $ (1.0)
Total derivatives $218.4 $225.6 $(42.6) $ (15.6)
The following table presents the pretax amounts affecting income and OCI for the years ended December 31, 2012 and 2011, respectively:
In millions Derivatives in
Fair ValueHedging
Relationships
Gain (Loss)
Recognized in Incomeon Derivative
Hedged Items in
Fair ValueHedging Relationships
Gain (Loss) Recognized in Income onRelated Hedged Items
2012 2011 2012 2011 Interest rate $(13.0) $ (11.1) Fixed-rate debt $ 13.0 $ 11.1
Derivatives inCash Flow
HedgingRelationships
Gain (Loss) Recognized inAccumulated OCI on
Derivative(Effective Portion)
Gain (Loss)Reclassified into Income fromAccumulated OCI (Effective
Portion)
Gain (Loss) Recognized in Income onDerivative (Amount Excluded
from Effectiveness Testing and IneffectivePortion)
2012 2011 2012 2011 2012 2011 Commodity $ 35.1 Foreign currency (6.4) $ (5.1) $(15.8) $ (5.1) $ (12.3) $ (7.7)
Interest rate(1) (4.6) (14.0) 0.5 2.2 Total $ 24.1 $ (19.1) $ (15.3) $ (2.9) $ (12.3) $ (7.7)
Gain (Loss)Recognized in Accumulated
OCI on Derivative(Effective Portion)
Gain (Loss)Reclassified into Income fromAccumulated OCI (Effective
Portion)
Derivatives NotDesignated as
Hedging Instruments
Gain (Loss)Recognized in
Incomeon Derivative
Net InvestmentHedging Relationships
2012 2011 2012 2011 2012 2011 Foreign Currency $(13.4) $ (2.2)
Foreign currency denominated debt $(61.7) $ (130.8) Equity(3) (16.2) 36.9Foreign currency derivatives (2) (23.3) (9.4) $ (8.2) Interest Rate 1.5Total $(85.0) $ (140.2) $ (8.2) Total $(29.6) $ 36.2 Gains (losses) recognized in income on derivatives are recorded in “Nonoperating (income) expense, net” unless otherwise noted.(1) The amount of gain (loss) reclassified from accumulated OCI into income is recorded in Interest expense.(2) The amount of gain (loss) reclassified from accumulated OCI into income is recorded in Impairment and other charges (credits), net.(3) The amount of gain (loss) recognized in income on the derivatives used to hedge the supplemental benefit plan liabilities is recorded in Selling, general &
administrative expenses.
McDonald's Corporation 2012 Annual Report 35

▪ Fair Value HedgesThe Company enters into fair value hedges to reduce the exposure tochanges in the fair values of certain liabilities. The fair value hedgesthe Company enters into consist of interest rate swaps which convert aportion of its fixed-rate debt into floating-rate debt. All of the Company’sinterest rate swaps meet the shortcut method requirements.Accordingly, changes in the fair values of the interest rate swaps areexactly offset by changes in the fair value of the underlying debt. Noineffectiveness has been recorded to net income related to interestrate swaps designated as fair value hedges for the year endedDecember 31, 2012. A total of $1.8 billion of the Company’soutstanding fixed-rate debt was effectively converted to floating-ratedebt resulting from the use of interest rate swaps.
▪ Cash Flow HedgesThe Company enters into cash flow hedges to reduce the exposure tovariability in certain expected future cash flows. The types of cashflow hedges the Company enters into include interest rateswaps, foreign currency forwards, foreign currency options, crosscurrency swaps, and commodity forwards.
The Company periodically uses interest rate swaps to effectivelyconvert a portion of floating-rate debt, including forecasted debtissuances, into fixed-rate debt and the agreements are intended toreduce the impact of interest rate changes on future interest expense.
To protect against the reduction in value of forecasted foreigncurrency cash flows (such as royalties denominated in foreigncurrencies), the Company uses foreign currency forwards and foreigncurrency options to hedge a portion of anticipated exposures.
When the U.S. dollar strengthens against foreign currencies, thedecline in value of future foreign denominated royalties is offset bygains in the fair value of the foreign currency forwards and/or foreigncurrency options. Conversely, when the U.S. dollar weakens, theincrease in the value of future foreign denominated royalties is offsetby losses in the fair value of the foreign currency forwards and/orforeign currency options.
Although the fair value changes in the foreign currency optionsmay fluctuate over the period of the contract, the Company’s total losson a foreign currency option is limited to the upfront premium paid forthe contract; however, the potential gains on a foreign currency optionare unlimited. In some situations, the Company uses foreign currencycollars, which limit the potential gains and lower the upfront premiumpaid, to protect against currency movements.
The hedges cover the next 19 months for certain exposures andare denominated in various currencies. As of December 31, 2012, theCompany had derivatives outstanding with an equivalent notionalamount of $626.9 million that were used to hedge a portion offorecasted foreign currency denominated royalties.
The Company excludes the time value of foreign currency optionsfrom its effectiveness assessment on its cash flow hedges. As a result,changes in the fair value of the derivatives due to this component, aswell as the ineffectiveness of the hedges, are recognized in earningscurrently. The effective portion of the gains or losses on the derivativesis reported in the cash flow hedging component of OCI inshareholders’ equity and reclassified into earnings in the same periodor periods in which the hedged transaction affects earnings.
The Company uses cross-currency swaps to hedge the risk ofcash flows associated with certain foreign-currency denominated debt,including forecasted interest payments, and has elected cash flowhedge accounting. The hedges cover periods up to 59 months andhave an equivalent notional amount of $245.8 million.
The Company manages its exposure to the variability of cashflows for energy-related transactions in certain markets by
entering into commodity forwards and has elected cash flow hedgeaccounting as appropriate. The hedges cover periods up to 22 yearsand have an equivalent notional amount of $493.8 million.
The Company recorded after tax adjustments to the cash flowhedging component of accumulated OCI in shareholders’ equity. TheCompany recorded a net increase of $30.6 million for the year endedDecember 31, 2012 and a net decrease of $10.4 million for the yearended December 31, 2011. Based on interest rates and foreignexchange rates at December 31, 2012, the $35.2 million incumulative cash flow hedging gains, after tax, at December 31, 2012,is not expected to have a significant effect on earnings over the next12 months.
▪ Net Investment HedgesThe Company primarily uses foreign currency denominated debt(third party and intercompany) to hedge its investments in certainforeign subsidiaries and affiliates. Realized and unrealized translationadjustments from these hedges are included in shareholders’ equityin the foreign currency translation component of OCI and offsettranslation adjustments on the underlying net assets of foreignsubsidiaries and affiliates, which also are recorded in OCI. As ofDecember 31, 2012, $7.7 billion of intercompany foreign currencydenominated debt, $4.0 billion of the Company’s third party foreigncurrency denominated debt and $528.6 million of derivatives weredesignated to hedge investments in certain foreign subsidiaries andaffiliates.
▪ Credit RiskThe Company is exposed to credit-related losses in the event of non-performance by the counterparties to its hedging instruments. Thecounterparties to these agreements consist of a diverse group offinancial institutions and market participants. The Companycontinually monitors its positions and the credit ratings of itscounterparties and adjusts positions as appropriate. The Company didnot have significant exposure to any individual counterparty atDecember 31, 2012 and has master agreements that contain nettingarrangements. For financial reporting purposes, the Companypresents gross derivative balances in the financial statements andsupplementary data, even for counterparties subject to nettingarrangements. Some of these agreements also require each party topost collateral if credit ratings fall below, or aggregate exposuresexceed, certain contractual limits. At December 31, 2012, neither theCompany nor its counterparties were required to post collateral on anyderivative position, other than on hedges of certain of the Company’ssupplemental benefit plan liabilities where its counterparties wererequired to post collateral on their liability positions.
INCOME TAX UNCERTAINTIESThe Company, like other multi-national companies, is regularlyaudited by federal, state and foreign tax authorities, and taxassessments may arise several years after tax returns have beenfiled. Accordingly, tax liabilities are recorded when, in management’sjudgment, a tax position does not meet the more likely than notthreshold for recognition. For tax positions that meet the more likelythan not threshold, a tax liability may still be recorded depending onmanagement’s assessment of how the tax position will ultimately besettled.
The Company records interest and penalties on unrecognized taxbenefits in the provision for income taxes.
36 McDonald's Corporation 2012 Annual Report

PER COMMON SHARE INFORMATIONDiluted earnings per common share is calculated using net incomedivided by diluted weighted-average shares. Diluted weighted-average shares include weighted-average shares outstanding plusthe dilutive effect of share-based compensation calculated using thetreasury stock method, of (in millions of shares): 2012–10.1;2011–12.8; 2010–14.3. Stock options that were not included in dilutedweighted-average shares because they would have been antidilutivewere (in millions of shares): 2012–4.7; 2011–0.0; 2010–0.0.
The Company has elected to exclude the pro forma deferred taxasset associated with share-based compensation in earnings pershare.STATEMENT OF CASH FLOWSThe Company considers short-term, highly liquid investments with anoriginal maturity of 90 days or less to be cash equivalents.SUBSEQUENT EVENTSThe Company evaluated subsequent events through the date thefinancial statements were issued and filed with the U.S. Securitiesand Exchange Commission ("SEC"). There were no subsequentevents that required recognition or disclosure.
Comprehensive Income In June 2011, the Financial Accounting Standards Board ("FASB")issued an update to Topic 220 – Comprehensive Income of theAccounting Standards Codification ("ASC"). The update is intended toincrease the prominence of other comprehensive income in thefinancial statements. The guidance requires that the Companypresents components of comprehensive income in either onecontinuous statement or two separate consecutive statements. TheCompany adopted this new guidance in 2012, as required, andincluded a separate Consolidated statement of comprehensive incomefor the years ended December 31, 2012, 2011 and 2010.
Property and Equipment Net property and equipment consisted of:
In millions December 31, 2012 2011
Land $ 5,612.6 $ 5,328.3Buildings and improvements on owned land 14,089.0 13,079.9Buildings and improvements on leased land 12,970.8 12,021.8Equipment, signs and seating 5,241.0 4,757.2Other 577.7 550.4 38,491.1 35,737.6Accumulated depreciation and amortization (13,813.9) (12,903.1)
Net property and equipment $ 24,677.2 $ 22,834.5
Depreciation and amortization expense was (in millions):2012–$1,402.2; 2011–$1,329.6; 2010–$1,200.4.
Impairment and Other Charges (Credits), Net
In millions 2012 2011 2010Europe $ 6.6 $ 0.3 $ 1.6APMEA (4.2) 48.5Other Countries & Corporate 1.4 (21.0)
Total $ 8.0 $ (3.9) $ 29.1
In 2010, the Company recorded expense of $29 million primarilyrelated to its share of restaurant closing costs in McDonald’s Japan inconjunction with the strategic review of the market’s restaurantportfolio, partly offset by income related to the resolution of certainliabilities retained in connection with the 2007 Latin Americadevelopmental license transaction.
Other Operating (Income) Expense, Net In millions 2012 2011 2010Gains on sales of restaurantbusinesses $ (151.5) $ (81.8) $ (79.4)
Equity in earnings ofunconsolidated affiliates (143.5) (178.0) (164.3)
Asset dispositions and otherexpense 43.5 26.9 45.5Total $ (251.5) $ (232.9) $ (198.2) ▪ Gains on sales of restaurant businessesGains on sales of restaurant businesses include gains from sales ofCompany-operated restaurants. The Company’s purchases and salesof businesses with its franchisees are aimed at achieving an optimalownership mix in each market. Resulting gains or losses are recordedin operating income because the transactions are a recurring part ofour business.
▪ Equity in earnings of unconsolidated affiliatesUnconsolidated affiliates and partnerships are businesses in whichthe Company actively participates but does not control. The Companyrecords equity in earnings from these entities representingMcDonald’s share of results. For foreign affiliated markets—primarilyJapan—results are reported after interest expense and income taxes.McDonald’s share of results for partnerships in certain consolidatedmarkets such as the U.S. are reported before income taxes. Thesepartnership restaurants are operated under conventional franchisearrangements and, therefore, are classified as conventionalfranchised restaurants.
▪ Asset dispositions and other expenseAsset dispositions and other expense consists of gains or losses onexcess property and other asset dispositions, provisions for restaurantclosings and uncollectible receivables, asset write-offs due torestaurant reinvestment, and other miscellaneous income andexpenses.
Contingencies In the ordinary course of business, the Company is subject toproceedings, lawsuits and other claims primarily related tocompetitors, customers, employees, franchisees, governmentagencies, intellectual property, shareholders and suppliers. TheCompany is required to assess the likelihood of any adversejudgments or outcomes to these matters as well as potential ranges ofprobable losses. A determination of the amount of accrual required, ifany, for these contingencies is made after careful analysis of eachmatter. The required accrual may change in the future due to newdevelopments in each matter or changes in approach such as achange in settlement strategy in dealing with these matters.
McDonald's Corporation 2012 Annual Report 37


In connection with the sale in 2007 of its businesses in18 countries in Latin America and the Caribbean to a developmentallicensee organization, the Company agreed to indemnify the buyersfor certain tax and other claims, certain of which are reflected onMcDonald’s Consolidated balance sheet (2012 and 2011: other long-term liabilities–$42.0 million and $49.4 million, respectively; 2012 and2011: accrued payroll and other liabilities–$0.0 million and $21.2million, respectively).
The Company believes any other matters currently beingreviewed will not have a material adverse effect on its financialcondition or results of operations.
Franchise Arrangements Conventional franchise arrangements generally include a lease anda license and provide for payment of initial fees, as well as continuingrent and royalties to the Company based upon a percent of sales withminimum rent payments that parallel the Company’s underlyingleases and escalations (on properties that are leased). Under thisarrangement, franchisees are granted the right to operate arestaurant using the McDonald’s System and, in most cases, the useof a restaurant facility, generally for a period of 20 years. Thesefranchisees pay related occupancy costs including property taxes,insurance and maintenance. Affiliates and developmental licenseesoperating under license agreements pay a royalty to the Companybased upon a percent of sales, and may pay initial fees.
Revenues from franchised restaurants consisted of:
In millions 2012 2011 2010Rents $ 5,863.5 $ 5,718.5 $ 5,198.4Royalties 3,032.6 2,929.8 2,579.2Initial fees 68.4 64.9 63.7Revenues from franchised restaurants
$ 8,964.5 $ 8,713.2 $ 7,841.3
Future minimum rent payments due to the Company underexisting franchise arrangements are:
In millions Owned sites Leased sites Total2013 $ 1,266.0 $ 1,295.7 $ 2,561.72014 1,233.6 1,250.3 2,483.92015 1,184.3 1,198.2 2,382.52016 1,124.2 1,137.0 2,261.22017 1,061.7 1,067.9 2,129.6Thereafter 9,125.9 7,921.0 17,046.9Total minimum payments $ 14,995.7 $ 13,870.1 $ 28,865.8
At December 31, 2012, net property and equipment underfranchise arrangements totaled $14.6 billion (including land of $4.2billion) after deducting accumulated depreciation and amortization of$7.6 billion.
Leasing Arrangements At December 31, 2012, the Company was the lessee at 14,429restaurant locations through ground leases (the Company leases theland and the Company or franchisee owns the building) and throughimproved leases (the Company leases land and buildings). Leaseterms for most restaurants, where market conditions allow, aregenerally for 20 years and, in many cases, provide for rentescalations and renewal options, with certain leases providingpurchase options. Escalation terms vary by geographic segment withexamples including fixed-rent escalations, escalations based on aninflation index, and fair-value market adjustments. The timing ofthese escalations generally
ranges from annually to every five years. For most locations, theCompany is obligated for the related occupancy costs includingproperty taxes, insurance and maintenance; however, for franchisedsites, the Company requires the franchisees to pay these costs. Inaddition, the Company is the lessee under noncancelable leasescovering certain offices and vehicles.
The following table provides detail of rent expense:
In millions 2012 2011 2010Company-operated restaurants:
U.S. $ 59.1 $ 55.9 $ 60.4Outside the U.S. 661.0 620.4 545.0
Total 720.1 676.3 605.4Franchised restaurants: U.S. 433.0 420.0 409.7Outside the U.S. 519.7 514.7 463.5
Total 952.7 934.7 873.2Other 104.2 101.7 98.1Total rent expense $ 1,777.0 $ 1,712.7 $ 1,576.7
Rent expense included percent rents in excess of minimum rents(in millions) as follows–Company-operated restaurants: 2012–$169.6;2011–$165.2; 2010–$142.5. Franchised restaurants: 2012–$178.7;2011–$173.4; 2010–$167.3.
Future minimum payments required under existing operatingleases with initial terms of one year or more are:
In millions Restaurant Other Total2013 $ 1,276.5 $ 75.2 $ 1,351.72014 1,193.6 65.4 1,259.02015 1,076.6 53.8 1,130.42016 972.4 47.0 1,019.42017 877.7 40.2 917.9Thereafter 6,620.2 224.0 6,844.2Total minimum payments $ 12,017.0 $ 505.6 $ 12,522.6
Income Taxes Income before provision for income taxes, classified by source ofincome, was as follows:
In millions 2012 2011 2010U.S. $ 2,879.7 $ 3,202.8 $ 2,763.0Outside the U.S. 5,199.3 4,809.4 4,237.3Income before provision for income taxes
$ 8,079.0 $ 8,012.2 $ 7,000.3
The provision for income taxes, classified by the timing andlocation of payment, was as follows:
In millions 2012 2011 2010U.S. federal $ 1,129.9 $ 1,173.4 $ 1,127.1U.S. state 189.8 165.2 161.1Outside the U.S. 1,160.0 982.1 841.5
Current tax provision 2,479.7 2,320.7 2,129.7U.S. federal 144.9 189.0 (66.8)
U.S. state 5.5 8.6 13.8Outside the U.S. (15.9) (9.2) (22.7)
Deferred tax provision (benefit)
134.5 188.4 (75.7)
Provision for income taxes $ 2,614.2 $ 2,509.1 $ 2,054.0

38 McDonald's Corporation 2012 Annual Report

Net deferred tax liabilities consisted of:
In millions December 31, 2012 2011Property and equipment $ 1,713.9 $ 1,651.3Other 636.4 541.7
Total deferred tax liabilities 2,350.3 2,193.0Property and equipment (403.6) (355.4)
Employee benefit plans (362.9) (406.3)
Intangible assets (258.0) (256.2)
Deferred foreign tax credits (179.5) (173.9)
Capital loss carryforwards (2 .8) (26.0)
Operating loss carryforwards (92.4) (71.1)
Indemnification liabilities (18.3) (33.4)
Other (298.3) (312.6)
Total deferred tax assets before valuationallowance
(1,615.8) (1,634.9)
Valuation Allowance 127.0 102.0Net deferred tax liabilities 861.5 660.1Balance sheet presentation: Deferred income taxes 1,531.1 1,344.1Other assets-miscellaneous (603.6) (606.3)
Current assets-prepaidexpenses and other current assets
(66.0) (77.7)
Net deferred tax liabilities $ 861.5 $ 660.1
The statutory U.S. federal income tax rate reconciles to theeffective income tax rates as follows:
2012 2011 2010Statutory U.S. federal income taxrate 35.0 % 35.0 % 35.0 %State income taxes, net of related federal income tax benefit
1.6 1.4 1.6Benefits and taxes related to foreign operations
(4.1) (4.7) (6.9)
Other, net (0.1) (0.4) (0.4)
Effective income tax rates 32.4 % 31.3 % 29.3 %
As of December 31, 2012 and 2011, the Company’s grossunrecognized tax benefits totaled $482.4 million and $565.0 million,respectively. After considering the deferred tax accounting impact, it isexpected that about $360 million of the total as of December 31, 2012would favorably affect the effective tax rate if resolved in theCompany’s favor.
The following table presents a reconciliation of the beginning andending amounts of unrecognized tax benefits:
In millions 2012 2011Balance at January 1 $ 565.0 $ 572.6Decreases for positions taken in prior years (65.7) (50.6)
Increases for positions taken in prior years 36.9 24.3Increases for positions related to the current year
47.3 54.8Settlements with taxing authorities (95.8) (14.4)
Lapsing of statutes of limitations (5.3) (21.7)
Balance at December 31 (1) $ 482.4 $ 565.0(1) Of this amount, $481.7 million and $564.3 million are included in long-term
In December 2012, the Company reached a final settlement withthe Internal Revenue Service ("IRS") Appeals Division regarding itsU.S. federal income tax returns for 2007 and 2008. The Companyagreed to a settlement of about $80 million, primarily related toproposed foreign tax credit adjustments of about $400 million. Theliabilities previously recorded and determined in accordance with ASC740 - Income Taxes related to this matter were adequate. Additionally,no cash payment was made related to this settlement as the Companyhad previously made a tax deposit with the IRS. The agreement didnot have a material impact on the Company's cash flows, results ofoperations or financial position.
The Company's 2009 and 2010 U.S. federal income tax returnsare currently under examination. Additionally, the Company iscurrently under audit in multiple state and foreign tax jurisdictionswhere it is reasonably possible that the audits could be completedwithin 12 months. Due to the possible completion of these audits andthe expiration of the statute of limitations in multiple tax jurisdictions,it is reasonably possible that the total amount of unrecognized taxbenefits could decrease within the next 12 months by $150 million to$160 million, of which $10 million to $30 million could favorably affectthe effective tax rate.
In addition, the Company is currently under audit in multiple taxjurisdictions where completion of the tax audits is not expected within12 months. However, it is reasonably possible that, as a result of auditprogression within the next 12 months, there may be new informationthat causes the Company to reassess the total amount of unrecognizedtax benefits recorded. While the Company cannot estimate the impactthat new information may have on our unrecognized tax benefitbalance, we believe that the liabilities recorded are appropriate andadequate as determined under ASC 740.
The Company is generally no longer subject to U.S. federal, stateand local, or non-U.S. income tax examinations by tax authorities foryears prior to 2006.
The Company had $37.7 million and $39.6 million accrued forinterest and penalties at December 31, 2012 and 2011, respectively.The Company recognized interest and penalties related to tax mattersof $11.2 million in 2012, $4.8 million in 2011, and $29.0 million in2010, which are included in the provision for income taxes.
Deferred U.S. income taxes have not been recorded for temporarydifferences related to investments in certain foreign subsidiaries andcorporate joint ventures. These temporary differences wereapproximately $14.8 billion at December 31, 2012 and consistedprimarily of undistributed earnings considered permanently investedin operations outside the U.S. Determination of the deferred incometax liability on these unremitted earnings is not practicable becausesuch liability, if any, is dependent on circumstances existing if andwhen remittance occurs.

liabilities on the Consolidated balance sheet for 2012 and 2011, respectively.The remainder is included in deferred income taxes on the Consolidatedbalance sheet.
McDonald's Corporation 2012 Annual Report 39

Segment and Geographic Information The Company operates in the global restaurant industry andmanages its business as distinct geographic segments. Allintercompany revenues and expenses are eliminated in computingrevenues and operating income. Corporate general andadministrative expenses are included in Other Countries & Corporateand consist of home office support costs in areas such as facilities,finance, human resources, information technology, legal, marketing,restaurant operations, supply chain and training. Corporate assetsinclude corporate cash and equivalents, asset portions of financialinstruments and home office facilities.
In millions 2012 2011 2010 U.S. $ 8,813.7 $ 8,528.2 $ 8,111.6 Europe 10,827.4 10,886.4 9,569.2 APMEA 6,391.1 6,019.5 5,065.5 Other Countries & Corporate
1,534.8 1,571.9 1,328.3 Total revenues $ 27,567.0 $ 27,006.0 $ 24,074.6
U.S. $ 3,750.4 $ 3,666.2 $ 3,446.5 Europe 3,195.8 3,226.7 2,796.8 APMEA 1,566.1 1,525.8 1,199.9 (1) Other Countries & Corporate
92.3 111.0 29.9 (2) Total operating income $ 8,604.6 $ 8,529.7 $ 7,473.1
U.S. $ 11,431.6 $ 10,865.5 $ 10,467.7 Europe 14,223.3 12,015.1 11,360.7 APMEA 6,419.3 5,824.2 5,374.0 Other Countries & Corporate
3,312.3 4,285.1 4,772.8 Total assets $ 35,386.5 $ 32,989.9 $ 31,975.2
U.S. $ 1,065.0 $ 786.5 $ 530.5 Europe 1,114.7 1,130.1 978.5 APMEA 716.6 614.1 493.1 Other Countries & Corporate
152.9 199.1 133.4 Total capital expenditures $ 3,049.2 $ 2,729.8 $ 2,135.5
U.S. $ 477.1 $ 446.0 $ 433.0 Europe 573.5 570.3 500.5 APMEA 296.2 267.5 232.4 Other Countries & Corporate
141.7 131.2 110.3 Total depreciation and amortization
$ 1,488.5 $ 1,415.0 $ 1,276.2 (1) Includes expense due to Impairment and other charges (credits), net of $39.3
million related to the Company’s share of restaurant closings in McDonald’sJapan (a 50%-owned affiliate).
(2) Includes income due to Impairment and other charges (credits), net of $21.0million related to the resolution of certain liabilities retained in connection withthe 2007 Latin America developmental license transaction.
Total long-lived assets, primarily property and equipment, were(in millions)–Consolidated: 2012–$29,644.5; 2011– $27,587.6;2010–$26,700.9; U.S. based: 2012–$11,308.7; 2011–$10,724.9;2010–$10,430.2.
Debt Financing LINE OF CREDIT AGREEMENTSAt December 31, 2012, the Company had a $1.5 billion line of creditagreement expiring in November 2016 with fees of 0.065% perannum on the total commitment, which remained unused. Fees andinterest rates on this line are based on the Company’s long-term creditrating assigned by Moody’s and Standard & Poor’s . In addition, theCompany, including certain subsidiaries outside the U.S., hadunused lines of credit totaling $988.9 million at December 31, 2012;these lines of credit were primarily uncommitted, short-term anddenominated in various currencies at local market rates of interest .
The weighted-average interest rate of short-term borrowings was4.1% at December 31, 2012 (based on $581.3 million of foreigncurrency bank line borrowings and $200.0 million of commercialpaper) and 4.6% at December 31, 2011 (based on $640.3 million offoreign currency bank line borrowings and $250.0 million ofcommercial paper).
DEBT OBLIGATIONSThe Company has incurred debt obligations principally through publicand private offerings and bank loans. There are no provisions in theCompany’s debt obligations that would accelerate repayment of debtas a result of a change in credit ratings or a material adverse changein the Company’s business. Certain of the Company’s debt obligationscontain cross-acceleration provisions, and restrictions on Companyand subsidiary mortgages and the long-term debt of certainsubsidiaries. Under certain agreements, the Company has the optionto retire debt prior to maturity, either at par or at a premium over par.The Company has no current plans to retire a significant amount of itsdebt prior to maturity.
ESOP LOANSBorrowings related to the leveraged Employee Stock Ownership Plan("ESOP") at December 31, 2012, which include $31.5 million of loansfrom the Company to the ESOP, are reflected as debt with acorresponding reduction of shareholders’ equity (additional paid-incapital included a balance of $27.2 million and $34.4 million atDecember 31, 2012 and 2011, respectively). The ESOP is repayingthe loans and interest through 2018 using Company contributions anddividends from its McDonald’s common stock holdings . As the principalamount of the borrowings is repaid, the debt and the unearned ESOPcompensation (additional paid-in capital) are reduced.
40 McDonald's Corporation 2012 Annual Report

The following table summarizes the Company’s debt obligations. (Interest rates and debt amounts reflected in the table include the effects ofinterest rate swaps.)
Interest rates(1)
December 31 Amounts outstanding
December 31 In millions of U.S. Dollars Maturity dates 2012 2011 2012 2011Fixed 4.8% 5.1% $ 7,075.7 $ 6,039.3Floating 1.2 2.0 1,650.0 1,399.9
Total U.S. Dollars 2013-2042 8,725.7 7,439.2Fixed 3.7 4.5 1,847.2 1,167.0Floating 2.9 2.8 348.0 719.0
Total Euro 2013-2024 2,195.2 1,886.0Fixed 2.9 2.9 144.2 162.4Floating 0.4 0.6 923.3 1,039.4
Total Japanese Yen 2013-2030 1,067.5 1,201.8Total British Pounds Sterling-Fixed 2020-2032 6.0 6.0 730.1 697.8
Fixed 2.0 2.8 305.4 495.8Floating 5.4 5.6 566.3 723.9
Total other currencies(2) 2013-2021 871.7 1,219.7Debt obligations before fair value adjustments (3) 13,590.2 12,444.5Fair value adjustments (4) 42.3 55.9Total debt obligations(5) $13,632.5 $12,500.4(1) Weighted-average effective rate, computed on a semi-annual basis.(2) Primarily consists of Chinese Renminbi, Swiss Francs, and Korean Won.(3) Aggregate maturities for 2012 debt balances, before fair value adjustments, were as follows (in millions): 2013–$0.0; 2014–$659.5; 2015–$1,167.6; 2016–$2,437.5;
2017–$1,052.9; Thereafter–$8,272.7. These amounts include a reclassification of short-term obligations totaling $1.5 billion to long-term obligations as they aresupported by a long-term line of credit agreement expiring in November 2016.
(4) The carrying value of underlying items in fair value hedges, in this case debt obligations, are adjusted for fair value changes to the extent they are attributable to therisk designated as being hedged. The related hedging instrument is also recorded at fair value in prepaid expenses and other current assets, miscellaneous otherassets or other long-term liabilities.
(5) Includes notes payable, current maturities of long-term debt and long-term debt included on the Consolidated balance sheet. The increase in debt obligations fromDecember 31, 2011 to December 31, 2012 was primarily due to net issuances of $1.2 billion.
Employee Benefit Plans The Company’s Profit Sharing and Savings Plan for U.S.-basedemployees includes a 401(k) feature, a regular employee matchfeature, and a discretionary employer profit sharing match. The 401(k)feature allows participants to make pretax contributions that arematched each pay period from shares released under the ESOP. TheProfit Sharing and Savings Plan also provides for a discretionaryemployer profit sharing match after the end of the year for thoseparticipants eligible to share in the match.
All current account balances and future contributions and relatedearnings can be invested in several investment alternatives as wellas McDonald’s common stock in accordance with each participant’selections. Participants’ contributions to the 401(k) feature and thediscretionary employer matching contribution feature are limited to20% investment in McDonald’s common stock. Participants maychoose to make separate investment choices for current accountbalances and for future contributions.
The Company also maintains certain supplemental benefit plansthat allow participants to (i) make tax-deferred contributions and(ii) receive Company-provided allocations that cannot be made underthe Profit Sharing and Savings Plan because of Internal RevenueService limitations. The investment alternatives and returns arebased on certain market-rate investmentalternatives under the Profit Sharing and Savings Plan. Total
liabilities were $493.5 million at December 31, 2012, and $482.5million at December 31, 2011, and were primarily included in otherlong-term liabilities on the Consolidated balance sheet.
The Company has entered into derivative contracts to hedgemarket-driven changes in certain of the liabilities. At December 31,2012, derivatives with a fair value of $132.3 million indexed to theCompany's stock and an investment totaling $123.8 million indexed tocertain market indices were included in prepaid expenses and othercurrent assets on the Consolidated balance sheet. All changes inliabilities for these nonqualified plans and in the fair value of thederivatives are recorded in Selling, general & administrativeexpenses. Changes in fair value of the derivatives indexed to theCompany’s stock are recorded in the income statement because thecontracts provide the counterparty with a choice to settle in cash orshares.
Total U.S. costs for the Profit Sharing and Savings Plan, includingnonqualified benefits and related hedging activities, were (inmillions): 2012–$27.9; 2011–$41.3; 2010–$51.4. Certain subsidiariesoutside the U.S. also offer profit sharing, stock purchase or othersimilar benefit plans. Total plan costs outside the U.S. were (inmillions): 2012–$62.5; 2011–$58.3; 2010–$57.6.
The total combined liabilities for international retirement planswere $77.7 million and $125.4 million at December 31, 2012 and2011, respectively.
Other postretirement benefits and post-employment benefits wereimmaterial.
McDonald's Corporation 2012 Annual Report 41
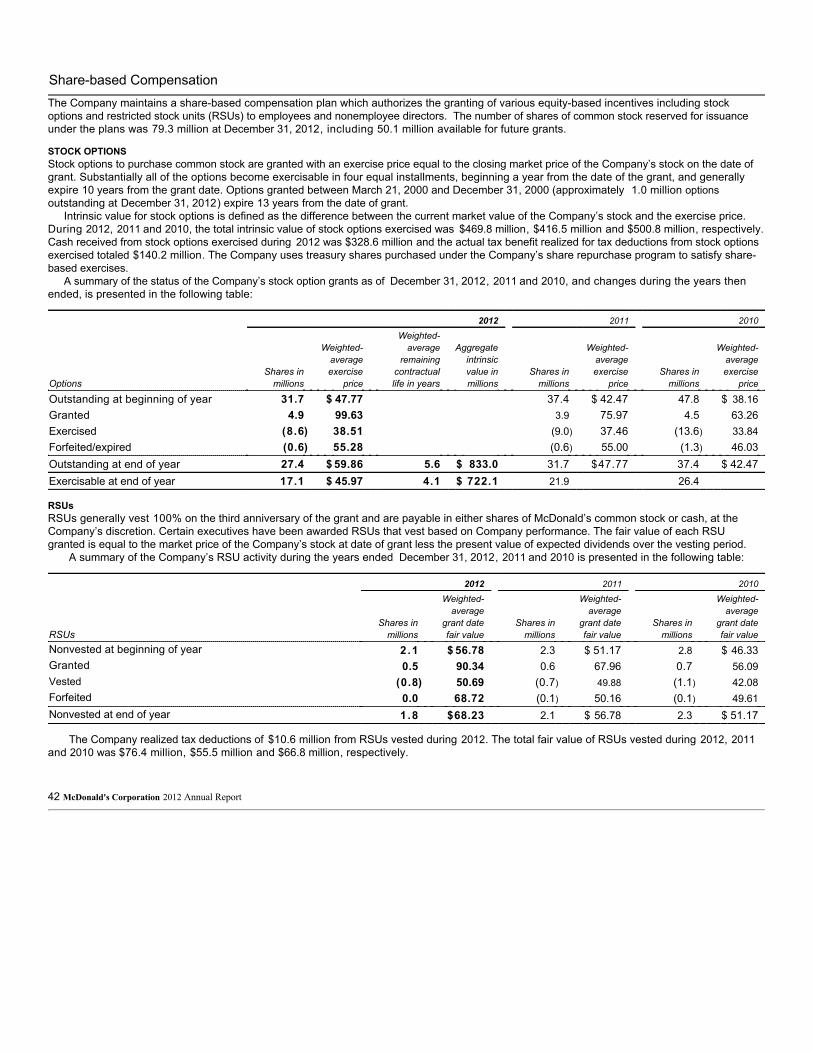
Share-based Compensation The Company maintains a share-based compensation plan which authorizes the granting of various equity-based incentives including stockoptions and restricted stock units (RSUs) to employees and nonemployee directors. The number of shares of common stock reserved for issuanceunder the plans was 79.3 million at December 31, 2012, including 50.1 million available for future grants.
STOCK OPTIONSStock options to purchase common stock are granted with an exercise price equal to the closing market price of the Company’s stock on the date ofgrant. Substantially all of the options become exercisable in four equal installments, beginning a year from the date of the grant, and generallyexpire 10 years from the grant date. Options granted between March 21, 2000 and December 31, 2000 (approximately 1.0 million optionsoutstanding at December 31, 2012) expire 13 years from the date of grant.
Intrinsic value for stock options is defined as the difference between the current market value of the Company’s stock and the exercise price.During 2012, 2011 and 2010, the total intrinsic value of stock options exercised was $469.8 million, $416.5 million and $500.8 million, respectively.Cash received from stock options exercised during 2012 was $328.6 million and the actual tax benefit realized for tax deductions from stock optionsexercised totaled $140.2 million. The Company uses treasury shares purchased under the Company’s share repurchase program to satisfy share-based exercises.
A summary of the status of the Company’s stock option grants as of December 31, 2012, 2011 and 2010, and changes during the years thenended, is presented in the following table:
2012 2011 2010
OptionsShares in
millions
Weighted-averageexercise
price
Weighted-average
remainingcontractuallife in years
Aggregateintrinsicvalue inmillions
Shares inmillions
Weighted-averageexercise
price Shares in
millions
Weighted-averageexercise
price Outstanding at beginning of year 31.7 $ 47.77 37.4 $ 42.47 47.8 $ 38.16Granted 4.9 99.63 3.9 75.97 4.5 63.26Exercised (8.6) 38.51 (9.0) 37.46 (13.6) 33.84Forfeited/expired (0.6) 55.28 (0.6) 55.00 (1.3) 46.03Outstanding at end of year 27.4 $ 59.86 5.6 $ 833.0 31.7 $47.77 37.4 $ 42.47Exercisable at end of year 17.1 $ 45.97 4.1 $ 722.1 21.9 26.4
RSUsRSUs generally vest 100% on the third anniversary of the grant and are payable in either shares of McDonald’s common stock or cash, at theCompany’s discretion. Certain executives have been awarded RSUs that vest based on Company performance. The fair value of each RSUgranted is equal to the market price of the Company’s stock at date of grant less the present value of expected dividends over the vesting period.
A summary of the Company’s RSU activity during the years ended December 31, 2012, 2011 and 2010 is presented in the following table:
2012 2011 2010
RSUsShares in
millions
Weighted-average
grant datefair value
Shares inmillions
Weighted-average
grant datefair value
Shares inmillions
Weighted-average
grant datefair value
Nonvested at beginning of year 2.1 $ 56.78 2.3 $ 51.17 2.8 $ 46.33Granted 0.5 90.34 0.6 67.96 0.7 56.09Vested (0.8) 50.69 (0.7) 49.88 (1.1) 42.08Forfeited 0.0 68.72 (0.1) 50.16 (0.1) 49.61Nonvested at end of year 1.8 $68.23 2.1 $ 56.78 2.3 $ 51.17
The Company realized tax deductions of $10.6 million from RSUs vested during 2012. The total fair value of RSUs vested during 2012, 2011and 2010 was $76.4 million, $55.5 million and $66.8 million, respectively.
42 McDonald's Corporation 2012 Annual Report

Quarterly Results (Unaudited)
Quarters endedDecember 31
Quarters endedSeptember 30
Quarters endedJune 30
Quarters endedMarch 31
In millions, except pershare data 2012 2011 2012 2011 2012 2011 2012 2011
Revenues Sales by Company-operatedrestaurants $ 4,658.4 $ 4,587.2 $ 4,838.4 $ 4,855.5 $ 4,673.5 $ 4,697.4 $ 4,432.2 $ 4,152.7Revenues fromfranchised restaurants 2,293.7 2,235.5 2,314.0 2,310.8 2,242.4 2,208.0 2,114.4 1,958.9
Total revenues 6,952.1 6,822.7 7,152.4 7,166.3 6,915.9 6,905.4 6,546.6 6,111.6Company-operatedmargin 827.3 856.1 924.0 972.2 849.7 890.6 777.8 736.0Franchised margin 1,901.0 1,857.5 1,930.6 1,934.6 1,866.2 1,835.0 1,739.7 1,604.6Operating income 2,197.8 2,120.0 2,287.2 2,394.7 2,155.0 2,189.1 1,964.6 1,825.9Net income $ 1,396.1 $ 1,376.6 $ 1,455.0 $ 1,507.3 $ 1,347.0 $ 1,410.2 $ 1,266.7 $ 1,209.0Earnings percommon share—basic $ 1.39 $ 1.35 $ 1.45 $ 1.47 $ 1.33 $ 1.36 $ 1.24 $ 1.16Earnings percommon share—diluted $ 1.38 $ 1.33 $ 1.43 $ 1.45 $ 1.32 $ 1.35 $ 1.23 $ 1.15Dividends declaredper common share $ 1.47 (1) $ 1.31 (2) $ 0.70 $ 0.61 $ 0.70 $ 0.61Weighted-averagedcommon shares—basic 1,002.4 1,022.0 1,006.1 1,028.8 1,013.8 1,035.6 1,018.2 1,042.4Weighted-averagedcommon shares—diluted 1,010.7 1,034.7 1,015.4 1,041.3 1,023.9 1,047.7 1,030.0 1,054.6Market price percommonshare: High $ 94.16 $ 101.00 $ 94.00 $ 91.22 $ 99.50 $ 84.91 $ 102.22 $ 77.59Low 83.31 83.74 86.15 82.01 85.92 75.66 95.13 72.14Close 88.21 100.33 91.75 87.82 88.53 84.32 98.10 76.09(1) Includes a $0.70 per share dividend declared and paid in third quarter and a $0.77 per share dividend declared in third quarter and paid in fourth quarter.(2) Includes a $0.61 per share dividend declared and paid in third quarter and a $0.70 per share dividend declared in third quarter and paid in fourth quarter.
McDonald's Corporation 2012 Annual Report 43
Management’s Assessment of Internal Control Over Financial Reporting The financial statements were prepared by management, which is responsible for their integrity and objectivity and for establishing andmaintaining adequate internal controls over financial reporting.
The Company’s internal control over financial reporting is designed to provide reasonable assurance regarding the reliability of financial reportingand the preparation of financial statements for external purposes in accordance with generally accepted accounting principles. The Company’sinternal control over financial reporting includes those policies and procedures that:
I. pertain to the maintenance of records that, in reasonable detail, accurately and fairly reflect the transactions and dispositions of the assetsof the Company;
II. provide reasonable assurance that transactions are recorded as necessary to permit preparation of financial statements in accordance withgenerally accepted accounting principles, and that receipts and expenditures of the Company are being made only in accordance withauthorizations of management and directors of the Company; and
III. provide reasonable assurance regarding prevention or timely detection of unauthorized acquisition, use or disposition of the Company’sassets that could have a material effect on the financial statements.
There are inherent limitations in the effectiveness of any internal control, including the possibility of human error and the circumvention oroverriding of controls. Accordingly, even effective internal controls can provide only reasonable assurances with respect to financial statementpreparation. Further, because of changes in conditions, the effectiveness of internal controls may vary over time.
Management assessed the design and effectiveness of the Company’s internal control over financial reporting as of December 31, 2012. Inmaking this assessment, management used the criteria set forth by the Committee of Sponsoring Organizations of the Treadway Commission(“COSO”) in Internal Control – Integrated Framework.
Based on management’s assessment using those criteria, as of December 31, 2012, management believes that the Company’s internal controlover financial reporting is effective.
Ernst & Young, LLP, independent registered public accounting firm, has audited the financial statements of the Company for the fiscal yearsended December 31, 2012, 2011 and 2010 and the Company’s internal control over financial reporting as of December 31, 2012. Their reports arepresented on the following pages. The independent registered public accountants and internal auditors advise management of the results of theiraudits, and make recommendations to improve the system of internal controls. Management evaluates the audit recommendations and takesappropriate action.
McDONALD’S CORPORATIONFebruary 25, 2013
44 McDonald's Corporation 2012 Annual Report

Report of Independent Registered Public Accounting Firm The Board of Directors and Shareholders of McDonald’s Corporation
We have audited the accompanying consolidated balance sheets of McDonald’s Corporation as of December 31, 2012 and 2011, and the relatedconsolidated statements of income, comprehensive income, shareholders’ equity, and cash flows for each of the three years in the period endedDecember 31, 2012. These financial statements are the responsibility of the Company’s management. Our responsibility is to express an opinionon these financial statements based on our audits.
We conducted our audits in accordance with the standards of the Public Company Accounting Oversight Board (United States). Those standardsrequire that we plan and perform the audit to obtain reasonable assurance about whether the financial statements are free of materialmisstatement. An audit includes examining, on a test basis, evidence supporting the amounts and disclosures in the financial statements. Anaudit also includes assessing the accounting principles used and significant estimates made by management, as well as evaluating the overallfinancial statement presentation. We believe that our audits provide a reasonable basis for our opinion.
In our opinion, the financial statements referred to above present fairly, in all material respects, the consolidated financial position of McDonald’sCorporation at December 31, 2012 and 2011, and the consolidated results of its operations and its cash flows for each of the three years in theperiod ended December 31, 2012, in conformity with U.S. generally accepted accounting principles.
We also have audited, in accordance with the standards of the Public Company Accounting Oversight Board (United States), McDonald’sCorporation’s internal control over financial reporting as of December 31, 2012, based on criteria established in Internal Control-IntegratedFramework issued by the Committee of Sponsoring Organizations of the Treadway Commission, and our report dated February 25, 2013,expressed an unqualified opinion thereon.
ERNST & YOUNG LLP
Chicago, IllinoisFebruary 25, 2013
McDonald's Corporation 2012 Annual Report 45

Report of Independent Registered Public Accounting Firm on Internal Control Over Financial Reporting The Board of Directors and Shareholders of McDonald’s Corporation
We have audited McDonald’s Corporation’s internal control over financial reporting as of December 31, 2012, based on criteria established inInternal Control – Integrated Framework issued by the Committee of Sponsoring Organizations of the Treadway Commission (the COSO criteria).McDonald’s Corporation’s management is responsible for maintaining effective internal control over financial reporting, and for its assessment ofthe effectiveness of internal control over financial reporting included in the accompanying report on Management’s Assessment of Internal Controlover Financial Reporting. Our responsibility is to express an opinion on the Company’s internal control over financial reporting based on our audit.
We conducted our audit in accordance with the standards of the Public Company Accounting Oversight Board (United States). Those standardsrequire that we plan and perform the audit to obtain reasonable assurance about whether effective internal control over financial reporting wasmaintained in all material respects. Our audit included obtaining an understanding of internal control over financial reporting, assessing the riskthat a material weakness exists, testing and evaluating the design and operating effectiveness of internal control based on the assessed risk, andperforming such other procedures as we considered necessary in the circumstances. We believe that our audit provides a reasonable basis for ouropinion.
A company’s internal control over financial reporting is a process designed to provide reasonable assurance regarding the reliability of financialreporting and the preparation of financial statements for external purposes in accordance with generally accepted accounting principles. Acompany’s internal control over financial reporting includes those policies and procedures that (1) pertain to the maintenance of records that, inreasonable detail, accurately and fairly reflect the transactions and dispositions of the assets of the company; (2) provide reasonable assurancethat transactions are recorded as necessary to permit preparation of financial statements in accordance with generally accepted accountingprinciples, and that receipts and expenditures of the company are being made only in accordance with authorizations of management anddirectors of the company; and (3) provide reasonable assurance regarding prevention or timely detection of unauthorized acquisition, use, ordisposition of the company’s assets that could have a material effect on the financial statements.
Because of its inherent limitations, internal control over financial reporting may not prevent or detect misstatements. Also, projections of anyevaluation of effectiveness to future periods are subject to the risk that controls may become inadequate because of changes in conditions, or thatthe degree of compliance with the policies or procedures may deteriorate.
In our opinion, McDonald’s Corporation maintained, in all material respects, effective internal control over financial reporting as of December 31,2012, based on the COSO criteria.
We also have audited, in accordance with the standards of the Public Company Accounting Oversight Board (United States), the consolidatedfinancial statements of McDonald’s Corporation as of December 31, 2012 and 2011 and for each of the three years in the period endedDecember 31, 2012, and our report dated February 25, 2013, expressed an unqualified opinion thereon.
ERNST & YOUNG LLP
Chicago, IllinoisFebruary 25, 2013
46 McDonald's Corporation 2012 Annual Report

ITEM 9. Changes in and Disagreements WithAccountants on Accounting and Financial Disclosure None.
ITEM 9A. Controls and Procedures DISCLOSURE CONTROLSAn evaluation was conducted under the supervision and with theparticipation of the Company’s management, including the ChiefExecutive Officer ("CEO") and Chief Financial Officer ("CFO"), of theeffectiveness of the design and operation of the Company’s disclosurecontrols and procedures as of December 31, 2012. Based on thatevaluation, the CEO and CFO concluded that the Company’sdisclosure controls and procedures were effective as of such date toensure that information required to be disclosed in the reports that itfiles or submits under the Exchange Act is recorded, processed,summarized and reported within the time periods specified in SECrules and forms.
INTERNAL CONTROL OVER FINANCIAL REPORTINGThe Company’s management, including the CEO and CFO, confirmthat there was no change in the Company’s internal control overfinancial reporting during the quarter ended December 31, 2012 thathas materially affected, or is reasonably likely to materially affect, theCompany’s internal control over financial reporting.
MANAGEMENT’S REPORTManagement’s Report and the Report of Independent RegisteredPublic Accounting Firm on Internal Control Over Financial Reportingare set forth in Part II, Item 8 of this Form 10-K.
ITEM 9B. Other Information None.
PART III ITEM 10. Directors, Executive Officers and CorporateGovernance Information regarding directors and the Company’s Code of Conductfor the Board of Directors, its Code of Ethics for Chief Executive Officerand Senior Financial Officers and its Standards of Business Conductis incorporated herein by reference from the Company’s definitiveproxy statement, which will be filed no later than 120 days afterDecember 31, 2012. We will post any amendments to or any waiversfor directors and executive officers from provisions of the Codes on theCompany’s website at www.governance.mcdonalds.com.
Information regarding all of the Company’s executive officers isincluded in Part I, page 7 of this Form 10-K.
ITEM 11. Executive Compensation Incorporated herein by reference from the Company’s definitive proxystatement, which will be filed no later than 120 days afterDecember 31, 2012.
ITEM 12. Security Ownership of Certain Beneficial Owners and Management and Related Shareholder Matters The following table summarizes information about the Company’s equity compensation plans as of December 31, 2012. All outstanding awardsrelate to the Company’s common stock. Shares issued under all of the following plans may be from the Company’s treasury, newly issued or both.
Equity compensation plan information
Number of securitiesto be issued upon
exercise ofoutstanding options,warrants and rights
Weighted-averageexercise price of
outstanding options,warrants and rights
Number of securitiesremaining available forfuture issuance under
equity compensation plans(excluding securities
reflected in column (a))
Plan category (a) (b) (c)Equity compensation plans approved by security holders 28,055,729 (1) $ 61.40 50,082,309Equity compensation plans not approved by security holders 1,136,755 (2) 34.78
Total 29,192,484 $ 60.36 50,082,309(1) Includes 26,130,805 stock options and 1,742,724 restricted stock units granted under the McDonald’s Corporation 2001 Omnibus Stock Ownership Plan and 172,462
stock options and 9,738 restricted stock units granted under the McDonald's Corporation 2012 Omnibus Stock Ownership Plan.(2) Includes stock options granted under the following plans: 1992 Plan—1,099,677; and 1975 Stock Ownership Option Plan- 37,078.
Additional matters incorporated herein by reference from the Company’s definitive proxy statement, which will be filed no later than 120 daysafter December 31, 2012.
McDonald's Corporation 2012 Annual Report 47
ITEM 13. Certain Relationships and RelatedTransactions, and Director Independence Incorporated herein by reference from the Company’s definitive proxystatement, which will be filed no later than 120 days afterDecember 31, 2012.
ITEM 14. Principal Accountant Fees and Services Incorporated herein by reference from the Company’s definitive proxystatement, which will be filed no later than 120 days afterDecember 31, 2012.
PART IV ITEM 15. Exhibits and Financial Statement Schedules a. ( 1 ) All financial statements Consolidated financial statements filed as part of this report are listed under Part II, Item 8, pages 27 through 42 of this Form 10-K. ( 2 ) Financial statement schedules
No schedules are required because either the required information is not present or is not present in amounts sufficient to requiresubmission of the schedule, or because the information required is included in the consolidated financial statements or the notes thereto.
b. Exhibits
The exhibits listed in the accompanying index are filed as part of this report.
McDonald’s Corporation Exhibit Index (Item 15) Exhibit Number Description
(3) (a) Restated Certificate of Incorporation, effective as of June 14, 2012, incorporated herein by reference from Form 10-Q, for the
quarter ended June 30, 2012.
(b) By-Laws, as amended and restated with effect as of July 19, 2012, incorporated herein by reference from Form 8-K, filedJuly 20, 2012.
(4) Instruments defining the rights of security holders, including Indentures:*
(a) Senior Debt Securities Indenture, incorporated herein by reference from Exhibit (4)(a) of Form S-3 Registration Statement(File No. 333-14141), filed October 15, 1996.
(i) 6 3/8% Debentures due 2028. Supplemental Indenture No. 1, dated January 8, 1998, incorporated herein byreference from Exhibit (4)(a) of Form 8-K, filed January 13, 1998.
(ii) Medium-Term Notes, Series F, Due from 1 Year to 60 Years from Date of Issue. Supplemental Indenture No. 4,incorporated herein by reference from Exhibit (4)(c) of Form S-3 Registration Statement (File No. 333-59145), filedJuly 15, 1998.
(iii) Medium-Term Notes, Series H, Due from 1 Year to 60 Years from Date of Issue. Supplemental Indenture No. 7,incorporated herein by reference from Exhibit (4)(c) of Form S-3 Registration Statement (File No. 333-92212), filedJuly 10, 2002.
(iv) Medium-Term Notes, Series I, Due from 1 Year to 60 Years from Date of Issue. Supplemental Indenture No. 8,incorporated herein by reference from Exhibit (4)(c) of Form S-3 Registration Statement (File No. 333-139431), filedDecember 15, 2006.
(v) Medium-Term Notes, Due from One Year to 60 Years from Date of Issue. Supplemental Indenture No. 9, incorporatedherein by reference from Exhibit (4)(c) of Form S-3 Registration Statement (File No. 333-162182), filed September28, 2009.
(b) Subordinated Debt Securities Indenture, incorporated herein by reference from Exhibit (4)(b) of Form S-3 RegistrationStatement (File No. 333-14141), filed October 15, 1996.
(10) Material Contracts
(a) Directors’ Deferred Compensation Plan, effective as of January 1, 2008, incorporated herein by reference from Form 8-K,filed December 4, 2007.**
(b) McDonald’s Excess Benefit and Deferred Bonus Plan, effective January 1, 2011, as amended and restatedMarch 22, 2010, incorporated herein by reference from Form 10-Q, for the quarter ended March 31, 2010.**
(c) McDonald’s Corporation Supplemental Profit Sharing and Savings Plan, effective as of September 1, 2001, incorporatedherein by reference from Form 10-K, for the year ended December 31, 2001.**
(i) First Amendment to the McDonald’s Corporation Supplemental Profit Sharing and Savings Plan, effective as ofJanuary 1, 2002, incorporated herein by reference from Form 10-K, for the year ended December 31, 2002.**
(ii) Second Amendment to the McDonald’s Corporation Supplemental Profit Sharing and Savings Plan, effective

January 1, 2005, incorporated herein by reference from Form 10-K, for the year ended December 31, 2004.**
48 McDonald's Corporation 2012 Annual Report

(d) 1975 Stock Ownership Option Plan, as amended and restated July 30, 2001, incorporated herein by reference from Form
10-Q, for the quarter ended September 30, 2001.**
(i) First Amendment to McDonald’s Corporation 1975 Stock Ownership Option Plan, as amended and restated, effectiveas of February 14, 2007, incorporated herein by reference from Form 10-Q, for the quarter ended March 31, 2007.**
(e) 1992 Stock Ownership Incentive Plan, as amended and restated January 1, 2001, incorporated herein by reference fromForm 10-Q, for the quarter ended March 31, 2001.**
(i) First Amendment to McDonald’s Corporation 1992 Stock Ownership Incentive Plan, as amended and restated,effective as of February 14, 2007, incorporated herein by reference from Form 10-Q, for the quarter endedMarch 31, 2007.**
(f) McDonald’s Corporation Executive Retention Replacement Plan, effective as of December 31, 2007 (as amended andrestated on December 31, 2008), incorporated herein by reference from Form 10-K, for the year endedDecember 31, 2008.**
(g) McDonald’s Corporation Amended and Restated 2001 Omnibus Stock Ownership Plan, effective July 1, 2008, incorporatedherein by reference from Form 10-Q, for the quarter ended June 30, 2009.**
(i) First amendment to the McDonald’s Corporation Amended and Restated 2001 Omnibus Stock Ownership Plan,incorporated herein by reference from Form 10-K, for the year ended December 31, 2008.**
(ii) Second Amendment to the McDonald’s Corporation Amended and Restated 2001 Omnibus Stock Ownership Plan asamended, effective February 9, 2011, incorporated herein by reference from Form 10-K, for the year endedDecember 31, 2010.**
(h) McDonald's Corporation 2012 Omnibus Stock Ownership Plan, effective June 1, 2012, incorporated herein by referencefrom Form 10-Q, for the quarter ended September 30, 2012.**
(i) Form of McDonald's Corporation Tier I Change of Control Employment Agreement, incorporated herein by reference fromForm 10-Q, for the quarter ended September 30, 2008.**
(j) McDonald’s Corporation 2009 Cash Incentive Plan, effective as of May 27, 2009, incorporated herein by reference fromForm 10-Q, for the quarter ended June 30, 2009.**
(k) Form of Executive Stock Option Grant Agreement in connection with the Amended and Restated 2001 Omnibus StockOwnership Plan, as amended, incorporated herein by reference from Form 10-K, for the year ended December 31, 2011.**
(l) Form of Executive Performance-based Restricted Stock Unit Award Agreement in connection with the Amended andRestated 2001 Omnibus Stock Ownership Plan, as amended, incorporated herein by reference from Form 10-K, for theyear ended December 31, 2011.**
(m) McDonald’s Corporation Severance Plan, effective January 1, 2008, incorporated by reference from Form 8-K, filedDecember 4, 2007.**
(i) First Amendment of McDonald’s Corporation Severance Plan, effective as of October 1, 2008, incorporated herein byreference from Form 10-Q, for the quarter ended September 30, 2008.**
(ii) Second Amendment of McDonald’s Corporation Severance Plan, effective as of December 5, 2011, incorporatedherein by reference from Form 10-K, for the year ended December 31, 2011.**
(n) Amended Assignment Agreement between Timothy Fenton and the Company, dated January 2008, incorporated herein byreference from Form 10-Q, for the quarter ended March 31, 2008.**
(i) 2009 Amendment to the Amended Assignment Agreement between Timothy Fenton and the Company, effective as ofJanuary 1, 2009, incorporated herein by reference from Form 10-Q, for the quarter ended March 31, 2009.**
(o) Description of Restricted Stock Units granted to Andrew J. McKenna, incorporated herein by reference from Form 10-Q, forthe quarter ended June 30, 2012.**
(p) Terms of the Restricted Stock Units granted pursuant to the Company’s Amended and Restated 2001 Omnibus StockOwnership Plan, incorporated herein by reference from Form 10-K, for the year ended December 31, 2010.**
(q) McDonald’s Corporation Target Incentive Plan, effective as of January 1, 2008, incorporated herein by reference from Form8-K, filed January 29, 2008.**
(r) McDonald’s Corporation Cash Performance Unit Plan 2010-2012, effective as of February 9, 2010, incorporated herein byreference from Form 8-K, filed February 16, 2010.**
(s) Executive Supplement describing the special terms of equity compensation awards granted to certain executive officers,pursuant to the Company’s Amended and Restated 2001 Omnibus Stock Ownership Plan, as amended, incorporatedherein by reference from Form 10-Q, for the quarter ended March 31, 2011.**
(t) Transaction Settlement Agreement between Denis Hennequin and the Company dated December 20, 2010 incorporatedherein by reference from Form 8-K, filed December 20, 2010.**
(12) Computation of Ratios.

(21) Subsidiaries of the Registrant.
McDonald's Corporation 2012 Annual Report 49

(23) Consent of Independent Registered Public Accounting Firm. (24) Power of Attorney. (31.1) Rule 13a-14(a) Certification of Chief Executive Officer. (31.2) Rule 13a-14(a) Certification of Chief Financial Officer.
(32.1) Certification pursuant to 18 U.S.C. Section 1350 by the Chief Executive Officer, as adopted pursuant to Section 906 of theSarbanes-Oxley Act of 2002.
(32.2) Certification pursuant to 18 U.S.C. Section 1350 by the Chief Executive Officer, as adopted pursuant to Section 906 of theSarbanes-Oxley Act of 2002.
(101.INS) XBRL Instance Document. (101.SCH) XBRL Taxonomy Extension Schema Document.
(101.CAL) XBRL Taxonomy Extension Calculation Linkbase Document.
(101.DEF) XBRL Taxonomy Extension Definition Linkbase Document.
(101.LAB) XBRL Taxonomy Extension Label Linkbase Document. (101.PRE) XBRL Taxonomy Extension Presentation Linkbase Document. * Other instruments defining the rights of holders of long-term debt of the registrant, and all of its subsidiaries for which consolidated financial
statements are required to be filed and which are not required to be registered with the Commission, are not included herein as the securitiesauthorized under these instruments, individually, do not exceed 10% of the total assets of the registrant and its subsidiaries on a consolidatedbasis. An agreement to furnish a copy of any such instruments to the Commission upon request has been filed with the Commission.
* * Denotes compensatory plan.
50 McDonald's Corporation 2012 Annual Report

Signatures Pursuant to the requirements of Section 13 or 15(d) of theSecurities Exchange Act of 1934, the registrant has duly causedthis report to be signed on its behalf by the undersigned,thereunto duly authorized.
McDonald’s Corporation(Registrant)
By /s/ Peter J. Bensen Peter J. Bensen Corporate Executive Vice President and Chief Financial Officer February 25, 2013
Date
Pursuant to the requirements of the Securities Exchange Act of1934, this report has been signed below by the followingpersons on behalf of the registrant and in their capacitiesindicated below on the 25th day of February, 2013:
Signature, Title
By /s/ Susan E. Arnold Susan E. Arnold Director By /s/ Peter J. Bensen Peter J. Bensen Corporate Executive Vice President and Chief Financial Officer (Principal Financial Officer) By /s/ Robert A. Eckert Robert A. Eckert Director By /s/ Enrique Hernandez, Jr. Enrique Hernandez, Jr. Director By Jeanne P. Jackson Director By /s/ Richard H. Lenny Richard H. Lenny Director By /s/ Walter E. Massey Walter E. Massey Director By /s/ Andrew J. McKenna Andrew J. McKenna Chairman of the Board and Director By /s/ Cary D. McMillan Cary D. McMillan Director
Signature, Title
By /s/ Kevin M. Ozan Kevin M. Ozan Corporate Senior Vice President – Controller (Principal Accounting Officer) By /s/ Sheila A. Penrose
Sheila A. Penrose Director By /s/ John W. Rogers, Jr.
John W. Rogers, Jr. Director By /s/ Roger W. Stone
Roger W. Stone Director By /s/ Donald Thompson Donald Thompson President, Chief Executive Officer and Director (Principal Executive Officer) By /s/ Miles D. White Miles D. White Director

McDonald's Corporation 2012 Annual Report 51

Exhibit 12. Computation of Ratios Ratio of Earnings to Fixed ChargesDollars in millions Years ended December 31, 2012 2011 2010 2009 2008Earnings available for fixed charges Income from continuing operations before provisionfor Income taxes and cumulative effect of accounting changes $ 8,079.0 $ 8,012.2 $ 7,000.3 $ 6,487.0 $ 6,158.0Noncontrolling interest expense in operating resultsof majority-owned subsidiaries less equity in undistributed operating results of less than50%-owned affiliates 11.1 13.3 10.4 7.5 10.7Income tax provision (benefit) of 50%-owned affiliates included in income from continuing operations before provision for income taxes 64.0 65.5 28.7 47.7 30.0Portion of rent charges (after reduction for rental income from subleased properties) considered to be representative of interest factors* 358.1 339.4 315.4 302.8 321.3Interest expense, amortization of debt discount and issuance costs, and depreciation of capitalizedinterest* 550.1 520.5 479.1 504.5 556.8 $ 9,062.3 $ 8,950.9 $ 7,833.9 $ 7,349.5 $ 7,076.8Fixed charges Portion of rent charges (after reduction for rentalincome from subleased properties) considered to be representative of interest factors* $ 358.1 $ 339.4 $ 315.4 $ 302.8 $ 321.3Interest expense, amortization of debt discount and issuance costs* 532.8 503.0 461.5 486.9 539.7Capitalized interest* 16.1 14.0 12.0 11.9 12.5 $ 907.0 $ 856.4 $ 788.9 $ 801.6 $ 873.5Ratio of earnings to fixed charges 9.99 10.45 9.93 9.17 8.10* Includes amounts of the Company and its majority-owned subsidiaries, and one-half of the amounts of 50%-owned affiliates. The Company records interest expense
on unrecognized tax benefits in the provision for income taxes. This interest is not included in the computation of fixed charges.
Return on Average Assets Dollars in millions Years ended December 31, 2012 2011 2010Operating income $ 8,604.6 $ 8,529.7 $ 7,473.1Average assets(1) $ 33,934.2 $ 32,861.1 $ 30,294.9Return on average assets 25.4% 26.0% 24.7%(1) Represents the average of the month-end balances of total assets for the past 13 months.
Return on Average Common Equity Dollars in millions Years ended December 31, 2012 2011 2010Net income $ 5,464.8 $ 5,503.1 $ 4,946.3Average shareholders' equity (1) $ 14,562.8 $ 14,585.4 $ 14,021.9Return on average common equity 37.5% 37.7% 35.3%(1) Represents the average of the month-end balances of shareholders' equity for the past 13 months.
Fixed-rate Debt as a Percent of Total Debt Dollars in millions Years ended December 31, 2012 2011 2010Total debt obligations $ 13,632.5 $ 12,500.4 $ 11,505.3Fair value adjustments (1) 42.3 55.9 77.4Debt obligations before fair value adjustments $ 13,590.2 $ 12,444.5 $ 11,427.9Fixed-rate debt(2) $ 10,102.6 $ 8,562.3 $ 7,546.5Fixed-rate debt as a percent of total debt 74% 69% 66%(1) Reflects adjustments to the carrying value of debt obligations related to fair value hedges. These adjustments are excluded as they do not affect the amount of
obligations at maturity. See Debt financing note to the consolidated financial statements.(2) Includes the effect of interest rate swaps.
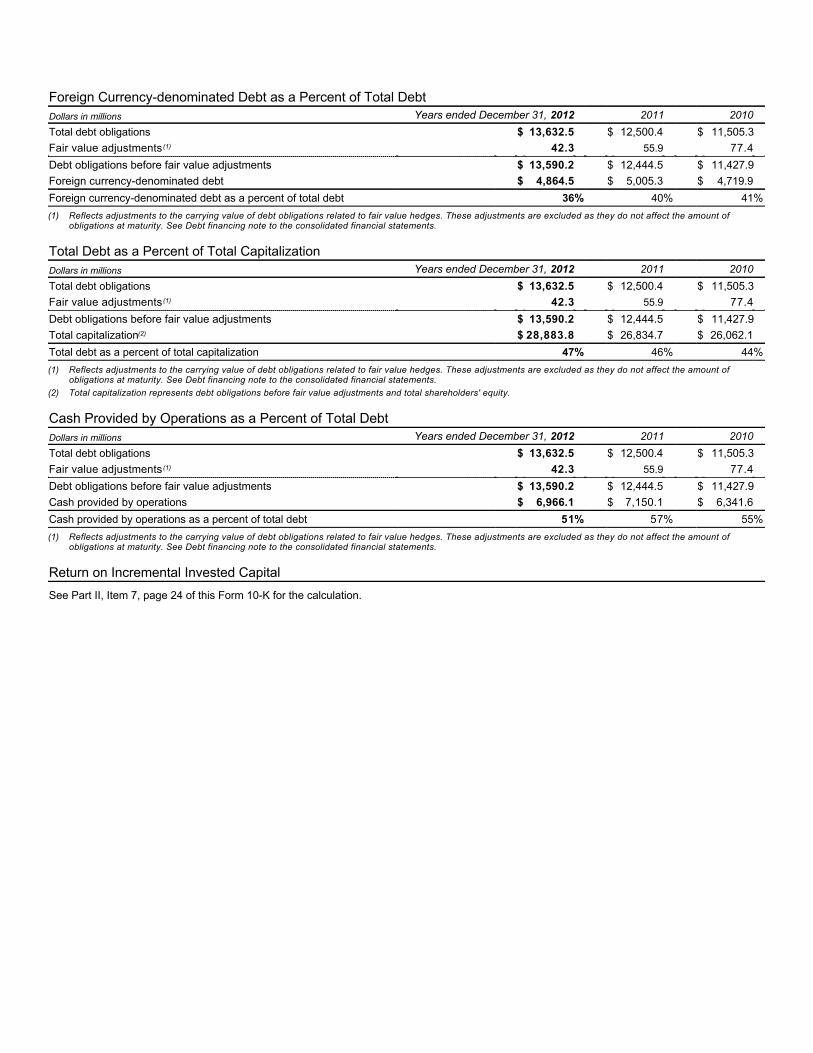
Foreign Currency-denominated Debt as a Percent of Total Debt Dollars in millions Years ended December 31, 2012 2011 2010Total debt obligations $ 13,632.5 $ 12,500.4 $ 11,505.3Fair value adjustments (1) 42.3 55.9 77.4Debt obligations before fair value adjustments $ 13,590.2 $ 12,444.5 $ 11,427.9Foreign currency-denominated debt $ 4,864.5 $ 5,005.3 $ 4,719.9Foreign currency-denominated debt as a percent of total debt 36% 40% 41%(1) Reflects adjustments to the carrying value of debt obligations related to fair value hedges. These adjustments are excluded as they do not affect the amount of
obligations at maturity. See Debt financing note to the consolidated financial statements.
Total Debt as a Percent of Total Capitalization Dollars in millions Years ended December 31, 2012 2011 2010Total debt obligations $ 13,632.5 $ 12,500.4 $ 11,505.3Fair value adjustments (1) 42.3 55.9 77.4Debt obligations before fair value adjustments $ 13,590.2 $ 12,444.5 $ 11,427.9Total capitalization(2) $ 28,883.8 $ 26,834.7 $ 26,062.1Total debt as a percent of total capitalization 47% 46% 44%(1) Reflects adjustments to the carrying value of debt obligations related to fair value hedges. These adjustments are excluded as they do not affect the amount of
obligations at maturity. See Debt financing note to the consolidated financial statements.(2) Total capitalization represents debt obligations before fair value adjustments and total shareholders' equity.
Cash Provided by Operations as a Percent of Total Debt Dollars in millions Years ended December 31, 2012 2011 2010Total debt obligations $ 13,632.5 $ 12,500.4 $ 11,505.3Fair value adjustments (1) 42.3 55.9 77.4Debt obligations before fair value adjustments $ 13,590.2 $ 12,444.5 $ 11,427.9Cash provided by operations $ 6,966.1 $ 7,150.1 $ 6,341.6Cash provided by operations as a percent of total debt 51% 57% 55%(1) Reflects adjustments to the carrying value of debt obligations related to fair value hedges. These adjustments are excluded as they do not affect the amount of
obligations at maturity. See Debt financing note to the consolidated financial statements.
Return on Incremental Invested Capital See Part II, Item 7, page 24 of this Form 10-K for the calculation.

Exhibit 21. Subsidiaries of the Registrant Name of Subsidiary [State or Country of Incorporation]
Domestic SubsidiariesGolden Arches UK, LLC [Delaware]McD Asia Pacific, LLC [Delaware]McDonald's Deutschland, Inc. [Delaware]McDonald's Development Italy, Inc. [Delaware]McDonald's International Property Company, Ltd. [Delaware]McDonald's Real Estate Company [Delaware]McDonald's Sistemas de Espana, Inc. [Delaware]McDonald's USA, LLC [Delaware]
Foreign Subsidiaries3267114 Nova Scotia Company [Canada]Closed Joint Stock Company “Moscow-McDonald's” [Russia]Golden Arches Restaurants Sdn. Bhd. [Malaysia]Guangdong Sanyuan McDonald's Food Company Limited [China]*HanGook McDonald's Co. Ltd. [South Korea]Klinger Grundstücksverwaltungsgesellschaft m.b.H. [Austria]Limited Liability Company “McDonald's” [Russia]McD APMEA Franchising Pte. Ltd. [Singapore]McD APMEA Holdings Pte. Ltd. [Singapore]McD Europe Franchising S.à r.l. [Luxembourg]McD Luxembourg Holdings S.à r.l. [Luxembourg]McDonald's (China) Company Limited [China]McDonald's (Tianjin) Foods Company Limited [China]McDonald's Australia Limited [Australia]McDonald's Central Europe GmbH [Austria]McDonald's Danmark ApS [Denmark]McDonald's France, S.A.S. [France]McDonald's Franchise GmbH [Austria]McDonald's Gesellschaft m.b.H. [Austria]McDonald's GmbH [Germany]McDonald's Immobilien GmbH [Germany]McDonald's Liegenschaftsverwaltungs Gesellschaft m.b.H. [Austria]McDonald's Nederland B.V. [Netherlands]McDonald's Norge A/S [Norway]McDonald's Polska Sp. z o.o [Poland]McDonald's Real Estate LLP [United Kingdom]McDonald's Restaurants (Hong Kong) Limited [Hong Kong]McDonald's Restaurants (New Zealand) Limited [New Zealand]McDonald's Restaurants (Shenzhen) Company Limited [China]McDonald's Restaurants (Taiwan) Co., Ltd. [Taiwan]McDonald's Restaurants Limited [United Kingdom]McDonald's Restaurants of Canada Limited [Canada]McDonald's Restaurants of Ireland Limited [Ireland]McDonald's Restaurants Pte. Ltd. [Singapore]McDonald's Suisse Development Sàrl [Switzerland]McDonald's Suisse Franchise Sàrl [Switzerland]McDonald's Suisse Holding Sàrl [Switzerland]McDonald's Suisse Restaurants Sàrl [Switzerland]McKim Corporation [South Korea]Restaurantes McDonald's, S.A. [Spain]Shanghai McDonald's Food Company Limited [China]Sistemas McDonald's Portugal Lda [Portugal]Svenska McDonald's AB [Sweden]Zero Five AS [Norway]
The names of certain subsidiaries have been omitted because they do not constitute significant subsidiaries. These include, but are not limited to: McDonald'sAPMEA, LLC [Delaware]; McDonald's Europe, Inc. [Delaware]; McDonald's International, LLC [Delaware]; McDonald's Latin America, LLC [Delaware]; andother domestic and foreign, direct and indirect subsidiaries of the registrant, including 49 wholly-owned subsidiaries of McDonald's USA, LLC, each of whichoperates one or more McDonald's restaurants within the United States and the District of Columbia.[ ] Brackets indicate state or country of incorporation and do not form part of corporate name.* This subsidiary is not wholly owned by the registrant.

Exhibit 23. Consent of Independent Registered Public Accounting Firm We consent to the incorporation by reference in the Registration Statements of McDonald's Corporation (listed below) and in the relatedprospectuses of our reports dated February 25, 2013 with respect to the consolidated financial statements of McDonald's Corporation and theeffectiveness of internal control over financial reporting of McDonald's Corporation, included in this Annual Report (Form 10-K) for the year endedDecember 31, 2012.
Commission File No. for Registration Statements Form S-8 Form S-3 33-09267 333-184198
333-36778 333-71656 333-115770 333-149990 333-177314
ERNST & YOUNG LLP
Chicago, IllinoisFebruary 25, 2013

Exhibit 24. Power of Attorney
Power of Attorney
KNOW ALL PERSONS BY THESE PRESENTS, that each of the undersigned, being a director or officer, or both, of McDonald's Corporation, aDelaware corporation (the “Company”), hereby constitutes and appoints Peter J. Bensen, Denise A. Horne, Kevin M. Ozan and Gloria Santona,and each one of them, as his or her true and lawful attorneys-in-fact and agents, with full power of substitution and resubstitution, for him or herand in his or her name, place and stead, in any and all capacities to execute any and all amendments to the Company's Annual Report on Form10-K for the fiscal year ended December 31, 2012, to be filed with the U.S. Securities and Exchange Commission by the Company under theSecurities Exchange Act of 1934, as amended, with all exhibits thereto, and other documents in connection therewith, granting unto saidattorneys-in-fact and agents, and each one of them, full power and authority to do and perform each and every act and thing requisite ornecessary to be done in and about the premises, as fully to all intents and purposes as he or she might or could do in person, hereby ratifying andconfirming all that said attorneys-in-fact and agents, or any one of them, or their or his or her substitutes, may lawfully do or cause to be done byvirtue hereof.
This Power of Attorney may be signed in any number of counterparts, each of which shall be an original, with the same effect as if thesignatures thereto and hereto were upon the same instrument.
IN WITNESS WHEREOF, each of the undersigned has executed this Power of Attorney on and as of the 25th day of February, 2013.
/s/ Susan E. Arnold /s/ Cary D. McMillanSusan E. Arnold Cary D. McMillan
Director Director
/s/ Peter J. Bensen /s/ Kevin M. OzanPeter J. Bensen Kevin M. Ozan
Corporate Executive Vice President and Chief Financial Officer Corporate Senior Vice President - Controller
/s/ Robert A. Eckert /s/ Sheila A. PenroseRobert A. Eckert Sheila A. Penrose
Director Director
/s/ Enrique Hernandez, Jr. /s/ John W. Rogers, Jr.Enrique Hernandez, Jr. John W. Rogers, Jr.
Director Director /s/ Roger W. Stone
Jeanne P. Jackson Roger W. StoneDirector Director
/s/ Richard H. Lenny /s/ Donald Thompson
Richard H. Lenny Donald ThompsonDirector President, Chief Executive Officer and Director
/s/ Walter E. Massey /s/ Miles D. White
Walter E. Massey Miles D. WhiteDirector Director
/s/ Andrew J. McKenna
Andrew J. McKenna Chairman of the Board and Director

Exhibit 31.1. Rule 13a-14(a) Certification of Chief Executive Officer I, Donald Thompson, certify that:
(1) I have reviewed this annual report on Form 10-K of McDonald’s Corporation;
(2) Based on my knowledge, this report does not contain any untrue statement of a material fact or omit to state a material fact necessary tomake the statements made, in light of the circumstances under which such statements were made, not misleading with respect to theperiod covered by this report;
(3) Based on my knowledge, the financial statements, and other financial information included in this report, fairly present in all materialrespects the financial condition, results of operations and cash flows of the registrant as of, and for, the periods presented in this report;
(4) The registrant’s other certifying officer(s) and I are responsible for establishing and maintaining disclosure controls and procedures (asdefined in Exchange Act Rules 13a-15(e) and 15d-15(e)) and internal control over financial reporting (as defined in Exchange Act Rules13a-15(f) and 15d-15(f)) for the registrant and have:
(a) Designed such disclosure controls and procedures, or caused such disclosure controls and procedures to be designed under oursupervision, to ensure that material information relating to the registrant, including its consolidated subsidiaries, is made knownto us by others within those entities, particularly during the period in which this report is being prepared;
(b) Designed such internal control over financial reporting, or caused such internal control over financial reporting to be designedunder our supervision, to provide reasonable assurance regarding the reliability of financial reporting and the preparation offinancial statements for external purposes in accordance with generally accepted accounting principles;
(c) Evaluated the effectiveness of the registrant’s disclosure controls and procedures and presented in this report our conclusionsabout the effectiveness of the disclosure controls and procedures, as of the end of the period covered by this report based on suchevaluation; and
(d) Disclosed in this report any change in the registrant’s internal control over financial reporting that occurred during theregistrant’s most recent fiscal quarter (the registrant’s fourth fiscal quarter in the case of an annual report) that has materiallyaffected, or is reasonably likely to materially affect, the registrant’s internal control over financial reporting; and
(5) The registrant’s other certifying officer(s) and I have disclosed, based on our most recent evaluation of internal control over financialreporting, to the registrant’s auditors and the audit committee of the registrant’s board of directors (or persons performing the equivalentfunctions):
(a) All significant deficiencies and material weaknesses in the design or operation of internal control over financial reporting whichare reasonably likely to adversely affect the registrant’s ability to record, process, summarize and report financial information;and
(b) Any fraud, whether or not material, that involves management or other employees who have a significant role in the registrant’sinternal control over financial reporting.
Date: February 25, 2013
/s/ Donald ThompsonDonald Thompson
President and Chief Executive Officer

Exhibit 31.2. Rule 13a-14(a) Certification of Chief Financial Officer I, Peter J. Bensen, certify that:
(1) I have reviewed this annual report on Form 10-K of McDonald’s Corporation;
(2) Based on my knowledge, this report does not contain any untrue statement of a material fact or omit to state a material fact necessary tomake the statements made, in light of the circumstances under which such statements were made, not misleading with respect to theperiod covered by this report;
(3) Based on my knowledge, the financial statements, and other financial information included in this report, fairly present in all materialrespects the financial condition, results of operations and cash flows of the registrant as of, and for, the periods presented in this report;
(4) The registrant’s other certifying officer(s) and I are responsible for establishing and maintaining disclosure controls and procedures (asdefined in Exchange Act Rules 13a-15(e) and 15d-15(e)) and internal control over financial reporting (as defined in Exchange Act Rules13a-15(f) and 15d-15(f)) for the registrant and have:
(a) Designed such disclosure controls and procedures, or caused such disclosure controls and procedures to be designed under oursupervision, to ensure that material information relating to the registrant, including its consolidated subsidiaries, is made knownto us by others within those entities, particularly during the period in which this report is being prepared;
(b) Designed such internal control over financial reporting, or caused such internal control over financial reporting to be designedunder our supervision, to provide reasonable assurance regarding the reliability of financial reporting and the preparation offinancial statements for external purposes in accordance with generally accepted accounting principles;
(c) Evaluated the effectiveness of the registrant’s disclosure controls and procedures and presented in this report our conclusionsabout the effectiveness of the disclosure controls and procedures, as of the end of the period covered by this report based on suchevaluation; and
(d) Disclosed in this report any change in the registrant’s internal control over financial reporting that occurred during theregistrant’s most recent fiscal quarter (the registrant’s fourth fiscal quarter in the case of an annual report) that has materiallyaffected, or is reasonably likely to materially affect, the registrant’s internal control over financial reporting; and
(5) The registrant’s other certifying officer(s) and I have disclosed, based on our most recent evaluation of internal control over financialreporting, to the registrant’s auditors and the audit committee of the registrant’s board of directors (or persons performing the equivalentfunctions):
(a) All significant deficiencies and material weaknesses in the design or operation of internal control over financial reporting whichare reasonably likely to adversely affect the registrant’s ability to record, process, summarize and report financial information;and
(b) Any fraud, whether or not material, that involves management or other employees who have a significant role in the registrant’sinternal control over financial reporting.
Date: February 25, 2013
/s/ Peter J. Bensen
Peter J. Bensen
Corporate Executive Vice President andChief Financial Officer

Exhibit 32.1. Certification pursuant to 18 U.S.C. Section 1350 by the Chief Executive Officer, as Adopted Pursuant toSection 906 of the Sarbanes-Oxley Act of 2002 Pursuant to Section 906 of the Sarbanes-Oxley Act of 2002 (subsections (a) and (b) of Section 1350, Chapter 63 of Title 18, United States Code),the undersigned officer of McDonald’s Corporation (the “Company”), does hereby certify, to such officer’s knowledge, that the Annual Report onForm 10-K for the year ended December 31, 2012 of the Company fully complies with the requirements of Section 13(a) or 15(d) of the SecuritiesExchange Act of 1934 and information contained in the Form 10-K fairly presents, in all material respects, the financial condition and results ofoperations of the Company.
Date: February 25, 2013
/s/ Donald ThompsonDonald Thompson
President and Chief Executive Officer

Exhibit 32.2. Certification pursuant to 18 U.S.C. Section 1350 by the Chief Financial Officer, as Adopted Pursuant toSection 906 of the Sarbanes-Oxley Act of 2002 Pursuant to Section 906 of the Sarbanes-Oxley Act of 2002 (subsections (a) and (b) of Section 1350, Chapter 63 of Title 18, United States Code),the undersigned officer of McDonald’s Corporation (the “Company”), does hereby certify, to such officer’s knowledge, that the Annual Report onForm 10-K for the year ended December 31, 2012 of the Company fully complies with the requirements of Section 13(a) or 15(d) of the SecuritiesExchange Act of 1934 and information contained in the Form 10-K fairly presents, in all material respects, the financial condition and results ofoperations of the Company.
Date: February 25, 2013
/s/ Peter J. Bensen
Peter J. Bensen
Corporate Executive Vice President andChief Financial Officer
