pensions and california public schools
TRANSCRIPT

About: The Getting Down to Facts project seeks to create a common evidence base for understanding the current state of California school systems and lay the founda�on for substan�ve conversa�ons about what educa�on policies should be sustained and what might be improved to ensure increased opportunity and success for all students in California in the decades ahead. Getting Down to Facts II follows approximately a decade a�er the first Getting Down to Facts effort in 2007. This technical report is one of 36 in the set of Getting Down to Facts II studies that cover four main areas related to state educa�on policy: student success, governance, personnel, and funding.
Pensions and California Public Schools
Technical Report
Cory Koedel University of Missouri
Gabriel E. Gassmann University of Missouri
September 2018

Pensions and California Public Schools
Cory Koedel University of Missouri
Gabriel E. Gassmann
University of Missouri
Acknowledgments
This report was written for inclusion in the California Getting Down to Facts II (GDTFII) Project. We thank participants at the GDTFII pre-release researcher convenings, and in particular Eric Brunner and Susanna Loeb, and Maria Fitzpatrick, for comments and suggestions. All errors are our own.

i | Getting Down to Facts II
List of Common Abbreviations & Acronyms in this Report
California Plans
CalSTRS: California State Teachers’ Retirement System
CalPERS: California Public Employees’ Retirement System
Pension Accounting Terms
ARC: Annual Required Contribution
UAAL: Unfunded Actuarial Accrued Liability
COLA: Cost of Living Adjustment
Terms that Identify Pension Plan Types
DB: Defined Benefit
DC: Defined Contribution
CB: Cash Balance

1 | Pensions and California Public Schools
Introduction
The California State Teachers’ Retirement System (CalSTRS) is in the midst of phasing in substantial increases in the contributions made by teachers, school districts, and the state of California. The phase-in period began in 2014-15. In the year prior, 2013-14, the total statutory contribution rate to CalSTRS from all parties was 18.3 percent of salary for each covered teacher. By 2020-21, the end of the phase-in period, the contribution rate will be at least 35.3 percent. These higher pension costs are not a short-term aberration. Recent CalSTRS projections indicate that the higher rates will be needed through 2046; moreover, there are reasons to believe their projections are too optimistic. Such a large increase in pension contributions has important implications for education finance in California.
This report has two primary objectives. The first is to document what is happening with CalSTRS, and why, from the perspective of individuals interested in schools (i.e., not individuals interested in pension accounting). The “documentation of facts” portion of our report mostly involves taking publicly available information, much of it from CalSTRS itself, and synthesizing the information in a way that improves transparency and highlights key issues. CalSTRS reporting is transparent in a technical sense, but we argue that key information is not truly accessible because it is buried in excessively long plan reports crammed full of actuarial jargon. Consistent with this concern, we use a survey of stakeholders in the California education system to show that they have very little knowledge of even the most basic financial information about the plan. We also document actions by some stakeholders (charter schools) that are consistent with a lack of basic pension knowledge.
The second objective of our report is to lay out options for a policy response. We discuss possibilities within the current CalSTRS structure, which are limited. We also discuss options for deeper, structural changes to teacher retirement benefits based on what other states have done. Many of the changes in other states are recent and in response to similar fiscal challenges in their teacher pension plans.
Over the course of our discussion of alternative plan options, we consider the larger contextual question of how retirement plans for public school teachers should be designed. In addition to cost considerations, plan design will depend on teacher preferences for various retirement plan types and the labor incentives generated by different plans. Basic fairness is also an important consideration given current and potential resource redistributions among teachers. All of these are part of the vetting of policy proposals that California might consider as alternatives to the current CalSTRS structure.
In addition to our in-depth analysis of CalSTRS, we also include a short review and discussion of the California Public Employees’ Retirement System (CalPERS), which covers non-certified staff in public schools and faces similar financial challenges. We also briefly discuss retiree health benefits, which conceptually are often linked with pension benefits, but from a policy perspective are quite different.

2 | Getting Down to Facts II
As a last point before diving in, it is important to recognize at the onset that California has dug itself into a hole with CalSTRS; a hole that cannot be refilled. Or, at the least, there is no legal precedent by which this would occur. The only way out of the current crisis is to do exactly what California is doing – require larger contributions to pay for benefits conferred to workers and to pay down previously accrued pension liabilities. All of the policy options discussed in this report are for changes moving forward. They cannot reduce existing pension commitments, but can reduce the future burden of pensions on the education system.
The Basics of How CalSTRS Works
Benefits
CalSTRS is a statewide defined-benefit (DB) pension plan. Most teachers in the U.S. are covered by a similarly-structured DB plan administered at the state level. The benefit level of CalSTRS is within the norms of teacher plans nationally. Put another way, retirement benefits for teachers in California are not particularly generous or meager compared to teachers in other states.1
The CalSTRS benefit formula is as follows:
Initial Annual Retirement Benefit = (formula factor)*(years of service)*(final average salary) (1)
The formula factor is not constant in California, but is anchored around 2 percent. The final average salary is calculated as either the highest single year of earnings or the average of the highest three years, depending on the membership tier (see below). The product of the formula factor and years of service gives the “replacement rate” for the final average salary. For example, a teacher who retires with 25 years of service and a 2 percent formula factor would receive a lifetime annuity equal to 50 percent of her final average salary upon retirement.2
Eligibility for a pension requires “vesting,” which in California takes 5 years. Once the 5-year mark is attained a worker can collect her pension as defined by the formula, once she reaches an age at which she is eligible to collect. Workers who leave without accruing 5 years of service receive their own contributions back from the plan with interest, but lose all contributions on their behalf by school districts and the state.
There are currently two tiers of benefits in CalSTRS, termed “2% at 60” and “2% at 62,” which we will call the first and second tiers, respectively. The second tier of CalSTRS has reduced benefits along several dimensions and covers all California teachers hired for the first time on or after January 1, 2013. The names of the two tiers reference the age at which a 2-
1 With the caveat that in states like California where teachers are not enrolled in Social Security (see below), state plans tend to be more generous and have higher costs, presumably to compensate for the absence of Social Security coverage. 2 The formula in equation (1) gives the value of the initial annual payment at retirement. There is also a two percent upward adjustment to the benefit each year after initial collection in CalSTRS. The two percent increase each year is based on the initial benefit amount and is not compounded.

3 | Pensions and California Public Schools
percent formula factor is attained – teachers must be older under the new tier in order to receive this level of benefit. If a teacher wishes to retire (i.e., collect benefits) prior to the “2% age” there is a penalty in the form of a lower formula factor, which depends on how early the teacher collects. The minimum early-retirement ages (with penalty) in tiers one and two are 50 and 55, respectively. There are also formula factor bumps that come with working past the “2% age,” which cap out at a 2.4% formula factor in both tiers. We refer interested readers to the CalSTRS member handbook for additional details.
The multi-tiered system in California is not unique; in fact, many states have reduced DB pension benefits for public workers in a similar fashion. Legal precedent is that benefits are not reduced for incumbents, either retroactively (i.e., by taking away benefits already accrued) or prospectively (i.e., by letting benefits accrue at a lower rate going forward). In essence, teachers – and public workers more generally – are grandfathered into the benefit structure into which they are hired when faced with the possibility of reductions. This leads to the multi-tiered benefit structure characterized by less generous benefits for new hires found in many states, including California.3
A last point on retirement benefits for California teachers is that they are not enrolled in Social Security. This means that they do not pay into Social Security during work and neither do their employers (i.e., school districts), and they do not accrue Social Security benefits while working as a teacher. Nationally, estimates of the share of teachers enrolled in Social Security, in addition to their state retirement plans, range from 60-75 percent (Kan and Aldeman, 2014; Koedel and Podgursky, 2016).
Funding
A key structural feature that distinguishes defined-benefit (DB) and defined-contribution (DC) retirement plans is the nature of funding. In a DC plan, like a 401(k) in the private sector or 403(b) in the public sector, retirement benefits are funded at the individual level. That is, the value of a worker’s retirement account is entirely a function of the contributions made by the worker, contributions on her behalf by the employer, and investment returns. Accounts must balance on a person-by-person basis by construction, and thus transfers of resources from one worker to another are not possible.
In contrast, DB benefits are not directly linked to contributions at the individual level; rather they are defined by a formula as shown in the previous section. The lack of a direct link between contributions and benefits facilitates resource transfers between teachers in a plan. Within-cohort resource transfers are complicated, but key transfers are from short-term to long-term teachers and from early-entrant to late-entrant teachers (Costrell and McGee,
3 This is only true for benefit reductions. In the late 1990s and early 2000s there were widespread benefit enhancements in teacher plans across the United States, including CalSTRS. The enhancements were retroactive (Koedel, Ni and Podgursky, 2014). As of writing this report, there are cases before the California Supreme Court that could change the longstanding precedent that incumbents are protected from future reductions in the rate of benefit accrual (Cooper, 2017).

4 | Getting Down to Facts II
forthcoming).4 And while in principle pension benefits are meant to be self-funded at the cohort level, pension accounting also allows for positive and negative balances to carry over time in a plan, which effectively transfers resources across cohorts (Backes et al., 2016).
The cost of providing promised retirement benefits for services performed by current workers in a year is referred to as the “normal cost” by pension actuaries. The normal cost is determined by actuarial calculations that are complex, uncertain, and require many assumptions. Key assumptions are about the expected return on assets, life expectancies of members, salary growth profiles, and career persistence profiles. As of the 2017 Actuarial Valuation Report, the CalSTRS normal cost rate was 20.3 percent of salaries.
Pension actuaries account for the normal cost and any carryovers from previous years in determining the total contribution rate, which is called the Annual Required Contribution (ARC). While carryovers can be positive or negative, in recent history they have been consistently negative in state plans nationally (Backes et al., 2016).5 In CalSTRS since 2006 (the beginning of our data panel below) carryovers have been negative, large and growing. This is reflected in the persistent accumulation of CalSTRS’ Unfunded Actuarially Accrued Liability (UAAL), which is effectively pension debt. A higher UAAL leads to a higher ARC. As of the 2017 Actuarial Valuation Report, the CalSTRS UAAL was just over $107 billion. The cost of servicing the UAAL is approximately 18 percent of covered salaries.6
As a matter of state statute, CalSTRS contributions are paid by three groups: employees (teachers), employers (school districts), and the state of California. Note that the ARC, despite having the word “required” in its name, is not required in any legal sense. While in some states the statutory contribution rate is explicitly bound to the ARC, in California this is not the case and the statutory contribution need not match the ARC. In fact, it can be unresponsive to the ARC, as we will show below.
4 DB plans favor long-term teachers and late entrants because of the way the formulas are structured, combined with rules for retirement eligibility that depend on age and years of service. Specifically, career teachers benefit from final-average-salary calculations that penalize those who leave the profession early, and from retirement-eligibility provisions based on experience that allow them to begin collecting their pensions before reaching the “normal” retirement age. Late entrants benefit because their final average salary is high relative to cumulative earnings. These patterns are shown for CalSTRS in Costrell and McGee (forthcoming). 5 An exception is a brief period in the late 1990s on the heels of an extended bull run in the stock market when plan assets were inflated in many states. Many of the plans were close to full funding, or marginally over-funded at this time. However, this “funding peak” was short-lived as the stock market corrected in the early 2000s, and then did so more severely in 2008. Moreover, many states legislated large, retroactive benefit increases for plan members around the turn of the century when plan balance sheets looked particularly good, which immediately raised liabilities (Koedel, Ni and Podgursky, 2014). CalSTRS is among the plans that were enhanced in the late 1990s. 6 In a typical Actuarial Valuation Report for a state plan, and in past CalSTRS reports, the percent of covered salaries required to service the unfunded liability is reported directly. But in 2017, CalSTRS changed the structure of the valuation report and this number is no longer readily available. The 18-percent figure reported here is based on correspondence with CalSTRS staff. The 2016 CalSTRS’ Actuarial Valuation Report, the last valuation to directly give this number, indicated that cost of servicing the UAAL was 18.8 percent of covered salaries.

5 | Pensions and California Public Schools
Assembly Bill 1469 and Rising CalSTRS Contributions
Assembly Bill 1469, approved by the governor of California in 2014, set into motion the current rise in CalSTRS contributions, beginning with the 2015 school year (hereafter, school years in this report are denoted by the spring year – e.g., 2015 for 2014-15). Figure 1 shows past and projected CalSTRS statutory contribution rates starting with 2006 and continuing through the last year of increases legislated by the bill, in 2021. The vertical axis is measured in percentage points of covered teacher salaries, which is the unit by which contributions are operationalized in the system. The total length of each bar represents the total contribution. Each bar is also subdivided to show shares for the three contributory groups.
Figure 1. Realized and Projected CalSTRS Statutory Contributions, 2006-2021, in Percentage Points of Salaries.
Sources: CalSTRS’ Actuarial Valuation Reports and Assembly Bill 1469. Notes: Projections are as legislated by Assembly Bill 1469. The projected average employee contributions depend on the proportion of CalSTRS members in each tier of the plan (who are scheduled to pay different rates under Assembly Bill 1469). Our estimates are based on rough projections of member demographics from CalSTRS’ Actuarial Valuation Reports. Although employee contribution rates remain the same for each tier from 2017 onward (unless normal costs rise substantially, which we do not allow for in the graph), the estimated average member contribution rate decreases slightly over time as more second-tier members enter.
As noted in the introduction, the statutory rate increase legislated by Assembly Bill 1469 is substantial. Between 2014 and 2021, the bill calls for the rate to nearly double from 18.3 to 35.3 percent of salaries. Although all three contributing parties – teachers, school districts, and the state of California – are experiencing rate increases, school districts are most impacted. In 2013-14, school districts contributed 8.25 percentage points of teacher salaries to CalSTRS and by 2020-21, this rate will rise by over 100 percent, to 19.1 percentage points.
0%
5%
10%
15%
20%
25%
30%
35%
40%
2006
2007
2008
2009
2010
2011
2012
2013
2014
2015
2016
2017
2018
2019
2020
2021
State
Employer
Employee
6 | Getting Down to Facts II
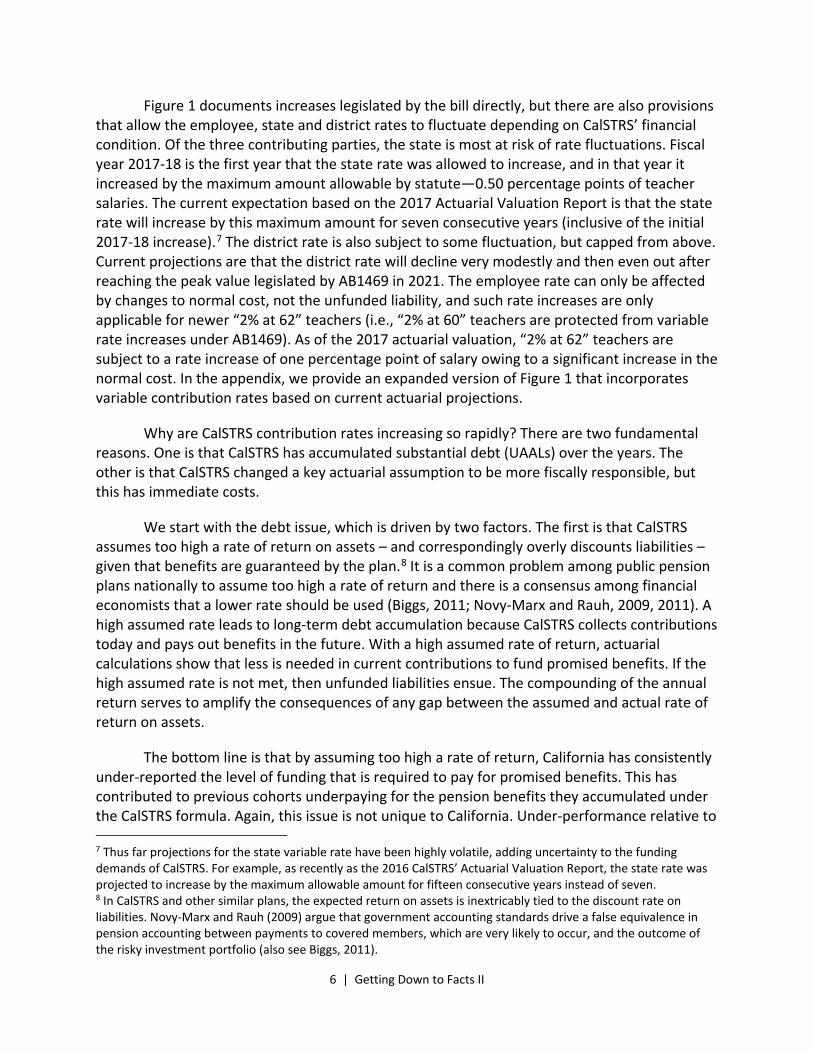
Figure 1 documents increases legislated by the bill directly, but there are also provisions that allow the employee, state and district rates to fluctuate depending on CalSTRS’ financial condition. Of the three contributing parties, the state is most at risk of rate fluctuations. Fiscal year 2017-18 is the first year that the state rate was allowed to increase, and in that year it increased by the maximum amount allowable by statute—0.50 percentage points of teacher salaries. The current expectation based on the 2017 Actuarial Valuation Report is that the state rate will increase by this maximum amount for seven consecutive years (inclusive of the initial 2017-18 increase).7 The district rate is also subject to some fluctuation, but capped from above. Current projections are that the district rate will decline very modestly and then even out after reaching the peak value legislated by AB1469 in 2021. The employee rate can only be affected by changes to normal cost, not the unfunded liability, and such rate increases are only applicable for newer “2% at 62” teachers (i.e., “2% at 60” teachers are protected from variable rate increases under AB1469). As of the 2017 actuarial valuation, “2% at 62” teachers are subject to a rate increase of one percentage point of salary owing to a significant increase in the normal cost. In the appendix, we provide an expanded version of Figure 1 that incorporates variable contribution rates based on current actuarial projections.
Why are CalSTRS contribution rates increasing so rapidly? There are two fundamental reasons. One is that CalSTRS has accumulated substantial debt (UAALs) over the years. The other is that CalSTRS changed a key actuarial assumption to be more fiscally responsible, but this has immediate costs.
We start with the debt issue, which is driven by two factors. The first is that CalSTRS assumes too high a rate of return on assets – and correspondingly overly discounts liabilities – given that benefits are guaranteed by the plan.8 It is a common problem among public pension plans nationally to assume too high a rate of return and there is a consensus among financial economists that a lower rate should be used (Biggs, 2011; Novy-Marx and Rauh, 2009, 2011). A high assumed rate leads to long-term debt accumulation because CalSTRS collects contributions today and pays out benefits in the future. With a high assumed rate of return, actuarial calculations show that less is needed in current contributions to fund promised benefits. If the high assumed rate is not met, then unfunded liabilities ensue. The compounding of the annual return serves to amplify the consequences of any gap between the assumed and actual rate of return on assets.
The bottom line is that by assuming too high a rate of return, California has consistently under-reported the level of funding that is required to pay for promised benefits. This has contributed to previous cohorts underpaying for the pension benefits they accumulated under the CalSTRS formula. Again, this issue is not unique to California. Under-performance relative to 7 Thus far projections for the state variable rate have been highly volatile, adding uncertainty to the funding demands of CalSTRS. For example, as recently as the 2016 CalSTRS’ Actuarial Valuation Report, the state rate was projected to increase by the maximum allowable amount for fifteen consecutive years instead of seven. 8 In CalSTRS and other similar plans, the expected return on assets is inextricably tied to the discount rate on liabilities. Novy-Marx and Rauh (2009) argue that government accounting standards drive a false equivalence in pension accounting between payments to covered members, which are very likely to occur, and the outcome of the risky investment portfolio (also see Biggs, 2011).

7 | Pensions and California Public Schools
the assumed rate of return is widely regarded as the single biggest contributor to the substantial accumulation of pension debt in state and local pension plans nationwide since the turn of the century (Munnell, Aubry and Cafarelli, 2015).
The other factor that has driven debt accumulation in CalSTRS, which is less widespread nationally, is persistent underpayment of the ARC. Recall that the ARC is the level of contribution required to cover normal cost and service of the UAAL under the actuarial assumptions. This number is too low because the assumed rate of return on assets is too high. But ignoring that issue for a moment, California has significantly underpaid the ARC as reported by CalSTRS for many years. That is, over a long time horizon, the three contributory groups have combined to provide a contribution below the actuarially determined level. Note that this is a centralized state decision – for instance, even if a proactive school district had wanted to fully pay its share of the ARC in the past, this would not have been possible. All school districts are bound by the state-legislated contribution rate to the plan, whatever it may be.
Figure 2 contrasts the reported ARC from CalSTRS against the California statutory contribution rate through 2017. The figure does not include projections into the future because of uncertainty about the ARC.9 The statutory contribution rates are the same as what we show in Figure 1. In the beginning of our data panel, 2006, the ARC was 21.3 percentage points of teacher salaries and the statutory contribution was 18.3 percentage points. This is not a trivial difference – in percentage terms, the statutory contribution was just 86 percent of what actuaries reported as required to fund the plan. This level of underpayment persisted through 2009, hovering in the range of three percentage points of teacher salaries.
9 In contrast to the near-term trajectory of the statutory contribution rate, as specified by Assembly Bill 1469, the trajectory of the ARC is uncertain.

8 | Getting Down to Facts II
Figure 2. Realized ARC and Statutory Contribution Rate, 2006-2017, in Percentage Points of Salaries.
Sources: CalSTRS’ Actuarial Valuation Reports and Assembly Bill 1469.
In 2010 the ARC increased sharply.10 But the statutory contribution was unresponsive. Between 2010 and 2014 the ARC persisted at the much higher level, around 32-34 percent of salaries, but the statutory contribution rate remained flat at 18.3 percent. In 2015, the phase-in of the higher statutory contribution rate under Assembly Bill 1469 began; however, even by 2017, after partial phase-in of the higher rate, the CalSTRS ARC was still being significantly underpaid. Specifically, the gap between the ARC and total contributions in 2017 was about 9 percentage points of teacher salaries, which amounts to billions of dollars.
The persistent underpayment of the ARC documented in Figure 2 is a key source of debt accumulation in CalSTRS. A straightforward analogy is to a monthly credit card bill. For many years the contributing parties did not pay the full bill. As a consequence, the balance has gotten larger and larger, requiring larger and larger payments.
Having covered the debt issue, we now turn to the other factor that has contributed to the recent increase in CalSTRS contributions: a change in the actuarial assumptions. Since 2010 CalSTRS has made steady efforts to lower the assumed rate of return on assets. Per above, this is fiscally responsible behavior. As of 2009, CalSTRS assumed an 8 percent annual return on
10 The sharp increase in the ARC is reported in the June 30, 2009 CalSTRS’ Actuarial Valuation Report. The report attributes the increase to deferred asset losses and a method change, but is somewhat vague. The exact language describing the ARC increase states “the additional revenue needed reflects the expected future recognition of asset losses currently being deferred in the June 30, 2009 Actuarial Value of Assets. Under the old method, the estimated additional revenue needed would have been 6.943% of earned salaries [as opposed to 13.908%].”
0.00%
5.00%
10.00%
15.00%
20.00%
25.00%
30.00%
35.00%
40.00%
45.00%
ARC
Statutory Cont.
9 | Pensions and California Public Schools
assets, which is fairly typical of state and municipal plans nationally. By 2011 the rate had been lowered to 7.5 percent, and it was just lowered again to 7.0 percent.
While these adjustments are a clear move in the direction of fiscal responsibility, it is important to recognize that every time the assumed rate of return is lowered, the value of plan assets immediately falls and the UAAL rises. Even seemingly small moves in the assumed rate of return – e.g., by 0.25 or 0.50 percentage points – can have dramatic impacts on the financial condition of the plan given the large sums involved and compounded returns. So, another key factor driving the recent rise in the CalSTRS contribution rate is the increase in the ARC generated by assuming a lower rate of return on assets.
Finally, while the trend in the CalSTRS assumed rate of return is moving in the right direction, there is more bad news. The new, 7.0 percent return assumption it is still too high according to financial economists. While there is no obvious, correct rate, Novy-Marx and Rauh (2009) argue that what is effectively a risk-free rate makes the most sense given that pension payments will occur with near-certainty (also see Biggs, 2011). These authors make counterfactual calculations of pension liabilities across state plans nationally using the rate on U.S. Treasury bonds; as of writing this report, the 30-year Treasury bond yield is about 3 percent. The implication of the high assumed rate of return is that unfunded liabilities will continue to accumulate moving forward as CalSTRS takes in too little in contributions to truly fund future promised obligations.
Implications of Rising Pension Costs
In this section we illustrate the practical consequences of rising pension contribution rates for school districts. We focus on school districts because they are most impacted by the rising rates, at least as legislated directly in Assembly Bill 1469, per Figure 1.11 The increase in the state contribution rate is also something to keep an eye on. The legislated state increase shown in Figure 1 is substantial but not overwhelming; however, recall from above (Section III) that the state is most at risk of increases in contribution costs beyond those legislated by AB1469, depending on the plan’s funding status.
For districts, it is a trivial assertion that rising CalSTRS contribution rates are crowding out spending somewhere, in the sense that without the rising rates the money could be spent on something else. But pinning down which other expenditures are crowded-out precisely is not straightforward. Unfortunately, we lack a credible research design in California to isolate the causal effect of rising pension expenditures on expenditures in other categories.12 Instead, in this section we descriptively show how the rising contribution rates are affecting district budgets broadly for three large school districts: Fremont, Los Angeles, and West Contra Costa. 11 What we mean to convey by the qualifier “at least as legislated directly” is that the incidence of rising pension costs is unclear. For example, if districts pass through some of their higher pension costs to teachers in the form of salary reductions or freezes, part of the cost incidence would fall on teachers even though districts pay directly. 12 Using national data, Kim, Koedel and Xiang (2017) show that expenditures on teacher salaries go down when the ARC increases in state teacher plans during the post-recession era. Anzia (2017) studies municipal pensions and finds that increases in pension costs correspond to reductions in municipal employment.

10 | Getting Down to Facts II
These districts represent a convenience sample of large districts with clear and publicly available budget documents, including budget and enrollment projections that allow us to look forward through the 2020 school year. We additionally use the district data to extend the projections through 2021 ourselves, which facilitates an examination through the last year of district rate increases legislated by Assembly Bill 1469.13
First, Figure 3 shows past and projected per-pupil CalSTRS contribution costs for each district in our convenience sample. While in principle these districts could modify hiring policies to reduce the impact of the rising CalSTRS rates, we see no evidence of this in the data thus far. In fact, actual and projected per-pupil certificated salary expenditures (i.e., CalSTRS-covered expenditures) are generally rising in all three districts over the timespan covered in the figure.14 This trend, combined with the rising CalSTRS rate, results in per-pupil CalSTRS expenditures that are projected to rise in real terms by 180-200 percent between 2014 and 2021 in these districts, to around $1,000 per pupil (in 2015 dollars).
The 2021 costs represent a substantial fraction of revenue in each of these districts. Specifically, the per-pupil CalSTRS costs shown in Figure 3 will account for 10.5, 7.6 and 7.2 percent of per-pupil revenue in 2021 in Fremont, Los Angeles, and West Contra Costa, respectively. Moreover, these revenue percentages would look even larger if per-pupil revenues were not generally rising in these and other California districts over the timespan covered by Figure 3. A concern is that if the state’s budget takes an unfavorable turn in the future and revenues are reduced, the only mechanisms to scale back districts’ CalSTRS costs are either to (a) once again willingly underpay the ARC by backpedaling from Assembly Bill 1469, which would lead to further debt accumulation, or (b) reduce teaching staff quickly.
Figure 3 paints the aggregate picture, but again, we are unable to say precisely where the extra funding to pay for the increased CalSTRS contributions is coming from within these districts. In the absence of direct evidence on crowd-out, Figure 4 illustrates the results of a thought experiment we find useful. In Figure 4 we hold combined per-pupil spending on CalSTRS-covered salaries and CalSTRS contributions fixed at the pre-phase-in level (2013-14), in real terms. We then document how rising pension contribution costs would eat into funding available for per-pupil salaries under the assumption that the total revenue available for these two expenditure categories combined is fixed. To be clear, this is just a hypothetical constraint meant to illustrate what in our view is an interesting and intuitive case.
13 For the 2021 projections we calculate the average change in spending and enrollment using district documents for the preceding three years, then use the average as an estimate of the expected change from 2020 to 2021. 14 This does not seem to be driven by declining enrollments. Although enrollment is declining in West Contra Costa and Los Angeles, it is rising in Fremont.

11 | Pensions and California Public Schools
Figure 3. Realized and Projected Per-Pupil CalSTRS Contribution Costs in Fremont, Los Angeles, and West Contra Costa School Districts, 2014-2021.
Sources: Author calculations based on data from individual district budget documents and enrollment reports (including projections). Data through 2020 are taken directly from district documents. For the 2021 projections, for which direct numbers from districts are unavailable, we calculate the average change in spending and enrollment using district documents for the preceding three years, then use the average as an estimate of the expected change from 2020 to 2021. Notes: Estimates in real 2015 dollars.
$0.00
$200.00
$400.00
$600.00
$800.00
$1,000.00
$1,200.00
Fremont
$0.00
$200.00
$400.00
$600.00
$800.00
$1,000.00
$1,200.00
Los Angeles
$0.00
$200.00
$400.00
$600.00
$800.00
$1,000.00
$1,200.00
2014
2015
2016
2017
2018
2019
2020
2021
West Contra Costa
12 | Getting Down to Facts II
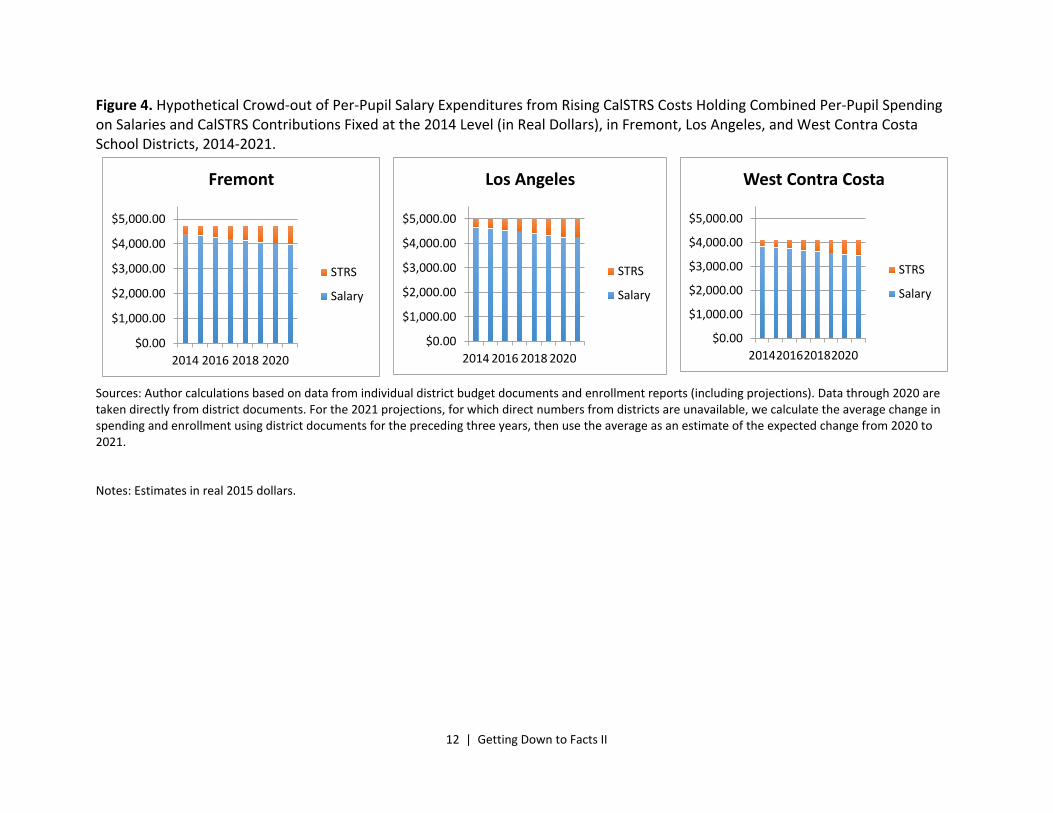
Figure 4. Hypothetical Crowd-out of Per-Pupil Salary Expenditures from Rising CalSTRS Costs Holding Combined Per-Pupil Spending on Salaries and CalSTRS Contributions Fixed at the 2014 Level (in Real Dollars), in Fremont, Los Angeles, and West Contra Costa School Districts, 2014-2021.
Sources: Author calculations based on data from individual district budget documents and enrollment reports (including projections). Data through 2020 are taken directly from district documents. For the 2021 projections, for which direct numbers from districts are unavailable, we calculate the average change in spending and enrollment using district documents for the preceding three years, then use the average as an estimate of the expected change from 2020 to 2021. Notes: Estimates in real 2015 dollars.
$0.00
$1,000.00
$2,000.00
$3,000.00
$4,000.00
$5,000.00
2014 2016 2018 2020
Fremont
STRS
Salary
$0.00
$1,000.00
$2,000.00
$3,000.00
$4,000.00
$5,000.00
2014 2016 2018 2020
Los Angeles
STRS
Salary
$0.00
$1,000.00
$2,000.00
$3,000.00
$4,000.00
$5,000.00
2014201620182020
West Contra Costa
STRS
Salary
13 | Pensions and California Public Schools
Under the condition that real per-pupil combined expenditures on salaries and CalSTRS contributions are held fixed, rising CalSTRS costs imply significant reductions in per-pupil salary expenditures in the example districts. Specifically, our estimates imply a roughly 9 percent real reduction relative to 2013-14 values.
The New Normal for CalSTRS
There may be some confusion as to whether the pension contribution increases brought on by Assembly Bill 1469 are temporary or permanent. Barring a massive and long-sustained stock market boom, they are effectively the new normal, at least for the foreseeable future. We urge stakeholders in California schools to resist the temptation to wish this problem away with unsubstantiated optimism.
The higher rates legislated by AB1469 will be phased in by 2021 and be required through at least 2046, subject to some fluctuations as actuarial calculations change.15 Moreover, if the 7-percent assumed rate of return on assets is still too high, the practical implication is that CalSTRS will continue to collect too little from working cohorts to fully fund promised benefits. In turn, this means further accumulation of UAALs, and still-higher contribution rates in the future.
Policy Options Part-1: Changes within CalSTRS’ Current Structure
Without changing the structural features of CalSTRS, there are only two options available to stop the accumulation of unfunded liabilities and limit the continued rise in the ARC:
1. Hold the benefit level fixed and lower the assumed rate of return to a realistic guaranteed rate, which would generate a massive spike in contribution rates even relative to the new, higher levels imposed by Assembly Bill 1469. Of course, like with Assembly Bill 1469 the higher rate could be phased in, but increases would still be steep.
2. In conjunction with assuming a realistic rate of return on assets, dramatically reduce retirement benefits for new entrants into teaching, and perhaps also reduce cost-of-living adjustments (COLAs). These benefit reductions would put downward pressure on required contributions by reducing long-term liabilities, which could reduce or even mitigate the spike in contribution rates that otherwise would come with lowering the assumed rate of return.
No state of which we are aware has done anything approaching the first option. The lack of precedent implies that there is no political support to fund the level of retirement benefits promised by CalSTRS and similar teacher plans elsewhere in the U.S. at their full cost.
15 Per above, the nature of the fluctuations thus far are such that the state rate is currently projected to plateau at a higher level than what is legislated by AB1469, the district rate will plateau at a slightly lower level than what is legislated, and the rate for “2% at 62” employees will also be higher owing to a significant increase in normal cost in the most recent actuarial valuation (see Appendix A).

14 | Getting Down to Facts II
The second option involves reducing benefits for new hires, and/or cutting COLAs. We single out COLA adjustments as a possibility because COLAs can be changed even for incumbents. While COLAs are part of the broad pension-benefit package, they have been treated differently than other, core components of pension benefits by courts, facilitating COLA reductions in many states in response to fiscal pressure in recent years. Although COLA adjustments alone are not sufficient to solve the CalSTRS funding problem, they could be part of a solution.16
Reductions in core pension benefits would fall on new hires only. Again, as a matter of legal precedent, core benefits for incumbents are well protected, making it infeasible to reduce them. This is true retroactively and for changes to the future rate of accrual.17 Many states have recently reduced benefits for new hires, including California. This has created “tiered” pension plans across the country where newer workers have reduced benefits. That said, drastic benefit reductions for new entrants are less common. California’s recent reductions for the new “2% at 62” tier, which we described briefly in Section II, are modest and typical of reductions in other states. In contrast, Illinois is an example of a state that implemented a new tier with significantly lower benefits. This seems undesirable from a policy perspective and does not appeal to basic notions of fairness, as discussed by Kan, Fuchs, and Aldeman (2016), although there is no evidence to date on the impact of pension benefit reductions on teacher quality or turnover.
Our view is that neither reform option within the traditional DB pension structure is appealing. A related issue is the possibility of raising more revenue. Revenue ties into this discussion in the sense that the burden of higher pension costs on the education system can be reduced if new revenue is made available. While we would be remiss not to mention the option of raising more revenue, new revenue would not affect the tradeoffs in expenditures implied by rising pension costs unless the new revenue would only be available to pay for pensions. Put another way, only if pension obligations open up new sources of revenue – e.g., if taxpayers are more inclined to pay for pension costs than other expenditures – would the revenue margin be important for assessing the tradeoffs associated with rising pension costs. Based on available evidence, this seems unlikely.18,19
16 Unlike core pension benefits, COLAs have not been interpreted by courts to be a contractual right (Munnell, Aubry and Cafarelli, 2014a). Munnell, Aubry and Cafarelli (2014a) estimate that eliminating a 2-percent compounding COLA entirely would reduce the effective benefit level by 15-17 percent. The current 2-percent CalSTRS COLA is not compounded, so the projected savings would be lower. A COLA reduction to zero may also be viewed as too drastic. 17 We again note that as of writing this report, there are cases before the California Supreme Court that could change the longstanding precedent that incumbents are protected from future reductions in the rate of benefit accrual (Cooper, 2017). Already accrued benefits are not at stake, but future accrual could be affected depending on the legal outcome. 18 Results from a statewide survey conducted by the Public Policy Institute of California indicate that the majority of Californians favor increasing employee pension contributions, reducing benefits, and moving from a DB to DC pension structure. See here: http://www.ppic.org/press-release/most-favor-governors-tax-proposal/ 19 Pension obligation bonds are a pension-specific revenue source. The idea behind these bonds is to borrow money now, invest it in the pension portfolio, and hope to earn a return that exceeds the cost of the bond.
15 | Pensions and California Public Schools
Given the lack of appeal of reform options within the DB structure, in the next section we turn to feasible options for structural reform. Our gauge of “feasibility” is whether another state has implemented the reform. In addition to fiscal impacts, a key policy issue to consider with a structural reform is how it will affect the teaching workforce. We integrate evidence from available research on teacher preferences over various types of plans, and how teachers and other public workers respond to incentives generated by retirement plans, into the discussion of reform options.
Policy Options Part-2: Structural Reform
Conceptual Overview
The general theme of pension reforms that have been implemented in other states has been a reduction in emphasis on traditional DB pension benefits. Some states have completely done away with traditional DB plans – e.g., by moving entirely to a DC or cash-balance (CB) plan – but most have not gone that far. Middle-of-the-road reforms that have retained a traditional DB presence include plans that let teachers choose between DB and DC plans, and hybrid plans that offer a combined retirement package with DB and DC components.
DC plans have become the norm in the private sector (Wiatrowski, 2012). They provide individual retirement accounts. Workers and their employers contribute to a DC account and in retirement the worker has access to the account balance, which is the product of contributions over the worklife and interest accrued. Workers typically have choices over investment options but these plans are increasingly streamlined to, among other things, help workers manage risk and minimize account servicing fees. A statewide survey conducted by the Public Policy Institute of California (PPIC) in 2011 found that the majority of Californians favor changing the pension structure for new public employees from DB to DC.20
A cash-balance (CB) plan is something of a mix between a DB and DC plan. The United States Department of Labor describes a CB plan as “a defined benefit plan that defines the benefit in terms that are more characteristic of a defined contribution plan.”21 Individuals enrolled in CB plans have individual retirement accounts into which employees and employers contribute. Employees can review their account balances at any time, like in a DC plan. Typically the accounts are managed centrally and offer a guaranteed rate of return, like in a DB plan, although the guaranteed return is much closer to the risk-free rate (Munnell, Aubry & Cafarelli, 2014c). At retirement the balance is annuitized to provide a “stream of payments” benefit similar to a traditional DB plan. We discuss a specific example of a CB plan in Kansas below.
An objective of reforms to plans in other states is to better control costs, and relatedly, cost-risk. The de-emphasis of DB benefits achieves this objective by reducing the share of Economists are generally not optimistic about these bonds. See Munnell, Aubry and Cafarelli (2014b) for background on pension obligation bonds. 20 See here for details: http://www.ppic.org/press-release/most-favor-governors-tax-proposal/ 21 See here: https://www.dol.gov/agencies/ebsa/about-ebsa/our-activities/resource-center/fact-sheets/cash-balance-pension-plans

16 | Getting Down to Facts II
benefits conveyed with the high guaranteed rate of return, which is currently 7 percent in CalSTRS.22 An initial reaction to these new plans, given that one of their objectives is to control costs, is that they must make teachers worse off. However, this need not be the case. Indeed, there are opportunities for changes that improve cost management while minimizing harm to teachers, and teachers can even benefit. We highlight two such opportunities here.
First is the potential to adjust teachers’ risk profiles. There are three dimensions of risk that merit attention. Our discussion of risk will focus on a comparison between DB and DC pension plans given that the DC structure is the most common alternative to the DB structure.
We begin with investment risk. A common, straightforward criticism of the DC pension structure is that employees bear investment risk. This is in contrast to public DB plans, where there is a guaranteed rate of return and teachers’ retirement accounts are not subject to market fluctuations. Despite modern DC plans doing more to reduce exposure to investment risk among employees by streamlining investment choices, DB plans have a clear advantage from the perspective of the worker in terms of exposure to investment risk.
The two other dimensions of risk favor DC plans. Differences in career-uncertainty risk between DB and DC plans arise because benefits in a typical final-average-salary DB plan – including CalSTRS – are distributed unevenly relative to a DC plan. Some teachers receive large pensions while others receive very little. Somewhat counterintuitively, the average benefit in a DB plan is not a very useful number for many teachers. A system with a lower average benefit can still make many teachers better off if pension benefits are paid out more equitably (Costrell and McGee, forthcoming; McGee and Winters, 2014).
This point can be seen visually in Figure 5, which plots “pension wealth” accrual over time in CalSTRS for a representative age-24 entrant. Pension benefits are received in the form of a lifetime annuity at retirement; “pension wealth” is a scalar value that indicates the present-discounted-value (PDV) of the stream of payments that have been earned up to any given point in the career. The figure shows pension wealth for each potential career outcome (e.g., exit after 1 year, 2 years, etc.) for a forward-looking, age-24 entrant into teaching. All values are discounted to age-24.23
22 There is nothing inherent to the DB pension structure that necessitates a high assumed rate of return on assets; however, high guaranteed rates are ubiquitous in state and local public DB plans nationwide. 23 The figure plots the “2% at 62” profile and is based on assumptions about the career salary profile, survival likelihood, and discount rate. All of these are subject to debate but we do not focus on these specifics for this report. The purpose of the figure is to illustrate the basic shape of the accrual curve, which holds under a wide range of reasonable assumptions. See Koedel and Podgursky (2016) for more detailed information about pension wealth calculations.

17 | Pensions and California Public Schools
Figure 5. CalSTRS Pension Wealth Accrual Curve for a Representative Teacher.
Source: Author calculations. Notes: The pension wealth accrual profile is for a representative age-24 entrant into CalSTRS’ “2% at 62” tier. The salary profile used to construct the accrual curve uses data from the 2014 Digest of Education Statistics produced by the National Center for Education Statistics. Salaries are reported in The Digest by experience categories, which we linearize. Pension wealth values are reported on the vertical axis, discounted to the point of entry (age-24) using a four percent real rate, and in 2015 dollars.
The shape of the profile in Figure 5 is typical of teacher plans nationally.24 A notable feature is that it takes 5 years to vest. As can be seen in the graph, if an individual leaves prior to vesting no pension wealth is accrued. After vesting, wealth accrues slowly at first and then more rapidly as the career progresses. A plan in which retirement benefits accrue more evenly over the course of the career can make some teachers who work less than a full career in California better off. It can also make teachers who want to work past the current CalSTRS “peak” better off. From a risk perspective, and holding the benefit level fixed, teachers entering the profession who are unsure about their full career path will prefer a plan with smoother wealth accrual. A corollary is that a smooth-accrual profile with a lower average benefit exists such that teachers, on average and ex ante, will value it just as much as the current plan.25
The third type of risk is inter-generational risk. DB plans expose teachers to this type of risk because their structure facilitates resource transfers across cohorts (Backes et al., 2016; Kiewiet, 2010). There is no such risk in a DC plan because transfers between cohorts are not possible by construction. Inter-generational risk is perhaps less obvious than the other two
24 Although the CalSTRS profile is less uneven than many plans (McGee and Winters, 2013). 25 For an alternative perspective on risk from career-length uncertainty, see Rhee and Fornia (2016). For a criticism of their methods see Costrell and McGee (forthcoming). We find the criticism levied by Costrell and McGee compelling – namely, Rhee and Fornia focus their analysis on a snapshot of “active” teachers, which induces survivor bias.
0
25000
50000
75000
100000
125000
150000
175000
24 34 44 54 64 74
Pres
ent D
isco
unte
d Va
lue
(201
5 do
llars
)
Age
Pension Wealth

18 | Getting Down to Facts II
types of risk discussed above, but it is important. It is on display in California through the above-described high debt cost in CalSTRS and the new, two-tiered pension plan. Teachers under the “2% at 62” tier receive less in benefits than older teachers, and can also expect to pay more than older teachers did to the pension plan over their careers, per the rate increases in Assembly Bill 1469.26 Moreover, to the extent that district expenditures on pension costs prevent expenditures on salaries and other benefits, there are additional costs for currently working teachers. All else equal, younger/future teachers will prefer a plan structure that stops the growth of the UAAL given that the UAAL will need to be paid down during their careers. A DC plan satisfies this condition because individual accounts are fully funded in real time by construction.
In summary, we have identified three dimensions of risk along which DB and DC plans differ. We do not take a strong stand on which types of risk are more palatable. We simply note that DB and DC plans come with different risks and under some conditions, it is plausible that a plan that is better designed to manage costs – but with a different risk profile for teachers – could make teachers better off.
A second way that implementing an alternative plan can be beneficial to teachers, conditional on the currently poor fiscal condition of CalSTRS, is that structural reform could be part of a broader negotiation with the state of California to alleviate some of the very large debt that CalSTRS currently carries. As reported above, approximately 18 percentage points of teacher salaries are required to service the UAAL (i.e., a little less than half of the total ARC). The dollar value of the UAAL as of the 2017 Actuarial Valuation Report was over $107 billion. This debt falls largely on the education sector under the current structure.
While it seems unlikely that the state of California would agree to take debt off of CalSTRS’ books without making a trade, what if public schools banded together to negotiate with the state? In exchange for shifting to a new plan structure in which debt accrual is prevented by construction, would the state be willing to take on some or all of the debt that the school system carries through CalSTRS? If so, this would free up substantial resources that, in the absence of reform, are committed to pay down pension debt for the foreseeable future. Some of these resources could be targeted directly to teachers in the form of higher salaries and/or more generous retirement benefits under the new structure. The potential for salary increases afforded by such a negotiation is particularly appealing, as Fitzpatrick (2015) shows that teachers place a much greater value on salary relative to deferred compensation in the form of DB pension benefits. An implication of her work is that teachers can be made better off at a lower price if the share of compensation dollars that comes in the form of salaries is increased.
26 Contemporaneously, tier-1 members have slightly higher contribution rates than tier-2 members under Assembly Bill 1469. However, over the course of a full career, newly-entering tier-2 members will be expected to pay more than their tier-1 counterparts, who spent most of their careers in the pre-Assembly Bill 1469 era. Tier-2 members are also subject to rate increases if normal cost rises substantially, which happened in the most recent CalSTRS’ actuarial valuation.

19 | Pensions and California Public Schools
The state of California might be open to such a negotiation for two reasons. First, California has an interest in a properly funded school system that accounts for all costs – pension expenditures are increasingly threatening the ability of schools to provide an adequate education to California students. Second, the state must recognize that if CalSTRS’ debt continues to accumulate, it may ultimately be forced to provide a bailout if the school system is unable to pay. Both sides (schools and the state) have the incentive to work together to resolve this problem.
Empirical Evidence on Teacher Preferences and Pension-Incentive Effects
The previous section discusses tradeoffs between various plans faced by teachers in general terms; here we review the empirical evidence on their preferences. We also review evidence on how the labor incentives embedded in traditional DB plans influence workforce quality given that available reform options would alter these incentives.
We begin with the empirical evidence on teacher preferences, which comes from two states – Florida and Washington. Both states offer teachers a choice of retirement plan options. In Florida, Chingos and West (2015) study a choice environment in which teachers can choose a DB or DC plan. They find that about 30 percent of teachers actively choose a DC plan, despite the default option being the DB plan. These authors also find a modest relationship between teacher quality and plan choice, showing that the least effective teachers are more likely to choose the DB plan. Goldhaber and Grout (2016) study a choice environment in Washington State, this time between a full DB plan and a hybrid plan that includes a DC component and a less-costly (and less-generous) DB component. They find that the majority of teachers prefer the hybrid plan. Like in Florida, the evidence again suggests that more effective teachers prefer the plan with a more-mobile benefit (in this case, the DB/DC hybrid). Together, these studies provide empirical support for the notion that a substantial fraction of teachers would prefer a different retirement benefit structure than what CalSTRS offers.
Next we turn to labor incentives. As noted by many authors (e.g., Costrell and Podgursky, 2009; Furgeson, Strauss and Vogt, 2006), the uneven rate of pension accrual in traditional DB pension plans generates strong retention and exit incentives at various points in the career cycle. A feature of the traditional DB benefit structure lauded by some is the peak-shaped accrual curve, which incentivizes teacher retention up to the peak. Based on the empirical regularity that experienced teachers outperform novices on average, it has been argued that a shift away from the peak-shaped accrual curve (e.g., to a DC or CB plan) could harm workforce productivity by reducing mid-to-late career teacher retention (e.g., see Boivie, 2017).
However, this concern is not borne out in empirical research to date. For example, Fitzpatrick and Lovenheim (2014) study a temporary pension reform in Illinois in the 1990s that dulled the exit penalty for mid-to-late-career teachers below the pension wealth peak. They find that policy-induced exits of experienced teachers did not lower student achievement, and if anything raised it, despite a reduction in workforce seniority. Similar evidence showing that pension retention incentives do not improve workforce quality is found in Koedel et al. (2013).

20 | Getting Down to Facts II
The results from these studies may seem at odds with evidence that experienced teachers perform better than novices, on average. A possible explanation is that the subset of experienced teachers who would leave if not for their pension incentives are not as effective as a typical teacher of the same experience. The bottom line is that available research does not support the notion that the “peaked” pension accrual profile improves the quality of the teaching workforce by incentivizing mid-to-late career retention.27
We know less about young workers, and we are not aware of any study of how young teachers specifically are affected by pension incentives. The one study of young workers of which we are aware focuses on the military. Smith and West (2014) study a reform to the military pension structure that dramatically changed the value of military entrants’ pensions, and find only a very small response among young workers. Thus, at least in the military, there is not strong evidence that young workers are responsive to changes in pension-benefit generosity.28
In summary, there is empirical evidence showing a mix of preferences for DB and DC pension benefits among teachers. Moreover, there is not strong support for the argument that the current DB pension structure positively affects workforce quality in the education sector.
Examples of Alternative Plans in Other States
In this section we review selected examples of alternative retirement plans for teachers in other states. Our objective is to give a high-level overview; the information we provide about each plan is not meant to be comprehensive. More details about any of the plans we review here can be obtained from the plans directly.
We review two states – Alaska and Kansas – that have shifted away entirely from the traditional DB benefit structure, albeit in different ways. However, these states are the exception. As noted above, most states that have made changes to their retirement plans have retained a traditional DB component either as part of a “hybrid” DB/DC plan, a choice plan that allows teachers to select a DB or DC plan, or some combination therein (e.g., choice between a DB and hybrid plan). The hybrid and choice plans de-emphasize the traditional DB benefit structure by shifting more weight (i.e., more resources) toward a mobile and cost-transparent DC benefit structure. In the choice plans, the de-emphasis of the DB structure is operationalized by the fraction of teachers who choose the DC option. In the hybrid plans, the DB components offer less benefits, and require smaller contributions, relative to their full-DB predecessors.
27 Another issue is that the point in the career cycle when teachers’ retention incentives are strongest is also a point when job mobility is low naturally. Consistent with this, Harris and Adams (2007) show that mid-to-late career attrition among teachers is not meaningfully different from that of comparable professionals who are not exposed to the same level of pension retention incentives. 28 This result is broadly consistent with evidence from Fitzpatrick (2015), who finds that teachers do not highly value marginal increases in their pension benefits. Like most other work on pensions, Fitzpatrick’s study is about older teachers, but their low valuations imply even lower valuations among younger teachers for whom pension benefits will be less salient.
21 | Pensions and California Public Schools
Outside of the Alaska plan – which is the only instance of a state shifting fully to a pure DC plan – note that none of these options completely resolves the funding problems inherent to traditional DB plans such as CalSTRS. Rather, the reforms reduce their magnitude by making the DB structure less prominent and costly.
Full DC Plan - Example State: Alaska. As of July 2006, all newly hired teachers in Alaska are enrolled in a DC pension plan. Hires prior to that date were enrolled in a DB plan structurally similar to CalSTRS, which continues to operate for pre-existing members but is closed to new members. In the new DC plan, teachers contribute 8 percent and school districts contribute 7 percent of salary to teachers’ individual accounts, for a total contribution of 15 percent of salary. Additional voluntary contributions are not allowed. Investments are participant-directed and selected from a list of investment options offered by the plan. The default investment option is a “trust fund” based on the year of birth, designed to expose workers to a diversified investment portfolio. Vesting is immediate in the Alaska plan.
Alaska teachers are not enrolled in Social Security.
DB/DC Choice Plans - Example States: Florida, South Carolina. Florida and South Carolina are examples of states where teachers can choose between a DB or DC plan. As noted above, the Florida choice system was studied by Chingos and West (2015). These authors show that despite the DB plan serving as the default option, roughly 30 percent of teachers actively elected to enroll in the DC plan between 2003 and 2008. Florida has just recently switched the default option to the DC plan.
As of July 2017, employee contributions in Florida under either plan are 3 percent of salary. School districts contribute an additional 3.3 percent of salary to teachers’ individual accounts under the DC Plan. As of the 2016 actuarial valuation, school districts contributed almost 7 percent of salary per teacher to the DB plan, inclusive of normal cost and UAAL servicing cost. The employer contribution rate for normal cost was just under 3 percent.29
In South Carolina, both the DB and DC options require an employee contribution of 9 percent of salary. Under the DC plan, school districts contribute an additional 5 percent of salary to each covered teacher’s account. The total employer contribution to the DB plan as of the 2016 actuarial valuation was 12 percent of teacher salary. However, only 1.2 percentage points were to cover normal cost (or roughly 10 percent of the total employer contribution). The other 10.8 percentage points were to service the UAAL.
29 The Florida Retirement System website has the following disclaimer about employee and employer contributions to the DB plan: “It's important to note that the total contributions submitted by you and your employer do not affect your retirement benefit. Your retirement benefit is set by a formula that does not include the contribution rate paid by you and your employer” (quotation retrieved 11.22.2017 at: https://www.myfrs.com/FRSPro_ComparePlan_Contri.htm).
22 | Getting Down to Facts II
Teachers in Florida and South Carolina also pay into and are covered by Social Security, in addition to the state plan. Correspondingly, the general level of state retirement benefits is lower than in California and other states without Social Security coverage.
DB/DC Hybrid Plans - Example States: Indiana, Tennessee. The Indiana DB/DC hybrid plan includes an employer-funded, traditional DB component, and a separate DC component. Teachers receive a combined benefit from both components. The minimum DC contribution is 3 percent of salary. Default responsibility for making this contribution falls on the employee, but school districts can pick up all or part of the cost. Additional voluntary contributions to the DC account, up to 10 percent of salary, are at the discretion of the employee.
School districts fund the DB portion of the plan. As of the 2016 actuarial valuation, the school district contribution rate was approximately 6.7 percent of salaries, most of which went toward normal cost (approximately 5.4 percentage points, with the remainder going to service the UAAL). The low UAAL cost in Indiana is not directly comparable to that of other states, including California, because of complicated accounting practices there. In short, a new plan was opened in 1996 and the old plan was closed. The UAAL of the old plan, which is substantial, is not incorporated into the numbers we report here.30
The Tennessee DB/DC hybrid plan works similarly. As a matter of accounting, employees and employers both contribute to both components of the plan. Employees contribute 2 percent of salary to the DC component and employers contribute 5 percent. The corresponding numbers for the DB component are 5 and 4 percent, respectively. These yield total employee and employer contributions of 7 and 9 percent, respectively. There is no breakdown of DB contributions between normal cost and UAAL cost because the Tennessee hybrid plan was first introduced in 2014 and has yet to accrue liabilities.31 The previous plan, which has unfunded liabilities that currently absorb about 3 percent of teacher salaries, is treated separately in accounting documents in the state (it is termed the “Legacy Plan”).
Teachers in both Indiana and Tennessee are also covered by Social Security.
DB/DC Hybrid and Choice Mixed Plans - Example States: Utah, Washington State. Utah offers teachers a choice between a hybrid DB/DC plan and a pure DC plan. In both plans the employer contributes 10 percent of salary. The allocation of the employer contribution in the DC plan is straightforward: it all goes into the DC account. For the hybrid plan the allocation is as follows: The DB contribution rate is first taken out of the 10 percent, and any remaining amount is put into the DC component. For example, the 2017-18 DB contribution rate is 8.42 percent. The remaining 1.58 percent of salary is put into the DC account for each teacher enrolled in the hybrid plan. If the pension contribution reaches 10 percent in future years there will be no employer contribution to the DC component for teachers in the hybrid plan.
30 The figures reported here focus only on the Teachers’ Retirement Fund “1996 Account.” 31 A presentation of the 2016 actuarial valuation of the hybrid plan, given in March 2017, indicates that the investment return for the DB component during each of the first two years of operation was less than half of the actuarially assumed rate of 7.5 percent, foreshadowing longer-term funding problems in the DB component.

23 | Pensions and California Public Schools
Moreover, if it exceeds 10 percent, teachers who choose the hybrid plan are responsible for the overage. Other than the potential for overage payments in the hybrid plan, there are no required employee contributions in Utah. Put another way, the DC plan is entirely noncontributory, and the hybrid plan is noncontributory conditional on the total DB pension payment not exceeding 10 percent of salary.
The choice in Washington is between a hybrid DB/DC plan and a full, traditional DB plan. Under the full DB plan, as of the 2016 actuarial valuation the teacher contribution rate was about 8 percent. Under the hybrid plan, employers pay for the DB component and teachers’ contributions go toward the DC component. Teachers have the choice about how much to contribute to the DC component, with values ranging from 5-15 percent of salary. The total employer contribution rate, which is the same for all employees regardless of whether they choose the pure-DB plan or the hybrid plan, and includes what in other plans are separated out as legacy UAAL costs from lower-numbered “tiers,” was roughly 16.2 percent of teacher salaries based on the 2016 actuarial valuation. Recall from above that Goldhaber and Grout (2016) find the majority of Washington teachers prefer the hybrid plan.
Teachers in both Utah and Washington are also covered by Social Security.
Cash Balance Plan - Example State: Kansas. Kansas implemented a cash balance (CB) plan for all new hires as of January 1, 2015. A CB plan is technically a special type of DB plan, but as noted above is best described as a mix between a DB and DC plan. The way it works is that teachers have individual accounts to which they and their employers (school districts) contribute. The individual accounts are a feature of the plan that looks like a DC plan, in the sense that at any time a teacher can see the balance of her account (there is no such construct in a DB plan, where contributions and benefits for individual teachers are not directly linked). Moreover, like in a DC plan, the account balance is ultimately used to determine the benefit at retirement.
The Kansas CB plan also shares features with traditional DB plans like CalSTRS. For example, teachers must be vested in order to “capture” district contributions to their accounts, which takes 5 years. More substantively, the CB plan offers a guaranteed rate of return. In Kansas the guaranteed rate is 4 percent annually (and can be higher in a given year if the plan portfolio has high returns). At retirement, teachers receive a lifetime annuity based on the CB account balance, mimicking the payout structure of a DB plan. Teachers who reach full retirement can also elect to receive a portion of the benefit as a lump sum (up to 30 percent).
Kansas teachers contribute 6 percent of salary to their accounts. School districts make contributions too, with the level of contribution depending on years of service. For teachers with fewer than five years of service school districts contribute 3 percent of salary annually. The employer contribution rises with years of service, maxing out at 6 percent of salary annually for teachers with 24 or more years of service.
To summarize, the Kansas CB plan is like a DC plan in the sense that teachers have individual accounts and the balances of these accounts directly determine benefits in

24 | Getting Down to Facts II
retirement. It is like a DB plan in that there are vesting and retirement-timing rules, benefits are annuitized, and teachers’ accounts come with a guaranteed rate of return.
Structurally, like with traditional DB plans, there is nothing inherent to the CB structure that prevents the accumulation of debt. For example, a CB plan with a guaranteed rate of return of 7 percent – i.e., the current CalSTRS assumed return – would not be expected to meet this return and it would require subsidies, which could be funded by debt. Interestingly though, CB plans in practice tend to be funded more responsibly (Munnell, Aubry, and Cafarelli, 2014c). A potential explanation is that it is more difficult to skip required contributions and overstate the return on assets, due to the “individual account” structure that makes it so that funding shortfalls must be addressed contemporaneously.
Kansas teachers are also enrolled in Social Security.
Social Security - Example States: Many. The addition of Social Security coverage also merits consideration as part of a reform package in California. Teachers in 34 states are enrolled in Social Security along with the state retirement plan (National Council on Teacher Quality, 2015). States with Social Security coverage include most of the above-discussed “reform” states, as well as many states that continue to offer traditional, final-average-salary DB plans.
States where teachers are dually enrolled in Social Security tend to have less costly and less generous retirement plans. This is intuitive: in these states, the total retirement benefit for a teacher comes from a combination of the state plan and Social Security. Teachers and their employers also contribute to both systems during work.
Teachers covered by CalSTRS are not enrolled in Social Security at present. This stems from a decision that was made in the 1950s. Federal law would allow California teachers to opt back into Social Security as a group, if desired. Adding Social Security coverage for California teachers would diversify their retirement income portfolios and lessen the burden on the state of providing retirement benefits. Social Security benefits are also mobile across states and a broad range of employers, unlike CalSTRS benefits, which only cover work in California public schools. A disadvantage of Social Security enrollment is the uncertainty that comes with Social Security’s own fiscal problems, for which the resolution is unclear (and beyond the scope of this report).
Supplementary Topics
CalPERS
Given the focus of this report on schools we have elected to primarily discuss CalSTRS, which specifically covers certified public school teachers. However, many school employees – classified employees – receive retirement benefits through the California Public Employees'

25 | Pensions and California Public Schools
Retirement System (CalPERS).32 On average across California school districts as of 2013-14, CalPERS contribution costs were about 50 percent of CalSTRS contribution costs.33 So, while CalPERS is clearly less important than CalSTRS in determining school districts’ total costs for employee pensions, its impact is non-negligible.
CalPERS is also a traditional, final-average-salary DB pension plan, just like CalSTRS. The funding structure is the same – contributions are collected from school employees and on their behalf from their employers in order to pay for benefits later. Actuarial calculations are used to determine how much needs to be collected contemporaneously to pay for promised benefits in the future. The funding situation with CalPERS is not qualitatively different from that of CalSTRS. Namely, the plan has a substantial UAAL and contribution rates have been rising rapidly. Currently the CalPERS employer contribution rate is 15.53 percent of salary, up from just under 11 percent as of 2012. The contribution rate is expected to rise further over the next decade. Nation (2017) estimates that even if CalPERS makes its assumed rate of return on assets each year, by 2027 the employer contribution rate will exceed 25 percent of salary for each covered employee.34
Because of the similarity between CalPERS and CalSTRS in terms of the general benefit structure and fiscal condition, a review of CalPERS and its funding issues would closely mirror our review of CalSTRS. The exact numbers would differ, but the substance is the same. Rather than repeat ourselves, we simply note that the CalSTRS funding problems described in this report are compounded for school districts by analogous problems with CalPERS. Because the fiscal problems in both plans are similar, as is the benefit structure, the rationale for reforming CalPERS is the same as for CalSTRS.
Retiree Health Benefits
We also briefly touch on retiree health benefits, which are conceptually related to pension benefits but funded and administered quite differently.
Retiree health benefit costs present another important fiscal challenge for California school districts. Like pension benefits, promised retiree health benefits have not been properly funded. A recent report released by the Legislative Analyst’s Office (LAO, 2017) indicates that California school districts collectively have $24 billion in unfunded retiree health benefit costs. The unfunded liability reflects the fact that very few California districts fully pre-fund retiree health benefits and a substantial fraction of benefits are funded entirely on a pay-as-you-go basis. Los Angeles Unified School District, the largest district in the state by far, is noted as a particularly problematic case in the LAO report.
32 CalPERS additionally covers a broader group of public employees in California. There is a special “schools pool” within CalPERS for non-teaching public school employees. 33 Based on analysis provided by The Education Trust–West. 34 The current assumed rate of return on assets in CalPERS is 7.375 percent, which will be reduced to 7.0 percent, like in CalSTRS, by 2019-20.

26 | Getting Down to Facts II
The large unfunded liabilities tied up in districts’ retiree health plans will have the same implications as the pension UAALs discussed above for CalSTRS and CalPERS. At some point they will need to be paid, and at that time districts will need to set aside resources to pay them. The 2017 LAO report highlights the lack of a funding plan for retiree health benefits in most districts. Until this is resolved, the unfunded liabilities will continue to grow.
There are important differences in how retiree health benefits and pension benefits are funded and administered across the state. These differences translate to more and different potential policy solutions to address the funding issues associated with retiree health. The most important difference by far is that health benefits are determined by individual district policies, whereas CalSTRS and CalPERS pension benefits are determined by state policy. Therefore, unlike with pensions, districts have discretion over retiree health benefits in terms of benefit generosity and funding. In the current fiscal climate, the discretion districts have over retiree health benefits puts these benefits at greater risk of cuts in the face of mandated increases in pension costs.
Another implication of the lack of centralization of retiree health benefits is that reform efforts in response to funding problems will need to occur on a district-by-district basis. On the one hand, this suggests changes may be easier to implement since they will involve narrower populations (i.e., individual districts rather than the whole state). On the other hand, while pension reform at scale may be more difficult, if it happens it can change the outlook for the entire state instantaneously. No such option is available for retiree health benefits given their de-centralized nature.
The CalSTRS Knowledge Base Among Public Education Stakeholders
An obvious question to ask after reading our report up to this point is the following: how did the funding situation with CalSTRS become so dire? Why weren’t education advocates proactively engaged with CalSTRS to prevent the current crisis before its onset? Although we do not have clear answers to these questions, one hypothesis is that stakeholders in California schools were not well enough informed to meaningfully engage with CalSTRS. While it is not certain that education stakeholders would have acted more proactively even if they had better information, it is nonetheless a pre-condition for engagement that sufficient information is available to recognize a problem on the horizon.35 In this section we provide brief evidence on the limited knowledge base of education stakeholders with regard to CalSTRS.
First, we put a very basic question about CalSTRS on a survey developed by the Getting Down to Facts research team and administered to school principals in California. The question first gives respondents the level of the CalSTRS ARC as of the 2015 Actuarial Valuation Report (31.15 percent of salary) and then asks them to indicate how much they agree with the
35 There are political reasons to think that education stakeholders may not have prevented the current crisis even with access to better information (Glaeser and Ponzetto, 2014; Koedel, Ni and Podgursky, 2013). That said, while the ultimate effect of better information is uncertain, in order to act at all basic knowledge of CalSTRS financing is a prerequisite.

27 | Pensions and California Public Schools
following statement: “This cost information is common knowledge among school principals.”36 Note that no normative information is solicited – the question simply asks how well principals think their colleagues understand this piece of information about CalSTRS.
The results from the survey are reported in Figure 6. The median answer is “somewhat disagree” – i.e., the median respondent does not think her colleagues know the level of the CalSTRS ARC – and less than 20 percent of principals agree or strongly agree with the statement. There are two reasons we believe this provides compelling evidence of a lack of basic knowledge about CalSTRS funding, at least among the constituent group of school principals who were surveyed. First, among pieces of information about CalSTRS funding, the ARC is the most basic. If principals do not know the simple level of the ARC, the more sophisticated understanding of CalSTRS finances required to meaningfully engage with the system about funding seems far off. Second, the survey was conducted in late 2017 and early 2018. This is well into the post-Assembly Bill 1469 era, in which there is presumably heightened awareness about pension issues. It is reasonable to expect the knowledge base was more limited a decade earlier at a time when policy changes would have been possible to prevent, or at least soften, the consequences of the current crisis.
Figure 6. Distribution of Principal Answers to a Survey Question Asking if the Level of the CalSTRS ARC is Common Knowledge among their Colleagues.
Notes: The exact text of the survey question is: “Based on the June 2015 CalSTRS’ Actuarial Valuation Report, the cost of pension coverage for each CalSTRS member is 31.15 percent of salary annually. Teachers, districts, and the state all contribute to the pension fund to cover this per-worker cost. To what extent do you agree or disagree with the following statement: This cost information is common knowledge among school principals.” The survey of principals was administered by the RAND Corporation to the state-representative California segment of the
36 The exact text of the question is: “Based on the June 2015 CalSTRS’ Actuarial Valuation Report, the cost of pension coverage for each CalSTRS member is 31.15 percent of salary annually. Teachers, districts, and the state all contribute to the pension fund to cover this per-worker cost. To what extent do you agree or disagree with the following statement: This cost information is common knowledge among school principals.”
0
0.05
0.1
0.15
0.2
0.25
StronglyDisagree
Disagree SomewhatDisagree
SomewhatAgree
Agree StronglyAgree

28 | Getting Down to Facts II
American School Leader Panel on behalf of the Getting Down to Facts II project. The figure uses unweighted survey data, but applying the survey weights yields a very similar distribution. The survey response rate was 30.7 percent.
The second piece of evidence comes from the charter sector. Unlike traditional public schools, public charter schools in California are in the unique position of being able to choose whether to participate in CalSTRS when they open. But once they opt in, it is very costly to undo. All else equal, a benefit to charter schools of opting into CalSTRS is that it makes it easier for them to recruit teachers with experience in traditional public schools (i.e., with CalSTRS service credit). But opting in also puts a charter school in the same risk pool as any other school with respect to addressing the CalSTRS unfunded liability.
We can infer something about how well education stakeholders understand CalSTRS by observing the opt-in rate of charter schools over time. A forward-looking charter operator, prior to Assembly Bill 1469 but with full information about the fiscal health of the plan and its true cost (or even simply the plan-reported ARC), would recognize the risk of opting in given that the opt-in decision is essentially irreversible. The operator would understand that the true cost of the plan is not accurately reflected in the pre-2014 contribution rates. By precedent in other states, the operator would recognize that rates would need to rise. Unless the operator expected school districts to be ultimately unaccountable for the true costs of the plan (e.g., an operator might expect the state to cover the cost), it would anticipate something along the lines of Assembly Bill 1469 coming to pass.
In this “full information” scenario, the actual implementation of Assembly Bill 1469 should not sharply affect the behavior of charter operators. However, research by Podgursky, Pendergrass and Hesla (2018) implies that this is not the case. These authors document charter school opt-in rates into CalSTRS over time from 1996-2015. They find that for nearly 20 years leading up to 2014, the charter opt-in rate was consistently around 90 percent. In 2015, coinciding with the beginning of rate increases legislated by Assembly Bill 1469 and the corresponding heightened awareness of CalSTRS’ poor financial condition, the opt-in rate fell to 80 percent, and in 2016 it fell further to 60 percent. The sharp decline in the charter opt-in rate coinciding with Assembly Bill 1469 is prima facie evidence of a general lack of understanding of pension finances by education stakeholders.
Conclusion
Statutory contribution rates to the California State Teachers’ Retirement System (CalSTRS) are in the midst of a historic increase. The total rate increase legislated by Assembly Bill 1469, shared by teachers, school districts, and the State of California, is nearly 100%, rising from 18.3 percentage points of teacher salaries in 2014 to 35.3 percentage points by 2021. Current actuarial projections indicate that this still will not be enough, and as a result the state of California is expected to experience substantial additional increases beyond those legislated by the bill. The primary reason the rate increases are needed is to pay down pension debt. As of the 2017 CalSTRS’ Actuarial Valuation Report, the plan had an unfunded liability of just over $107 billion.

29 | Pensions and California Public Schools
The higher CalSTRS contribution rates are not a short-term aberration – they are the new normal. CalSTRS’ actuaries project that the higher rates will be necessary through 2046. Moreover, if their assumptions remain too optimistic, as argued by financial economists and has been the case thus far, the horizon will continue to be extended.
Our focus on CalSTRS is motivated by our interest in pension policy as it relates to California schools – there is no bigger pension cost item for schools and districts than CalSTRS. That said, California schools also employ many individuals covered by CalPERS, which is the plan for non-certified public school staff and is also facing funding challenges. In addition to CalSTRS costs; rising CalPERS costs (Nation, 2017), along with largely unfunded retiree health benefit costs (LAO, 2017), are making it increasingly difficult for school districts to provide the resources necessary for a high-quality education. Even more concerning is that costs have been rising thus far within the context of relatively strong macroeconomic conditions. When an economic downturn occurs the new, much higher costs will present an even greater challenge.
Our report discusses policy options to improve the fiscal condition of CalSTRS. Within the current benefit structure, some combination of even higher contribution rates and reduced benefits would be required in order to halt the growth of unfunded liabilities. Like many states, California has made moves on both margins in recent years, but even bigger changes are necessary for long-term sustainability. The other option is to make modifications to the underlying benefit structure. We provide examples of such changes to other state plans that California could consider in developing its own policy response.

30 | Getting Down to Facts II
References
Anzia, S.F. (2017). Pensions in the trenches: Are rising city pension costs crowding out public services? Unpublished manuscript.
Backes, B., Goldhaber, D., Grout, C., Koedel, C., Ni, S., Podgursky, M. & Xiang, P.B. (2016). Benefit or burden? On the intergenerational inequity of teacher pension plans. Educational Researcher, 45(6): 367-377.
Biggs, A. (2011). An options pricing method for calculating the market price of public sector pension liabilities. Public Budgeting and Finance, 31(3), 94–118.
Boivie, I. (2017). Revisiting the Three Rs of Teacher Retirement Systems: Recruitment, Retention, and Retirement. Issue Brief. Washington DC: National Institute on Retirement Security.
Chingos, M. W., & West, M. R. (2015). Which teachers choose a defined contribution pension plan? Evidence from the Florida retirement system. Education Finance and Policy, 10(2), 193–222.
Cooper, J. (2017). Cases Could Open Door to Pension Cuts for California Workers. Associated Press (12.28.2017). Retrieved by the authors on 01.29.2017 at: https://www.usnews.com/news/best-states/california/articles/2017-12-28/cases-could-open-door-to-pension-cuts-for-california-workers
Costrell, R.M. & McGee, J. (forthcoming). Cross-Subsidization of Teacher Pension Costs: The Case of California. Education Finance and Policy.
Costrell, R.M. & Podgursky, M.J. (2009). Peaks, cliffs and valleys: The peculiar incentives in teacher retirement systems and their consequences for school staffing. Education Finance and Policy 4(2), 175-211.
Furgeson, J., Strauss, R.P., & Vogt, W.B. (2006). The effects of defined benefit pension incentives and working conditions on teacher retirement decisions. Education Finance and Policy 1(3), 316-348.
Fitzpatrick, M. (2015). How much do public school teachers value their pension benefits? American Economic Journal: Economic Policy, 7(4), 165–188.
Fitzpatrick, M. & Lovenheim, M. (2014). Early retirement incentives and student achievement. American Economic Journal: Economic Policy 6(3), 120-154.
Glaeser, E. L., & Ponzetto, G. (2014). Shrouded costs of government: The political economy of state and local public pensions. Journal of Public Economics, 116, 89–105.
Goldhaber, D., & Grout, C. (2016). Which plan to choose? The determinants of pension system choice for public school teachers. Journal of Pension Economics and Finance, 15(1), 30–54.
Harris, D.N. & Adams, S.J. (2007). Understanding the level and causes of teacher turnover: A comparison with other professions. Economics of Education Review 26(4), 325-337.
Kan, L. & Aldeman, C. (2014). Uncovered: Social Security, Retirement Uncertainty, and 1 Million Teachers. Bellwether Education Partners.
Kan, L., Fuchs, D., & Aldeman, C. (2016). Pennies on the Dollar: How Illinois Shortchanges Its Teachers’ Retirement. Policy Report. Washington DC: Bellwether Education Partners.
Kiewiet, D.R. (2010). The Day after tomorrow: The politics of public employee retirement benefits. The California Journal of Politics and Policy, 2(3).
Kim, D., Koedel, C., & Xiang, P.B. (2017). The trade-off between pension costs and salary expenditures in the public sector. Unpublished manuscript.
Koedel, C., Ni, S., & Podgursky, M. (2013). The school administrator payoff from teacher pensions. Education Next, 13(4), 8–13.

31 | Pensions and California Public Schools
Koedel, C., Ni, S., & Podgursky, M. (2014). Who benefits from pension enhancements? Education Finance and Policy, 9(2), 165–192.
Koedel, C. & Podgursky, M. (2016). Teacher pensions. In Handbook of the Economics of Education (eds. Eric A. Hanushek, Stephen Machin and Ludger Woessmann) Volume 5: 281-304. Amsterdam: Elsevier Science.
Koedel, C., Podgursky, M., and Shi, S. (2013). Teacher Pension Systems, the Composition of the Teaching Workforce, and Teacher Quality. Journal of Policy Analysis and Management 32(3): 574-596.
Legislative Analyst’s Office. (2017). Update on School District Retiree Health Benefits (09.25.2017). Accessed by the authors on 11.29.2017 at http://www.lao.ca.gov/Publications/Report/3704.
McGee, J. & Winters, M. (2014). Better Pay, Fairer Pensions II: Modeling Preferences Between Defined-Benefit Teacher Compensation Plans. Civic Report No. 90. New York, NY: Manhattan Institute.
McGee, J. & Winters, M. (2013). Better Pay, Fairer Pensions: Reforming Teacher Compensation. Civic Report No. 79. New York, NY: Manhattan Institute.
Munnell, A.H., Aubry, J. & Cafarelli, M. (2014a). COLA Cuts in State/Local Pensions. Policy Report No. 38. Boston, MA: Center for Retirement Research at Boston College.
Munnell, A.H., Aubry, J. & Cafarelli, M. (2014b). An Update on Pension Obligation Bonds. Policy Report No. 40. Boston, MA: Center for Retirement Research at Boston College.
Munnell, A.H., Aubry, J. & Cafarelli, M. (2014c). Defined Contribution Plans in the Public Sector: An Update. Policy Report No. 47. Boston, MA: Center for Retirement Research at Boston College.
Munnell, A.H., Aubry, J. & Cafarelli, M. (2015). How Did State/Local Plans Become Underfunded? Policy Report No. 42. Boston, MA: Center for Retirement Research at Boston College.
Nation, J. (2017). Pension Math: Public Pension Spending and Service Crowd-Out in California, 2003-2030. Policy Report. Palo Alto, CA: Stanford Institute for Economic Policy Research.
National Council on Teacher Quality. (2015). Doing the Math on Teacher Pensions: How to Protect Teachers and Taxpayers. Policy Report. Washington, DC: National Council on Teacher Quality.
Novy-Marx, R., & Rauh, J. (2009). The liabilities and risks of state-sponsored pension plans. Journal of Economic Perspectives, 23(4), 191–210.
Novy-Marx, R., & Rauh, J. (2011). Public pension promises: How big are they and what are they worth? Journal of Finance, 66(4), 1207–1245.
Podgursky, M., Pendergrass, S.A., & Hesla, K. (2018). Pensions Under Pressure: Charter Innovation in Teacher Retirement Benefits. Education Next 18(2), 68-75.
Rhee, N. & Fornia, W.B. (2016). Are California Teachers Better off with a Pension or a 401(k)? UC Berkeley Center for Labor Research and Education.
Smith, J.S. & West, J.E. (2014). Reduced retirement benefits: Should I stay or should I go? Working Paper. Department of Economics, Baylor University.
Wiatrowski, W.J. (2012). The last private industry pension plans: A visual essay. Monthly Labor Review (December).

32 | Getting Down to Facts II
Appendix
Figure A1. Expansion of Figure 1 to Include Variable Employee, District & State Contribution Rates as Projected by the 2017 CalSTRS’ Actuarial Valuation Report.
Sources: CalSTRS’ Actuarial Valuation Reports and Assembly Bill 1469. Notes: Projections are as legislated by Assembly Bill 1469, like in Figure 1, but this figure also shows additional projections for the variable employee, district and state rates as of the 2017 CalSTRS’ Actuarial Valuation Report. Note that the average employee contribution depends on the proportion of CalSTRS members in each tier of the plan, who are scheduled to pay different rates under Assembly Bill 1469. The average member contribution rate declines over time as more tier-2 members enter, but tier-2 members are also subject to rate increases if the normal cost rises, which happened during the more recent actuarial valuation. Our estimates for the employee contribution rate in this figure are based on rough projections of member demographics from CalSTRS’ Actuarial Valuation Reports through 2021 (like in Figure 1), and then extrapolated linearly thereafter. We also assume no further increases in normal cost.
Brief Explanation of Figure A1
Figure A1 expands on Figure 1 in the main report by including projected employee, state and district variable contributions as of the 2017 CalSTRS’ Actuarial Valuation Report. The variable contributions are facilitated by provisions in Assembly Bill 1469 that give flexibility to the rates depending on the fiscal condition of CalSTRS. Each variable contribution rate is
0.00%
5.00%
10.00%
15.00%
20.00%
25.00%
30.00%
35.00%
40.00%
45.00%
2006
2007
2008
2009
2010
2011
2012
2013
2014
2015
2016
2017
2018
2019
2020
2021
2022
2023
2024
State Variable
State
Employer
Employee

33 | Pensions and California Public Schools
responsive to a different aspect of plan funding, which is why the state and employee rates can increase while at the same time as the district rate declines.37
The state variable rate is separated out in the figure because it is projected to change by the most. The maximum allowable annual increase in the state rate is 0.50 percentage points of teacher salaries per year. Figure A1 shows that this maximum increase is currently projected to be required for seven consecutive years, beginning with fiscal year 2017-18 (labeled as 2018 in the graph) and continuing through 2023-24. If these projections hold, by 2024 the total state rate will plateau at 9.8 percentage points of teacher salaries. Also note that the district variable rate shows a small decline in the 2021-22 school year, which is the year after the scheduled increases specified by Assembly Bill 1469 are completed. The employee rate will increase by one percentage point of salaries for “2% at 62” plan members beginning with the 2018-19 school year because of an increase in normal cost, although this change is difficult to see in the picture because there is no change to the rate for “2% at 60” teachers and we report the average across all employees.38
Figure A1 is expanded to cover the timeframe of the full set of expected variable rate changes (where the state increases have the longest time horizon), but we caution that there is much uncertainty with expanding out this far because actuarial projections can change. This is why we relegate this figure to the appendix. As a proximal example of the uncertainty in actuarial calculations, as recently as 2014 when Assembly Bill 1469 was passed, the variable state contributions shown in Figure A1 were not projected to be necessary, and as of the 2016 Actuarial Valuation Report, it was reported that the maximum state increase would be required for fifteen consecutive years instead of seven.
37 The state and district variable rates are legislated to be responsive to different parts of the unfunded liability of the plan. The employee rate is responsive to changes to normal cost only, and only tier-2 members (2% at 62) can be affected. 38 Prior to the rate increase for “2% at 62” employees, their employee contribution was just over one percentage point below that of “2% at 60” employees. The rate increase owing to the jump in normal costs for these teachers is such that their contributions moving forward will essentially match the contributions of “2% at 60” teachers. They are also subject to additional rate increases if normal cost continues to increase.